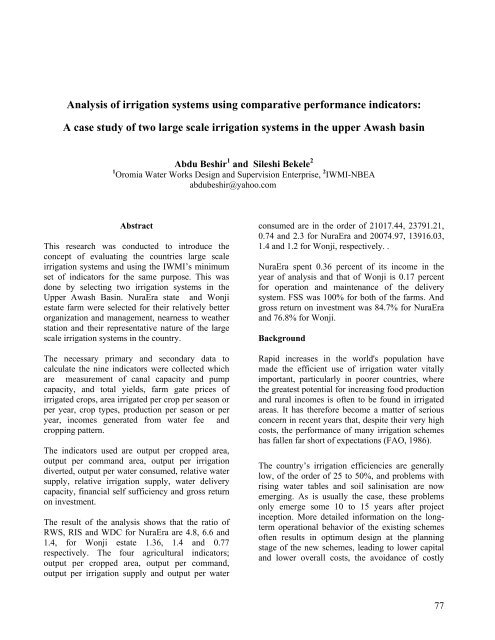
Analysis of irrigation systems using comparative performance ...
Analysis of irrigation systems using comparative performance ...
Analysis of irrigation systems using comparative performance ...

Create successful ePaper yourself
Turn your PDF publications into a flip-book with our unique Google optimized e-Paper software.
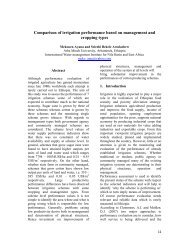
<strong>Analysis</strong> <strong>of</strong> <strong>irrigation</strong> <strong>systems</strong> <strong>using</strong> <strong>comparative</strong> <strong>performance</strong> indicators:<br />
A case study <strong>of</strong> two large scale <strong>irrigation</strong> <strong>systems</strong> in the upper Awash basin<br />
Abdu Beshir 1 and Sileshi Bekele 2<br />
1 Oromia Water Works Design and Supervision Enterprise, 2 IWMI-NBEA<br />
abdubeshir@yahoo.com<br />
Abstract<br />
This research was conducted to introduce the<br />
concept <strong>of</strong> evaluating the countries large scale<br />
<strong>irrigation</strong> <strong>systems</strong> and <strong>using</strong> the IWMI’s minimum<br />
set <strong>of</strong> indicators for the same purpose. This was<br />
done by selecting two <strong>irrigation</strong> <strong>systems</strong> in the<br />
Upper Awash Basin. NuraEra state and Wonji<br />
estate farm were selected for their relatively better<br />
organization and management, nearness to weather<br />
station and their representative nature <strong>of</strong> the large<br />
scale <strong>irrigation</strong> <strong>systems</strong> in the country.<br />
The necessary primary and secondary data to<br />
calculate the nine indicators were collected which<br />
are measurement <strong>of</strong> canal capacity and pump<br />
capacity, and total yields, farm gate prices <strong>of</strong><br />
irrigated crops, area irrigated per crop per season or<br />
per year, crop types, production per season or per<br />
year, incomes generated from water fee and<br />
cropping pattern.<br />
The indicators used are output per cropped area,<br />
output per command area, output per <strong>irrigation</strong><br />
diverted, output per water consumed, relative water<br />
supply, relative <strong>irrigation</strong> supply, water delivery<br />
capacity, financial self sufficiency and gross return<br />
on investment.<br />
The result <strong>of</strong> the analysis shows that the ratio <strong>of</strong><br />
RWS, RIS and WDC for NuraEra are 4.8, 6.6 and<br />
1.4, for Wonji estate 1.36, 1.4 and 0.77<br />
respectively. The four agricultural indicators;<br />
output per cropped area, output per command,<br />
output per <strong>irrigation</strong> supply and output per water<br />
consumed are in the order <strong>of</strong> 21017.44, 23791.21,<br />
0.74 and 2.3 for NuraEra and 20074.97, 13916.03,<br />
1.4 and 1.2 for Wonji, respectively. .<br />
NuraEra spent 0.36 percent <strong>of</strong> its income in the<br />
year <strong>of</strong> analysis and that <strong>of</strong> Wonji is 0.17 percent<br />
for operation and maintenance <strong>of</strong> the delivery<br />
system. FSS was 100% for both <strong>of</strong> the farms. And<br />
gross return on investment was 84.7% for NuraEra<br />
and 76.8% for Wonji.<br />
Background<br />
Rapid increases in the world's population have<br />
made the efficient use <strong>of</strong> <strong>irrigation</strong> water vitally<br />
important, particularly in poorer countries, where<br />
the greatest potential for increasing food production<br />
and rural incomes is <strong>of</strong>ten to be found in irrigated<br />
areas. It has therefore become a matter <strong>of</strong> serious<br />
concern in recent years that, despite their very high<br />
costs, the <strong>performance</strong> <strong>of</strong> many <strong>irrigation</strong> schemes<br />
has fallen far short <strong>of</strong> expectations (FAO, 1986).<br />
The country’s <strong>irrigation</strong> efficiencies are generally<br />
low, <strong>of</strong> the order <strong>of</strong> 25 to 50%, and problems with<br />
rising water tables and soil salinisation are now<br />
emerging. As is usually the case, these problems<br />
only emerge some 10 to 15 years after project<br />
inception. More detailed information on the longterm<br />
operational behavior <strong>of</strong> the existing schemes<br />
<strong>of</strong>ten results in optimum design at the planning<br />
stage <strong>of</strong> the new schemes, leading to lower capital<br />
and lower overall costs, the avoidance <strong>of</strong> costly<br />
77
emedial works in the long term and achieving<br />
maximum returns on water (Woodro<strong>of</strong>e, 1993).<br />
State run farms, which include large-scale <strong>irrigation</strong><br />
<strong>systems</strong>, were reiterated as major components <strong>of</strong><br />
efforts to develop the country’s agricultural sector,<br />
notably in the Awash Valley. However,<br />
productivity <strong>of</strong> these top–down managed <strong>systems</strong><br />
over the decades has been disappointing—the farms<br />
have been beset by a number <strong>of</strong> environmental,<br />
technical and socio-economic constraints. The large<br />
scale <strong>systems</strong> in the Awash basin and elsewhere<br />
suffer from water management practices that have<br />
resulted in rising ground water tables and secondary<br />
soil salinisation where large tracts <strong>of</strong> land have<br />
gone out <strong>of</strong> production (EARO 2001; Paulos).<br />
Even if evaluating the existing <strong>irrigation</strong> <strong>systems</strong> is<br />
an old phenomenon in the other parts <strong>of</strong> the world;<br />
it has not been tried in Ethiopian large-scale farms.<br />
Hence, this study attempts to introduce the concept<br />
<strong>of</strong> <strong>comparative</strong> <strong>performance</strong> indicators as a tool to<br />
evaluate the <strong>performance</strong> <strong>of</strong> large-scale <strong>irrigation</strong>s<br />
in the Upper Awash valley.<br />
The indicators<br />
consumption, where total consumption includes<br />
water depletion from the hydrologic cycle through<br />
process consumption (ET), other evaporative losses<br />
(from fallow land, free water surfaces, weeds,<br />
trees), flows to sinks (saline groundwater and seas),<br />
and through pollution.<br />
We are interested in the measurement <strong>of</strong> production<br />
from irrigated agriculture that can be used to<br />
compare across <strong>systems</strong>. If only one crop is<br />
considered, production could be compared in terms<br />
<strong>of</strong> mass. The difficulty arises when comparing<br />
different crops, say wheat and tomato, as 1 kg <strong>of</strong><br />
tomato is not readily comparable to 1 kg <strong>of</strong> wheat.<br />
When only one <strong>irrigation</strong> system is considered, or<br />
<strong>irrigation</strong> <strong>systems</strong> in a region where prices are<br />
similar, production can be measured as net value <strong>of</strong><br />
production and gross value <strong>of</strong> production <strong>using</strong><br />
local values.<br />
Output per cropped area<br />
Pr oduction<br />
=<br />
Irrigated Cropped area<br />
(1)<br />
Nine indicators are developed related to the<br />
<strong>irrigation</strong> and irrigated agricultural system. The<br />
main output considered is crop production, while<br />
the major inputs are water, land, and finances.<br />
Indicators <strong>of</strong> Irrigated Agricultural Output<br />
The four basic <strong>comparative</strong> <strong>performance</strong> indicators<br />
relate output to unit land and water. These<br />
“external” indicators provide the basis for<br />
comparison <strong>of</strong> irrigated agriculture <strong>performance</strong>.<br />
Where water is a constraining resource, output per<br />
unit water may be more important, whereas if land<br />
is a constraint relative to water, output per unit land<br />
may be more important.<br />
Output per unit <strong>of</strong> <strong>irrigation</strong> water supplied and<br />
output per unit <strong>of</strong> water consumed are derived from<br />
a general water accounting framework (Molden et<br />
al, 1998). The water consumed in equation 4 on<br />
page 21 is the volume <strong>of</strong> process consumption, in<br />
this case evapotranspiration. It is important to<br />
distinguish this from another important water<br />
accounting indicator—output per unit total<br />
Output per unit command area<br />
Pr oduction<br />
=<br />
Command area<br />
Output per <strong>irrigation</strong> supply<br />
Pr oduction<br />
=<br />
Diverted irrigtion supply<br />
Output per unit water consumed<br />
Pr oduction<br />
=<br />
Volume <strong>of</strong> water consumed by ET<br />
Where,<br />
(2)<br />
(3)<br />
(4)<br />
78
Production is the output <strong>of</strong> the irrigated area<br />
in terms <strong>of</strong> gross or net value <strong>of</strong> production<br />
measured at local or world prices,<br />
Irrigated cropped area is the sum <strong>of</strong> the areas<br />
under crops during the time period <strong>of</strong><br />
analysis,<br />
Command area is the nominal or design area<br />
to be irrigated,<br />
Diverted <strong>irrigation</strong> supply is the volume <strong>of</strong><br />
surface <strong>irrigation</strong> water diverted to the<br />
command area, plus net removals from<br />
groundwater, and<br />
Volume <strong>of</strong> water consumed by ET is the<br />
actual evapotranspiration <strong>of</strong> crops.<br />
Five additional indicators were identified in this<br />
minimum set for <strong>comparative</strong> purposes. These are<br />
meant to characterize the individual system with<br />
respect to water supply and finances.<br />
Relative water supply and relative <strong>irrigation</strong> supply<br />
are used as the basic water supply indicators:<br />
Re lative water supply<br />
Total water supply<br />
=<br />
Crop demand<br />
Where:<br />
Total water supply<br />
(5)<br />
(6)<br />
= Surface diversions plus net ground water draft<br />
plus rainfall.<br />
Crop demand<br />
= Potential crop ET, or the ET under well-watered<br />
conditions.<br />
Irrigation supply<br />
= only the surface diversions and net groundwater<br />
draft for <strong>irrigation</strong>.<br />
Irrigation demand<br />
= the crop ET less effective rainfall.<br />
Relative <strong>irrigation</strong> supply is the inverse <strong>of</strong> the<br />
<strong>irrigation</strong> efficiency Molden et al (1998). The term<br />
relative <strong>irrigation</strong> supply was presented to be<br />
consistent with the term relative water supply, and<br />
to avoid any conf<strong>using</strong> value judgments inherent in<br />
the word efficiency.<br />
Both RWS and RIS relate supply to demand, and<br />
give some indication as the condition <strong>of</strong> water<br />
abundance or scarcity, and how tightly supply and<br />
demand are matched. Care must be taken in the<br />
interpretation <strong>of</strong> results: an irrigated area upstream<br />
in a river basin may divert much water to give<br />
adequate supply and ease management, with the<br />
excess water providing a source for downstream<br />
users. In such circumstances, a higher RWS in the<br />
upstream project may indicate appropriate use <strong>of</strong><br />
available water, and a lower RWS would actually<br />
be less desirable. Likewise, a value <strong>of</strong> 0.8 may not<br />
represent a problem; rather it may provide an<br />
indication that farmers are practicing deficit<br />
<strong>irrigation</strong> with a short water supply to maximize<br />
returns on water.<br />
Water delivery capacity(%)<br />
Canal capacity to deliver water at system head<br />
=<br />
Peak consumptive demand<br />
Where:<br />
Capacity to deliver water at the system head<br />
(7)<br />
= the present discharge capacity <strong>of</strong> the canal at the<br />
system head, and<br />
Peak consumptive demand<br />
= the peak crop <strong>irrigation</strong> requirements for a<br />
monthly period expressed as a flow rate at the<br />
head <strong>of</strong> the <strong>irrigation</strong> system.<br />
Water delivery capacity is meant to give an<br />
indication <strong>of</strong> the degree to which <strong>irrigation</strong><br />
infrastructure is constraining cropping intensities by<br />
79
comparing the canal conveyance capacity to peak<br />
consumptive demands. Again, a lower or higher<br />
value may not be better, but needs to be interpreted<br />
in the context <strong>of</strong> the <strong>irrigation</strong> system, and in<br />
conjunction with the other indicators.<br />
Financial Indicators<br />
The two financial indicators are:<br />
Gross return on Investment (%)<br />
production<br />
=<br />
Cost <strong>of</strong> <strong>irrigation</strong> structure<br />
Where,<br />
(8)<br />
Financial self sufficiency<br />
Revenue<br />
from <strong>irrigation</strong> service fee<br />
=<br />
Total O & M expenditure<br />
(9)<br />
Cost <strong>of</strong> <strong>irrigation</strong> infrastructure considers the<br />
cost <strong>of</strong> the <strong>irrigation</strong> water delivery system<br />
referenced to the same year as the SGVP,<br />
Revenue from <strong>irrigation</strong>, is the revenue<br />
generated, either from fees, or other locally<br />
generated income, and<br />
Total O & M expenditure is the amount<br />
expended locally through operation and<br />
management<br />
Description <strong>of</strong> the Study Area<br />
The mean annual rainfall <strong>of</strong> Awash Basin varies<br />
from about 1600mm at Ankober; in the highlands<br />
north east <strong>of</strong> Addis Ababa top 160mm at Asayta on<br />
the northern limit <strong>of</strong> basin. Addis Ababa receives<br />
90% <strong>of</strong> its annual rainfall during the rainy period<br />
March to September. At Dubti the same over all<br />
proportion is received during the two rainy periods,<br />
distributed 30% and 60% respectively. The mean<br />
annual rainfall over the entire western catchment<br />
is 850mm and over the head waters <strong>of</strong> Awash, as<br />
gauged at Melka Hombole it is 1216mm.The<br />
annual and monthly rainfall are characterized by<br />
high variability (Halcrow, 1989).<br />
Wenji Estate farm<br />
The estate was constructed by HVA in the early<br />
1960s .It comprises 5925ha <strong>of</strong> sugar and is operated<br />
by the ESC (Halcrow, 1989). The estate is located<br />
in the central east part <strong>of</strong> the main Ethiopia rift<br />
system, 107 km southeast <strong>of</strong> Addis Ababa. It is<br />
found between 8 0 30’ to 8 0 35’N and 39 0 20’E grid<br />
and at an altitude <strong>of</strong> 1540 m a.s.l Average<br />
Maximum and Minimum temperature are 27.6 0 C<br />
and 15.30C, respectively. The surrounding<br />
topography is steep on all sides north and east being<br />
bound by river awash the west and the south by the<br />
border drain which protects the estate from the run<br />
<strong>of</strong>f and sedimentation from those steep slopes<br />
(Mukherji, 2000). Irrigation supplies are provided<br />
by continuous electrical pumping from the Awash<br />
into a settling basin at the head <strong>of</strong> the main canal.<br />
Night storage reservoirs cover a surface area <strong>of</strong><br />
60ha (Halcrow, 1989).<br />
80
Nuraera state farm<br />
The farm is found in the eastern showa<br />
administration zone. It is divided in three sub<br />
farms. From the total land owned by the farm<br />
which is 3,277ha, 3,069 ha is covered by crops the<br />
remaining 208 ha by infrastructures. The farm has<br />
been developed on an adhoc basis over several<br />
years and water abstraction is by gravity.<br />
Canals and <strong>irrigation</strong> layouts have not been<br />
formally designed so that their capacities are not<br />
listed.<br />
Water use efficiencies would appear to be in the<br />
range <strong>of</strong> 20%-30% (Halcrow, 1989). Irrigation <strong>of</strong><br />
citrus is generally by small basin around tree bases.<br />
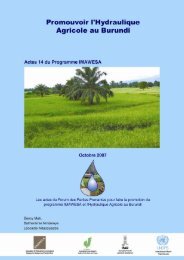
Main gate on the main canal at Nuraera<br />
Diversion Weir at Nuraera<br />
Abstraction is measured by staff gauges in the main<br />
canal from gravity <strong>of</strong>ftakes <strong>irrigation</strong> is generally<br />
undertaken 24 hours a day. Wastage <strong>of</strong> water is<br />
inevitable but it appears that little, if any flow is<br />
returned to Awash. The northern end <strong>of</strong> the canal<br />
used to outfall into Lake Beseka. This has been<br />
stopped by a cut-<strong>of</strong>f-drain which is partly<br />
81
constructed with the objective <strong>of</strong> leading the flows<br />
back to Awash.<br />
Methodology<br />
After reconnaissance survey and consulting the<br />
<strong>of</strong>ficials <strong>of</strong> the Upper Awash agro-industry<br />
enterprise, one farm was selected among the three<br />
farms <strong>of</strong> the enterprise. NuraEra farm was selected<br />
for its nearness to the weather station, relatively<br />
better organization and management and<br />
availability <strong>of</strong> secondary data. Moreover the other<br />
two farms are medium scale farms.<br />
decided to measure the discharge at various gage<br />
heights and take the average discharge to calculate<br />
the amount diverted for each season.<br />
Maintaining the abandoned BOC took much <strong>of</strong> our<br />
time before engaging in the measurement.<br />
The other farm selected for its attributes <strong>of</strong> nearness<br />
to Addis Ababa and wheather station and the<br />
availability <strong>of</strong> data were Wonji sugare estate.<br />
Secondary data collections were started in February<br />
2005 in collaboration with the farm <strong>of</strong>ficials.<br />
Primary data collection<br />
The job <strong>of</strong> primary data collection which is<br />
measurement <strong>of</strong> canal capacity and pump capacity<br />
was started in April 2005 in collaboration with the<br />
department <strong>of</strong> hydrology in the Ministry <strong>of</strong> Water<br />
Resources.<br />
The upper Awash Water Administration center<br />
installed a BOC on the main canal at around 200m<br />
from the diversion weir for the purpose <strong>of</strong> updating<br />
its rating curve for the reason that the flow<br />
characteristics changes due to high rate <strong>of</strong><br />
sedimentation resulting in change <strong>of</strong> canal<br />
morphology.<br />
Preparation for work at Nuraera<br />
In the case <strong>of</strong> Wonji showa estate farm, the pumps<br />
in the main pump station are more than 40 years<br />
old. Their Design capacity went on reducing<br />
through these years. Therefore the current capacity<br />
<strong>of</strong> each pump should be measured. That can be<br />
done either by measuring the water depth over the<br />
cippoleti weir and use the formula to calculate the<br />
discharge or by measuring the flow on site.<br />
The measurement was taken at 0.2*the depth <strong>of</strong><br />
water over the weir crest measured from the surface<br />
<strong>of</strong> the water and the width <strong>of</strong> the crest was divided<br />
by 0.2m interval( see appendix B).<br />
The plotted rating curve was used to find out the<br />
total water diverted <strong>using</strong> the daily records <strong>of</strong> the<br />
gauge height taken by main gate operator who is an<br />
employee <strong>of</strong> the center.<br />
But due to the shortage <strong>of</strong> material and manpower,<br />
the center has been <strong>using</strong><br />
the old rating curve for the purpose <strong>of</strong> knowing the<br />
total amount <strong>of</strong> water diverted. Due to the high<br />
siltation rate and the changing nature <strong>of</strong> the<br />
hydraulic condition in the main canal , it will be<br />
hard to get a reliable data <strong>using</strong> a rating curve<br />
plotted two years ago. For this reason it was<br />
82
good number <strong>of</strong> years record <strong>of</strong> the production and<br />
prices<br />
<strong>of</strong> crops. For instance, wonji have a 50 year data <strong>of</strong><br />
production.<br />
The only problem in the case <strong>of</strong> the needed<br />
secondary data was the record <strong>of</strong> money spent for<br />
operation and maintenance <strong>of</strong> the <strong>irrigation</strong> <strong>systems</strong><br />
Results and Discussion<br />
Measuring discharge from cippoleti weir at Wonji<br />
Secondary data collection<br />
The Secondary data included total yields, farm gate<br />
prices <strong>of</strong> irrigated crops, area irrigated per crop per<br />
season or per year, crop types, production per<br />
season or per year, incomes generated from water<br />
fee and cropping pattern.<br />
Climatic data <strong>of</strong> Wonji farm were collected from<br />
the nearby station at wonji while that <strong>of</strong> NuraEra<br />
were collected from the head <strong>of</strong>fice <strong>of</strong> Ethiopian<br />
National Meteorological Agency in Addis Ababa.<br />
Since both farms have a planning and program<br />
department run by skilled manpower, they kept<br />
Nuraera<br />
After measuring the discharge at various working<br />
gauge heights, the average discharge was estimated<br />
to be 3.1 m 3 /s. And this discharge was used to<br />
estimate the amount <strong>of</strong> water diverted in the year<br />
2003/04.<br />
Based on the collected data <strong>of</strong> planting and harvest<br />
<strong>of</strong> each crop for the year <strong>of</strong> analysis, the<br />
agricultural practice <strong>of</strong> the farm is divided into two<br />
seasons. The first season <strong>of</strong> cropping goes from<br />
January to July, the amount diverted in these<br />
months was.<br />
Season A 3.1*212*24*60*60 = 56,782,080 m 3<br />
Season B 3.1*153*24*60*60 = 40,979,520 m 3<br />
Total amount <strong>of</strong> water diverted for the year 2003/04<br />
= 97,761,600m 3<br />
Total output <strong>of</strong> NuraEra farm for the year 2003/04<br />
Crop<br />
Production in Unit price in Total Output<br />
Area (ha)<br />
Qt.<br />
birr/Qt. in Birr<br />
Orange 772 254,580.6 112 28,497,753.48<br />
Manderine 181 35,844 87.50 3,133,836.55<br />
Guava 55 1,307.2 32.20 42,038.27<br />
grape Vine 11.18 538.3 400 215,304.00<br />
Mango 40.35 9,395 117.75 1,106,250.65<br />
Tomato 224.53 35,115 40.60 1,424,968.73<br />
Onion 54.12 4,790 136.50 653,925.34<br />
Green chilies 5.30 182. 134.60 24,494.91<br />
Cabbage 0.55 23.6 40.60 959.31<br />
Carrot 0.30 22.2 40 889.64<br />
Beet root 0.45 36 40.00 1,444.40<br />
Beans(local) 2.00 1,463.8 61 89,323.52<br />
83
Bobbybeans(export) 149.50 6,221.8 1,383 8,604,265.49<br />
Okra 0.60 3 172 532.92<br />
Maize 350.00 17,002.6 120.20 2,043,368.86<br />
Pop corn 58.60 385.7 483.30 186,411.74<br />
Cotton 735.00 18,061.8 1,494.30 26,989,446.28<br />
Total 2,640.5 384,973 73,015,214<br />
As it is clearly seen the farm used wider cropping pattern. And based on the planting and harvesting dates <strong>of</strong><br />
each crop, the whole year is divided into two seasons and their CWR and <strong>irrigation</strong> requirement was calculated<br />
<strong>using</strong> CROPWAT 4.2. The result is as shown below:<br />
CWR and IR <strong>of</strong> each crop<br />
SEASON A<br />
SEASON B<br />
Crop water Net <strong>irrigation</strong><br />
Crop water Net <strong>irrigation</strong><br />
Crop Area(ha) requirement<br />
(mm/season)<br />
requirement<br />
(mm/season)<br />
Area(ha) requirement<br />
(mm/season)<br />
requirement<br />
(mm/season)<br />
Tomato 220.5 760.68 613.44 224.53 712.92 446.05<br />
Onion 47 490.79 389.56 54.12 489.76 243.78<br />
Vegetables 8.15 515.89 413.39 7 493.45 242.48<br />
Beans 150 427 330.55 151 424.51 178.94<br />
Maize 408.6 684.37 495.58 408.6 537.53 416.32<br />
Cotton 735 999.13 634.58<br />
Citrus* 1008 1334.31 873.46<br />
Mango* 40.35 1973.22 1512.36<br />
Grape<br />
wine*<br />
11.18 1057.43 596.58<br />
Total 2628.78 845.25<br />
* Perennial crops<br />
To calculate the first four indicators grose<br />
production was taken instead <strong>of</strong> SGVP because <strong>of</strong><br />
the fact that there is no price difference in the two<br />
<strong>irrigation</strong> <strong>systems</strong> and no common crop is grown in<br />
both the farms. Sugarcane is not grown in NuraEra<br />
farm but it is the only crop in Wonji sugar estate.<br />
1.<br />
=<br />
Output per croppedarea<br />
production<br />
Irrigatedcroppedarea<br />
= 73,015,214.08 / (2628.78+ 845.25)<br />
= 73,015,214.08 / 3474.03<br />
= 21,017.44 birr/ha<br />
2. Output per unit command<br />
production<br />
=<br />
Command cropped area<br />
Out put per unit command area<br />
= 73,015,214.08 / 3,069<br />
= 23,791.21 birr/ha<br />
3. Output per <strong>irrigation</strong> sup ply<br />
production<br />
=<br />
Diverted <strong>irrigation</strong> sup ply<br />
= 73,015,214.08 /97,761,600<br />
= 0.75 birr/m 3<br />
area<br />
84
Then, the net crop water requirement and the net<br />
<strong>irrigation</strong> requirement (IR) are computed for each<br />
irrigated crop and for each growing season (option<br />
2 in CROPWAT main menu). The crop coefficients<br />
provided with CROPWAT program are used (input:<br />
planting dates and growth length in days). The<br />
outcomes were:<br />
The total net crop demand for season A is (refer<br />
table 4.2):<br />
CWR tomato * (area tomato / area total ) + CWR onion *<br />
(area onion / area total ) + etc. =<br />
760.68* (220.5/2628.78) + 490.79* (47/2628.78) +<br />
515.89* (8.15/2628.78) + etc.<br />
= 1,030.70 mm/season<br />
In the same way, the total net <strong>irrigation</strong><br />
requirements are computed. The efficiency used is<br />
40%. This percent was set basing the estimation <strong>of</strong><br />
Halcrow(1989) and allowing for the improvements<br />
<strong>of</strong> the years between the year <strong>of</strong> study and the year<br />
<strong>of</strong><br />
analysis.<br />
SEASON NCWR* NIR**<br />
A(Jan-July) 1,030.70 693.7<br />
B(Aug.-Jan) 560.5 369.3<br />
Total 1591.2 1063<br />
*Net crop water requirement<br />
**Net <strong>irrigation</strong> requirement<br />
Output per unit water consumed<br />
Pr oduction<br />
=<br />
Volume <strong>of</strong> water consumed by<br />
ET<br />
Where Volume <strong>of</strong> water consumed by ET is the actual evapotranspiration <strong>of</strong> crops.<br />
= 73,015,214.08 / (1,030.70*2628.78+ 560.5*845.25)*10 -3 *10 4<br />
= 2.3 birr/m3<br />
5. Relative water supply<br />
= (Irrigation derived + total precipitation) / CWR<br />
Diverted <strong>irrigation</strong> in mm<br />
Season A = 56,782,080 / 2628.78*10 = 2160 mm<br />
Season B = 41,247,360 /845.25*10 = 4879.9<br />
Total = 7039.9<br />
RWS = (7039.9+566.9)/1591.2<br />
= 4.8<br />
6. Relative <strong>irrigation</strong> supply<br />
= Irrigation applied / <strong>irrigation</strong> requirements<br />
= 7039.92/1063<br />
= 6.6<br />
The scheme <strong>irrigation</strong> requirement was calculated with CROPWAT (option 4 in main menu) <strong>using</strong> the climate<br />
data, cropping pattern, planting dates, and area.<br />
For 2003/04, the scheme <strong>irrigation</strong> requirements were:<br />
85
Scheme <strong>irrigation</strong> requirement <strong>of</strong> NuraEra farm<br />
Jan. Feb. March April May June Jul. Aug. Sept. Oct. Nov. Dec.<br />
IR in<br />
l/s/ha 0.37 0.39 0.69 1.13 1.2 0.77 0.75 0.73 1.47 1.4 1.17 0.59<br />
Peak <strong>irrigation</strong> requirements occur in September, 1.47 l/s/ha.<br />
Peak demand is 1.47 * cropped area for that month =1.47 *2639.78= 3880.48 l/s.<br />
As explained above the canal capacity was measured <strong>using</strong> bank operated cable. The result was 5.4 m 3 /s<br />
7. Water delivery capacity: 5,400 lit. / 3,880.48 lit. = 1.4 or 140%<br />
8. Gross return on investment =Production / cost <strong>of</strong><br />
<strong>irrigation</strong> infrastructure<br />
The cost <strong>of</strong> the distribution system can either be<br />
estimated from original costs, or estimated by <strong>using</strong><br />
present costs <strong>of</strong> similar types <strong>of</strong> infrastructure<br />
development. Since it was not possible to get the<br />
design documents <strong>of</strong> the two projects, the document<br />
<strong>of</strong> other projects with more or less similar structural<br />
condition were taken. After studying the documents<br />
<strong>of</strong> the similar <strong>irrigation</strong> projects in Awash Basin,<br />
the Angelele and Bolhamo design document were<br />
used for their better similarity and nearness to<br />
NuraEra and Wonji to estimate the cost <strong>of</strong><br />
distribution system per hectare.<br />
All the delivery system <strong>of</strong> the NuraEra farm is earth<br />
canals .Therefore the cost <strong>of</strong> earth canals per<br />
hectare in these documents is found to be 1497.9 4<br />
birr<br />
The formula to calculate the present worth is.<br />
Pr esent Net Worth(<br />
PNW )<br />
= ( Initial cos t / ha)<br />
× (1 + r)<br />
n<br />
Where: r is interest rate, which is taken from the<br />
design document <strong>of</strong> Angelele Irrigation Project<br />
and n is years from construction time.<br />
PNW = 1497.94(1+0.1) 30<br />
= 26138.2birr/ha<br />
The cost <strong>of</strong> delivery system <strong>of</strong> NuraEra<br />
= 26138.2 birr/ha *3069 ha<br />
= 80,218,006 birr<br />
Therefore Gross return on investment<br />
= 73,015,214.08 birr/ 80,218,006birr<br />
= 91%<br />
9. Financial self-sufficiency<br />
= Revenue from <strong>irrigation</strong>/Total O&M expenditure<br />
Where, Revenue from <strong>irrigation</strong>, is the revenue<br />
generated, either from fees, or other locally<br />
generated income, and Total O&M expenditures are<br />
the amount expended locally through O&M plus<br />
outside subsidies from the government.<br />
Even if the Upper Awash Water Administration<br />
Center collects water fee at the rate <strong>of</strong> 3 birr per<br />
1000 m 3 <strong>of</strong> water, no money was spent for<br />
maintenance and operation in the year <strong>of</strong> analysis.<br />
Rather the farms perform some clearing and<br />
maintenance work whenever they feel necessary.<br />
Thus the income generated from the farms doesn’t<br />
go to the purpose <strong>of</strong> operation and maintenance.<br />
However the intent <strong>of</strong> IWMI indicator number 9 is<br />
to see how much <strong>of</strong> the cost <strong>of</strong> operation and<br />
maintenance work is generated locally. In this<br />
context we can say that both farms are 100 % self<br />
sufficient. It was learnt from the farm record that<br />
the amount <strong>of</strong> money spent for operation and<br />
maintenance <strong>of</strong> the delivery <strong>systems</strong> for the year<br />
2003/’04 was 260,317.23 birr.<br />
= 260,317.23/260,317.23<br />
= 100%<br />
In this respect, the management <strong>of</strong> these two farms<br />
is a little bit different to that <strong>of</strong> normally practiced.<br />
In order to have additional information for<br />
evaluating that part which is related to maintenance<br />
and operation, one more indicator is developed and<br />
86
added in this paper. This indicator atleast will give<br />
us additional insight on the relative focus given to<br />
the delivery <strong>systems</strong>.<br />
Percent<br />
Total<br />
=<br />
allocated to O & M<br />
O & M exp enditure<br />
Pr oduction<br />
= 260,317.23/ 73,015,214.08<br />
= 0.36 %<br />
Wonji Sugar estate<br />
The only crop grown in this farm is sugarcane. The<br />
kind <strong>of</strong> <strong>irrigation</strong> practiced at Wonji may be termed<br />
‘’blocked end furrow <strong>irrigation</strong> system’’. Water<br />
Production and area <strong>of</strong> Wonji estate for the year 2003/04<br />
Command Irrigated<br />
Farm gate<br />
area(ha) area(ha) Production(qtl.) price(birr/qtl.) Income (birr)<br />
5,929 4,110 7,446,581 11.08 82,508,117.5<br />
applied each furrow is cut <strong>of</strong>f as it reaches the end<br />
<strong>of</strong> the furrow ,which is blocked ,and ponds up<br />
within the furrow .The furrow length for the part <strong>of</strong><br />
the field (anjir ) depends on the gradient available<br />
and three lengths 32m,48m,and 64m are being used<br />
currently. The advantages <strong>of</strong> this system are that<br />
there is no run <strong>of</strong>f and the entire water applied to<br />
the field incorporated into the soil. As such, in<br />
addition to the infiltration characteristics <strong>of</strong> the soil,<br />
the size <strong>of</strong> the inflow stream and the gradient <strong>of</strong> the<br />
furrow become important variables to control the<br />
rate <strong>of</strong> advance <strong>of</strong> water front to the end <strong>of</strong> the<br />
furrow, which determines the cut<strong>of</strong>f time for the<br />
inflow. (Mukherij, 2000)<br />
The main pump station at Wonji has a total <strong>of</strong> eight<br />
pumps with a design discharge <strong>of</strong><br />
(6*750+2*500)5500 lps .According to Mukherji the<br />
two vertical shaft pumps are working with overall<br />
efficiency <strong>of</strong> 68% and the other six horizontal shaft<br />
pumps with an efficiency <strong>of</strong> 50% <strong>of</strong> their designed<br />
capacity.<br />
Crop water Irrigation<br />
requirement<br />
mm/year<br />
requirement<br />
mm/year<br />
1,667.1 1,054.33<br />
The result <strong>of</strong> our measurement almost agrees with<br />
that <strong>of</strong> Mukherji, The current capacity <strong>of</strong> the two<br />
vertical shaft pumps is 240.3 lps and the horizontal<br />
shaft pumps are with a capacity <strong>of</strong> 488 lps.<br />
Therefore the maximum discharge that can be<br />
pumped for <strong>irrigation</strong> purpose is 3,165.34 lps<br />
allowing 10% for factory use.<br />
1. Out put per cropped area<br />
= Out put / irrigated cropped area<br />
= 82,508,117.48 / 4,110<br />
= 20,074.97 birr/ha<br />
2. Out put per command area<br />
= Out put / command area<br />
= 82,508,117.48/5929<br />
= 13,916.03 birr/ha<br />
3. Out put per <strong>irrigation</strong> supply<br />
= Out put / <strong>irrigation</strong> diverted<br />
= 82,508,117.48/75320000<br />
= 1.1 birr/m 3<br />
4. Out put per unit water consumed<br />
=out put/Volume water consumed by ET<br />
Volume <strong>of</strong> water consumed by ET<br />
= 1667.1*4110*10 m 3<br />
= 68,517,810 m 3<br />
Out put per unit <strong>of</strong> water consumed<br />
= 82,508,117.48/68,517,810<br />
= 1.2 birr/m 3<br />
5. Relative water supply<br />
= (Irrigation derived + total precipitation) /<br />
CWR<br />
= (1,466.08 + 817.3)/1667.1<br />
87
= 1.36<br />
6. Relative <strong>irrigation</strong> supply<br />
= Irrigation applied/ <strong>irrigation</strong> requirements<br />
= 1,466.08/1,054.33<br />
= 1.4<br />
For 2003/04, the scheme <strong>irrigation</strong> requirements were:<br />
IR in Jan. Feb. March April May June July Aug. Sept. Oct. Nov. Dec.<br />
l/s/ha 0.4 0.58 0.94 0.93 0.87 0.65 0.31 0.23 0.73 1 0.94 0.85<br />
Peak <strong>irrigation</strong> requirements occur in October, 1 l/s/ha.<br />
Peak demand is 1 * cropped area for that month = 1 * 4110 = 4110 l/s.<br />
7. Water delivery capacity: 3,165.34/4110<br />
= 0.77 or 77%<br />
8. The same procedure was applied to Wonji to<br />
calculate gross return on investment except that<br />
<strong>irrigation</strong> structure costs are included since all<br />
the necessary structures are found in Wonji<br />
estate farm. The present initial cost per hectare<br />
<strong>of</strong> the delivery system is found to be 26137.5<br />
birr.<br />
Gross return on investment<br />
= 82,508,117.5 birr / 235,727,927.5 birr<br />
= 35%<br />
Comparative analysis <strong>of</strong> the two <strong>irrigation</strong> <strong>systems</strong><br />
The four basic <strong>comparative</strong> <strong>performance</strong> indicators<br />
relate output to unit land and water. These<br />
“external” indicators provide the basis for<br />
comparison <strong>of</strong> irrigated agriculture <strong>performance</strong><br />
(Molden, 1998).<br />
The values <strong>of</strong> the four indicators for the respective<br />
farms are as tabulated below.<br />
9. Percent allocated to O&M<br />
= 139,330.46/ 82,508,117.48<br />
= 0.17%<br />
summary <strong>of</strong> the four indicators<br />
Site<br />
Output per<br />
Output per<br />
Output per<br />
Output per water<br />
cropped area,<br />
<strong>irrigation</strong><br />
command, birr/ha<br />
birr /ha<br />
supply,birr/m 3 consumed birr/m 3<br />
NuraEra 21,017.44 23,791.21 0.75 2.3<br />
Wonji 20,074.97 13,916.03 1.4 1.2<br />
25,000.00<br />
20,000.00<br />
15,000.00<br />
10,000.00<br />
output per cropped and command area<br />
Output per <strong>irrigation</strong> supply and water consummed<br />
2.5<br />
2<br />
1.5<br />
1<br />
5,000.00<br />
0.5<br />
0.00<br />
Output per cropped<br />
area, birr/ha<br />
Output per command,<br />
0<br />
birr/ha NuraEra Wonji<br />
Output per <strong>irrigation</strong><br />
supply,birr/m3<br />
Output per w ater<br />
consumed birr/m3<br />
88
As clearly seen in the first table and chart, NuraEra<br />
is higher in output per cropped area and output per<br />
command. This is attributed to the high value and<br />
export crops grown in the farm and also the higher<br />
cropping intensity.<br />
In the case <strong>of</strong> output per <strong>irrigation</strong> supply Wonji<br />
has the higher value (1.4) implying that Wonji is<br />
better in effective utilization <strong>of</strong> water. But as the<br />
indicators are <strong>comparative</strong> we can’t say that Wonji<br />
achieved the required <strong>performance</strong>. NuraEra show a<br />
generous supply <strong>of</strong> water. Using the rainfall in a<br />
better way than that <strong>of</strong> the NuraEra contributes for<br />
this higher value <strong>of</strong> output per <strong>irrigation</strong> in Wonji.<br />
In other words NuraEra is better in land<br />
productivity and Wonji show better <strong>performance</strong> in<br />
water productivity.<br />
Result <strong>of</strong> RWS and RIS<br />
Relative water Relative <strong>irrigation</strong> Water<br />
Site supply supply<br />
capacity<br />
NuraEra 4.8 6.6 1.4<br />
Wonji 1.36 1.4 0.77<br />
delivery<br />
7<br />
6<br />
5<br />
4<br />
3<br />
2<br />
1<br />
0<br />
RWS,RIS and WDC<br />
RWS RIS WDC<br />
NuraEra<br />
Wonji<br />
89
Higher values <strong>of</strong> RWS and RIS indicate a<br />
more generous supply <strong>of</strong> water (Molden,<br />
1998). In our case, NuraEra show this fact<br />
which means productivity to land is more<br />
important. In the Wonji farm we have more<br />
constrained supply <strong>of</strong> water so that<br />
productivity per unit <strong>of</strong> water is more<br />
important. These two values can be minimized<br />
by adjusting the release <strong>of</strong> water from storage<br />
or diversion with the available rainfall.<br />
The lower values <strong>of</strong> RWS and RIS <strong>of</strong> Wonji<br />
estate farm is not mainly the result <strong>of</strong> good<br />
management rather the decreasing capacity <strong>of</strong><br />
the pumps limiting the supply. As the result <strong>of</strong><br />
the measurement conducted showed, 35 and 52<br />
percent decrease in the capacity <strong>of</strong> the<br />
horizontal and vertical pumps has been<br />
witnessed respectively. With this capacity,<br />
the pumps are not enough to satisfy peak<br />
<strong>irrigation</strong> demand. This will get worse unless a<br />
major rehabilitation work <strong>of</strong> the pump house is<br />
done.<br />
On the other hand high value <strong>of</strong> RWS and RIS<br />
is <strong>of</strong> for NuraEra. This result was expected by<br />
the researcher at the end <strong>of</strong> reconnaissance<br />
survey <strong>of</strong> the area because <strong>of</strong> two main<br />
reasons: one the 34 km main canal is not well<br />
maintained and the absence <strong>of</strong> the necessary<br />
<strong>irrigation</strong> structures in the line <strong>of</strong> the canal<br />
expose the system for very low efficiency,<br />
second the farmers around the state farm steal<br />
water from the main canal. Consequently much<br />
water is lost through its way to the field.<br />
Unauthorized diversion from the main canal<br />
at NuraEra<br />
A high value <strong>of</strong> financial self-sufficiency does<br />
not automatically indicate a sustainable system<br />
as the O&M expenditures might be too low to<br />
meet the actual maintenance needs (Molden,<br />
1998).Thus the high value <strong>of</strong> FSS <strong>of</strong> the two<br />
farms doesn’t show that the expenditure<br />
satisfies the operation and maintenance needs.<br />
Rather as Molden et al. (1989) explained<br />
financial self-sufficiency tells us what percent<br />
<strong>of</strong> expenditures on O&M is generated locally.<br />
If government subsidizes O&M heavily,<br />
financial self-sufficient would be low, whereas<br />
if local farmers through their fees pay for most<br />
<strong>of</strong> the O&M expenditures, financial selfsufficiency<br />
would be high.<br />
NuraEra and Wonji are 100% self sufficient<br />
meaning all the expenditures for operation and<br />
maintenance generated locally from the<br />
income <strong>of</strong> these two farms. Interms <strong>of</strong> percent<br />
allocated to operation and maintenance NurEra<br />
is better. This is because <strong>of</strong> high silt deposit<br />
rate in the delivery <strong>systems</strong>. With out frequent<br />
clearing <strong>of</strong> the system normal operation <strong>of</strong> the<br />
farm can’t be carried out.<br />
GRI <strong>of</strong> the NuraEra and Wonji are 84.7% and<br />
76.8% respectively. NuraEra show a higher<br />
rate <strong>of</strong> return. This is mainly because <strong>of</strong> the<br />
lower investment cost and higher productivity<br />
<strong>of</strong> the farm. But it is hard to say that this<br />
system is better than that <strong>of</strong> Wonji because it is<br />
taking much money for its maintenance.<br />
Consequently its sustainability is in big<br />
question <strong>of</strong> such <strong>systems</strong><br />
Conclusion<br />
The higher values in RWS and RIS combined<br />
with the lower ratio <strong>of</strong> output per water<br />
consumed in NuraEra shows that the<br />
availability <strong>of</strong> water is not a problem. In<br />
addition it can be inferred that the issue <strong>of</strong><br />
water management is in jeopardy. The main<br />
reasons for this problem are the meager<br />
attention given by the farm for <strong>irrigation</strong> water<br />
management, the low water rate and the effect<br />
<strong>of</strong> unregistered users.<br />
As to Wonji farm the low value <strong>of</strong> WDC can<br />
be early warning indicator. This is meant to<br />
say that the pump capacity is deteriorating and<br />
is not in position to satisfy peak <strong>irrigation</strong><br />
demand. This problem may manifest itself by<br />
reducing production in near future. This has<br />
big implication on the production <strong>of</strong> sugar.<br />
WDC <strong>of</strong> NuraEra farm seems in a better<br />
position but the increasing sedimentation and<br />
the absence <strong>of</strong> silt excluders put its<br />
sustainability in question.<br />
90
Both farms spent less than one percent <strong>of</strong> their<br />
income for operation and maintenance <strong>of</strong><br />
delivery <strong>systems</strong>. This by itself shows the very<br />
low attention given to the <strong>irrigation</strong> <strong>systems</strong>.<br />
But in relative terms NuraEra was better.<br />
The rate <strong>of</strong> gross return on investment is high<br />
for both <strong>of</strong> the farms.<br />
Furthermore, as explained in the literature<br />
review part, there are varies types <strong>of</strong><br />
institutional designs <strong>of</strong> the <strong>irrigation</strong> <strong>systems</strong><br />
adopted in different part <strong>of</strong> the world. This part<br />
has not been given the proper attention in our<br />
country. As a result, the <strong>irrigation</strong> delivery<br />
<strong>systems</strong> are left unattended for many years.<br />
The case <strong>of</strong> the two <strong>irrigation</strong> <strong>systems</strong> is not an<br />
exception. The management <strong>of</strong> the farms,<br />
having their main objective on productivity,<br />
didn’t give the proper attention for their<br />
<strong>irrigation</strong> delivery <strong>systems</strong>. This can be seen<br />
by the fact that the two farms have no separate<br />
<strong>irrigation</strong> department despite being very<br />
pr<strong>of</strong>itable ones. Moreover no permanent<br />
budget is allocated for <strong>irrigation</strong> system<br />
maintenance.<br />
This research managed to show some <strong>of</strong> the<br />
problems that our large scale <strong>irrigation</strong> <strong>systems</strong><br />
are in. The lack <strong>of</strong> awareness in the farm<br />
<strong>of</strong>ficials on one side and policy problem in the<br />
other left the <strong>irrigation</strong> <strong>systems</strong> with lots <strong>of</strong><br />
problems. Water logging, deterioration <strong>of</strong><br />
canal capacity and salinity are coming faster.<br />
References<br />
Admasu, (2002). Integrated water<br />
management and land management<br />
research and capacity building priorities for<br />
Ethiopia. Proceedings <strong>of</strong><br />
MoWR/EARO/IWMI. International Water<br />
Management institute. Addis Ababa.<br />
Clarke D. 1998. CropWat for Windows: User<br />
Guide. Version 4.2. University <strong>of</strong><br />
Southampton, UK.<br />
Clyma, W., Latimon, D.L and Reddy, M.N.<br />
(1982). Irrigation water management<br />
around the world. Paper prepared for<br />
presentation at the ninth technical<br />
conference on <strong>irrigation</strong>, drainage and<br />
flood control. Jackson, Mississippi.<br />
Douglas L. V., Juan A. S. (1999). Transfer <strong>of</strong><br />
Irrigation Management Services.<br />
Guideline: Irrigation and Drainage Paper.<br />
No.58. FAO, Rome.<br />
Ethiopian Agricultural Research Organization<br />
(2001). Agricultural water management:<br />
Brief Pr<strong>of</strong>ile. (Unpublished document)<br />
Food and Agriculture Organization<br />
(1996).CROPWAT and CLIMWAT<br />
s<strong>of</strong>tware packages: Irrigation and drainage<br />
paper No 49.FAO, Rome.<br />
Food and Agriculture Organization<br />
(2002).Crops and Drops. FAO working<br />
paper, Rome.<br />
Food and Agriculture Organization (1989).<br />
Guidelines for designing and evaluating<br />
surface <strong>irrigation</strong> <strong>systems</strong>. FAO Irrigation<br />
and drainage paper no 45.Rome.<br />
Food and Agriculture (1986).Organization,<br />
operation and maintenance <strong>of</strong> <strong>irrigation</strong><br />
schemes .FAO <strong>irrigation</strong> and drainage<br />
paper 40,Rome.<br />
Food and Agriculture (1999). Modern water<br />
control and management practices in<br />
<strong>irrigation</strong>. Water report 19, Rome<br />
Food and Agriculture (1998). Crop<br />
evapotrinspiration-guidelines for<br />
computing crop water requirements. FAO<br />
<strong>irrigation</strong> and drainage paper 56,Rome.<br />
Halcrow and Partners(1989).Master plan for<br />
the development <strong>of</strong> surface water resources<br />
in the Awash basin. Government <strong>of</strong><br />
Ethiopia, Addiss Ababa.<br />
Hunt, Robert C. 1988. Size and the<br />
structure <strong>of</strong> authority in canal <strong>irrigation</strong><br />
<strong>systems</strong>. Journal <strong>of</strong> Anthropological<br />
Research 44:335–355.<br />
Majumdar,D.K.(2002).Irrigation water<br />
management .Prentice-Hall <strong>of</strong> India.New<br />
Delhi.<br />
Manz, David, H. (1992). Performance<br />
evaluation <strong>of</strong> <strong>irrigation</strong> conveyance<br />
<strong>systems</strong> <strong>using</strong> dynamic simulation models.<br />
Canada.<br />
Molden,D.J,Sakthivadivel,R,perry,C.J,andCha<br />
rlotte de Fraiture(1998). Indicators for<br />
comparing <strong>performance</strong> <strong>of</strong> irrigated<br />
Agricultural <strong>systems</strong>. Research report 20.<br />
International Water Management Institute.<br />
Sri Lanka. Mrema, G. C. (1984).<br />
Development <strong>of</strong> small-holder <strong>irrigation</strong> in<br />
Tanzania: Problems and prospects. In<br />
Proceedings <strong>of</strong> African Regional<br />
Symposium on Small Holder Irrigation, 5–<br />
7 September 1984, Harare, Zimbabwe.<br />
91
Mukherji, Jp. (2000). Rehablitation,<br />
Optimization, and expansion <strong>of</strong> Agriculture<br />
and Factory. Interim report. Vol. 1,<br />
Ethiopian Sugar Industry Sh.Co., Wonji-<br />
Shoa sugare Factory<br />
Mrray-Rust, D. H., and W. B. Snellen. (1993).<br />
Irrigation system <strong>performance</strong> assessment<br />
and diagnosis. (Jointly published by IIMI,<br />
ILRI, IHE), Colombo, Sri Lanka:<br />
International Irrigation Management<br />
Institute.<br />
Oad, R., Mcorrik, P.G, and Clyma, W.<br />
(1988).Methodologies for interdisciplinary<br />
diagnosis <strong>of</strong> <strong>irrigation</strong> <strong>systems</strong>. Project<br />
report 93.Colorado state university,<br />
Colorado.<br />
Pery,C.,J.(2001). Charging for <strong>irrigation</strong><br />
water: The issue and the options, with a<br />
case study from Iran. Research report<br />
52.International water management<br />
institute.Sri Lanka.<br />
Shanan, Leslie. (1992). Planning and<br />
management <strong>of</strong> <strong>irrigation</strong> <strong>systems</strong> in<br />
developing countries. Agricultural Water<br />
Management. The Netherlands: Elsevier.<br />
Sharma, D.N, Ramchard Oad, and Sampath,<br />
R.k.(1991).Performance measures for<br />
<strong>irrigation</strong> water delivery <strong>systems</strong>.ICID<br />
Bulletine 40:21-37.<br />
Small, L. E., and M. Svendsen (1992). A<br />
framework for assessing <strong>irrigation</strong><br />
<strong>performance</strong>. International Food Policy<br />
Research Institute Working Papers on<br />
Irrigation Performance No. 1.<br />
International Food Policy Research<br />
Institute. Washington, D. C.<br />
Withers, B.; and Vipond S. (1974). Design<br />
and practices. London: BT Batsford<br />
Limited.<br />
Woodro<strong>of</strong>e,R. (1993). Monitoring and<br />
evaluation <strong>of</strong> <strong>irrigation</strong> projects.<br />
Technical manual.Ministry <strong>of</strong> water<br />
resources. Addis Ababa<br />
WORLD BANK/UNDP (1990). A proposal<br />
for an internationally –supported program<br />
to enhance research on <strong>irrigation</strong> and<br />
drainage technology in developing<br />
countries. Irrigation and drainage volume1<br />
Yesuf, K. (2004). Assessment <strong>of</strong> small-scale<br />
<strong>irrigation</strong> <strong>using</strong> <strong>comparative</strong> <strong>performance</strong><br />
indicators on two selected schemes in<br />
upper Awash river valley. A thesis<br />
submitted to the school <strong>of</strong> graduate studies.<br />
Alemaya University.<br />
92