Analysis of irrigation systems using comparative performance ...
Analysis of irrigation systems using comparative performance ...
Analysis of irrigation systems using comparative performance ...

You also want an ePaper? Increase the reach of your titles
YUMPU automatically turns print PDFs into web optimized ePapers that Google loves.
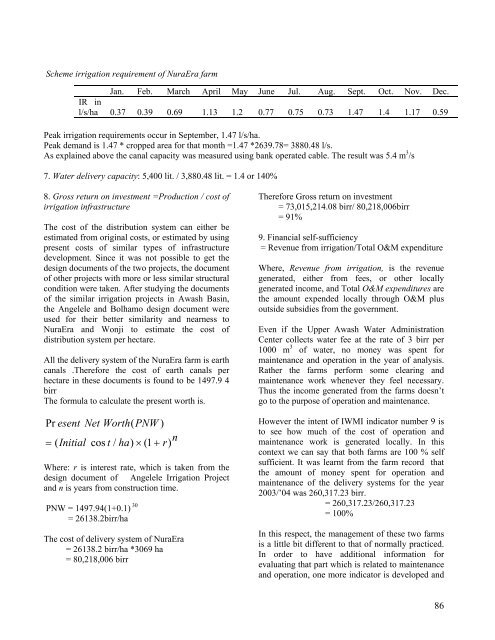
Scheme <strong>irrigation</strong> requirement <strong>of</strong> NuraEra farm<br />
Jan. Feb. March April May June Jul. Aug. Sept. Oct. Nov. Dec.<br />
IR in<br />
l/s/ha 0.37 0.39 0.69 1.13 1.2 0.77 0.75 0.73 1.47 1.4 1.17 0.59<br />
Peak <strong>irrigation</strong> requirements occur in September, 1.47 l/s/ha.<br />
Peak demand is 1.47 * cropped area for that month =1.47 *2639.78= 3880.48 l/s.<br />
As explained above the canal capacity was measured <strong>using</strong> bank operated cable. The result was 5.4 m 3 /s<br />
7. Water delivery capacity: 5,400 lit. / 3,880.48 lit. = 1.4 or 140%<br />
8. Gross return on investment =Production / cost <strong>of</strong><br />
<strong>irrigation</strong> infrastructure<br />
The cost <strong>of</strong> the distribution system can either be<br />
estimated from original costs, or estimated by <strong>using</strong><br />
present costs <strong>of</strong> similar types <strong>of</strong> infrastructure<br />
development. Since it was not possible to get the<br />
design documents <strong>of</strong> the two projects, the document<br />
<strong>of</strong> other projects with more or less similar structural<br />
condition were taken. After studying the documents<br />
<strong>of</strong> the similar <strong>irrigation</strong> projects in Awash Basin,<br />
the Angelele and Bolhamo design document were<br />
used for their better similarity and nearness to<br />
NuraEra and Wonji to estimate the cost <strong>of</strong><br />
distribution system per hectare.<br />
All the delivery system <strong>of</strong> the NuraEra farm is earth<br />
canals .Therefore the cost <strong>of</strong> earth canals per<br />
hectare in these documents is found to be 1497.9 4<br />
birr<br />
The formula to calculate the present worth is.<br />
Pr esent Net Worth(<br />
PNW )<br />
= ( Initial cos t / ha)<br />
× (1 + r)<br />
n<br />
Where: r is interest rate, which is taken from the<br />
design document <strong>of</strong> Angelele Irrigation Project<br />
and n is years from construction time.<br />
PNW = 1497.94(1+0.1) 30<br />
= 26138.2birr/ha<br />
The cost <strong>of</strong> delivery system <strong>of</strong> NuraEra<br />
= 26138.2 birr/ha *3069 ha<br />
= 80,218,006 birr<br />
Therefore Gross return on investment<br />
= 73,015,214.08 birr/ 80,218,006birr<br />
= 91%<br />
9. Financial self-sufficiency<br />
= Revenue from <strong>irrigation</strong>/Total O&M expenditure<br />
Where, Revenue from <strong>irrigation</strong>, is the revenue<br />
generated, either from fees, or other locally<br />
generated income, and Total O&M expenditures are<br />
the amount expended locally through O&M plus<br />
outside subsidies from the government.<br />
Even if the Upper Awash Water Administration<br />
Center collects water fee at the rate <strong>of</strong> 3 birr per<br />
1000 m 3 <strong>of</strong> water, no money was spent for<br />
maintenance and operation in the year <strong>of</strong> analysis.<br />
Rather the farms perform some clearing and<br />
maintenance work whenever they feel necessary.<br />
Thus the income generated from the farms doesn’t<br />
go to the purpose <strong>of</strong> operation and maintenance.<br />
However the intent <strong>of</strong> IWMI indicator number 9 is<br />
to see how much <strong>of</strong> the cost <strong>of</strong> operation and<br />
maintenance work is generated locally. In this<br />
context we can say that both farms are 100 % self<br />
sufficient. It was learnt from the farm record that<br />
the amount <strong>of</strong> money spent for operation and<br />
maintenance <strong>of</strong> the delivery <strong>systems</strong> for the year<br />
2003/’04 was 260,317.23 birr.<br />
= 260,317.23/260,317.23<br />
= 100%<br />
In this respect, the management <strong>of</strong> these two farms<br />
is a little bit different to that <strong>of</strong> normally practiced.<br />
In order to have additional information for<br />
evaluating that part which is related to maintenance<br />
and operation, one more indicator is developed and<br />
86