Analysis of irrigation systems using comparative performance ...
Analysis of irrigation systems using comparative performance ...
Analysis of irrigation systems using comparative performance ...

You also want an ePaper? Increase the reach of your titles
YUMPU automatically turns print PDFs into web optimized ePapers that Google loves.
= 1.36<br />
6. Relative <strong>irrigation</strong> supply<br />
= Irrigation applied/ <strong>irrigation</strong> requirements<br />
= 1,466.08/1,054.33<br />
= 1.4<br />
For 2003/04, the scheme <strong>irrigation</strong> requirements were:<br />
IR in Jan. Feb. March April May June July Aug. Sept. Oct. Nov. Dec.<br />
l/s/ha 0.4 0.58 0.94 0.93 0.87 0.65 0.31 0.23 0.73 1 0.94 0.85<br />
Peak <strong>irrigation</strong> requirements occur in October, 1 l/s/ha.<br />
Peak demand is 1 * cropped area for that month = 1 * 4110 = 4110 l/s.<br />
7. Water delivery capacity: 3,165.34/4110<br />
= 0.77 or 77%<br />
8. The same procedure was applied to Wonji to<br />
calculate gross return on investment except that<br />
<strong>irrigation</strong> structure costs are included since all<br />
the necessary structures are found in Wonji<br />
estate farm. The present initial cost per hectare<br />
<strong>of</strong> the delivery system is found to be 26137.5<br />
birr.<br />
Gross return on investment<br />
= 82,508,117.5 birr / 235,727,927.5 birr<br />
= 35%<br />
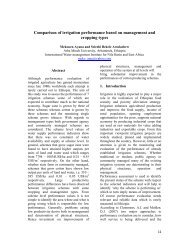
Comparative analysis <strong>of</strong> the two <strong>irrigation</strong> <strong>systems</strong><br />
The four basic <strong>comparative</strong> <strong>performance</strong> indicators<br />
relate output to unit land and water. These<br />
“external” indicators provide the basis for<br />
comparison <strong>of</strong> irrigated agriculture <strong>performance</strong><br />
(Molden, 1998).<br />
The values <strong>of</strong> the four indicators for the respective<br />
farms are as tabulated below.<br />
9. Percent allocated to O&M<br />
= 139,330.46/ 82,508,117.48<br />
= 0.17%<br />
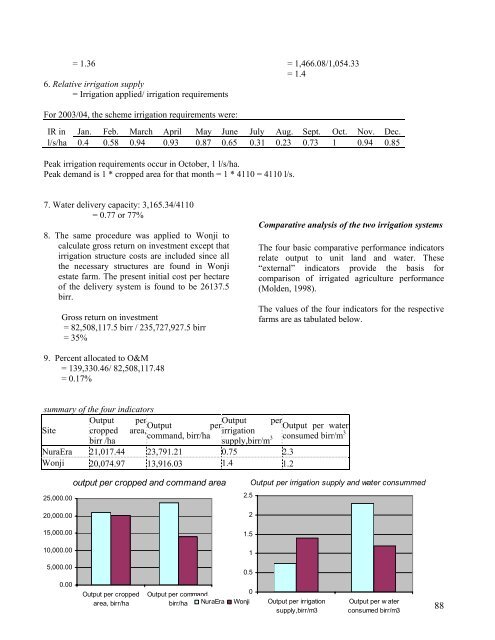
summary <strong>of</strong> the four indicators<br />
Site<br />
Output per<br />
Output per<br />
Output per<br />
Output per water<br />
cropped area,<br />
<strong>irrigation</strong><br />
command, birr/ha<br />
birr /ha<br />
supply,birr/m 3 consumed birr/m 3<br />
NuraEra 21,017.44 23,791.21 0.75 2.3<br />
Wonji 20,074.97 13,916.03 1.4 1.2<br />
25,000.00<br />
20,000.00<br />
15,000.00<br />
10,000.00<br />
output per cropped and command area<br />
Output per <strong>irrigation</strong> supply and water consummed<br />
2.5<br />
2<br />
1.5<br />
1<br />
5,000.00<br />
0.5<br />
0.00<br />
Output per cropped<br />
area, birr/ha<br />
Output per command,<br />
0<br />
birr/ha NuraEra Wonji<br />
Output per <strong>irrigation</strong><br />
supply,birr/m3<br />
Output per w ater<br />
consumed birr/m3<br />
88