Effects of Age and Hearing Loss on the ... - Rush University
Effects of Age and Hearing Loss on the ... - Rush University
Effects of Age and Hearing Loss on the ... - Rush University

You also want an ePaper? Increase the reach of your titles
YUMPU automatically turns print PDFs into web optimized ePapers that Google loves.
4 SHEFT ET AL. / EAR & HEARING, VOL. 00, NO. 00, 000–000<br />
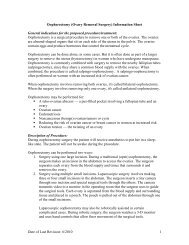
Fig. 3. Analysis <str<strong>on</strong>g>of</str<strong>on</strong>g> stochastic FM. Top panel: time wave form <str<strong>on</strong>g>of</str<strong>on</strong>g> a 5-Hz lowpass<br />
noise modulator. Middle panel: instantaneous-frequency functi<strong>on</strong> when<br />
<strong>the</strong> modulator is applied to a 1-kHz pure-t<strong>on</strong>e carrier with ΔF equal to 400<br />
Hz. Bottom panel: l<strong>on</strong>g-term amplitude spectrum <str<strong>on</strong>g>of</str<strong>on</strong>g> <strong>the</strong> modulated stimulus.<br />
The ability to discriminate stochastic FM was measured with a<br />
cued two-interval forced-choice (2IFC) adaptive procedure. Five<br />
hundred millisec<strong>on</strong>ds separated <strong>the</strong> three stimulus presentati<strong>on</strong>s<br />
<str<strong>on</strong>g>of</str<strong>on</strong>g> a trial. On each trial, a r<str<strong>on</strong>g>and</str<strong>on</strong>g>omly selected noise modulator was<br />
used as <strong>the</strong> cue modulator <str<strong>on</strong>g>of</str<strong>on</strong>g> <strong>the</strong> 1-kHz carrier. With r<str<strong>on</strong>g>and</str<strong>on</strong>g>om<br />
selecti<strong>on</strong>, <strong>on</strong>e <str<strong>on</strong>g>of</str<strong>on</strong>g> <strong>the</strong> two observati<strong>on</strong> intervals that followed <strong>the</strong><br />
cue was identical to <strong>the</strong> cue; <strong>the</strong> o<strong>the</strong>r interval was generated with<br />
a c<strong>on</strong>trasting modulator. The listener’s task was to indicate which<br />
observati<strong>on</strong> interval differed from <strong>the</strong> cue with feedback provided<br />
after each trial. Across <strong>the</strong> five c<strong>on</strong>diti<strong>on</strong>s, thresholds were<br />
estimated in terms <str<strong>on</strong>g>of</str<strong>on</strong>g> three independent variables described later.<br />
Using a two-down <strong>on</strong>e-up tracking rule that c<strong>on</strong>verged <strong>on</strong> 70.7%<br />
(Levitt 1971), threshold estimates were based <strong>on</strong> <strong>the</strong> average<br />
<str<strong>on</strong>g>of</str<strong>on</strong>g> <strong>the</strong> last eight <str<strong>on</strong>g>of</str<strong>on</strong>g> <strong>the</strong> required minimum <str<strong>on</strong>g>of</str<strong>on</strong>g> twelve tracking<br />
reversals with run length always at least 40 trials. C<strong>on</strong>cerned<br />
with clinical feasibility <str<strong>on</strong>g>of</str<strong>on</strong>g> <strong>the</strong> psychoacoustic measures, all data<br />
from each listener were collected during a single sessi<strong>on</strong> with <strong>on</strong>e<br />
threshold estimate per c<strong>on</strong>diti<strong>on</strong>. Results thus represent nei<strong>the</strong>r<br />
trained nor asymptotic performance levels. For practice, listeners<br />
initially completed <strong>the</strong> first c<strong>on</strong>diti<strong>on</strong> without scoring; <strong>the</strong>reafter,<br />
each subsequent run was scored. All scored runs began with eight<br />
practice trials. Each run took roughly 5 to 6 min.<br />
There were five FM c<strong>on</strong>diti<strong>on</strong>s with <strong>the</strong> first three using<br />
<strong>the</strong> independent-samples method <str<strong>on</strong>g>of</str<strong>on</strong>g> generating c<strong>on</strong>trasting<br />
modulators, <str<strong>on</strong>g>and</str<strong>on</strong>g> <strong>the</strong> last two using <strong>the</strong> time-reversal method.<br />
The sec<strong>on</strong>d <str<strong>on</strong>g>and</str<strong>on</strong>g> third c<strong>on</strong>diti<strong>on</strong>s used a c<strong>on</strong>tinuous four-talker<br />
speech-babble masker spoken by <strong>on</strong>e male <str<strong>on</strong>g>and</str<strong>on</strong>g> three female<br />
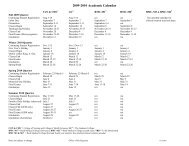
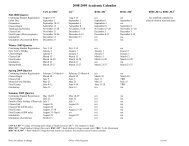
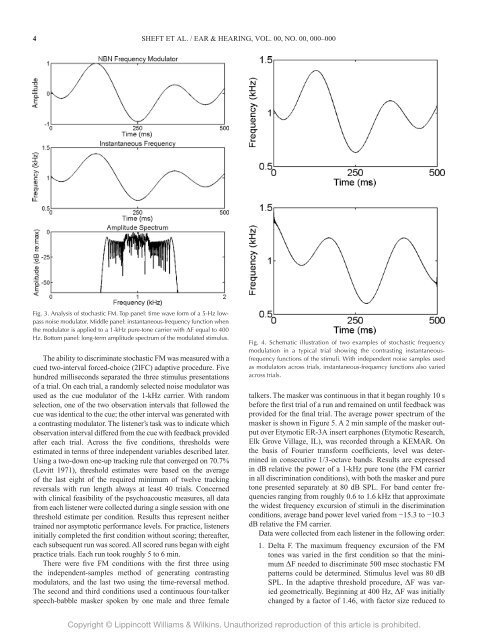
Fig. 4. Schematic illustrati<strong>on</strong> <str<strong>on</strong>g>of</str<strong>on</strong>g> two examples <str<strong>on</strong>g>of</str<strong>on</strong>g> stochastic frequency<br />
modulati<strong>on</strong> in a typical trial showing <strong>the</strong> c<strong>on</strong>trasting instantaneousfrequency<br />
functi<strong>on</strong>s <str<strong>on</strong>g>of</str<strong>on</strong>g> <strong>the</strong> stimuli. With independent noise samples used<br />
as modulators across trials, instantaneous-frequency functi<strong>on</strong>s also varied<br />
across trials.<br />
talkers. The masker was c<strong>on</strong>tinuous in that it began roughly 10 s<br />
before <strong>the</strong> first trial <str<strong>on</strong>g>of</str<strong>on</strong>g> a run <str<strong>on</strong>g>and</str<strong>on</strong>g> remained <strong>on</strong> until feedback was<br />
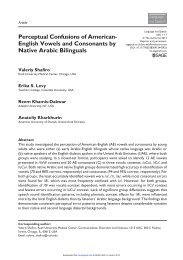
provided for <strong>the</strong> final trial. The average power spectrum <str<strong>on</strong>g>of</str<strong>on</strong>g> <strong>the</strong><br />
masker is shown in Figure 5. A 2 min sample <str<strong>on</strong>g>of</str<strong>on</strong>g> <strong>the</strong> masker output<br />
over Etymotic ER-3A insert earph<strong>on</strong>es (Etymotic Research,<br />
Elk Grove Village, IL), was recorded through a KEMAR. On<br />
<strong>the</strong> basis <str<strong>on</strong>g>of</str<strong>on</strong>g> Fourier transform coefficients, level was determined<br />
in c<strong>on</strong>secutive 1/3-octave b<str<strong>on</strong>g>and</str<strong>on</strong>g>s. Results are expressed<br />
in dB relative <strong>the</strong> power <str<strong>on</strong>g>of</str<strong>on</strong>g> a 1-kHz pure t<strong>on</strong>e (<strong>the</strong> FM carrier<br />
in all discriminati<strong>on</strong> c<strong>on</strong>diti<strong>on</strong>s), with both <strong>the</strong> masker <str<strong>on</strong>g>and</str<strong>on</strong>g> pure<br />
t<strong>on</strong>e presented separately at 80 dB SPL. For b<str<strong>on</strong>g>and</str<strong>on</strong>g> center frequencies<br />
ranging from roughly 0.6 to 1.6 kHz that approximate<br />
<strong>the</strong> widest frequency excursi<strong>on</strong> <str<strong>on</strong>g>of</str<strong>on</strong>g> stimuli in <strong>the</strong> discriminati<strong>on</strong><br />
c<strong>on</strong>diti<strong>on</strong>s, average b<str<strong>on</strong>g>and</str<strong>on</strong>g> power level varied from −15.3 to −10.3<br />
dB relative <strong>the</strong> FM carrier.<br />
Data were collected from each listener in <strong>the</strong> following order:<br />
1. Delta F. The maximum frequency excursi<strong>on</strong> <str<strong>on</strong>g>of</str<strong>on</strong>g> <strong>the</strong> FM<br />
t<strong>on</strong>es was varied in <strong>the</strong> first c<strong>on</strong>diti<strong>on</strong> so that <strong>the</strong> minimum<br />
ΔF needed to discriminate 500 msec stochastic FM<br />
patterns could be determined. Stimulus level was 80 dB<br />
SPL. In <strong>the</strong> adaptive threshold procedure, ΔF was varied<br />
geometrically. Beginning at 400 Hz, ΔF was initially<br />
changed by a factor <str<strong>on</strong>g>of</str<strong>on</strong>g> 1.46, with factor size reduced to<br />
Copyright © Lippincott Williams & Wilkins. Unauthorized reproducti<strong>on</strong> <str<strong>on</strong>g>of</str<strong>on</strong>g> this article is prohibited.