Renewable Energy in Industrial Applications â an ... - Unido
Renewable Energy in Industrial Applications â an ... - Unido
Renewable Energy in Industrial Applications â an ... - Unido

You also want an ePaper? Increase the reach of your titles
YUMPU automatically turns print PDFs into web optimized ePapers that Google loves.
<strong>Renewable</strong> <strong>Energy</strong> <strong>in</strong><br />
<strong>Industrial</strong> <strong>Applications</strong><br />
An assessment of the 2050 potential<br />
UNITED NATIONS<br />
INDUSTRIAL DEVELOPMENT ORGANIZATION
<strong>Renewable</strong> <strong>Energy</strong> <strong>in</strong><br />
<strong>Industrial</strong> <strong>Applications</strong><br />
An assessment of the 2050 potential<br />
UNITED NATIONS INDUSTRIAL DEVELOPMENT ORGANIZATION
Disclaimer<br />
This document has been produced without formal United Nations edit<strong>in</strong>g. The designations employed <strong>an</strong>d<br />
the presentation of the material <strong>in</strong> this document do not imply the expression of <strong>an</strong>y op<strong>in</strong>ion whatsoever<br />
on the part of the Secretariat of the United Nations <strong>Industrial</strong> Development Org<strong>an</strong>ization (UNIDO)<br />
concern<strong>in</strong>g the legal status of <strong>an</strong>y country, territory, city or area or of its authorities, or concern<strong>in</strong>g the<br />
delimitation of its frontiers or boundaries, or its economic system or degree of development. Designations<br />
such as "developed", "<strong>in</strong>dustrialised" <strong>an</strong>d "develop<strong>in</strong>g" are <strong>in</strong>tended for statistical convenience <strong>an</strong>d do<br />
not necessarily express a judgment about the stage reached by a particular country or area <strong>in</strong> the<br />
development process. Mention of firm names or commercial products does not constitute <strong>an</strong> endorsement<br />
by UNIDO.<br />
Although great care has been taken to ma<strong>in</strong>ta<strong>in</strong> the accuracy of <strong>in</strong>formation here<strong>in</strong>, neither UNIDO nor its<br />
Member States assume <strong>an</strong>y responsibility for consequences which may arise from the use of the material.<br />
This document may be freely quoted or repr<strong>in</strong>ted but acknowledgement is requested.
ACKNOWLEDGEMENTS<br />
This technical paper has been produced by the<br />
United Nations <strong>Industrial</strong> Development<br />
Org<strong>an</strong>ization (UNIDO) under the general guid<strong>an</strong>ce<br />
of Pradeep Monga, Director of the <strong>Energy</strong> <strong>an</strong>d<br />
Climate Ch<strong>an</strong>ge Br<strong>an</strong>ch. RENEWABLE ENERGY IN<br />
INDUSTRIAL APPLICATIONS An assessment of the<br />
2050 potential was written by Em<strong>an</strong>uele Taibi,<br />
Dolf Gielen <strong>an</strong>d Morg<strong>an</strong> Bazili<strong>an</strong>.<br />
The work has greatly benefited from the<br />
subst<strong>an</strong>tive guid<strong>an</strong>ce received from Diego<br />
Masera, Chief of the <strong>Renewable</strong> <strong>an</strong>d Rural <strong>Energy</strong><br />
Unit. Special th<strong>an</strong>ks go to the external reviewers<br />
for their precious comments <strong>an</strong>d suggestions, <strong>in</strong><br />
particular to Milou Beerepoot from the IEA<br />
<strong>Renewable</strong> <strong>Energy</strong> Division <strong>an</strong>d to Werner Weiss<br />
<strong>an</strong>d Christoph Brunner from AEE Intec. Additional<br />
th<strong>an</strong>ks for the useful discussions from which the<br />
work greatly benefited go to Paolo Fr<strong>an</strong>kl, Head<br />
of the IEA <strong>Renewable</strong> <strong>Energy</strong> Division; Cédric<br />
Philibert, IEA <strong>Renewable</strong> <strong>Energy</strong> Division; Nathalie<br />
Trudeau, IEA <strong>Energy</strong> Technology Policy Division;<br />
Mark Howells, IAEA Pl<strong>an</strong>n<strong>in</strong>g <strong>an</strong>d Economic<br />
Studies Section; Gustav Resch, TU Vienna <strong>Energy</strong><br />
Economics Group; Tom Howes, Europe<strong>an</strong><br />
Commission <strong>Renewable</strong> <strong>Energy</strong> Policy Unit; <strong>an</strong>d<br />
Stef<strong>an</strong>o Zehnder, Parp<strong>in</strong>elli TECNON.<br />
5
TABLE OF CONTENTS<br />
List of Figures . . . . . .6<br />
Executive Summary . . . . . .7<br />
I. INTRODUCTION . . . . . .9<br />
II. BIOMASS . . . . .14<br />
a. Biomass supply potential . . . . .14<br />
Competition for biomass among different sectors . . . . .16<br />
b. Biomass process heat . . . . .16<br />
Regional <strong>an</strong>d sectoral discussion . . . . .16<br />
Bioenergy Technologies . . . . .19<br />
c. Biomass as petrochemical feedstock . . . . .23<br />
III. SOLAR THERMAL SYSTEMS . . . . .28<br />
a. Solar process heat . . . . .28<br />
b. Solar cool<strong>in</strong>g . . . . .34<br />
IV. HEAT PUMPS . . . . .35<br />
a. Heat pumps for process heat . . . . .35<br />
V. REFERENCES . . . . .39<br />
VI. ANNEXES . . . . .42<br />
ANNEX 1 . . . . .42<br />
Modell<strong>in</strong>g energy tr<strong>an</strong>sitions: . . . . .42<br />
ANNEX 2 . . . . .45<br />
Biomass preparation technologies . . . . .45<br />
ANNEX 3 . . . . .47<br />
The production of synthetic org<strong>an</strong>ic materials from<br />
biomass feedstocks . . . . .47<br />
ANNEX 4 . . . . .51<br />
Solar thermal heat<strong>in</strong>g <strong>an</strong>d cool<strong>in</strong>g systems for <strong>in</strong>dustry . . . . .51<br />
ANNEX 5 . . . . .55<br />
Cost-effectiveness of renewables for <strong>in</strong>dustrial use . . . . .55<br />
7
LIST OF FIGURES<br />
Figure 1: <strong>Renewable</strong>s potential <strong>in</strong> <strong>in</strong>dustry by 2050 - f<strong>in</strong>al energy <strong>an</strong>d feedstocks . . . . .12<br />
Figure 2: World biomass supply cost curve for <strong>in</strong>dustrial process heat production . . . . .14<br />
Figure 3: Regional <strong>an</strong>d sectoral breakdown of biomass potential for process heat<br />
<strong>in</strong> <strong>in</strong>dustry <strong>in</strong> 2050, exclud<strong>in</strong>g <strong>in</strong>terregional trade . . . . . .17<br />
Figure 4: Regional <strong>an</strong>d sectoral breakdown of biomass potential for process heat<br />
<strong>in</strong> <strong>in</strong>dustry <strong>in</strong> 2050, <strong>in</strong>clud<strong>in</strong>g <strong>in</strong>terregional trade . . . . . .18<br />
Figure 5: Biomass solid fuels roadmap . . . . . .19<br />
Figure 6: Share of Alternative Fuel Use <strong>in</strong> Cl<strong>in</strong>ker Production by Country . . . . . .21<br />
Figure 7: Alternative fuels roadmap for cement production . . . . .22<br />
Figure 8: Potential contribution of biomass to the petrochemical feedstock pool . . . . .24<br />
Figure 9: Regional <strong>an</strong>d sectoral breakdown of solar thermal potential for<br />
process heat <strong>in</strong> <strong>in</strong>dustry <strong>in</strong> 2050 . . . . .28<br />
Figure 10: Low <strong>an</strong>d medium temperature process heat dem<strong>an</strong>d by sector . . . . .30<br />
Figure 11: Parabolic trough field, El NASR Pharmaceutical Chemicals, Egypt . . . . . .31<br />
Figure 12: Supply cost curve for solar thermal <strong>in</strong> the food <strong>an</strong>d tobacco sector . . . . .33<br />
Figure 13: Calculation of the renewable energy contribution of a heat pump,<br />
accord<strong>in</strong>g to the Europe<strong>an</strong> <strong>Renewable</strong> <strong>Energy</strong> Directive . . . . .35<br />
Figure 14: Regional <strong>an</strong>d sectoral breakdown of the heat pump potential for<br />
process heat <strong>in</strong> <strong>in</strong>dustry <strong>in</strong> 2050 . . . . .36<br />
Figure 15: Supply cost curves for heat pumps <strong>in</strong> the food <strong>an</strong>d tobacco sector . . . . .38<br />
Figure 16: Logistic substitution of biomass <strong>in</strong> the paper <strong>an</strong>d pulp<br />
<strong>an</strong>d wood <strong>in</strong>dustries . . . . .43<br />
Figure 17: Logistic substitution of biomass <strong>in</strong> the chemical <strong>an</strong>d petrochemical<br />
<strong>an</strong>d cement <strong>in</strong>dustries . . . . .44<br />
Figure 18: Cost of useful process heat produced by ma<strong>in</strong> fossil fuels,<br />
under different CO2 prices . . . . .55<br />
LIST OF TABLES<br />
Table 1: Global <strong>Energy</strong> Assessment scenario assumptions . . . . . .11<br />
Table 2: Economics of thermal applications of biomass gasifiers <strong>in</strong> SMEs . . . . .22<br />
Table 3: Production capacity for bio-based plastics <strong>in</strong> 2009 . . . . .23<br />
Table 4: Investment <strong>an</strong>d generation costs for solar thermal for <strong>in</strong>dustrial . . . . .29<br />
process heat - 2007<br />
Table 5: Break even <strong>an</strong>alysis <strong>an</strong>d learn<strong>in</strong>g <strong>in</strong>vestments for solar thermal <strong>in</strong> <strong>in</strong>dustry . .32<br />
Table 6: Investment <strong>an</strong>d generation costs for solar thermal for<br />
<strong>in</strong>dustrial process heat - 2050 . . . . .33<br />
Table 7: Ma<strong>in</strong> characteristics of thermally driven chillers . . . . .53<br />
8
EXECUTIVE SUMMARY<br />
M<strong>an</strong>ufactur<strong>in</strong>g <strong>in</strong>dustry accounts for about one<br />
third of total energy use worldwide. Roughly three<br />
quarters of <strong>in</strong>dustrial energy use is related to the<br />
production of energy-<strong>in</strong>tensive commodities such<br />
as ferrous <strong>an</strong>d non-ferrous metals, chemicals <strong>an</strong>d<br />
petrochemicals, non-metallic m<strong>in</strong>eral materials,<br />
<strong>an</strong>d pulp <strong>an</strong>d paper. In these sectors, energy<br />
costs constitute a large proportion of total<br />
production costs, so m<strong>an</strong>agers pay particular<br />
attention to driv<strong>in</strong>g them down. As a result, the<br />
scope to improve energy efficiency tends to be<br />
less <strong>in</strong> these most energy <strong>in</strong>tensive sectors th<strong>an</strong><br />
<strong>in</strong> those sectors where energy costs form a<br />
smaller proportion of total costs, such as the<br />
build<strong>in</strong>gs <strong>an</strong>d tr<strong>an</strong>sportation sectors. This limits<br />
the overall potential for carbon dioxide (CO2)<br />
reductions through energy efficiency measures <strong>in</strong><br />
<strong>in</strong>dustry to 15% - 30% on average.<br />
<strong>Industrial</strong> production is projected to <strong>in</strong>crease by a<br />
factor of four between now <strong>an</strong>d 2050. In the<br />
absence of a strong contribution from energy efficiency<br />
improvements, renewable energy <strong>an</strong>d CO2<br />
capture <strong>an</strong>d storage (CCS) will need to make a signific<strong>an</strong>t<br />
impact if <strong>in</strong>dustry is subst<strong>an</strong>tially to reduce<br />
its consequent greenhouse-gas (GHG) emissions.<br />
Although renewable energy has received a good<br />
deal of attention for power generation <strong>an</strong>d for residential<br />
applications, its use <strong>in</strong> <strong>in</strong>dustry has attracted<br />
much less attention. <strong>Renewable</strong> energy plays<br />
only a relatively small role <strong>in</strong> <strong>in</strong>dustry today.<br />
Biomass currently makes by far the most signific<strong>an</strong>t<br />
renewable energy contribution to <strong>in</strong>dustry, provid<strong>in</strong>g<br />
around 8% of its f<strong>in</strong>al energy use <strong>in</strong> 2007.<br />
The present <strong>an</strong>alysis of the long-term potential<br />
for renewable energy <strong>in</strong> <strong>in</strong>dustrial applications<br />
suggests that up to 21% of all f<strong>in</strong>al energy use<br />
<strong>an</strong>d feedstock <strong>in</strong> m<strong>an</strong>ufactur<strong>in</strong>g <strong>in</strong>dustry <strong>in</strong> 2050<br />
c<strong>an</strong> be of renewable orig<strong>in</strong>. This would<br />
constitute almost 50 exajoules a year (EJ/yr), out<br />
of a total <strong>in</strong>dustry sector f<strong>in</strong>al energy use of<br />
around 230 EJ/yr <strong>in</strong> the GEA Scenario M that is<br />
used as the basel<strong>in</strong>e projection <strong>in</strong> this study. This<br />
<strong>in</strong>cludes 37 EJ/yr from biomass feedstock <strong>an</strong>d<br />
process energy <strong>an</strong>d over 10 EJ/yr of process heat<br />
from solar thermal <strong>in</strong>stallations <strong>an</strong>d heat pumps.<br />
The use of biomass, primarily for process heat,<br />
has the potential to <strong>in</strong>crease <strong>in</strong> the pulp <strong>an</strong>d<br />
paper <strong>an</strong>d the wood sectors to 6.4 EJ/yr <strong>an</strong>d<br />
2.4 EJ/year respectively <strong>in</strong> 2050. This represents<br />
<strong>an</strong> almost threefold <strong>in</strong>crease <strong>in</strong> the pulp <strong>an</strong>d<br />
paper sector <strong>an</strong>d a more th<strong>an</strong> fivefold <strong>in</strong>crease <strong>in</strong><br />
the wood sector, reach<strong>in</strong>g a global average share<br />
of 54% <strong>an</strong>d 67% respectively of the total f<strong>in</strong>al<br />
energy use <strong>in</strong> each sector. Other sectors,<br />
<strong>in</strong>clud<strong>in</strong>g some of the most energy <strong>in</strong>tensive such<br />
as chemicals <strong>an</strong>d petrochemicals <strong>an</strong>d cement,<br />
also have potential to <strong>in</strong>crease their use of<br />
biomass, but they will only achieve that potential<br />
if there is a concerted effort for them to do so.<br />
For chemicals <strong>an</strong>d petrochemicals, wider biomass<br />
deployment will depend ma<strong>in</strong>ly on <strong>in</strong>vestment <strong>in</strong><br />
bio-ref<strong>in</strong>eries that c<strong>an</strong> make profits <strong>an</strong>d spread<br />
risk through the production of a r<strong>an</strong>ge of<br />
products. In the cement sector what is most<br />
needed is a proper policy framework for the<br />
m<strong>an</strong>agement of wastes <strong>an</strong>d <strong>in</strong>centives to<br />
<strong>in</strong>crease their use <strong>in</strong> cement production.<br />
9
RENEWABLE ENERGY IN INDUSTRIAL APPLICATIONS<br />
Interest<strong>in</strong>g potential lies <strong>in</strong> the development of<br />
bio-based vehicle tyres <strong>an</strong>d their subsequent use<br />
<strong>in</strong> cement kilns at the end of their useful life.<br />
This <strong>an</strong>alysis suggests that, by 2050, biomass<br />
could constitute 22% (9 EJ/year) of f<strong>in</strong>al energy<br />
use <strong>in</strong> the chemical <strong>an</strong>d petrochemical sectors<br />
<strong>an</strong>d that alternative fuels could constitute up to<br />
30% (5 EJ/year) of f<strong>in</strong>al energy use <strong>in</strong> the cement<br />
sector.<br />
Across all <strong>in</strong>dustrial sectors, biomass has the<br />
potential to contribute 37 EJ/yr. But the<br />
achievement of this potential will depend on a<br />
well-function<strong>in</strong>g market <strong>an</strong>d on the development<br />
of new st<strong>an</strong>dards <strong>an</strong>d pre-process<strong>in</strong>g<br />
technologies. About one-third of the potential<br />
(12 EJ/yr) could be achieved through<br />
<strong>in</strong>terregionally traded susta<strong>in</strong>able biomass<br />
feedstocks.<br />
Solar thermal energy has the potential to<br />
contribute 5.6 EJ/yr to <strong>in</strong>dustry by 2050. Almost<br />
half of this is projected to be used <strong>in</strong> the food<br />
sector, with a roughly equal regional distribution<br />
between OECD countries, Ch<strong>in</strong>a <strong>an</strong>d the rest of the<br />
world, ma<strong>in</strong>ly <strong>in</strong> Lat<strong>in</strong> America (15%) <strong>an</strong>d Other<br />
Asia (13%). Costs depend heavily on radiation<br />
<strong>in</strong>tensity. They are expected to drop by more th<strong>an</strong><br />
60%, ma<strong>in</strong>ly as a result of learn<strong>in</strong>g effects, from a<br />
r<strong>an</strong>ge of USD 17 - USD 34 per gigajoule (GJ) <strong>in</strong><br />
2007 to USD 6 - USD 12/GJ <strong>in</strong> 2050.<br />
Heat pumps also have a part to play <strong>in</strong> low<br />
temperature process applications <strong>an</strong>d are<br />
estimated to contribute 4.9 EJ/year <strong>in</strong> 2050. Most<br />
(43%) of this will be concentrated <strong>in</strong> the food<br />
sector, ma<strong>in</strong>ly <strong>in</strong> OECD countries (60%), Ch<strong>in</strong>a<br />
(16%) <strong>an</strong>d the Former Soviet Union (15%). Costs<br />
for useful energy supply are projected to drop by<br />
between 30% <strong>an</strong>d 50%, due ma<strong>in</strong>ly to reduced<br />
capital costs, <strong>in</strong>creased perform<strong>an</strong>ce <strong>an</strong>d more<br />
consistent, market driven, <strong>in</strong>ternational electricity<br />
prices, from a r<strong>an</strong>ge of USD 9 - USD 35/GJ <strong>in</strong><br />
2007 to USD 6 - USD 18/GJ <strong>in</strong> 2050.<br />
The competitiveness of biofuels with fossil fuels<br />
is strongly dependent on national energy policy<br />
frameworks <strong>an</strong>d energy prices. In the last<br />
decade, the ratio between the highest <strong>an</strong>d lowest<br />
end-use prices for natural gas for <strong>in</strong>dustry <strong>in</strong><br />
different countries has at times been as high as<br />
60. At the end of 2009, the ratio stood at 10.<br />
For coal, the ratio between different countries<br />
has been as high as 30 <strong>an</strong>d, at the end of 2009,<br />
stood at 15 (Annex 5).<br />
<strong>Renewable</strong>s are not cost competitive where fossil<br />
fuels are subsidised. They are, however, already<br />
cost competitive <strong>in</strong> m<strong>an</strong>y cases <strong>an</strong>d m<strong>an</strong>y<br />
countries with unsubsidised fossil fuels. This is<br />
even more so where CO2 emissions carry a<br />
f<strong>in</strong><strong>an</strong>cial penalty that reflects their long-term<br />
economic <strong>an</strong>d environmental impact. Where<br />
national energy policies subsidise fossil fuels,<br />
they strongly affect the competitiveness of<br />
renewable energy.<br />
Overall, <strong>an</strong> <strong>in</strong>crease <strong>in</strong> renewable energy <strong>in</strong><br />
<strong>in</strong>dustry has the potential to contribute about<br />
10% of all expected GHG emissions reductions <strong>in</strong><br />
2050. At nearly 2 gigatonnes (Gt) of CO2, this<br />
represents 25% of the total expected emission<br />
reductions of the <strong>in</strong>dustry sector. This is<br />
equivalent to the total current CO2 emissions of<br />
Fr<strong>an</strong>ce, Germ<strong>an</strong>y, Italy <strong>an</strong>d Spa<strong>in</strong>, or around onethird<br />
of current emissions <strong>in</strong> the United States.<br />
This potential c<strong>an</strong> only be realised, however, if<br />
specific policies are developed to create a<br />
bus<strong>in</strong>ess environment conducive to private sector<br />
<strong>in</strong>vestment, particularly <strong>in</strong> the tr<strong>an</strong>sition period.<br />
Current best practice shows the conditions under<br />
which the successful deployment of renewables<br />
c<strong>an</strong> take place <strong>an</strong>d this should guide future<br />
policy mak<strong>in</strong>g. Research, development <strong>an</strong>d<br />
deployment (RD&D) <strong>an</strong>d cost reductions through<br />
economies of scale are the priorities. In the<br />
longer term, a price for GHG emissions of the<br />
order of USD 50/t CO2 is needed to support the<br />
development of a market for renewable energy<br />
technologies <strong>an</strong>d feedstocks <strong>in</strong> <strong>in</strong>dustry.<br />
10
I. INTRODUCTION<br />
In recent years, renewable energy has<br />
<strong>in</strong>creas<strong>in</strong>gly attracted public <strong>an</strong>d policy attention<br />
particularly for its potential to contribute to<br />
reductions <strong>in</strong> GHG emissions. Most <strong>in</strong>terest has<br />
focused on the use of renewables <strong>in</strong> power<br />
generation <strong>an</strong>d as biofuels. Although some<br />
attention has been paid to the potential for<br />
renewables, particularly biomass <strong>an</strong>d solar<br />
thermal technologies, to contribute to heat<strong>in</strong>g<br />
<strong>an</strong>d cool<strong>in</strong>g <strong>in</strong> residential space heat<strong>in</strong>g<br />
applications, their use <strong>in</strong> <strong>in</strong>dustrial applications<br />
has received less <strong>in</strong>terest. This report focuses on<br />
the potential of renewable energy sources for<br />
process heat <strong>in</strong> the <strong>in</strong>dustrial sector <strong>an</strong>d for<br />
biomass feedstock substitution <strong>in</strong> <strong>in</strong>dustrial<br />
processes.<br />
<strong>Renewable</strong> energy c<strong>an</strong> be widely applied <strong>in</strong><br />
<strong>in</strong>dustrial applications. The four options primarily<br />
discussed <strong>in</strong> this report are:<br />
• Biomass for process heat;<br />
• Biomass for petrochemical feedstocks;<br />
• Solar thermal systems for process heat; <strong>an</strong>d<br />
• Heat pumps for process heat.<br />
Several other options may also become relev<strong>an</strong>t<br />
<strong>in</strong> the time horizon of this study. But these are<br />
unlikely to make <strong>an</strong>yth<strong>in</strong>g more th<strong>an</strong> a niche<br />
contribution <strong>an</strong>d they are accord<strong>in</strong>gly not<br />
discussed <strong>in</strong> <strong>an</strong>y detail <strong>in</strong> this report. They<br />
<strong>in</strong>clude:<br />
• Conventional geothermal heat. This is highly<br />
location dependent. Tr<strong>an</strong>sport<strong>in</strong>g heat over<br />
long dist<strong>an</strong>ces is costly, leads to large losses<br />
<strong>an</strong>d feasible <strong>in</strong> only a few specific conditions. 1<br />
For <strong>in</strong>dustrial process heat, the <strong>in</strong>dustrial<br />
pl<strong>an</strong>t must be located very close to the<br />
geothermal reservoir. This is unlikely to be<br />
possible <strong>in</strong> <strong>an</strong>y but a few highly specialised<br />
applications;<br />
• Enh<strong>an</strong>ced geothermal systems may make a<br />
contribution <strong>in</strong> the long run, subject to the<br />
resolution of technology issues;<br />
• The use of run-of-river hydro for motive<br />
power, of the k<strong>in</strong>d that has been used for<br />
centuries for gr<strong>in</strong>d<strong>in</strong>g mills; <strong>an</strong>d<br />
• The use of w<strong>in</strong>d for motive power, for<br />
example by driv<strong>in</strong>g air compressors enabl<strong>in</strong>g<br />
the storage of energy <strong>in</strong> the form of<br />
compressed air.<br />
In comb<strong>in</strong>ed heat <strong>an</strong>d power (CHP) pl<strong>an</strong>ts, the<br />
waste heat from biomass electricity generation<br />
c<strong>an</strong> be used very effectively <strong>in</strong> <strong>in</strong>dustrial<br />
applications. Electricity generation is not covered<br />
<strong>in</strong> this paper, so CHP electricity <strong>an</strong>d heat is not<br />
<strong>in</strong>cluded <strong>in</strong> the <strong>an</strong>alysis.<br />
The full achievement of the potential described<br />
<strong>in</strong> this <strong>an</strong>alysis will depend on the widespread<br />
adoption by <strong>in</strong>dustry of the Best Available<br />
Technologies (BAT). The speed of the adoption of<br />
BAT is, however, subject to a number of<br />
1<br />
Icel<strong>an</strong>d has a 63 km pipel<strong>in</strong>e tr<strong>an</strong>sport<strong>in</strong>g hot geothermal water, but such approaches are rarely feasible elsewhere.<br />
11
RENEWABLE ENERGY IN INDUSTRIAL APPLICATIONS<br />
signific<strong>an</strong>t barriers. These <strong>in</strong>clude:<br />
• Lack of <strong>in</strong>formation on the potential<br />
contribution of renewables <strong>an</strong>d ways of<br />
achiev<strong>in</strong>g it;<br />
• Cheap fossil fuels;<br />
• The absence of appropriate technology supply<br />
cha<strong>in</strong>s;<br />
• Lack of technical capacity;<br />
• The high cost of capital <strong>in</strong> m<strong>an</strong>y develop<strong>in</strong>g<br />
countries;<br />
• A focus on upfront <strong>in</strong>vestment cost <strong>in</strong>stead of<br />
full lifecycle cost;<br />
• Risks associated with technology tr<strong>an</strong>sitions<br />
<strong>an</strong>d the adoption of early stage technologies;<br />
• Restricted access to f<strong>in</strong><strong>an</strong>cial support to cover<br />
the extra costs of BAT; <strong>an</strong>d<br />
• The lock-<strong>in</strong> of <strong>in</strong>efficient, pollut<strong>in</strong>g<br />
technologies with long lifetimes.<br />
International cooperation c<strong>an</strong> help to address<br />
these barriers, especially where it is conducted <strong>in</strong><br />
close collaboration with national governments.<br />
The <strong>in</strong>dustrial sectors of m<strong>an</strong>y emerg<strong>in</strong>g<br />
economies are develop<strong>in</strong>g rapidly. It is import<strong>an</strong>t<br />
that they do so <strong>in</strong> a susta<strong>in</strong>able way. They need<br />
to be encouraged to leapfrog to climate friendly<br />
technologies if they are to avoid lock<strong>in</strong>g<br />
themselves <strong>in</strong>to long-last<strong>in</strong>g, <strong>in</strong>efficient <strong>an</strong>d<br />
pollut<strong>in</strong>g technologies for decades to come.<br />
The barriers to the implementation of BAT affect<br />
firms' decision mak<strong>in</strong>g processes <strong>in</strong> ways which<br />
underm<strong>in</strong>e otherwise rational economic<br />
<strong>in</strong>vestment <strong>in</strong> renewable technologies. Even<br />
where supply cost curves show excellent<br />
opportunities for energy efficiency <strong>an</strong>d renewable<br />
energy <strong>in</strong>vestments <strong>in</strong> <strong>in</strong>dustry, these <strong>in</strong>vestments<br />
are often not happen<strong>in</strong>g.<br />
The successful deployment of climate friendly<br />
technologies depends heavily on firms hav<strong>in</strong>g the<br />
f<strong>in</strong><strong>an</strong>cial capacity to <strong>in</strong>vest <strong>in</strong> the relev<strong>an</strong>t<br />
technologies. But it also depends on their hav<strong>in</strong>g<br />
the knowledge to develop <strong>an</strong>d exploit such<br />
technology <strong>an</strong>d on the existence of<br />
org<strong>an</strong>isational structures <strong>an</strong>d cultures, <strong>in</strong>clud<strong>in</strong>g<br />
<strong>in</strong>stitutional sett<strong>in</strong>gs <strong>an</strong>d rules, that encourage<br />
the use of such technology. 2 Site-specific issues<br />
will also <strong>in</strong>fluence the most appropriate climate<br />
friendly technologies for a particular <strong>in</strong>dustrial<br />
application. To maximise efficiencies, the dem<strong>an</strong>d<br />
for process energy <strong>in</strong>puts must be m<strong>in</strong>imised<br />
through the <strong>in</strong>troduction of low-cost, efficient<br />
technologies <strong>an</strong>d through systems optimisation<br />
before renewable energy options are applied.<br />
This <strong>an</strong>alysis looks at the long-term potential for<br />
the use of renewables <strong>in</strong> <strong>in</strong>dustry on a worldwide<br />
basis, with some regional disaggregation. It is<br />
clear, however, that national conditions vary<br />
widely <strong>in</strong> terms of resource availability, energy<br />
prices, <strong>in</strong>dustrial structures <strong>an</strong>d f<strong>in</strong><strong>an</strong>cial sector<br />
perform<strong>an</strong>ce. This will materially affect the speed<br />
of conversion to BAT <strong>in</strong> different countries.<br />
Competition with fossil fuels is one of the ma<strong>in</strong><br />
factors that determ<strong>in</strong>es the rate of tr<strong>an</strong>sition to<br />
renewable energy sources <strong>in</strong> <strong>in</strong>dustry. The<br />
International <strong>Energy</strong> Agency (IEA) estimates that<br />
fossil fuels still receive subsidies of around USD<br />
550 billion a year worldwide. Country end-use<br />
<strong>in</strong>dustrial energy prices c<strong>an</strong> vary by several<br />
orders of magnitude (Annex 5).<br />
This paper discusses the long term potential for<br />
selected renewable energy sources <strong>an</strong>d<br />
technologies <strong>in</strong> the <strong>in</strong>dustrial m<strong>an</strong>ufactur<strong>in</strong>g<br />
sector. It is part of the UNIDO contribution to the<br />
Global <strong>Energy</strong> Assessment (GEA), a forthcom<strong>in</strong>g<br />
comprehensive assessment of energy issues<br />
2<br />
Work by IIASA has characterised these components as hardware, software <strong>an</strong>d orgware (Arthur, 1983)<br />
12
INTRODUCTION<br />
coord<strong>in</strong>ated by the International Institute for<br />
Systems Analysis (IIASA). The reference scenario<br />
energy dem<strong>an</strong>d assumptions come from the GEA<br />
overall hypothesis on Infrastructure, Lifestyles<br />
<strong>an</strong>d Policy (Table 1) <strong>an</strong>d the IEA's <strong>Energy</strong><br />
Technology Tr<strong>an</strong>sitions <strong>in</strong> Industry (IEA, 2009b). A<br />
comb<strong>in</strong>ation of these scenarios is used as the<br />
GEA scenarios do not conta<strong>in</strong> sub-sectoral details<br />
for the <strong>in</strong>dustry sector.<br />
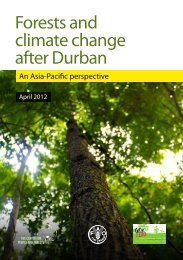
2050 (Figure 1). 3 This equates to a growth from<br />
8% to 21% of total f<strong>in</strong>al energy use.<br />
In absolute terms, 70% of this potential growth<br />
comes from the greater use of biomass <strong>an</strong>d<br />
wastes, with smaller contributions from solar<br />
thermal technologies <strong>an</strong>d heat pumps. Biofeedstocks<br />
constitute 7 EJ/yr out of the total of<br />
almost 50 EJ/yr of <strong>in</strong>dustrial feedstocks estimated<br />
Table 1<br />
Global <strong>Energy</strong> Assessment scenario assumptions (IIASA, <strong>in</strong> preparation)<br />
GEA-L GEA-M GEA-H<br />
Infrastructure Decentralized-<strong>Renewable</strong>s, Regional Centralized, supply-<br />
Limited Nuclear, emphasis hetrogeneity <strong>in</strong> orientation, eg CCS,<br />
on "Intelligent grids" technological Nuclear, large-scale<br />
choice<br />
renewables<br />
Lifestyles Major tr<strong>an</strong>sformation <strong>in</strong> Supply <strong>an</strong>d Less emphasis on<br />
consumer choices, large dem<strong>an</strong>d side "dematerialization".<br />
uptake of dem<strong>an</strong>d measures Cont<strong>in</strong>ued reli<strong>an</strong>ce<br />
sav<strong>in</strong>gs measures, mass<br />
on <strong>in</strong>dividual<br />
tr<strong>an</strong>sit systems<br />
mobility<br />
Policy More re-regulation; Mix of policy Centrally regulated<br />
subsidies, new bus<strong>in</strong>ess "bal<strong>an</strong>ced" markets, "feed-<strong>in</strong>"<br />
models, "feed-<strong>in</strong>" tariff measures across tariff for generation<br />
equivalents <strong>in</strong> end use<br />
the energy system<br />
The <strong>an</strong>alysis is based on a comb<strong>in</strong>ation of<br />
country <strong>an</strong>d regional resource data, data <strong>an</strong>d<br />
projections for the <strong>in</strong>dustrial activity of <strong>in</strong>dividual<br />
<strong>in</strong>dustry sectors, <strong>an</strong>d data on the current <strong>an</strong>d<br />
future technical <strong>an</strong>d economic characteristics of<br />
renewable energy technologies for <strong>in</strong>dustrial<br />
applications. The ma<strong>in</strong> focus is on potential<br />
outcomes <strong>in</strong> 2050, <strong>an</strong>d on the tr<strong>an</strong>sition<br />
pathways that will best achieve those outcomes.<br />
This study suggests that renewable energy use <strong>in</strong><br />
<strong>in</strong>dustry has the potential to grow from less th<strong>an</strong><br />
10 EJ a year <strong>in</strong> 2007 to almost 50 EJ a year <strong>in</strong><br />
for 2050, while biomass for process heat<br />
accounts for over 30 EJ/yr. Solar thermal is<br />
estimated to contribute up to 5.6 EJ/yr. Although<br />
not part of the scenario considered here, the<br />
application of concentrat<strong>in</strong>g solar power (CSP)<br />
technologies <strong>in</strong> the chemical sector could<br />
potentially <strong>in</strong>crease the contribution of solar<br />
thermal to 8 EJ/yr. Heat pumps will compete with<br />
solar thermal technologies for low-temperature<br />
process heat applications, depend<strong>in</strong>g on<br />
electricity prices <strong>an</strong>d the availability of solar<br />
radiation. The estimated potential for heat<br />
pumps <strong>in</strong> 2050 is 4.9 EJ/yr.<br />
3<br />
The chart shows the projected average growth <strong>in</strong> the role of renewables from 2007 to 2050. It does not purport to suggest a<br />
tr<strong>an</strong>sition pathway. Growth is represented <strong>in</strong> the style of Pacala <strong>an</strong>d Socolow (2004).<br />
13
RENEWABLE ENERGY IN INDUSTRIAL APPLICATIONS<br />
Figure 1<br />
<strong>Renewable</strong>s potential <strong>in</strong> <strong>in</strong>dustry by 2050 - f<strong>in</strong>al energy <strong>an</strong>d feedstocks.<br />
UNIDO <strong>an</strong>alysis.<br />
240<br />
<strong>Renewable</strong>s <strong>in</strong> <strong>in</strong>dustry - GEA scenario M<br />
<strong>in</strong>clud<strong>in</strong>g feedstocks<br />
220<br />
200<br />
180<br />
160<br />
140<br />
EJ<br />
120<br />
100<br />
80<br />
60<br />
40<br />
20<br />
0<br />
2007 2050<br />
Total non renewable Biomass process heat Biofeedstocks Solar thermal Heat Pumps<br />
Currently around one third of the f<strong>in</strong>al energy<br />
consumption of the pulp <strong>an</strong>d paper sector comes<br />
from biomass <strong>an</strong>d waste, with a maximum of<br />
82% achieved <strong>in</strong> Brazil. Wood <strong>an</strong>d agricultural<br />
straw are <strong>an</strong> import<strong>an</strong>t feedstock for pulp<br />
mak<strong>in</strong>g. Around 37% of the f<strong>in</strong>al energy used by<br />
the wood process<strong>in</strong>g <strong>in</strong>dustry also comes from<br />
biomass residues, with a maximum of 81% <strong>in</strong><br />
Fr<strong>an</strong>ce. Biomass is also <strong>an</strong> import<strong>an</strong>t resource for<br />
synthetic org<strong>an</strong>ic products such as fibers,<br />
detergents, lubric<strong>an</strong>ts <strong>an</strong>d solvents. About 10% of<br />
all feedstock for synthetic org<strong>an</strong>ic products is of<br />
natural org<strong>an</strong>ic orig<strong>in</strong>. This <strong>in</strong>cludes cellulose<br />
from wood <strong>an</strong>d natural oil for alcohols (polyols)<br />
<strong>an</strong>d other chemical feedstocks.<br />
Charcoal is still used for iron mak<strong>in</strong>g on <strong>an</strong><br />
<strong>in</strong>dustrial scale <strong>in</strong> Brazil. ArcelorMittal<br />
Bioenergetica produces charcoal from eucalyptus<br />
forestry operations. This charcoal is used to fuel<br />
iron furnaces <strong>in</strong> Juiz de Fora or exch<strong>an</strong>ged for pig<br />
iron with local producers.<br />
The cement sector has the capability to use<br />
almost <strong>an</strong>y waste products with residual energy<br />
content <strong>in</strong>clud<strong>in</strong>g the combustible fraction of<br />
municipal solid wastes, discarded tyres, waste<br />
oils, plastic wastes, paper residues <strong>an</strong>d other low<br />
grade biomass wastes locally available. Although<br />
<strong>in</strong>terest <strong>in</strong> us<strong>in</strong>g such wastes is grow<strong>in</strong>g, these<br />
resources account for only 5% of the cement<br />
<strong>in</strong>dustry's fuel needs <strong>in</strong> develop<strong>in</strong>g countries,<br />
compared to <strong>an</strong> average of 16% <strong>in</strong> OECD<br />
countries. For this <strong>an</strong>alysis, only the renewable<br />
fraction of waste is taken <strong>in</strong>to account <strong>in</strong> the<br />
calculation of the renewable energy potential.<br />
14
INTRODUCTION<br />
New applications for <strong>in</strong>dustrial biomass use<br />
have emerged <strong>in</strong> the last decade. These <strong>in</strong>clude<br />
biomass gasification for process heat <strong>in</strong><br />
countries such as Ch<strong>in</strong>a <strong>an</strong>d India, the use of<br />
biogas from the digestion of residues <strong>in</strong> the<br />
agro-food <strong>in</strong>dustry, <strong>an</strong>d new forms of bioplastics<br />
<strong>an</strong>d biochemicals. Eth<strong>an</strong>ol <strong>an</strong>d meth<strong>an</strong>ol, which<br />
serve as a basis for a wide r<strong>an</strong>ge of<br />
commodities, c<strong>an</strong> be produced from biomass.<br />
Bulk chemicals such as ethylene are now be<strong>in</strong>g<br />
produced on a commercial scale from such<br />
bioeth<strong>an</strong>ol feedstocks. The Brazili<strong>an</strong><br />
petrochemical firm Braskem S.A., for example,<br />
pl<strong>an</strong>s to have the capacity to produce 200 000<br />
tonnes/yr of polyethylene from sugar-c<strong>an</strong>e<br />
derived eth<strong>an</strong>ol by October 2010. The<br />
comp<strong>an</strong>y cont<strong>in</strong>ues also to develop work on<br />
sugar-c<strong>an</strong>e derived polypropylene <strong>an</strong>d synthetic<br />
rubber.<br />
Chemical pulp pl<strong>an</strong>ts have become much more<br />
energy efficient to the po<strong>in</strong>t that they c<strong>an</strong> now<br />
produce surplus electricity, heat or synfuels from<br />
production process wood residues, without<br />
additional fossil fuel use.<br />
Solar energy is widely used for dry<strong>in</strong>g<br />
processes, although much of this is not<br />
accounted for <strong>in</strong> energy statistics. Solar process<br />
heat<strong>in</strong>g has now been applied <strong>in</strong> a few hundred<br />
enterprises <strong>in</strong> applications such as swimm<strong>in</strong>g<br />
pools, laundries, dairies <strong>an</strong>d breweries. The<br />
temperature levels achieved are gradually<br />
<strong>in</strong>creas<strong>in</strong>g, as is the scale of the applications.<br />
Some of the technologies used for CSP c<strong>an</strong> also<br />
be used to generate steam at a wide r<strong>an</strong>ge of<br />
temperature <strong>an</strong>d pressure levels for <strong>in</strong>dustrial<br />
process heat.<br />
Solar cool<strong>in</strong>g seems to have only a limited<br />
potential <strong>in</strong> <strong>in</strong>dustry, probably concentrated <strong>in</strong><br />
the food sector. Demonstration pl<strong>an</strong>ts have been<br />
successfully runn<strong>in</strong>g under several research<br />
projects, <strong>in</strong>clud<strong>in</strong>g the IEA Solar Heat<strong>in</strong>g <strong>an</strong>d<br />
Cool<strong>in</strong>g (SHC) programme, <strong>an</strong>d the Mediterr<strong>an</strong>e<strong>an</strong><br />
food <strong>an</strong>d agricultural <strong>in</strong>dustry applications of<br />
solar cool<strong>in</strong>g technologies (MEDISCO).<br />
Other renewable energy technologies for<br />
<strong>in</strong>dustrial process heat production <strong>in</strong>clude heat<br />
pumps 4 . Industry needs heat at a temperature<br />
generally signific<strong>an</strong>tly higher th<strong>an</strong> the ambient<br />
temperature. 4 So far, heat pumps have not been<br />
able to meet this dem<strong>an</strong>d <strong>in</strong> m<strong>an</strong>y applications<br />
<strong>an</strong>d they have therefore achieved only limited<br />
diffusion. Geothermal heat <strong>an</strong>d the direct use of<br />
w<strong>in</strong>d energy, for example for water pump<strong>in</strong>g, c<strong>an</strong><br />
also play a role <strong>in</strong> niche markets.<br />
Altogether, about 30% of the total f<strong>in</strong>al energy<br />
use <strong>in</strong> <strong>in</strong>dustry, exclud<strong>in</strong>g feedstocks, c<strong>an</strong> be of<br />
renewable orig<strong>in</strong> by 2050. This excludes the use<br />
of electricity produced from renewable resources<br />
for <strong>in</strong>dustrial use. In addition, up to 14% of the<br />
fossil feedstock expected to be used by <strong>in</strong>dustry<br />
c<strong>an</strong> be substituted with biomass. Taken together,<br />
the potential exists to replace 21% of the f<strong>in</strong>al<br />
energy <strong>an</strong>d feedstock energy expected to be<br />
used by <strong>in</strong>dustry <strong>in</strong> 2050 with renewables.<br />
This <strong>an</strong>alysis also suggests that renewables have<br />
the potential to play a key role <strong>in</strong> the reduction<br />
of CO2 emissions <strong>an</strong>d fossil fuel dependence <strong>in</strong><br />
the <strong>in</strong>dustry sector. These benefits warr<strong>an</strong>t more<br />
attention. This report identifies obstacles to the<br />
achievement of this potential <strong>an</strong>d discusses the<br />
conditions for their mitigation.<br />
4<br />
For the scope of this <strong>an</strong>alysis, heat produced by heat pumps is considered renewable as long as the low temperature source is<br />
renewable (such as from air, ground, surface <strong>an</strong>d ground water, hot water produced by solar thermal systems or biomass<br />
boilers). Another condition is that the energy provided should be higher th<strong>an</strong> the one consumed. Air heat pumps use a s<strong>in</strong>gle<br />
unit of electricity to produce three to five units of usable heat. This me<strong>an</strong>s that 75% to 80% of the f<strong>in</strong>al energy produced is<br />
from a renewable source: ambient energy. The rest c<strong>an</strong> also be renewable (electricity or heat produced from renewables) or not<br />
(electricity or heat produced from fossil fuels). Only the renewable portion of the heat produced by heat pumps is counted as<br />
be<strong>in</strong>g renewable. In the case of power production with efficiency of 40%, the Coefficient of Perform<strong>an</strong>ce (COP) of a heat pump<br />
should be higher th<strong>an</strong> 2.5 <strong>in</strong> order to save primary energy <strong>an</strong>d be considered as provid<strong>in</strong>g renewable heat.<br />
15
II. BIOMASS<br />
A. BIOMASS SUPPLY POTENTIAL<br />
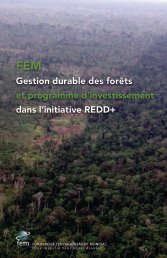
The start<strong>in</strong>g po<strong>in</strong>t for the estimation of the<br />
potential for biomass use <strong>in</strong> <strong>in</strong>dustry is the<br />
resource potential of biomass <strong>in</strong>puts (Figure 2).<br />
The construction of this figure is described <strong>in</strong><br />
Box 1.<br />
Figure 2<br />
World biomass supply cost curve for <strong>in</strong>dustrial process heat production<br />
(ref. to f<strong>in</strong>al energy). UNIDO <strong>an</strong>alysis.<br />
14<br />
Biomass world supply curve<br />
Cost (US$/GJ)<br />
12<br />
10<br />
8<br />
6<br />
4<br />
2<br />
Africa<br />
2.5<br />
Asia (exclud<strong>in</strong>g Ch<strong>in</strong>a) 3<br />
Non-OECD Europe 3.25<br />
Former Soviet Union 3.5<br />
Ch<strong>in</strong>a (<strong>in</strong>clud<strong>in</strong>g Hong Kong) 3.75<br />
Lat<strong>in</strong> America 4<br />
OECD Total 5<br />
Lat<strong>in</strong> America<br />
6<br />
Africa<br />
7<br />
Asia (exclud<strong>in</strong>g Ch<strong>in</strong>a)<br />
7.5<br />
Former Soviet Union 8<br />
OECD Total<br />
10<br />
Ch<strong>in</strong>a (<strong>in</strong>clud<strong>in</strong>g Hong Kong) 11<br />
Non-OECD Europe 12<br />
0<br />
0<br />
1<br />
2<br />
3<br />
4<br />
5<br />
6<br />
7<br />
8<br />
9<br />
10<br />
11<br />
12<br />
13<br />
14<br />
15<br />
16<br />
17<br />
18<br />
19<br />
20<br />
21<br />
22<br />
23<br />
24<br />
25<br />
26<br />
27<br />
28<br />
29<br />
30<br />
31<br />
32<br />
33<br />
34<br />
35<br />
36<br />
37<br />
38<br />
39<br />
40<br />
41<br />
42<br />
43<br />
44<br />
45<br />
46<br />
47<br />
48<br />
49<br />
Residues<br />
<strong>Energy</strong> crops<br />
Natural gas reference price<br />
Coal reference price<br />
potential (EJ)<br />
16
BIOMASS<br />
Box 1: The biomass supply cost curve<br />
The figures presented are based on the estimated potential biomass resource that c<strong>an</strong> be<br />
dedicated to <strong>in</strong>dustry. This is derived from <strong>an</strong> estimate of 150 EJ/year of susta<strong>in</strong>able biomass<br />
supply <strong>in</strong> 2050 <strong>an</strong>d the assumption that no more th<strong>an</strong> one-third of this c<strong>an</strong> be dedicated to<br />
<strong>in</strong>dustrial applications. The rest will be shared between tr<strong>an</strong>sportation, power generation <strong>an</strong>d<br />
residential sector. The upper bound of 50 EJ of biomass for <strong>in</strong>dustrial applications is based on a<br />
comprehensive literature review. If this biomass were grown on agricultural l<strong>an</strong>d it would require<br />
about 300-600 million hectares. Also signific<strong>an</strong>t amounts of agricultural <strong>an</strong>d forestry <strong>an</strong>d wood<br />
process<strong>in</strong>g residues are available, <strong>in</strong> the order of 100 EJ per year.<br />
The Y-axis shows the estimated long term supply cost for biomass from residues <strong>an</strong>d from<br />
energy crops delivered at the po<strong>in</strong>t of use, <strong>in</strong>clud<strong>in</strong>g cost, <strong>in</strong>sur<strong>an</strong>ce <strong>an</strong>d freight. Prices may<br />
differ from supply costs given the volatility of commodity prices, the non-liquidity of m<strong>an</strong>y<br />
regional biomass markets <strong>an</strong>d the absence of true global markets for biomass trad<strong>in</strong>g. These<br />
figures should be considered as a lower bound of cost for the actual price of different biomass<br />
commodities. The price will be determ<strong>in</strong>ed by m<strong>an</strong>y factors that are difficult to predict,<br />
<strong>in</strong>clud<strong>in</strong>g:<br />
• different buyers may be compet<strong>in</strong>g for the same commodity for different uses. In these<br />
circumst<strong>an</strong>ces, the price of the commodity is determ<strong>in</strong>ed by the dem<strong>an</strong>d from both markets,<br />
as for example seen from the competition from biodiesel producers <strong>an</strong>d food producers on<br />
the palm oil exch<strong>an</strong>ge <strong>in</strong> Malaysia <strong>an</strong>d from eth<strong>an</strong>ol producers <strong>an</strong>d food producers for corn<br />
on the Chicago Board of Exch<strong>an</strong>ge;<br />
• the price of biomass will be strongly l<strong>in</strong>ked to the price of the commodity the biomass is<br />
substitut<strong>in</strong>g for. So the price of other edible vegetable oils will <strong>in</strong>fluence the price of palm<br />
oil <strong>an</strong>d the price of coal will <strong>in</strong>fluence the price of pellets, charcoal <strong>an</strong>d bio-coal. The price of<br />
coal is especially relev<strong>an</strong>t for GEA, because with high carbon prices the price of coal may be<br />
even higher th<strong>an</strong> the cost of biomass substitutes, driv<strong>in</strong>g up the biomass price. With CO2 at<br />
USD 200/t, coal will cost USD 20/GJ, compared with USD 1 - USD 2/GJ today.<br />
• the lock-<strong>in</strong> for some technologies such as power generation is very long. Once a pl<strong>an</strong>t has<br />
been designed for a specific fuel such as coconut shells, rice husks, or other specific<br />
residues, those fuels c<strong>an</strong>not be easily substituted <strong>an</strong>d substitution will make no economic<br />
sense dur<strong>in</strong>g the lifetime of the pl<strong>an</strong>t. This c<strong>an</strong> drive up prices.<br />
The regional break down of the resource<br />
potential accounts for the differences <strong>in</strong> sector<br />
structure <strong>an</strong>d its consequences for biomass use.<br />
Look<strong>in</strong>g forward to 2050, m<strong>an</strong>y technological<br />
breakthroughs may happen, both <strong>in</strong> the <strong>in</strong>dustrial<br />
sector <strong>an</strong>d <strong>in</strong> the tr<strong>an</strong>sportation sector.<br />
This supply curve allows for <strong>in</strong>creases <strong>in</strong><br />
food production <strong>an</strong>d l<strong>an</strong>d use for other<br />
purposes. It assumes a signific<strong>an</strong>t <strong>in</strong>crease <strong>in</strong><br />
productivity <strong>an</strong>d a moderate ch<strong>an</strong>ge <strong>in</strong><br />
lifestyle, notably a moderate growth <strong>in</strong> meat<br />
consumption.<br />
17
RENEWABLE ENERGY IN INDUSTRIAL APPLICATIONS<br />
Competition for biomass among<br />
different sectors<br />
Iron <strong>an</strong>d steel<br />
Iron production requires the combustion of<br />
carbon-conta<strong>in</strong><strong>in</strong>g fuels to produce carbon<br />
monoxide which is reacted with ferrous oxide to<br />
produce iron <strong>an</strong>d CO2. Historically, iron was<br />
produced us<strong>in</strong>g charcoal exclusively as fuel. At<br />
the beg<strong>in</strong>n<strong>in</strong>g of the 18th century, charcoal<br />
started to be substituted by coke. Coke is now<br />
by far the dom<strong>in</strong><strong>an</strong>t fuel <strong>in</strong> iron <strong>an</strong>d steel<br />
mak<strong>in</strong>g, with at least 10 Gt of coke be<strong>in</strong>g<br />
consumed per tonne of steel produced. Even so,<br />
signific<strong>an</strong>t amounts of pig iron are still<br />
successfully produced us<strong>in</strong>g charcoal.<br />
The use of electrochemical processes to produce<br />
iron ore, known as electrow<strong>in</strong>n<strong>in</strong>g, is currently <strong>in</strong><br />
<strong>an</strong> early R&D phase. Alum<strong>in</strong>um is produced<br />
entirely by electrow<strong>in</strong>n<strong>in</strong>g <strong>an</strong>d the approach is<br />
also used <strong>in</strong> the production of lead, copper, gold,<br />
silver, z<strong>in</strong>c, chromium, cobalt, m<strong>an</strong>g<strong>an</strong>ese, <strong>an</strong>d<br />
the rare-earth <strong>an</strong>d alkali metals. Electorw<strong>in</strong>n<strong>in</strong>g<br />
offers the possibility to produce iron without the<br />
use of carbonaceous fuels. If a technological<br />
breakthrough were to make the production of<br />
iron by electrow<strong>in</strong>n<strong>in</strong>g feasible, <strong>an</strong>d if <strong>in</strong> future<br />
there were large qu<strong>an</strong>tities of low cost, low<br />
carbon electricity available, this would offer a<br />
route to the production of iron <strong>an</strong>d steel with<br />
signific<strong>an</strong>tly reduced carbon emissions.<br />
Petrochemical feedstocks<br />
Carbon is also needed for the production of<br />
materials <strong>in</strong> the petrochemical sector, where it<br />
comprises around 75% of the total feedstock.<br />
The ma<strong>in</strong> alternative feedstock to fossil fuels <strong>in</strong><br />
the petrochemical sector is likely to be biomass.<br />
But waste products, such as recycled plastics,<br />
c<strong>an</strong> also substitute for some fossil fuel feedstock.<br />
Alternatively, org<strong>an</strong>ic materials such as cellulose<br />
fibers, coconut fibers, starch plastics, fibre<br />
boards <strong>an</strong>d paper foams c<strong>an</strong> be produced which<br />
c<strong>an</strong> directly substitute for petrochemical products<br />
<strong>in</strong> end use applications, as described <strong>in</strong> Annex 3.<br />
It is also possible to produce textile materials<br />
(ma<strong>in</strong>ly viscose <strong>an</strong>d acetate) from wood pulp <strong>an</strong>d<br />
as by-products from cotton process<strong>in</strong>g.<br />
Tr<strong>an</strong>sportation<br />
The tr<strong>an</strong>sport sector is likely to be a signific<strong>an</strong>t<br />
competitor for <strong>an</strong>y available biomass resource. If<br />
by 2050 biofuels are still the ma<strong>in</strong> option to<br />
displace fossil fuels from the tr<strong>an</strong>sport sector, the<br />
availability of biomass for the <strong>in</strong>dustrial sector<br />
may be extremely limited. This would <strong>in</strong>crease<br />
the attractiveness of other, non-biomass,<br />
renewable energy sources <strong>an</strong>d of the further<br />
electrification of m<strong>an</strong>y <strong>in</strong>dustrial sectors. But at<br />
the same time, if biofuels <strong>in</strong>creas<strong>in</strong>gly replace<br />
petroleum fuels, this may free up large amounts<br />
of ref<strong>in</strong>ery-produced naphtha at low cost. In<br />
these circumst<strong>an</strong>ces, shift<strong>in</strong>g away from naphtha<br />
as a petrochemical feedstock to alternative<br />
feedstocks or processes will be very difficult to<br />
achieve.<br />
B. BIOMASS PROCESS HEAT<br />
Regional <strong>an</strong>d sectoral discussion<br />
Biomass is the most widely used renewable<br />
energy source both generally <strong>an</strong>d <strong>in</strong> <strong>in</strong>dustry.<br />
Biomass availability <strong>an</strong>d use is strongly<br />
dependent on regional conditions.<br />
Although biomass provides 8% of <strong>in</strong>dustry's f<strong>in</strong>al<br />
energy, <strong>in</strong> some regions there is almost no<br />
biomass use <strong>in</strong> <strong>an</strong>y <strong>in</strong>dustrial sector. In regions<br />
such as Lat<strong>in</strong> America <strong>an</strong>d Africa, by contrast,<br />
biomass contributes around 30% of <strong>in</strong>dustry's<br />
f<strong>in</strong>al energy (IEA statistics). Wide differences <strong>in</strong><br />
use are also observed among different <strong>in</strong>dustrial<br />
sectors.<br />
Biomass is used to a signific<strong>an</strong>t degree for<br />
<strong>in</strong>dustrial heat <strong>in</strong> the food <strong>an</strong>d tobacco, paper,<br />
18
BIOMASS<br />
pulp <strong>an</strong>d pr<strong>in</strong>t<strong>in</strong>g <strong>an</strong>d wood <strong>an</strong>d wood products<br />
sectors <strong>in</strong> most regions. By contrast, almost no<br />
process heat is produced from biomass <strong>in</strong> the<br />
iron <strong>an</strong>d steel <strong>an</strong>d non-metallic m<strong>in</strong>eral sectors,<br />
except <strong>in</strong> Brazil, or <strong>in</strong> the chemical <strong>an</strong>d<br />
petrochemical, non-ferrous metals, tr<strong>an</strong>sport<br />
equipment, mach<strong>in</strong>ery, m<strong>in</strong><strong>in</strong>g <strong>an</strong>d quarry<strong>in</strong>g,<br />
construction or textile <strong>an</strong>d leather sectors.<br />
The cement <strong>an</strong>d iron <strong>an</strong>d steel sectors <strong>in</strong> Brazil<br />
use biomass for 34% <strong>an</strong>d 40% respectively of<br />
the sectors' f<strong>in</strong>al energy consumption. The fact<br />
that such a high level of biomass contribution<br />
c<strong>an</strong> be susta<strong>in</strong>ed <strong>in</strong> the two most energy<br />
<strong>in</strong>tensive sectors <strong>in</strong> Brazil me<strong>an</strong>s that a similar<br />
level of contribution should also be technically<br />
feasible elsewhere. The limit<strong>in</strong>g factors on the<br />
extension of biomass use <strong>in</strong> these two sectors<br />
are clearly therefore non-technical ones. They<br />
may <strong>in</strong>clude resource availability, economics <strong>an</strong>d<br />
competition from other energy sources.<br />
The estimates of the potential role of biomass <strong>in</strong><br />
2050 are strongly sensitive to the state of the<br />
markets for biomass trad<strong>in</strong>g among different<br />
regions. If there is no <strong>in</strong>terregional trad<strong>in</strong>g of<br />
biomass, the potential contribution of biomass <strong>in</strong><br />
<strong>in</strong>dustry is estimated to be 18.3 EJ/year; if there<br />
are liquid markets for <strong>in</strong>terregional biomass<br />
trad<strong>in</strong>g this contribution is estimated to be<br />
30.3 EJ/year (Figures 3 <strong>an</strong>d 4).<br />
Tr<strong>an</strong>sport<strong>in</strong>g biomass is unlikely to have a<br />
signific<strong>an</strong>t impact on overall emission reductions.<br />
A state of the art coal-fired power pl<strong>an</strong>t with<br />
46% efficiency co-fir<strong>in</strong>g pellets shipped by a<br />
30 kilotonne (kt) ship over 6 800 km would<br />
produce emissions of around 85 grams of<br />
CO2/kilowatt hour (kWh). Us<strong>in</strong>g bio-coal 5 shipped<br />
by a 80 kt ship over 11 000 km, the emissions<br />
would be reduced to 32 grams of CO2/kWh. By<br />
comparison, the same power pl<strong>an</strong>t us<strong>in</strong>g coal<br />
would emit 796 grams of CO2/kWh.<br />
Figure 3<br />
Regional <strong>an</strong>d sectoral breakdown of biomass potential for process heat <strong>in</strong> <strong>in</strong>dustry <strong>in</strong><br />
2050, exclud<strong>in</strong>g <strong>in</strong>terregional trade. UNIDO <strong>an</strong>alysis.<br />
Regional breakdown<br />
Sectoral breakdown<br />
Non-OECD<br />
Europe<br />
1%<br />
Former<br />
Soviet Union<br />
11%<br />
Lat<strong>in</strong> America<br />
13%<br />
18.29 EJ <strong>in</strong> 2050<br />
Africa<br />
11%<br />
OECD Total<br />
17%<br />
Middle East<br />
0%<br />
Ch<strong>in</strong>a<br />
27%<br />
Other Asia<br />
20%<br />
Food <strong>an</strong>d<br />
tobacco<br />
4%<br />
Wood <strong>an</strong>d wood<br />
products<br />
10%<br />
Paper, pulp <strong>an</strong>d<br />
pr<strong>in</strong>t<strong>in</strong>g<br />
18%<br />
18.29 EJ <strong>in</strong> 2050<br />
Iron <strong>an</strong>d steel<br />
4%<br />
Non-metallic<br />
m<strong>in</strong>erals<br />
25%<br />
Chemical <strong>an</strong>d<br />
petrochemical<br />
37%<br />
5<br />
Bio-coal is a solid fuel with physical characteristics (energy density, hydrophobicity, mech<strong>an</strong>ical stability, etc.) comparable to<br />
coal. It is generally produced through the torrefaction of biomass feedstocks.<br />
19
RENEWABLE ENERGY IN INDUSTRIAL APPLICATIONS<br />
Figure 4<br />
Regional <strong>an</strong>d sectoral breakdown of biomass potential for process heat <strong>in</strong> <strong>in</strong>dustry <strong>in</strong><br />
2050, <strong>in</strong>clud<strong>in</strong>g <strong>in</strong>terregional trade. UNIDO <strong>an</strong>alysis.<br />
Former Soviet<br />
Union<br />
7%<br />
Lat<strong>in</strong> America<br />
8%<br />
Non-OECD<br />
Europe<br />
1%<br />
Regional breakdown<br />
Other Asia<br />
12%<br />
30.37 EJ <strong>in</strong> 2050<br />
Africa<br />
6%<br />
OECD Total<br />
47%<br />
Middle East<br />
0%<br />
Food <strong>an</strong>d<br />
tobacco<br />
3%<br />
Wood <strong>an</strong>d wood<br />
products<br />
10%<br />
Sectoral breakdown<br />
Non-metallic<br />
m<strong>in</strong>erals<br />
20%<br />
30.37 EJ <strong>in</strong> 2050<br />
Iron <strong>an</strong>d steel<br />
2%<br />
Chemical <strong>an</strong>d<br />
petrochemical<br />
37%<br />
Ch<strong>in</strong>a<br />
19%<br />
Paper, pulp <strong>an</strong>d<br />
pr<strong>in</strong>t<strong>in</strong>g<br />
26%<br />
In the absence of <strong>in</strong>terregional markets, the<br />
estimated marg<strong>in</strong>al cost of biomass would be<br />
around USD 7/GJ of primary energy, mostly <strong>in</strong> the<br />
form of locally consumed residues <strong>an</strong>d energy<br />
crops <strong>in</strong> Lat<strong>in</strong> America, with a smaller level of<br />
local consumption <strong>in</strong> Africa. With liquid<br />
<strong>in</strong>terregional markets, large volumes of biomass<br />
will be moved around the world, mostly <strong>in</strong>to<br />
OECD countries (11 EJ) <strong>an</strong>d some <strong>in</strong>to the<br />
Ch<strong>in</strong>ese market (less th<strong>an</strong> 1 EJ). Despite much<br />
higher levels of dem<strong>an</strong>d, the marg<strong>in</strong>al cost<br />
would be around USD 7.5/GJ, assum<strong>in</strong>g the<br />
exploitation of Africa's very large potential for<br />
energy crops, <strong>an</strong>d signific<strong>an</strong>t use also of Asia's<br />
potential.It is clear from this <strong>an</strong>alysis that<br />
creat<strong>in</strong>g tradable biomass commodities <strong>an</strong>d<br />
allow<strong>in</strong>g free trade from develop<strong>in</strong>g countries to<br />
<strong>in</strong>dustrialised ones will have a potentially<br />
positive impact on GHG emission reductions <strong>in</strong><br />
<strong>in</strong>dustry. It will also, import<strong>an</strong>tly, provide <strong>an</strong><br />
opportunity signific<strong>an</strong>tly to <strong>in</strong>crease<br />
development. Support<strong>in</strong>g susta<strong>in</strong>able biomass<br />
production, deploy<strong>in</strong>g technologies that will<br />
enable the conversion of biomass <strong>in</strong>to tradable<br />
commodities <strong>an</strong>d allow<strong>in</strong>g those commodities to<br />
reach OECD markets will provide Africa with a<br />
potential cash flow of up to USD 50 billion a<br />
year for the <strong>in</strong>dustrial sector alone. It will be<br />
import<strong>an</strong>t that these markets are developed <strong>in</strong> a<br />
susta<strong>in</strong>able m<strong>an</strong>ner.<br />
In addition, the dem<strong>an</strong>d for biomass for<br />
<strong>in</strong>dustrial applications may present <strong>an</strong><br />
opportunity for biomass resource-rich countries<br />
to secure a larger share of <strong>in</strong>dustrial production.<br />
This could become a source of economic growth<br />
<strong>an</strong>d provide a basis for new <strong>in</strong>dustries <strong>an</strong>d jobs<br />
<strong>in</strong> develop<strong>in</strong>g countries. In a development<br />
context, biomass resources may help develop<strong>in</strong>g<br />
countries to <strong>in</strong>crease their <strong>in</strong>dustrial value added,<br />
mov<strong>in</strong>g progressively up the value cha<strong>in</strong> from<br />
be<strong>in</strong>g exporters of their resources to us<strong>in</strong>g their<br />
resources to m<strong>an</strong>ufacture exportable f<strong>in</strong>ished<br />
products.<br />
20
BIOMASS<br />
Bioenergy Technologies<br />
A r<strong>an</strong>ge of bioenergy technologies for <strong>in</strong>dustrial<br />
process heat production are already<br />
commercialised. Others are at earlier po<strong>in</strong>ts on the<br />
RD&D spectrum. Biomass derived fuels, like fossil<br />
fuels, come <strong>in</strong> solid, liquid <strong>an</strong>d gaseous forms.<br />
Liquid biofuels <strong>in</strong>clude eth<strong>an</strong>ol from the<br />
fermentation of sugars <strong>an</strong>d biodiesel from the<br />
tr<strong>an</strong>sesterification of vegetable oils. Second<br />
generation biofuels are currently the subject of<br />
<strong>in</strong>tensive RD&D. About 57 kilotonnes (kt) of<br />
production capacity is <strong>in</strong> operation, <strong>an</strong>d about<br />
ten pl<strong>an</strong>ts each with a capacity of between 50 kt<br />
<strong>an</strong>d 300 kt per year are pl<strong>an</strong>ned to start<br />
operation <strong>in</strong> the com<strong>in</strong>g two years.<br />
Solid bioenergy products are likely to be the<br />
most effective substitute for coal. Several options<br />
are already on the market. Charcoal, for example,<br />
was well established as a coal substitute<br />
thous<strong>an</strong>ds of years ago. Other products such as<br />
pellets, described <strong>in</strong> more detail <strong>in</strong> Annex 2, have<br />
been developed more recently.<br />
Signific<strong>an</strong>t qu<strong>an</strong>tities of biomass are already cofired<br />
with coal <strong>in</strong> conventional coal power pl<strong>an</strong>ts.<br />
For example, the Amer 9 CHP power pl<strong>an</strong>t <strong>in</strong> the<br />
Netherl<strong>an</strong>ds, which produces 600MW of electricity<br />
<strong>an</strong>d 350 MW of heat, currently co-fires 35% of<br />
biomass mostly <strong>in</strong> the form of wood pellets with<br />
65% coal. The technological development of<br />
solid biomass fuels is likely to be directed at a<br />
scal<strong>in</strong>g up <strong>in</strong> the energy density of the<br />
reprocessed biomass until it c<strong>an</strong> be used without<br />
<strong>an</strong>y modification on its own <strong>in</strong> coal-burn<strong>in</strong>g<br />
power pl<strong>an</strong>ts, furnaces <strong>an</strong>d <strong>in</strong>dustrial processes<br />
(Figure 5).<br />
Figure 5<br />
Biomass solid fuel roadmap<br />
In 4+ years <br />
Wood chips<br />
Now<br />
St<strong>an</strong>dard<br />
pellets<br />
• 5 MWh/t<br />
• Improved<br />
h<strong>an</strong>dl<strong>in</strong>g <strong>an</strong>d<br />
combustion<br />
• 4 times bulk<br />
energy<br />
density*<br />
In 1-2 years<br />
Bio-coal<br />
(step 1)<br />
• 6.5 MWh/t<br />
• Hydrophobic<br />
• Uniform<br />
properties<br />
• Possible to<br />
gasify<br />
• 8 times bulk<br />
energy<br />
density*<br />
Bio-coal<br />
(step 2)<br />
• 9-10 MWh/t<br />
• Hydrophobic<br />
• Uniform<br />
properties<br />
• Ideal to<br />
gasify<br />
• Excellent total<br />
economics<br />
• New<br />
applications<br />
• > 16 times<br />
bulk<br />
energy<br />
density*<br />
* In comparison to woodchips Sources: BioMass Capital <strong>an</strong>alysis<br />
21
RENEWABLE ENERGY IN INDUSTRIAL APPLICATIONS<br />
The two ma<strong>in</strong> current forms of gaseous biofuels<br />
are biogas from <strong>an</strong>aerobic fermentation <strong>an</strong>d<br />
producer gas or synthetic gas (syngas) from<br />
biomass gasification.<br />
Anaerobic fermentation yields a biogas product<br />
which is very similar to natural gas. Once<br />
cle<strong>an</strong>ed, it c<strong>an</strong> be fed directly <strong>in</strong>to exist<strong>in</strong>g<br />
natural gas distribution pipel<strong>in</strong>es or used <strong>in</strong><br />
stationary power generation <strong>in</strong> gas eng<strong>in</strong>es. Its<br />
use for gas turb<strong>in</strong>es is still limited, mostly due to<br />
the relatively small scale of exist<strong>in</strong>g biodigesters<br />
relative to the gas dem<strong>an</strong>d <strong>an</strong>d to the need to<br />
improve the quality of gas purification.<br />
Biomass gasification, although still only <strong>in</strong> <strong>an</strong> early<br />
commercial phase, offers good prospects for the<br />
use of biomass for process heat <strong>an</strong>d power<br />
generation. Gasifiers produce a synthetic gas<br />
(syngas) that c<strong>an</strong> be adjusted for direct use <strong>in</strong><br />
comb<strong>in</strong>ed cycle gas turb<strong>in</strong>e pl<strong>an</strong>t for power<br />
generation, or fed <strong>in</strong>to exist<strong>in</strong>g distribution<br />
networks, or used for the production of liquid<br />
fuels through the Fischer-Tropsch process, or even<br />
be used for hydrogen production through the use<br />
of special catalysts <strong>in</strong> the gasification bed. Most of<br />
these routes are currently <strong>in</strong> pilot demonstration<br />
phase <strong>in</strong> the CDFB gasifier <strong>in</strong> Güss<strong>in</strong>g, Austria.<br />
It is not clear yet whether the most effective<br />
technology will be a highly flexible gasifier<br />
capable of tr<strong>an</strong>sform<strong>in</strong>g m<strong>an</strong>y different qualities<br />
of low cost biomass <strong>in</strong>to a st<strong>an</strong>dardised, good<br />
quality syngas, or whether it will be based on a<br />
highly optimised gasifier that is f<strong>in</strong>e tuned to use<br />
pre-processed solid or liquid biomass<br />
commodities <strong>in</strong> the form of, for example, pellets<br />
or black liquor.<br />
Three current examples of the use of biomass <strong>in</strong><br />
<strong>in</strong>dustry are discussed <strong>in</strong> more detail below.<br />
Charcoal use <strong>in</strong> blast furnaces<br />
Charcoal is widely used today as a fuel. World<br />
average charcoal production from 2001 to 2005<br />
was around 43 Mt per year (equivalent to<br />
approximately 1.3 EJ/yr). It has been exp<strong>an</strong>d<strong>in</strong>g<br />
by around 2% a year <strong>in</strong> recent years.<br />
Most of this charcoal is used for cook<strong>in</strong>g <strong>in</strong><br />
develop<strong>in</strong>g countries. Around 37 million cubic<br />
metres (m 3 ) a year (2004 figures, equivalent to<br />
approximately 7.7 Mt), however, are used for iron<br />
mak<strong>in</strong>g particularly <strong>in</strong> small scale blast furnaces<br />
<strong>in</strong> Brazil. Charcoal does not have the mech<strong>an</strong>ical<br />
stability of coke, but it has similar chemical<br />
properties. A processed type of charcoal with<br />
better mech<strong>an</strong>ical stability is under development.<br />
This "biocoal" could substitute for coke.<br />
Assum<strong>in</strong>g the complete replacement of fossil<br />
fuels on a thermally equivalent basis, the<br />
production of 1 t of hot metal requires 0.725 t of<br />
charcoal produced from 3.6 t of wet wood.<br />
Charcoal produced <strong>in</strong> M<strong>in</strong>as Gerais costs about<br />
USD 200/t (S<strong>an</strong>tos Sampaio, 2005). This is<br />
comparable with current cok<strong>in</strong>g coal <strong>in</strong>dustrial<br />
prices <strong>in</strong> non-subsidised markets. So the<br />
economic impact on iron prices would be neutral.<br />
Alternatively, the use of renewables could be<br />
<strong>in</strong>creased <strong>in</strong> iron <strong>an</strong>d steel mak<strong>in</strong>g by us<strong>in</strong>g<br />
renewable power for electrow<strong>in</strong>n<strong>in</strong>g. At the<br />
current stage of technological development,<br />
electrow<strong>in</strong>n<strong>in</strong>g it is not feasible for iron <strong>an</strong>d steel<br />
production. Signific<strong>an</strong>t further technology<br />
development would be needed, together with<br />
economies of scale, if this were to become a<br />
realistic option. Some <strong>in</strong>dustry R&D is <strong>in</strong> tra<strong>in</strong> to<br />
develop such technology, but its long-term<br />
success is uncerta<strong>in</strong>.<br />
Biomass co-combustion <strong>in</strong> cement kilns<br />
The use of alternative fuels <strong>in</strong> the cement<br />
<strong>in</strong>dustry is a long established practice <strong>in</strong> m<strong>an</strong>y<br />
countries. It offers the opportunity to reduce<br />
production costs, to dispose of waste, <strong>an</strong>d <strong>in</strong><br />
some cases to reduce CO2 emissions <strong>an</strong>d fossil<br />
fuel use.<br />
22
BIOMASS<br />
Cement kilns are well-suited for waste<br />
combustion because of their high process<br />
temperature <strong>an</strong>d because the cl<strong>in</strong>ker product <strong>an</strong>d<br />
limestone feedstock act as gas-cle<strong>an</strong><strong>in</strong>g agents.<br />
Used tyres, wood, plastics, chemicals, treated<br />
municipal solid waste <strong>an</strong>d other types of waste<br />
are co-combusted <strong>in</strong> cement kilns <strong>in</strong> large<br />
qu<strong>an</strong>tities. Where fossil fuels are replaced with<br />
alternative fuels that would otherwise have been<br />
<strong>in</strong>c<strong>in</strong>erated or l<strong>an</strong>d filled, this c<strong>an</strong> contribute to<br />
lower overall CO2 emissions. In a survey<br />
conducted by the World Bus<strong>in</strong>ess Council on<br />
Susta<strong>in</strong>able Development <strong>in</strong> 2006, particip<strong>an</strong>ts<br />
reported 10% average use of alternative fuels, of<br />
which 30% was biomass (WBCSD, 2006).<br />
Europe<strong>an</strong> cement m<strong>an</strong>ufacturers derived 3% of<br />
their energy needs from waste fuels <strong>in</strong> 1990 <strong>an</strong>d<br />
17% <strong>in</strong> 2005 (IEA, 2009b). Cement producers <strong>in</strong><br />
Belgium, Fr<strong>an</strong>ce, Germ<strong>an</strong>y, the Netherl<strong>an</strong>ds <strong>an</strong>d<br />
Switzerl<strong>an</strong>d have reached substitution rates<br />
r<strong>an</strong>g<strong>in</strong>g from 35% to more th<strong>an</strong> 80% of the total<br />
energy used (Figure 6). Some <strong>in</strong>dividual pl<strong>an</strong>ts<br />
have achieved 100% substitution of fossil fuels<br />
with waste materials. Waste combustion <strong>in</strong><br />
cement kilns also needs <strong>an</strong> adv<strong>an</strong>ced collection<br />
<strong>in</strong>frastructure <strong>an</strong>d logistics (collection, separation,<br />
quality monitor<strong>in</strong>g, etc.).<br />
If waste materials are more generally to achieve<br />
widespread use <strong>in</strong> cement kilns at high<br />
substitution rates, tailored pre-treatment <strong>an</strong>d<br />
surveill<strong>an</strong>ce systems will be needed. Municipal<br />
solid waste, for example, needs to be screened<br />
<strong>an</strong>d processed to obta<strong>in</strong> consistent calorific<br />
values <strong>an</strong>d feed characteristics. In Europe, the<br />
burn<strong>in</strong>g of alternative fuels <strong>in</strong> cement kilns is<br />
regulated by Europe<strong>an</strong> Directive 2000/76/EC. In<br />
some non-Europe<strong>an</strong> countries the use of<br />
alternative fuels is controversial, because cement<br />
kilns may not be subject to sufficiently str<strong>in</strong>gent<br />
emission controls <strong>an</strong>d regulations. Clear<br />
guidel<strong>in</strong>es <strong>an</strong>d public <strong>in</strong>formation campaigns<br />
could help reduce misconceptions <strong>an</strong>d facilitate<br />
the <strong>in</strong>creased use of waste <strong>in</strong> cement kilns. A<br />
well-designed regulatory framework for waste<br />
m<strong>an</strong>agement is <strong>an</strong> import<strong>an</strong>t factor <strong>in</strong> facilitat<strong>in</strong>g<br />
the use of waste.<br />
Figure 6<br />
Share of alternative fuel use <strong>in</strong> cl<strong>in</strong>ker production by country (IEA, 2008a)<br />
90<br />
80<br />
70<br />
PERCENT<br />
60<br />
50<br />
40<br />
30<br />
20<br />
10<br />
0<br />
Netherl<strong>an</strong>ds<br />
Switzerl<strong>an</strong>d<br />
Austria<br />
Germ<strong>an</strong>y<br />
Norway<br />
Fr<strong>an</strong>ce<br />
Belgium<br />
Sweden<br />
Luxembourg<br />
Czech Republic<br />
Jap<strong>an</strong><br />
United States<br />
C<strong>an</strong>ada<br />
Australia<br />
United K<strong>in</strong>gdom<br />
Denmark<br />
Hungary<br />
F<strong>in</strong>l<strong>an</strong>d<br />
Korea<br />
Italy<br />
Spa<strong>in</strong><br />
Pol<strong>an</strong>d<br />
Greece<br />
Irel<strong>an</strong>d<br />
Portugal<br />
23
RENEWABLE ENERGY IN INDUSTRIAL APPLICATIONS<br />
Figure 7<br />
Alternative fuels roadmap for cement production (IEA <strong>an</strong>d WBCSD, 2009)<br />
100<br />
Estimated alternative fuel use 2006-2050<br />
80<br />
Alternative fuel use (%)<br />
60<br />
40<br />
20<br />
0<br />
16%<br />
5%<br />
2006<br />
40-60% Developed regions 40-60%<br />
10-20% Develop<strong>in</strong>g regions<br />
2030 2050<br />
25-35%<br />
Source: ECRA Technology Papers (2009), Gett<strong>in</strong>g the Numbers Right data 2006 (WBCSD), IEA (2009)<br />
Note: the maximum levels <strong>in</strong> each region depend on competition from other <strong>in</strong>dustries for alternative fuels<br />
Outside the OECD countries, the use of<br />
alternative fuels is not widespread. In develop<strong>in</strong>g<br />
countries, although <strong>in</strong>terest is grow<strong>in</strong>g,<br />
alternative fuel use constitutes only 5% of<br />
cement <strong>in</strong>dustry fuel needs, compared to <strong>an</strong><br />
average of 16% <strong>in</strong> the OECD. This suggests that<br />
there is considerable scope to <strong>in</strong>crease<br />
alternative fuel use globally with benefits both<br />
for profits <strong>an</strong>d for the environment.<br />
Table 2<br />
Economics of thermal applications of biomass gasifiers <strong>in</strong> SMEs<br />
Gasifier unit size Gasifier unit size<br />
(30 kW) (100 kW)<br />
Unit capital costs for gasifiers (USD/kW) 200 146<br />
Total gasifier capital costs (USD) 3750 12,500<br />
For SME units with exist<strong>in</strong>g liquid fuel consumption<br />
Substitution of liquid fuel by biomass (litres/h) 9.4 31.3<br />
Net sav<strong>in</strong>gs (USD/h) 3 9<br />
Payback (months) 6 6<br />
For SME units with exist<strong>in</strong>g solid biomass burn<strong>in</strong>g<br />
Reduction <strong>in</strong> biomass consumption (kg/h) 30 100<br />
Net sav<strong>in</strong>gs (USD/h) 0.8 2.7<br />
Payback (years) 2 2<br />
Note: An average 8 hours of daily operation is assumed for a firm <strong>in</strong> the SME category.<br />
All cost figures <strong>in</strong> the study are <strong>in</strong> 2003 USD.<br />
Source: Gosh et al., 2006<br />
24
BIOMASS<br />
Biomass gasifiers for kilns <strong>an</strong>d furnaces<br />
In India, the use of gasifiers for thermal<br />
applications <strong>in</strong> SMEs offers favourable economic<br />
<strong>an</strong>d f<strong>in</strong><strong>an</strong>cial outcomes across a wide r<strong>an</strong>ge of<br />
different unit capacities <strong>an</strong>d for different<br />
feedstocks such as rice husk <strong>an</strong>d other<br />
agricultural residues. Where gasifiers replace<br />
liquid-fuel use, small (~30 kW) or medium (~100<br />
kW) sized gasifiers have payback periods of the<br />
order of only 6 months, assum<strong>in</strong>g a biomass<br />
supply price of less th<strong>an</strong> 2 USD/GJ (USD 27/t<br />
biomass) (Table 2). However biomass<br />
gasification is still <strong>in</strong> a stage of variation <strong>an</strong>d<br />
there has been no dom<strong>in</strong><strong>an</strong>t design yet (Kirkels<br />
<strong>an</strong>d Verbong, 2010). In most markets it is unable<br />
to compete with other technologies, <strong>an</strong>d<br />
technology st<strong>an</strong>dardization is needed to ensure<br />
proper operation.<br />
C. BIOMASS AS PETROCHEMICAL<br />
FEEDSTOCK<br />
Carbon is also needed for the production of<br />
materials <strong>in</strong> the petrochemical sector, where it<br />
comprises around 75% of the total feedstock.<br />
Olef<strong>in</strong>s (ma<strong>in</strong>ly ethylene, propylene <strong>an</strong>d<br />
butadiene) are typically produced through the<br />
steam crack<strong>in</strong>g of various petrochemical<br />
Table 3<br />
Production capacity for bio-based plastics <strong>in</strong> 2009<br />
feedstocks such as eth<strong>an</strong>e, liquid petroleum gas,<br />
naphtha <strong>an</strong>d gas oil. Naphtha is the ma<strong>in</strong><br />
feedstock for the production of aromatics such as<br />
benzene, toluene <strong>an</strong>d xylenes through reform<strong>in</strong>g.<br />
The ma<strong>in</strong> alternative feedstock to fossil fuels is<br />
likely to be biomass. But waste products, such<br />
as recycled plastics, c<strong>an</strong> also substitute for some<br />
fossil fuel feedstock. Alternatively, org<strong>an</strong>ic<br />
materials such as cellulose fibers, coconut fibers,<br />
starch plastics, fibre boards <strong>an</strong>d paper foams c<strong>an</strong><br />
be produced which c<strong>an</strong> directly substitute for<br />
petrochemical products <strong>in</strong> end use applications,<br />
as described <strong>in</strong> Annex 3. It is also possible to<br />
produce textile materials (ma<strong>in</strong>ly viscose <strong>an</strong>d<br />
acetate) from wood pulp <strong>an</strong>d as by-products<br />
from cotton process<strong>in</strong>g.<br />
The production of ethylene from bioeth<strong>an</strong>ol is<br />
technically relatively straightforward <strong>an</strong>d some<br />
comp<strong>an</strong>ies are already do<strong>in</strong>g it on a large scale.<br />
For example, Braskem is currently produc<strong>in</strong>g<br />
200 000 t of bio ethylene from sugar c<strong>an</strong>e<br />
eth<strong>an</strong>ol, to be polymerised <strong>in</strong>to high density<br />
polyethylene (HDPE) <strong>an</strong>d l<strong>in</strong>ear low density<br />
polyethylene (LLDPE). The current production of<br />
other petrochemical products from bio feedstocks<br />
is set out <strong>in</strong> Table 3.<br />
[kt/yr]<br />
Cellulose plastics (of which at least 1/3 fully bio-based) 4 000<br />
Partially bio-based thermosets 1 000<br />
Partially bio-based starch plastics 323<br />
Polylactic acid (PLA) 229<br />
Ethylene from bio-based eth<strong>an</strong>ol 200<br />
Polyhydroxyalk<strong>an</strong>oates (PHA) 80<br />
PUR from bio-based polyol 13<br />
Partially bio-based PTT 10<br />
Bio-based monomers 10<br />
Bio-based Polyamide (PA) 5<br />
Total 5 870<br />
* fully bio-based unless otherwise stated Source: Shen et al, 2009<br />
25
RENEWABLE ENERGY IN INDUSTRIAL APPLICATIONS<br />
Bio feedstocks are estimated to have the<br />
potential, based on the assumptions <strong>in</strong> GEA<br />
Scenario M, to supply 6.9 EJ/yr of the<br />
petrochemical sector's energy needs <strong>in</strong> 2050<br />
(Figure 8). The achievement of this potential is<br />
likely, however, to be dependent on a number of<br />
factors, <strong>in</strong>clud<strong>in</strong>g the cost <strong>an</strong>d availability of<br />
petrochemical feedstocks which will themselves<br />
be dependent on limitations <strong>in</strong> the ref<strong>in</strong>ery<br />
product mix <strong>an</strong>d ref<strong>in</strong>ery product dem<strong>an</strong>d. 6<br />
The achievement of this potential will require the<br />
use of bio feedstocks <strong>in</strong> the production of a<br />
number of materials <strong>an</strong>d products <strong>an</strong>d through<br />
the substitution of bio-based products for<br />
conventional ones. For example bio-based<br />
polyethylene c<strong>an</strong> be used as a substitute for<br />
polypropylene. Aromatics c<strong>an</strong> also be produced<br />
from biomass feedstocks, particularly from lign<strong>in</strong><br />
which is <strong>an</strong> import<strong>an</strong>t constituent of wood that<br />
may be produced <strong>in</strong> subst<strong>an</strong>tial amounts as a by-<br />
Figure 8<br />
Potential contribution of biomass to the petrochemical feedstock pool (UNIDO <strong>an</strong>alysis)<br />
Potential contribution of biomass to the petrochemical feedstock pool<br />
50<br />
40<br />
30<br />
EJ<br />
20<br />
10<br />
0<br />
2007 2050<br />
non renewable feedstock<br />
bio-feedstock<br />
6<br />
S<strong>in</strong>ce 2005, motor gasol<strong>in</strong>e dem<strong>an</strong>d has been stagnat<strong>in</strong>g worldwide. It is decl<strong>in</strong><strong>in</strong>g <strong>in</strong> OECD countries. This has led to ref<strong>in</strong>ery<br />
overcapacity <strong>in</strong> certa<strong>in</strong> areas. As a result, naphtha has been <strong>in</strong>creas<strong>in</strong>gly available as a low cost petrochemical feedstock. In<br />
these circumst<strong>an</strong>ces, it will be <strong>in</strong>creas<strong>in</strong>gly difficult for bio-feedstocks to compete on availability <strong>an</strong>d cost with surplus naphta. If<br />
the use of naptha for gasol<strong>in</strong>e is constra<strong>in</strong>ed, the potential for biomass as petrochemical feedstock is assumed to be as low as<br />
4% by 2050. But if there were to be <strong>an</strong> <strong>in</strong>crease <strong>in</strong> dem<strong>an</strong>d for naptha, or a widespread conversion of cat-crack<strong>in</strong>g capacity to<br />
hydrocrack<strong>in</strong>g, then the potential dem<strong>an</strong>d for bio feedstocks may be as high as 23% <strong>in</strong> 2050. In a mid-case scenario, bio<br />
feedstocks are estimated to meet 14% of the petrochemical sector's dem<strong>an</strong>d, equivalent to around 7 EJ/yr, <strong>in</strong> 2050.<br />
26
BIOMASS<br />
product if second generation eth<strong>an</strong>ol production<br />
takes off. This would offer new opportunities for<br />
the development of bioref<strong>in</strong>eries.<br />
The most promis<strong>in</strong>g petrochemical biofeedstocks<br />
other th<strong>an</strong> bio-ethylene, are polylactic<br />
acid (PLA) as a substitute for polyethylene<br />
terephthalate (PET) <strong>an</strong>d polystyrene (PS), poly<br />
hydroxy alkaonates (PHA) as a substitute for<br />
high density polyethylene (HDPE), <strong>an</strong>d bio poly<br />
trimethylene terephtalate (PTT), as a substitute<br />
for fossil-based PTT or nylon 6 (Dornburg et al,<br />
2008).<br />
Traditional fossil feedstocks c<strong>an</strong> be substituted<br />
with bio-derived ones at a number of po<strong>in</strong>ts <strong>in</strong><br />
the petrochemical products production cha<strong>in</strong>:<br />
• fossil feedstock c<strong>an</strong> be substituted with a biobased<br />
one (e.g. natural gas c<strong>an</strong> be<br />
substituted with synthetic natural gas from<br />
biomass gasification <strong>an</strong>d subsequent<br />
meth<strong>an</strong>isation);<br />
• petrochemical build<strong>in</strong>g blocks c<strong>an</strong> be<br />
substituted (e.g. ethylene c<strong>an</strong> be substituted<br />
with bio-ethylene);<br />
• traditional plastics c<strong>an</strong> be substituted with a<br />
bio-based substitute (e.g. PET c<strong>an</strong> be<br />
substituted with PLA); or<br />
• a petrochemically produced material c<strong>an</strong> be<br />
substituted with a bio-based material with<br />
similar functional characteristics (e.g. plastic<br />
c<strong>an</strong> be substituted with wood or nylon with<br />
silk).<br />
Several substitution processes are discussed <strong>in</strong><br />
more detail <strong>in</strong> Annex 3.<br />
Worldwide plastics consumption amounts to<br />
approximately 245 Mt/yr. Olef<strong>in</strong>s (ethylene <strong>an</strong>d<br />
propylene) are the most import<strong>an</strong>t feedstock.<br />
The steam crack<strong>in</strong>g of naphtha, eth<strong>an</strong>e <strong>an</strong>d gas<br />
oil is the dom<strong>in</strong><strong>an</strong>t production technology. Large<br />
amounts of aromatics are also produced from<br />
ref<strong>in</strong>ery streams. World-wide, steam crack<strong>in</strong>g<br />
accounts for approximately 3 EJ of f<strong>in</strong>al energy<br />
use <strong>an</strong>d approximately 200 million tonnes of<br />
CO2 emissions. This represents around 20% of<br />
the total f<strong>in</strong>al energy use <strong>an</strong>d about 17% of the<br />
total CO2 emissions from the chemical <strong>an</strong>d<br />
petrochemical sector. A number of new<br />
technologies are be<strong>in</strong>g developed to<br />
m<strong>an</strong>ufacture olef<strong>in</strong>s from natural gas, coal <strong>an</strong>d<br />
biomass. Only those based on biomass offer the<br />
potential to elim<strong>in</strong>ate fossil fuel use <strong>an</strong>d GHG<br />
emissions.<br />
The first chemicals <strong>an</strong>d m<strong>an</strong>-made plastics,<br />
commercialised <strong>in</strong> the 19th century, were made of<br />
bio-based polymers. Most of these materials<br />
were gradually displaced by synthetic polymers<br />
as the petrochemical <strong>in</strong>dustry grew after the<br />
1930s, although some, such as m<strong>an</strong>-made<br />
cellulose fibers, ma<strong>in</strong>ta<strong>in</strong>ed a market niche. In<br />
the last twenty years, bio-based chemicals <strong>an</strong>d<br />
plastics have been receiv<strong>in</strong>g <strong>in</strong>creased attention<br />
as a me<strong>an</strong>s of respond<strong>in</strong>g to problems with<br />
waste m<strong>an</strong>agement (limited capacities <strong>an</strong>d<br />
litter<strong>in</strong>g), high prices for fossil fuels <strong>an</strong>d<br />
feedstocks, questions about the medium- to<br />
long-term supply security of these feedstocks,<br />
technological progress, <strong>an</strong>d policy goals <strong>in</strong>clud<strong>in</strong>g<br />
climate policy.<br />
Bio-based polymers are produced <strong>in</strong> three ma<strong>in</strong><br />
ways:<br />
• by us<strong>in</strong>g natural polymers such as starch <strong>an</strong>d<br />
cellulose which c<strong>an</strong> be modified;<br />
• produc<strong>in</strong>g bio-based monomers by<br />
fermentation or conventional chemistry <strong>an</strong>d<br />
polymeris<strong>in</strong>g them, for example to produce<br />
PLA; or<br />
• produc<strong>in</strong>g bio-based polymers directly <strong>in</strong><br />
microorg<strong>an</strong>isms or <strong>in</strong> genetically modified<br />
crops.<br />
The first of these three production methods is<br />
currently by far the most import<strong>an</strong>t, be<strong>in</strong>g<br />
<strong>in</strong>volved for example <strong>in</strong> the use of starch <strong>in</strong><br />
27
RENEWABLE ENERGY IN INDUSTRIAL APPLICATIONS<br />
paper mak<strong>in</strong>g, <strong>in</strong> m<strong>an</strong>-made cellulose fibers, <strong>an</strong>d<br />
<strong>in</strong> the development of starch polymers. Much is<br />
expected of the future development of the<br />
second option, with the first large-scale pl<strong>an</strong>ts<br />
currently com<strong>in</strong>g <strong>in</strong>to operation. No me<strong>an</strong><strong>in</strong>gful<br />
qu<strong>an</strong>tities are yet produced by the third<br />
production method, although a good deal of<br />
research is be<strong>in</strong>g devoted to it.<br />
In addition to eth<strong>an</strong>ol, a number of basic<br />
chemicals required for adv<strong>an</strong>ced m<strong>an</strong>ufactur<strong>in</strong>g<br />
c<strong>an</strong> be generated from biological sources (Spath<br />
<strong>an</strong>d Dayton, 2003; Werpy et al. 2004). Most<br />
chemical co-products c<strong>an</strong> be created from the<br />
basic chemical build<strong>in</strong>g blocks of sugars <strong>an</strong>d<br />
alcohols. For example:<br />
• Polyols, used <strong>in</strong> a variety of products<br />
<strong>in</strong>clud<strong>in</strong>g <strong>an</strong>tifreeze, plastic bottles, brake<br />
fluid, synthetic fibers, res<strong>in</strong>s, auto bodies, <strong>an</strong>d<br />
sweeteners, c<strong>an</strong> be derived from xylose <strong>an</strong>d<br />
arab<strong>in</strong>ose;<br />
• Us<strong>in</strong>g genetically modified (GM) microorg<strong>an</strong>isms,<br />
glucose c<strong>an</strong> be converted <strong>in</strong>to 3G<br />
(1,3-prop<strong>an</strong>ediol), which c<strong>an</strong> then be used to<br />
m<strong>an</strong>ufacture the polymer 3GT <strong>in</strong> exist<strong>in</strong>g<br />
facilities. 3GT has excellent stretch recovery,<br />
resilience <strong>an</strong>d toughness, <strong>an</strong>d it c<strong>an</strong> be dyed<br />
easily;<br />
• Us<strong>in</strong>g GM bacteria, succ<strong>in</strong>ic acid c<strong>an</strong> be<br />
produced from sugars. This chemical c<strong>an</strong> be<br />
used as a precursor <strong>in</strong> m<strong>an</strong>y <strong>in</strong>dustrial<br />
processes, <strong>an</strong>d c<strong>an</strong> be used <strong>in</strong> the<br />
m<strong>an</strong>ufacture of but<strong>an</strong>ediol, tetrahydrofur<strong>an</strong>,<br />
<strong>an</strong>d other chemicals used <strong>in</strong> the m<strong>an</strong>ufacture<br />
of plastics, pa<strong>in</strong>ts, <strong>in</strong>ks, <strong>an</strong>d food <strong>an</strong>d as a<br />
possible replacement for the benzene class of<br />
commodity petrochemicals (Crawford 2001).<br />
Ten years ago the primary adv<strong>an</strong>tage of biobased<br />
chemicals <strong>an</strong>d polymers lay <strong>in</strong> their<br />
biodegradability. Now non-degradable bio-based<br />
polymers are <strong>in</strong>creas<strong>in</strong>gly be<strong>in</strong>g commercialised<br />
such as bio-based polyethylene, bio-based<br />
polypropylene, blends of petrochemical<br />
polypropylene with starch, <strong>an</strong>d bio-based epoxy<br />
res<strong>in</strong>. It is estimated that bio-based plastics<br />
could replace around 80% of petrochemicalbased<br />
plastics (Shen et al., forthcom<strong>in</strong>g).<br />
The non-renewable energy used <strong>in</strong> the production<br />
of most bio-based chemicals <strong>an</strong>d polymers is<br />
clearly signific<strong>an</strong>tly less th<strong>an</strong> that used <strong>in</strong> the<br />
production of their petrochemical equivalents. The<br />
sav<strong>in</strong>gs are even larger if R&D m<strong>an</strong>ages to<br />
succeed <strong>in</strong> mak<strong>in</strong>g woody biomass<br />
(lignocellulosics) available as feedstock for<br />
biotechnological routes. Even larger sav<strong>in</strong>gs c<strong>an</strong><br />
be obta<strong>in</strong>ed by us<strong>in</strong>g tropical crops (e.g. sugar<br />
c<strong>an</strong>e) <strong>an</strong>d tropical wood types due to the higher<br />
yields <strong>an</strong>d larger amounts of byproduct which c<strong>an</strong><br />
be converted <strong>in</strong>to heat, power or products (Patel<br />
et al., 2006). In the long term, the potential exists<br />
to save around two-thirds of the non-renewable<br />
energy that would be consumed by petrochemical<br />
bulk products, <strong>an</strong>d similar adv<strong>an</strong>tages c<strong>an</strong> be<br />
expected for GHG emissions. Total energy use<br />
(<strong>in</strong>clud<strong>in</strong>g non-renewable <strong>an</strong>d renewable energy)<br />
is <strong>in</strong> some cases higher for bio-based chemicals<br />
<strong>an</strong>d polymers th<strong>an</strong> for comparable petrochemical<br />
products, given the higher efficiency of the<br />
traditional conversion processes.<br />
28
BIOMASS<br />
Box 2: Green tyres<br />
Several lead<strong>in</strong>g tyre m<strong>an</strong>ufacturers are look<strong>in</strong>g to identify alternative, non-fossil based synthetic<br />
rubber for vehicle tyres. Bio-isoprene has been successfully produced by the D<strong>an</strong>ish comp<strong>an</strong>y<br />
Genencor, one of the leaders <strong>in</strong> the production of enzymes for second generation biofuels. The<br />
comp<strong>an</strong>y is prepar<strong>in</strong>g to build a pilot pl<strong>an</strong>t <strong>in</strong> 2011 to brew more bio-isoprene, which it pl<strong>an</strong>s to<br />
sell to Goodyear <strong>an</strong>d other tyre m<strong>an</strong>ufacturers. Goodyear says it expects to have tyres suitable<br />
for road test<strong>in</strong>g <strong>in</strong> mid-2011.<br />
Other major m<strong>an</strong>ufacturers are look<strong>in</strong>g to substitute black carbon filler with silica, fossil process<br />
oil with vegetable oil, <strong>an</strong>d poly-isoprene with chemically modified natural rubber. Through such<br />
substitutions, the Sumitomo Rubber Industries for Dunlop have m<strong>an</strong>aged to reduce the fossil<br />
content <strong>in</strong> the Enasave tyre to only 3%. The Yokohama dB Super E-spec tyre uses chemically<br />
modified natural rubber <strong>an</strong>d process<strong>in</strong>g oil derived from or<strong>an</strong>ge peels shipped from or<strong>an</strong>ge juice<br />
factories, reduc<strong>in</strong>g fossil content of the tyre to 20%. Michel<strong>in</strong> uses sunflower oil <strong>in</strong> its Primacy<br />
MXM4 all-weather tyre.<br />
All these tyres, by reduc<strong>in</strong>g their fossil fuel content, reduce the dem<strong>an</strong>d for oil <strong>in</strong> the<br />
petrochemical sector. They also save further CO2 emissions from the large share of the billion<br />
tyres discarded every year that end up be<strong>in</strong>g burned <strong>in</strong> cement kilns.<br />
29
III. SOLAR THERMAL SYSTEMS<br />
A. SOLAR PROCESS HEAT<br />
The <strong>an</strong>alysis underp<strong>in</strong>n<strong>in</strong>g this paper has<br />
identified the potential for solar thermal sources<br />
to produce 63 EJ of process heat for <strong>in</strong>dustry <strong>in</strong><br />
2050. This potential is shown, by region <strong>an</strong>d by<br />
sector, <strong>in</strong> Figure 9.<br />
From the regional breakdown, it is clear that<br />
most regions have the potential for the<br />
signific<strong>an</strong>t application of solar thermal systems<br />
for process heat production. Regional potentials<br />
are ma<strong>in</strong>ly dependent on the overall<br />
consumption of the selected sectors, on their<br />
dem<strong>an</strong>d for low temperature process heat <strong>an</strong>d,<br />
import<strong>an</strong>tly, on the amount of solar irradiation<br />
available. OECD countries have a large potential<br />
due to their large <strong>in</strong>dustrial energy dem<strong>an</strong>d.<br />
Niches exist <strong>in</strong> several sectors <strong>in</strong> which part of<br />
the low-temperature energy dem<strong>an</strong>d c<strong>an</strong> be<br />
economically supplied by solar thermal systems.<br />
In terms of the sectoral breakdown, the food <strong>an</strong>d<br />
tobacco sector has almost half of the potential,<br />
with the bal<strong>an</strong>ce well spread among other<br />
Figure 9<br />
Regional <strong>an</strong>d sectoral breakdown of solar thermal potential for process heat <strong>in</strong><br />
<strong>in</strong>dustry <strong>in</strong> 2050. UNIDO <strong>an</strong>alysis 7<br />
Non-OECD<br />
Europe<br />
0%<br />
Former Soviet<br />
Union<br />
2%<br />
Africa<br />
3%<br />
Regional breakdown<br />
Other Asia<br />
13%<br />
Lat<strong>in</strong> America<br />
15%<br />
5.62 EJ <strong>in</strong> 2050<br />
OECD Total<br />
35%<br />
Middle East<br />
0%<br />
Sectoral breakdown<br />
M<strong>in</strong><strong>in</strong>g <strong>an</strong>d<br />
quarry<strong>in</strong>g<br />
16%<br />
Textile <strong>an</strong>d<br />
leather<br />
13%<br />
5.62 EJ <strong>in</strong> 2050<br />
Tr<strong>an</strong>sport<br />
equipment<br />
5%<br />
Food <strong>an</strong>d<br />
tobacco<br />
46%<br />
Ch<strong>in</strong>a<br />
32%<br />
Mach<strong>in</strong>ery<br />
20%<br />
7<br />
Figures are <strong>in</strong> useful energy terms, after account<strong>in</strong>g for efficiency losses <strong>in</strong> solar p<strong>an</strong>els <strong>an</strong>d distribution systems<br />
30
SOLAR THERMAL SYSTEMS<br />
sectors. This is particularly import<strong>an</strong>t for<br />
develop<strong>in</strong>g <strong>an</strong>d least developed countries, where<br />
the development <strong>an</strong>d modernisation of the food<br />
<strong>in</strong>dustry has a critical role to play <strong>in</strong> terms of<br />
food security. Solar thermal systems c<strong>an</strong> help<br />
develop<strong>in</strong>g countries to stabilise food prices by<br />
reduc<strong>in</strong>g their connection to the volatile prices of<br />
oil <strong>an</strong>d other energy commodities.<br />
Unlike biomass, where resource availability may<br />
limit the potential <strong>an</strong>d raise susta<strong>in</strong>ability<br />
concerns, solar has <strong>an</strong> almost unlimited resource<br />
potential. Estimates of the theoretical potential of<br />
different configuration <strong>an</strong>d radiation levels shown<br />
<strong>in</strong> Table 4 8 .<br />
This shows that, where good solar radiation is<br />
available, solar thermal technologies for <strong>in</strong>dustrial<br />
process heat are very close to break even. The<br />
Table shows average figures. In m<strong>an</strong>y specific<br />
cases where the cost of the reference energy unit<br />
is higher or where locally m<strong>an</strong>ufactured solar<br />
thermal systems are cheaper, solar thermal<br />
technologies are already cost effective without<br />
<strong>an</strong>y need for subsidies. In areas with lower solar<br />
radiation, such as <strong>in</strong> central Europe, solar thermal<br />
Table 4<br />
Investment <strong>an</strong>d generation costs for solar thermal for <strong>in</strong>dustrial process heat - 2007 9<br />
General Cost<br />
US$/MWh<br />
Investment Cost<br />
thous<strong>an</strong>ds US$/MW<br />
Case 1: 2000kWh/m 2 /year current 57 450<br />
storage break even 50 350<br />
Case 2: 1200kWh/m 2 /year current 94 450<br />
daily storage break even 50 238<br />
Case 3: 1200kWh/m 2 year current 90 765<br />
seasonal storage break even 60 508<br />
Case 4: 2000 kWh/m 2 /year current 137 1,450<br />
<strong>in</strong>clud<strong>in</strong>g cool<strong>in</strong>g break even 80 847<br />
solar energy are <strong>in</strong> the r<strong>an</strong>ge of millions of EJ/yr<br />
(e.g. 3.9 million EJ/yr). This is hundreds of<br />
thous<strong>an</strong>ds of times larger th<strong>an</strong> the current world<br />
total primary energy supply of 503 EJ <strong>in</strong> 2007<br />
(IEA statistics). The quality of the resource, i.e.<br />
the <strong>in</strong>solation rate, however, depends on latitude<br />
<strong>an</strong>d climatological conditions.<br />
An <strong>an</strong>alysis of several sources suggests the<br />
current generation <strong>an</strong>d <strong>in</strong>vestment costs for<br />
technologies need subst<strong>an</strong>tial cost reductions to<br />
become competitive. In some specific markets,<br />
taxes on fossil fuels or subsidies for renewable<br />
energy make solar thermal competitive already<br />
today even <strong>in</strong> areas of low solar radiation.<br />
Although solar cool<strong>in</strong>g is still <strong>in</strong> <strong>an</strong> early<br />
demonstration stage, <strong>in</strong> countries with stable<br />
solar radiation <strong>an</strong>d unstable, expensive electricity,<br />
solar cool<strong>in</strong>g may become a viable alternative to<br />
electric chillers <strong>in</strong> the next ten years.<br />
8<br />
The most comprehensive <strong>an</strong>d recent survey is the IEA's Solar Heat<strong>in</strong>g <strong>an</strong>d Cool<strong>in</strong>g brochure (2009) at<br />
http://www.iea.org/papers/2009/Solar_heat<strong>in</strong>g_cool<strong>in</strong>g.pdf<br />
9<br />
Assum<strong>in</strong>g, based on IEA data on capacity <strong>an</strong>d production, a world average load factor for 2007 of 605 full load hours/yr, a 7%<br />
<strong>in</strong>terest rate, <strong>an</strong>d a capital recovery factor of 9%. O&M costs, <strong>in</strong> USD/MWh/year, are 2.5% of the ratio between <strong>in</strong>vestment costs<br />
<strong>an</strong>d full load hours.<br />
31
RENEWABLE ENERGY IN INDUSTRIAL APPLICATIONS<br />
In <strong>in</strong>dustry, five sectors use a signific<strong>an</strong>t<br />
proportion of their process heat at temperatures<br />
lower th<strong>an</strong> 400 o C, <strong>an</strong>d are therefore likely to<br />
have a strong potential for solar thermal to meet<br />
their process heat needs. These are tr<strong>an</strong>sport<br />
equipment, mach<strong>in</strong>ery, m<strong>in</strong><strong>in</strong>g <strong>an</strong>d quarry<strong>in</strong>g,<br />
food <strong>an</strong>d tobacco, <strong>an</strong>d textiles <strong>an</strong>d leather<br />
(Figure 10). M<strong>an</strong>y processes <strong>an</strong>d activities that<br />
are common to these sectors c<strong>an</strong> benefit from<br />
the implementation of solar thermal systems.<br />
These <strong>in</strong>clude: wash<strong>in</strong>g, pre-heat<strong>in</strong>g of boilers<br />
feed water <strong>an</strong>d space heat<strong>in</strong>g <strong>in</strong> <strong>in</strong>dustrial<br />
build<strong>in</strong>gs.<br />
solar radiation conditions <strong>an</strong>d achiev<strong>in</strong>g<br />
sufficiently high temperature levels needed for<br />
the most likely applications, boil<strong>in</strong>g <strong>an</strong>d<br />
distill<strong>in</strong>g. So far there is only very limited<br />
experience with solar thermal energy <strong>in</strong> this<br />
sector or at this scale. This makes <strong>an</strong> accurate<br />
estimate of the potential difficult at this stage.<br />
In 2006, 7 of the identified 85 potential<br />
applications for solar thermal <strong>in</strong> <strong>in</strong>dustry were <strong>in</strong><br />
the chemical sector (ESTIF, 2006). In 2007, heat<br />
dem<strong>an</strong>d <strong>in</strong> the chemical <strong>in</strong>dustry was around<br />
11 EJ/yr. Around half of this (5.7 EJ/yr) is<br />
estimated as be<strong>in</strong>g below 400oC <strong>an</strong>d 20%<br />
Figure 10<br />
Low <strong>an</strong>d medium temperature process heat dem<strong>an</strong>d by sector (Taibi 2010)<br />
100%<br />
90%<br />
1.5 EJ 4.5 EJ 2.6 EJ 6.4 EJ 2.3 EJ<br />
80%<br />
70%<br />
60%<br />
50%<br />
40%<br />
30%<br />
20%<br />
10%<br />
0%<br />
Tr<strong>an</strong>sport equipment Mach<strong>in</strong>ery M<strong>in</strong><strong>in</strong>g <strong>an</strong>d quarry<strong>in</strong>g Food <strong>an</strong>d tobacco Textile <strong>an</strong>d leather<br />
Below 60 C 60 - 100 C 100 - 160 C 160 - 400 C<br />
The chemical sector has also a high potential for<br />
solar thermal, but generally on a very large scale.<br />
Cost reductions <strong>in</strong> CSP technologies, comb<strong>in</strong>ed<br />
with the growth <strong>in</strong> the production of chemicals <strong>in</strong><br />
Africa <strong>an</strong>d Middle East, suggest grow<strong>in</strong>g scope<br />
for the development of solar thermal applications<br />
<strong>in</strong> the chemical sector. The ma<strong>in</strong> barriers to the<br />
greater use of solar thermal <strong>in</strong> this sector are the<br />
scale of the area needed for solar collectors,<br />
(2.3 EJ/yr) below 100oC. If half of this process<br />
heat dem<strong>an</strong>d were to be met <strong>in</strong> areas where<br />
direct natural <strong>in</strong>solation is sufficient to justify the<br />
use of CSP technologies, the potential for the<br />
use of solar thermal technologies <strong>in</strong> the chemical<br />
sector <strong>in</strong> 2050 would be around 2.4 EJ/yr. This<br />
would <strong>in</strong>crease the total estimated potential for<br />
solar thermal <strong>in</strong> <strong>in</strong>dustrial applications <strong>in</strong> 2050<br />
from 5.6 EJ/yr to around 8 EJ/yr.<br />
32
SOLAR THERMAL SYSTEMS<br />
Figure 11<br />
Parabolic trough field, El NASR Pharmaceutical Chemicals, Egypt<br />
(Weiss <strong>an</strong>d Mauthner, 2010)<br />
Different solar technologies have different<br />
<strong>in</strong>vestment costs per unit of capacity, <strong>an</strong>d<br />
different levels of capability <strong>in</strong> terms of thermal<br />
output. Flat plate collectors are the cheapest<br />
technology, but they c<strong>an</strong> only be used to heat<br />
loads to around 70oC. Vacuum tubes or parabolic<br />
mirrors <strong>in</strong> comb<strong>in</strong>ation with a suitable heat<br />
energy carrier c<strong>an</strong> reach 120oC to 400oC.<br />
Successful tests have been carried out us<strong>in</strong>g<br />
solar energy to achieve temperatures sufficient to<br />
produce pure metals from ore. But the cost <strong>an</strong>d<br />
technical challenges <strong>in</strong>volved <strong>in</strong> upscal<strong>in</strong>g these<br />
tests make the widespread application of solar<br />
heat at temperature levels above 400oC unlikely<br />
before 2050.<br />
Given the profile of temperature needs <strong>in</strong><br />
<strong>in</strong>dustry (Figure 12), most process heat dem<strong>an</strong>d<br />
c<strong>an</strong> be met us<strong>in</strong>g relatively low cost flat plate<br />
<strong>an</strong>d vacuum tube collectors. Only 8% (0.5 EJ/yr)<br />
of the estimated 5.6 EJ/yr of solar thermal energy<br />
<strong>in</strong> 2050 will require the use of CSP technologies;<br />
the rest c<strong>an</strong> be achieved us<strong>in</strong>g flat p<strong>an</strong>e<br />
collectors <strong>an</strong>d evacuated tube collectors.<br />
The economic competitiveness of solar thermal<br />
energy <strong>in</strong> <strong>in</strong>dustry will be very positively affected<br />
by high carbon prices. Among renewable<br />
technologies, solar has <strong>an</strong> adv<strong>an</strong>tage over<br />
bioenergy as it is not exposed to feedstock price<br />
volatility. To <strong>in</strong>crease competitiveness, the capital<br />
cost of solar technologies needs to be reduced<br />
through learn<strong>in</strong>g, start<strong>in</strong>g with the deployment of<br />
solar thermal systems <strong>in</strong> selected sectors <strong>in</strong><br />
regions where solar radiation is abund<strong>an</strong>t <strong>an</strong>d as<br />
const<strong>an</strong>t as possible throughout the year, such<br />
as for example <strong>in</strong> the dairy sector <strong>in</strong> India<br />
(discussed further <strong>in</strong> Annex 4). The deployment<br />
of solar thermal systems where they are already<br />
competitive today will facilitate the diffusion of<br />
economically attractive, reliable, <strong>in</strong>dustrial-scale<br />
solar thermal systems to other regions <strong>an</strong>d<br />
sectors, as learn<strong>in</strong>g effects <strong>an</strong>d economies of<br />
scale come <strong>in</strong>to play.<br />
33
RENEWABLE ENERGY IN INDUSTRIAL APPLICATIONS<br />
The ma<strong>in</strong> competitors for solar thermal systems<br />
will be heat pumps. Heat pumps operate <strong>in</strong><br />
similar low-temperature r<strong>an</strong>ges. Like solar<br />
technologies, the lower the temperature <strong>in</strong>crease<br />
they have to provide, the more efficient they are.<br />
In general, the relative competitiveness of these<br />
two technologies <strong>in</strong> <strong>an</strong>y specific situation will<br />
depend on a bal<strong>an</strong>ce between the ma<strong>in</strong> factors<br />
underp<strong>in</strong>n<strong>in</strong>g each technology, i.e. on the bal<strong>an</strong>ce<br />
between available solar radiation <strong>an</strong>d local<br />
electricity costs. By 2050, the competitiveness of<br />
the two technologies is expected to be<br />
determ<strong>in</strong>ed by regional considerations as much<br />
as by sectoral ones.<br />
Solar thermal technologies will need to be<br />
implemented widely if they are to become<br />
radiation. Such deployment is already cost<br />
effective today. As further such <strong>in</strong>vestments are<br />
made, the cost of solar thermal systems should<br />
reduce, mak<strong>in</strong>g them progressively more<br />
economically viable <strong>in</strong> other less favourable<br />
conditions.<br />
To achieve the projected 5.6 EJ/yr <strong>in</strong> 2050, the<br />
solar capacity needed by the <strong>in</strong>dustrial sector<br />
would be over 2 500 gigawatt hours (GWth),<br />
assum<strong>in</strong>g current levels of full load at 605<br />
hr/year <strong>an</strong>d that learn<strong>in</strong>g effects are achieved<br />
only <strong>in</strong> the <strong>in</strong>dustrial sector. Depend<strong>in</strong>g on the<br />
lifetime of the systems <strong>an</strong>d on the rate of their<br />
diffusion, the total cumulative capacity that will<br />
need to be <strong>in</strong>stalled by 2050 would be <strong>in</strong> the<br />
r<strong>an</strong>ge of 3 500 GWth. At the current learn<strong>in</strong>g rate<br />
Table 5<br />
Break even <strong>an</strong>alysis <strong>an</strong>d learn<strong>in</strong>g <strong>in</strong>vestments for solar thermal <strong>in</strong> <strong>in</strong>dustry 10<br />
Break even Total cost of reach<strong>in</strong>g Learn<strong>in</strong>g<br />
cumulative capacity Break even <strong>in</strong>vestment<br />
GW Billion US$ Billion US$<br />
Case 1: 2000kWh/m 2 /year 252 34 2<br />
daily storage<br />
Case 2: 2000kWh/m 2 /year 1,235 320 67<br />
daily storage<br />
Case 3: 2000kWh/m 2 /year 609 264 41<br />
seasonal storage<br />
Case 4: 2000kWh/m 2 /year 908 769 144<br />
<strong>in</strong>clud<strong>in</strong>g cool<strong>in</strong>g<br />
competitive with conventional process heat<br />
production (Table 5). The cases describe different<br />
levels of <strong>in</strong>solation <strong>an</strong>d different storage<br />
approaches. As with other technologies, there are<br />
clearly adv<strong>an</strong>tages <strong>in</strong> deploy<strong>in</strong>g early systems<br />
where they are most effective, i.e. <strong>in</strong>itially on<br />
simple systems <strong>in</strong> areas with abund<strong>an</strong>t solar<br />
of 20%, solar thermal would be expected to<br />
break even <strong>in</strong> most potential applications, even<br />
<strong>in</strong> temperate climates us<strong>in</strong>g seasonal storage for<br />
solar cool<strong>in</strong>g. (Table 6). Given that, <strong>in</strong> 2008, the<br />
total capacity of solar thermal <strong>in</strong>stallations was<br />
only 171 GWth, this will require a major<br />
<strong>in</strong>vestment programme.<br />
10<br />
Table 5 is based on the same assumptions <strong>an</strong>d calculation methodology as Table 4. The full load hours (<strong>in</strong> hours/yr) for the<br />
four cases are: 750, 450, 800 (with the benefit of seasonal storage) <strong>an</strong>d 1000 (benefit<strong>in</strong>g from a good match between the load<br />
curve for cool<strong>in</strong>g <strong>an</strong>d peak production from solar thermal systems).<br />
34
SOLAR THERMAL SYSTEMS<br />
Table 6<br />
Investment <strong>an</strong>d generation costs for solar thermal for <strong>in</strong>dustrial process heat - 2050<br />
General Cost<br />
US$/MWh<br />
Investment Cost<br />
thous<strong>an</strong>ds US$/MW<br />
Case 1: 2000kWh/m 2 /year 2050 21 170<br />
storage break even 50 397<br />
Case 2: 1200kWh/m 2 /year 2050 36 170<br />
daily storage break even 50 238<br />
Case 3: 1200kWh/m 2 year 2050 34 289<br />
seasonal storage break even 60 508<br />
Case 4: 2000 kWh/m 2 /year 2050 52 549<br />
<strong>in</strong>clud<strong>in</strong>g cool<strong>in</strong>g break even 80 847<br />
For the calculation of 2050 supply cost curves<br />
(Figure 12), the feasible temperature limit for solar<br />
thermal is set at 100oC. This is a conservative<br />
assumption. There are already pilot systems, such<br />
as the ARUN solar concentrator dish <strong>in</strong> India, that<br />
produce solar thermal process heat at<br />
temperatures up to 250oC (as described <strong>in</strong><br />
Annex 4). The cost per unit of energy produced is<br />
calculated on a regional basis. The potential is<br />
based on the proportion of the process heat<br />
dem<strong>an</strong>d of each <strong>in</strong>dustrial sector that is less th<strong>an</strong><br />
60oC for 2007 <strong>an</strong>d less th<strong>an</strong> 100oC for 2050.<br />
Similar cost curves have also been developed for<br />
the other four <strong>in</strong>dustrial sectors <strong>in</strong> this <strong>an</strong>alysis.<br />
Each of them illustrates how the potential for<br />
solar thermal technologies <strong>in</strong> <strong>in</strong>dustrial<br />
applications is distributed among regions <strong>an</strong>d<br />
temperature levels, show<strong>in</strong>g the cost of useful<br />
energy for each of them. This cost c<strong>an</strong> be<br />
compared with the local energy market<br />
conditions for currently used fuels to evaluate<br />
the economical feasibility of <strong>in</strong>vest<strong>in</strong>g <strong>in</strong> solar<br />
thermal systems <strong>in</strong> specific <strong>in</strong>dustrial sectors <strong>an</strong>d<br />
processes.<br />
B. SOLAR COOLING<br />
The chemical <strong>an</strong>d petrochemical <strong>an</strong>d food <strong>an</strong>d<br />
tobacco sectors are the largest <strong>in</strong>dustrial users of<br />
process cool<strong>in</strong>g. Most of the cool<strong>in</strong>g <strong>in</strong> both<br />
sectors is currently done with electric chillers.<br />
The ma<strong>in</strong> alternative, especially <strong>in</strong> the chemical<br />
<strong>an</strong>d petrochemical sector, is natural gas powered<br />
absorption chillers.<br />
Data from the United States <strong>Energy</strong> Information<br />
Agency's M<strong>an</strong>ufactur<strong>in</strong>g <strong>Energy</strong> Consumption<br />
Survey (MECS) <strong>in</strong>dicates that process cool<strong>in</strong>g<br />
accounts for 8.5% of the total power dem<strong>an</strong>d of<br />
the global chemical <strong>in</strong>dustry <strong>an</strong>d for 12.5% of the<br />
global dem<strong>an</strong>d of the petrochemical <strong>in</strong>dustry 11 . It<br />
is unlikely, however, that much of this dem<strong>an</strong>d<br />
c<strong>an</strong> be met by solar cool<strong>in</strong>g, given the very low<br />
temperatures required by chemical processes <strong>an</strong>d<br />
the relatively high energy dem<strong>an</strong>ds of <strong>in</strong>dividual<br />
facilities. These characteristics are difficult to<br />
meet with solar thermal systems, given the large<br />
areas of solar p<strong>an</strong>el that would be needed to<br />
deliver them.<br />
This leaves only one sector with a good potential<br />
for solar process cool<strong>in</strong>g, the food <strong>an</strong>d tobacco<br />
sector. Accord<strong>in</strong>g to the MECS, process cool<strong>in</strong>g <strong>in</strong><br />
the food <strong>an</strong>d tobacco sector accounts for 27% of<br />
the sector's electricity dem<strong>an</strong>d, equivalent to 6%<br />
of the sector's total f<strong>in</strong>al energy dem<strong>an</strong>d. On this<br />
basis, the total process cool<strong>in</strong>g dem<strong>an</strong>d for the<br />
food <strong>an</strong>d tobacco sector is estimated <strong>in</strong> 2007 to<br />
11<br />
http://www.eia.doe.gov/emeu/mecs/mecs2006/2006tables.html<br />
35
RENEWABLE ENERGY IN INDUSTRIAL APPLICATIONS<br />
have been less th<strong>an</strong> 0.4 EJ/year worldwide.<br />
Although solar cool<strong>in</strong>g c<strong>an</strong> play <strong>an</strong> import<strong>an</strong>t<br />
part <strong>in</strong> niche applications <strong>in</strong> the <strong>in</strong>dustry, for<br />
example <strong>in</strong> cool<strong>in</strong>g greenhouses, it is unlikely to<br />
offer the potential to achieve signific<strong>an</strong>t sav<strong>in</strong>gs<br />
<strong>in</strong> fossil fuel use or GHG emissions. Further<br />
details on the technologies <strong>an</strong>d their potential<br />
c<strong>an</strong> be found <strong>in</strong> Annex 4.<br />
Figure 12<br />
Supply cost curve for solar thermal <strong>in</strong> the food <strong>an</strong>d tobacco sector. UNDIO <strong>an</strong>alysis.<br />
Cost (US$/GJ)<br />
35<br />
30<br />
25<br />
20<br />
15<br />
Africa < 60 C 15<br />
Middle East < 60 C 16<br />
Lat<strong>in</strong> America < 60 C 17<br />
Ch<strong>in</strong>a < 60 C<br />
18<br />
Food <strong>an</strong>d Tobacco - supply cost curve 2007<br />
Other Asia < 60 C 20<br />
Africa 60 - 100 C 21<br />
Mid dle East 60 - 100 C 22<br />
OECD Total < 60 C<br />
23<br />
Lat<strong>in</strong> America 60 - 100 C 23<br />
Ch<strong>in</strong>a 60 - 100 C 24<br />
Non-OECD Europe < 60 C 25<br />
Former Soviet Union < 60 C 26<br />
Other Asia 60 - 100 C 27<br />
OECD Total 60 - 100 C<br />
29<br />
Non-OECD Europe 60 - 100 C 32<br />
Former Soviet Union 60 - 100 C 33<br />
10<br />
5<br />
0<br />
0<br />
100<br />
200<br />
300<br />
400<br />
500<br />
600<br />
700<br />
800<br />
900<br />
1000<br />
1100<br />
1200<br />
1300<br />
1400<br />
1500<br />
1600<br />
1700<br />
1800<br />
1900<br />
2000<br />
2100<br />
2200<br />
2300<br />
2400<br />
potential (PJ)<br />
Cost (US$/GJ)<br />
14<br />
12<br />
10<br />
8<br />
6<br />
Lat<strong>in</strong> America < 60 C 6<br />
Middle East < 60 C 6<br />
Africa < 60 C 6<br />
Ch<strong>in</strong>a < 60 C<br />
7<br />
Food <strong>an</strong>d Tobacco - supply cost curve 2050<br />
Other Asia < 60 C 8<br />
Lat<strong>in</strong> America 60 - 100 C 8<br />
Africa 60 - 100 C 8<br />
Middle East 60 - 100 C 8<br />
OECD Total < 60 C<br />
8<br />
Ch<strong>in</strong>a 60 - 100 C 9<br />
Former Soviet Union < 60 C 9<br />
Non-OECD Europe < 60 C 9<br />
Other Asia 60 - 100 C 10<br />
OECD Total 60 - 100 C<br />
11<br />
Former Soviet Union 60 - 100 C 12<br />
Non-OECD Europe 60 - 100 C 12<br />
4<br />
2<br />
0<br />
0<br />
100<br />
200<br />
300<br />
400<br />
500<br />
600<br />
700<br />
800<br />
900<br />
1000<br />
1100<br />
1200<br />
1300<br />
1400<br />
1500<br />
1600<br />
1700<br />
1800<br />
1900<br />
2000<br />
2100<br />
2200<br />
2300<br />
2400<br />
2500<br />
2600<br />
2700<br />
2800<br />
2900<br />
3000<br />
3100<br />
3200<br />
3300<br />
3400<br />
3500<br />
3600<br />
3700<br />
3800<br />
3900<br />
potential (PJ)<br />
36
IV. HEAT PUMPS<br />
A. HEAT PUMPS FOR<br />
PROCESS HEAT<br />
Heat pumps c<strong>an</strong> take heat from the environment<br />
or from waste heat streams <strong>an</strong>d supply it to<br />
<strong>in</strong>dustrial applications without the need to burn<br />
<strong>an</strong>y fuel. In applications where the pump<strong>in</strong>g<br />
energy <strong>in</strong>put is <strong>in</strong> the form of electricity produced<br />
from renewable energy sources, heat pumps are<br />
a fully renewable energy technology. Where the<br />
electricity is generated from fossil fuels, only part<br />
of the energy output of heat pumps c<strong>an</strong> be<br />
regarded as renewable (Figure 13). So, for<br />
example, if the electricity comes from fossil fuel<br />
generation with <strong>an</strong> efficiency of 40%, the<br />
coefficient of perform<strong>an</strong>ce 12 of the heat pump<br />
needs to be higher th<strong>an</strong> 2.5 if the pump is to<br />
save primary energy <strong>an</strong>d be considered as<br />
provid<strong>in</strong>g renewable heat. The amount of useful<br />
heat provided must be higher th<strong>an</strong> the primary<br />
energy consumed.<br />
Figure 13<br />
Calculation of the renewable energy contribution of a heat pump, accord<strong>in</strong>g to the<br />
Europe<strong>an</strong> <strong>Renewable</strong> <strong>Energy</strong> Directive<br />
12<br />
The coefficient of perform<strong>an</strong>ce is the ratio of useful output energy <strong>an</strong>d useful <strong>in</strong>put energy under st<strong>an</strong>dardized test<strong>in</strong>g conditions<br />
37
RENEWABLE ENERGY IN INDUSTRIAL APPLICATIONS<br />
Box 3: Adv<strong>an</strong>tages <strong>an</strong>d disadv<strong>an</strong>tages of us<strong>in</strong>g<br />
heat pumps <strong>in</strong> <strong>in</strong>dustrial applications<br />
Current disadv<strong>an</strong>tages of <strong>in</strong>dustrial heat pumps<br />
o<br />
o<br />
o<br />
o<br />
Lack of refriger<strong>an</strong>ts <strong>in</strong> the relev<strong>an</strong>t temperature r<strong>an</strong>ge;<br />
Lack of experimental <strong>an</strong>d demonstration pl<strong>an</strong>ts;<br />
User uncerta<strong>in</strong>ty about the reliability of heat pumps;<br />
Lack of necessary knowledge among designers <strong>an</strong>d consult<strong>in</strong>g eng<strong>in</strong>eers about heat pump<br />
technologies <strong>an</strong>d their application.<br />
Current adv<strong>an</strong>tages of <strong>in</strong>dustrial heat pumps<br />
o High coefficients of perform<strong>an</strong>ce (COP) <strong>in</strong> applications requir<strong>in</strong>g a low temperature lift <strong>an</strong>d/or<br />
operat<strong>in</strong>g <strong>in</strong> high ambient temperatures;<br />
o Long <strong>an</strong>nual operat<strong>in</strong>g time;<br />
o Relatively low <strong>in</strong>vestment cost, due to large units <strong>an</strong>d small dist<strong>an</strong>ces between the heat<br />
source <strong>an</strong>d heat s<strong>in</strong>k;<br />
o Waste heat production <strong>an</strong>d heat dem<strong>an</strong>d occur at the same time.<br />
Source: Jakobs, 2010<br />
The <strong>an</strong>alysis underp<strong>in</strong>n<strong>in</strong>g this paper has identified the potential for heat pumps to meet 4.87 EJ/yr of<br />
<strong>in</strong>dustry's process heat dem<strong>an</strong>ds <strong>in</strong> 2050, as shown <strong>in</strong> Figure 14 by region <strong>an</strong>d by sector.<br />
Figure 14<br />
Regional <strong>an</strong>d sectoral breakdown of the heat pump potential for process heat <strong>in</strong><br />
<strong>in</strong>dustry <strong>in</strong> 2050. UNIDO <strong>an</strong>alysis.<br />
Regional breakdown<br />
Sectoral breakdown<br />
Non-OECD<br />
Europe<br />
2%<br />
Africa<br />
0%<br />
Other Asia<br />
4%<br />
Lat<strong>in</strong> America<br />
3%<br />
Former Soviet<br />
Union<br />
15%<br />
Ch<strong>in</strong>a<br />
16%<br />
4.87 EJ <strong>in</strong> 2050<br />
OECD Total<br />
60%<br />
Middle East<br />
0%<br />
Tr<strong>an</strong>sport<br />
equipment<br />
7%<br />
Textile <strong>an</strong>d<br />
leather<br />
10%<br />
M<strong>in</strong><strong>in</strong>g <strong>an</strong>d<br />
quarry<strong>in</strong>g<br />
17%<br />
4.87 EJ <strong>in</strong> 2050<br />
Food <strong>an</strong>d<br />
tobacco<br />
43%<br />
Mach<strong>in</strong>ery<br />
23%<br />
38
HEAT PUMPS<br />
OECD countries have <strong>an</strong> import<strong>an</strong>t role to play <strong>in</strong><br />
the potential deployment of heat pumps for<br />
<strong>in</strong>dustrial process heat. This reflects the fact that<br />
most OECD countries already have reliable<br />
electricity grids which deliver electricity at<br />
competitive prices. The high efficiency of electric<br />
<strong>in</strong>dustrial heat pumps makes this technology<br />
competitive with solar thermal technologies<br />
where electricity prices are low <strong>an</strong>d solar<br />
radiation is less th<strong>an</strong> optimum, conditions which<br />
describe m<strong>an</strong>y of the regions where OECD<br />
<strong>in</strong>dustrial production is located.<br />
Two other factors, the capital cost of the<br />
equipment <strong>an</strong>d its perform<strong>an</strong>ce, are also<br />
import<strong>an</strong>t <strong>in</strong> determ<strong>in</strong><strong>in</strong>g the competitiveness of<br />
heat pumps. Perform<strong>an</strong>ce is expressed <strong>in</strong> terms<br />
of the number of units of energy the heat pump<br />
c<strong>an</strong> move from the lower temperature of the<br />
source to the higher temperature needed, us<strong>in</strong>g<br />
one unit of electricity. In most normal operat<strong>in</strong>g<br />
conditions, the amount of electricity required is<br />
considerably less th<strong>an</strong> the amount of heat<br />
provided, particularly <strong>in</strong> applications dem<strong>an</strong>d<strong>in</strong>g<br />
relatively low temperature process heat. The ma<strong>in</strong><br />
thermodynamically limit<strong>in</strong>g factor <strong>in</strong> the use of<br />
heat pumps for high temperature process heat,<br />
however, is that their perform<strong>an</strong>ce decreases the<br />
greater the difference <strong>in</strong> temperature between the<br />
<strong>in</strong>put source <strong>an</strong>d the output dem<strong>an</strong>ded. So heat<br />
pumps are more efficient <strong>in</strong> deliver<strong>in</strong>g low<br />
temperature process heat dem<strong>an</strong>ds. And air heat<br />
pumps are more efficient <strong>in</strong> warmer climates. This<br />
factor has been taken <strong>in</strong>to account <strong>in</strong> <strong>an</strong>alys<strong>in</strong>g<br />
the cost of the process heat <strong>in</strong> <strong>in</strong>dividual<br />
regions.<br />
Supply cost curves have been calculated for 2007<br />
<strong>an</strong>d 2050 for the same temperature r<strong>an</strong>ge<br />
categories as <strong>in</strong> the supply cost curve for solar<br />
thermal, us<strong>in</strong>g the cost per unit of useful energy<br />
based on the cost of electricity, <strong>an</strong> <strong>in</strong>dicative<br />
capital cost of the heat pump <strong>an</strong>d its<br />
perform<strong>an</strong>ce coefficient. The perform<strong>an</strong>ce<br />
coefficient of pumps decreases as the<br />
temperature lift <strong>in</strong>creases. It is much lower for<br />
the 60o - 100oC r<strong>an</strong>ge th<strong>an</strong> for temperature lifts<br />
less th<strong>an</strong> 60oC. Electricity costs are taken from<br />
the IEA <strong>Energy</strong> Prices <strong>an</strong>d Taxes database, us<strong>in</strong>g<br />
the data for the f<strong>in</strong>al price of electricity for the<br />
<strong>in</strong>dustrial sector. For those regions not <strong>in</strong> the<br />
database, the data of a representative country<br />
have been used as a proxy, notwithst<strong>an</strong>d<strong>in</strong>g the<br />
very signific<strong>an</strong>t differences <strong>in</strong> electricity prices<br />
among different countries <strong>in</strong> the same region. For<br />
those countries for which historical data are<br />
miss<strong>in</strong>g, a 2007 figure has been calculated us<strong>in</strong>g<br />
the OECD price <strong>in</strong> 1996 as base <strong>an</strong>d rescal<strong>in</strong>g as<br />
a proportion of the OECD 2007 figure. The<br />
result<strong>in</strong>g cost curve for the food <strong>an</strong>d tobacco<br />
sector, as <strong>an</strong> example, is shown <strong>in</strong> Figure 15.<br />
The curve for 2050 has been created us<strong>in</strong>g<br />
reduced capital costs, <strong>in</strong>creased perform<strong>an</strong>ces<br />
<strong>an</strong>d more homogeneous electricity prices, r<strong>an</strong>g<strong>in</strong>g<br />
from USD 12 to USD 24/GJ (real terms 2007<br />
prices).<br />
Heat pumps c<strong>an</strong> already provide a competitive<br />
alternative to fossil fuels for low temperature<br />
process heat <strong>in</strong> several regions. One of the<br />
driv<strong>in</strong>g factors, for example <strong>in</strong> Ch<strong>in</strong>a, is the<br />
availability of cheap electricity. But where this<br />
electricity is generated by low-efficiency or coalfired<br />
power pl<strong>an</strong>t, this c<strong>an</strong> completely offset the<br />
potential CO2 emission reductions associated<br />
with the use of heat pumps.<br />
The competition for low-temperature renewable<br />
process heat production between heat pumps<br />
<strong>an</strong>d solar thermal will be heavily dependent on<br />
regional <strong>an</strong>d local conditions. This <strong>an</strong>alysis<br />
shows how the relative competitiveness of the<br />
two technologies is likely to be both regionally<br />
<strong>an</strong>d sectorally polarised. Both technologies have<br />
subst<strong>an</strong>tial improvement potentials between<br />
2007 <strong>an</strong>d 2050. But the cost of the electricity<br />
that drives the cost of process heat from heat<br />
39
RENEWABLE ENERGY IN INDUSTRIAL APPLICATIONS<br />
pumps is unlikely to reduce signific<strong>an</strong>tly <strong>in</strong><br />
future. Indeed, the progressive <strong>in</strong>troduction of a<br />
carbon price on non-renewable power generation,<br />
already <strong>in</strong> place today <strong>in</strong> the EU <strong>an</strong>d other OECD<br />
countries, will probably <strong>in</strong>crease prices.<br />
Conversely, solar thermal technologies still have<br />
a large potential for cost reduction. They may as<br />
a result become the dom<strong>in</strong><strong>an</strong>t renewable energy<br />
technology for low temperature process heat by<br />
2050 <strong>in</strong> m<strong>an</strong>y regions.<br />
Figure 15<br />
Supply cost curves for heat pumps <strong>in</strong> the food <strong>an</strong>d tobacco sector. UNIDO <strong>an</strong>alysis.<br />
Cost (US$/GJ)<br />
40<br />
35<br />
30<br />
25<br />
20<br />
15<br />
Middle East < 60 C 13<br />
Ch<strong>in</strong>a 60 - 100 C 13<br />
Food <strong>an</strong>d Tobacco - supply cost curve 2007<br />
Lat<strong>in</strong> America < 60 C 13<br />
Africa < 60 C 15<br />
Former Soviet Union < 60 C 15<br />
OECD Total < 60 C<br />
18<br />
Middle East 60 - 100 C 19<br />
Other Asia 60 - 100 C 20<br />
Other Asia < 60 C 21<br />
Africa 60 - 100 C 22<br />
Lat<strong>in</strong> America 60 - 100 C 22<br />
Non-OECD Europe < 60 C 24<br />
Non-OECD Europe 60 - 100 C 27<br />
Former Soviet Union 60 - 100 C 30<br />
OECD Total 60 - 100 C<br />
35<br />
10<br />
Ch<strong>in</strong>a < 60 C<br />
9<br />
5<br />
0<br />
0<br />
100<br />
200<br />
300<br />
400<br />
500<br />
600<br />
700<br />
800<br />
900<br />
1000<br />
1100<br />
1200<br />
1300<br />
1400<br />
1500<br />
1600<br />
1700<br />
1800<br />
1900<br />
2000<br />
2100<br />
2200<br />
2300<br />
2400<br />
potential (PJ)<br />
Cost (US$/GJ)<br />
20<br />
18<br />
16<br />
14<br />
12<br />
10<br />
8<br />
6<br />
Ch<strong>in</strong>a < 60 C<br />
6<br />
Middle East < 60 C 7<br />
Lat<strong>in</strong> America < 60 C 8<br />
Food <strong>an</strong>d Tobacco - supply cost curve 2050<br />
Africa < 60 C 8<br />
Other Asia < 60 C 9<br />
Ch<strong>in</strong>a 60 - 100 C 9<br />
Middle East 60 - 100 C 10<br />
Lat<strong>in</strong> America 60 - 100 C 11<br />
Africa 60 - 100 C 12<br />
OECD Total < 60 C<br />
12<br />
Non-OECD Europe < 60 C 12<br />
Former Soviet Union < 60 C 13<br />
Other Asia 60 - 100 C 13<br />
OECD Total 60 - 100 C<br />
17<br />
Non-OECD Europe 60 - 100 C 18<br />
Former Soviet Union 60 - 100 C 19<br />
4<br />
2<br />
0<br />
0<br />
100<br />
200<br />
300<br />
400<br />
500<br />
600<br />
700<br />
800<br />
900<br />
1000<br />
1100<br />
1200<br />
1300<br />
1400<br />
1500<br />
1600<br />
1700<br />
1800<br />
1900<br />
2000<br />
2100<br />
2200<br />
2300<br />
2400<br />
2500<br />
2600<br />
2700<br />
2800<br />
2900<br />
3000<br />
3100<br />
3200<br />
3300<br />
3400<br />
3500<br />
3600<br />
3700<br />
3800<br />
3900<br />
potential (PJ)<br />
40
V. REFERENCES<br />
Arthur, W.B. (1983) On Compet<strong>in</strong>g Technologies<br />
<strong>an</strong>d Historical Small Events: The Dynamics of<br />
Choice under Increas<strong>in</strong>g Returns. IIASA<br />
Work<strong>in</strong>g Paper, WP-83-090.<br />
Biopol (2010) Green polyethylene <strong>in</strong> Brazildiesel.<br />
http://biopol.free.fr/<strong>in</strong>dex.php/greenpolyetlylene-<strong>in</strong>-brazil/<br />
BioMCN (2010) BioMCN opens largest 2nd<br />
generation biofuel pl<strong>an</strong>t.<br />
http://www.biomcn.eu/news/news.html<br />
Crawford, C. (2001) Discussion Framework:<br />
develop<strong>in</strong>g biobased <strong>in</strong>dustries <strong>in</strong> C<strong>an</strong>ada.<br />
C<strong>an</strong>adi<strong>an</strong> New Uses Council (CANUC) For<br />
Horticulture <strong>an</strong>d Special Crops Division<br />
(HSCD) Market <strong>an</strong>d Industry Services Br<strong>an</strong>ch<br />
(MISB).<br />
Dornburg, V., Herm<strong>an</strong>n, B., <strong>an</strong>d Patel, M.K. (2008)<br />
Scenario Projections for Future Market<br />
Potentials of Biobased Bulk Chemicals.<br />
Environmental Science & Technology Vol. 42,<br />
no. 7.<br />
ESTIF (2006). Solar <strong>Industrial</strong> Process Heat -<br />
State of the Art. Intelligent <strong>Energy</strong> Europe,<br />
2006<br />
Essent (2010)<br />
Gielen, D., Fuj<strong>in</strong>o, J., Hashimoto, S., <strong>an</strong>d<br />
Moriguchi, Y. , 2003. Model<strong>in</strong>g of Global<br />
Biomass Policies. Biomass <strong>an</strong>d Bioenergy,<br />
Volume 25, Issue 2.<br />
Ghosh, D., Sagar, A.D., Kishore, V.V.N. (2006)<br />
Scal<strong>in</strong>g up of Biomass Gasifier Use: An<br />
Application-specific Approach. <strong>Energy</strong> Policy<br />
34, pp. 1566-1582.<br />
Gudmundsson, J., Freeston, D. <strong>an</strong>d Lienau, P.<br />
(1985). The L<strong>in</strong>dal Diagram, Geothermal<br />
Research Council Tr<strong>an</strong>sactions, Vol. 9,<br />
pp. 15-17.<br />
IEA (2008a) <strong>Energy</strong> Technology Perspectives<br />
2008. IEA/OECD, Paris.<br />
IEA (2008b) Deploy<strong>in</strong>g <strong>Renewable</strong>s: Pr<strong>in</strong>ciples for<br />
Effective Policies. IEA/OECD, Paris.<br />
IEA (2009a) World <strong>Energy</strong> Outlook 2009.<br />
IEA/OECD, Paris.<br />
IEA (2009b) <strong>Energy</strong> Technology Tr<strong>an</strong>sitions for<br />
Industry. IEA/OECD, Paris.<br />
IEA (2009c) <strong>Renewable</strong> <strong>Energy</strong> Essentials: Solar<br />
heat<strong>in</strong>g <strong>an</strong>d cool<strong>in</strong>g. IEA/OECD, Paris.<br />
IEA (2010a) <strong>Energy</strong> Technology Perspectives 2010.<br />
IEA/OECD, Paris.<br />
IEA (2010b) Technology Roadmap on<br />
Concentrat<strong>in</strong>g Solar Power. IEA/OECD, Paris.<br />
IEA <strong>an</strong>d WBCSD (2009). Cement Technology<br />
Roadmap 2009. Paris/Geneva.<br />
IEA Bioenergy (2009) Bioenergy - A Susta<strong>in</strong>able<br />
<strong>an</strong>d Reliable <strong>Energy</strong> Source.<br />
http://www.ieabioenergy.com/<br />
IEA Task 33/IV, 2008. Potential for Solar Heat <strong>in</strong><br />
<strong>Industrial</strong> Processes.<br />
Jakobs, R, 2010. Information Centre on Heat<br />
Pumps <strong>an</strong>d Refrigeration. Status <strong>an</strong>d<br />
Outlook: <strong>Industrial</strong> Heat Pumps. EHPA, 2010.<br />
Karagiorgas, M., Botzios, A., Tsoutsos,T.;<br />
<strong>Industrial</strong> solar thermal applications <strong>in</strong><br />
Greece; <strong>Renewable</strong> <strong>an</strong>d Susta<strong>in</strong>able <strong>Energy</strong><br />
Reviews, 5-2001.<br />
41
RENEWABLE ENERGY IN INDUSTRIAL APPLICATIONS<br />
Kedare, S., Par<strong>an</strong>jape, A., Pathak, S. <strong>an</strong>d Senjalia,<br />
D. (2008) ARUN: Solar Concentrator for<br />
<strong>Industrial</strong> Process Heat <strong>an</strong>d Power<br />
generation.<br />
www.emt-<strong>in</strong>dia.net/Presentations2008/.../<br />
02ARUN_SolarConcentrator.pdf<br />
Kikels, A, Verbong, G. (2010) Biomass<br />
Gasification: Still Promis<strong>in</strong>g A 30-year Global<br />
Overview. <strong>Renewable</strong> <strong>an</strong>d Susta<strong>in</strong>able<br />
<strong>Energy</strong> Reviews, <strong>in</strong> press.<br />
Kleisterlee, G. <strong>an</strong>d Frenken, R. (2010) <strong>Renewable</strong><br />
Power Generation from Biomass - Perspective<br />
from Essent, Presentation to the GBEP<br />
International Delegation, 18th March. Global<br />
Biomass <strong>Energy</strong> Partnership/FAO, Rome.<br />
Marchetti, C., <strong>an</strong>d Nakicenovic, N. (1979). The<br />
Dynamics of <strong>Energy</strong> Systems <strong>an</strong>d the Logistic<br />
Substitution Model. RR-79-13. International<br />
Institute for Applied Systems Analysis,<br />
Laxenburg, Austria.<br />
Ochsner, K. (2010) Application of large Heat<br />
Pumps for Waste Heat Recovery <strong>an</strong>d use of<br />
Ambient Heat. Europe<strong>an</strong> Heat Pump<br />
Association, http://www.ehpa.org/.<br />
Pacala, S. <strong>an</strong>d Socolow, R. (2004) Stabilization<br />
Wedges: Solv<strong>in</strong>g the Climate Problem for the<br />
Next 50 Years with Current Technologies.<br />
Science Magaz<strong>in</strong>e, Vol. 305.<br />
Patel, M.K.; Cr<strong>an</strong>k, M.; Dornburg, V.; Herm<strong>an</strong>n, B.;<br />
Roes, L.; Hüs<strong>in</strong>g, B.; Overbeek, v<strong>an</strong>, L.;<br />
Terragni, F.; Recchia, E.: Medium <strong>an</strong>d Longterm<br />
Opportunities <strong>an</strong>d Risks of the<br />
Biotechnological Production of Bulk<br />
Chemicals from <strong>Renewable</strong> Resources - The<br />
BREW Project. Prepared under the Europe<strong>an</strong><br />
Commission's GROWTH Programme (DG<br />
Research). Co-ord<strong>in</strong>ated by Utrecht University<br />
(UU), Dept. of Science, Technology <strong>an</strong>d<br />
Society (STS), Utrecht, Netherl<strong>an</strong>ds; F<strong>in</strong>al<br />
report, 420 pages, September 2006.<br />
Downloadable from<br />
http://www.chem.uu.nl/brew/ )<br />
Ren, T. (2009) Petrochemicals from Oil, Natural<br />
Gas, Coal <strong>an</strong>d Biomass: <strong>Energy</strong> Use,<br />
Economics <strong>an</strong>d Innovation. PhD Thesis,<br />
Utrecht University.<br />
Resch, G., Held, A., Faber, T., P<strong>an</strong>zer, C., Toro, F.,<br />
Haas, R. (2006). Potentials <strong>an</strong>d prospects for<br />
<strong>Renewable</strong> Energies at Global Scale, <strong>Energy</strong><br />
Policy, vol. 36, pp. 4048-4056<br />
S<strong>an</strong>tos Sampaio, R. (2005) Large-scale charcoal<br />
Production to Reduce CO2 Emission <strong>an</strong>d<br />
Improve Quality <strong>in</strong> the Coal based<br />
Ironmak<strong>in</strong>g Industry.<br />
http://www.bioenergytrade.org/downloads/sam<br />
paionovdec05.pdf<br />
Shen, L.; Haufe, J.; Patel, M. K.: Product Overview<br />
<strong>an</strong>d Market Projection of Emerg<strong>in</strong>g Bio-based<br />
Plastics PRO-BIP 2009. Prepared by the<br />
Department of Science, Technology <strong>an</strong>d<br />
Society (STS)/Copernicus Institute for<br />
Susta<strong>in</strong>able Development <strong>an</strong>d Innovation for<br />
the Europe<strong>an</strong> Polysaccharide Network of<br />
Excellence (EPNOE) <strong>an</strong>d Europe<strong>an</strong> Bioplastics.<br />
Utrecht University F<strong>in</strong>al report, June 2009<br />
http://www.chem.uu.nl/nws/www/research/e&e<br />
/PROBIP2009%20F<strong>in</strong>al%20June%202009.pdf<br />
Spath, P. <strong>an</strong>d Dayton, D. (2003) Prelim<strong>in</strong>ary<br />
Screen<strong>in</strong>g -Technical <strong>an</strong>d Economic<br />
Assessment of Synthesis Gas to Fuels <strong>an</strong>d<br />
Chemicals with Emphasis on the Potential for<br />
Biomass-Derived Syngas. NREL/TP-510-34929.<br />
National <strong>Renewable</strong> <strong>Energy</strong> Laboratory,<br />
Golden, Colorado.<br />
UNDP (2009) Exp<strong>an</strong>d<strong>in</strong>g <strong>Energy</strong> Access <strong>in</strong><br />
Develop<strong>in</strong>g Countries: the Role of Mech<strong>an</strong>ical<br />
Power. Practical Action Consult<strong>in</strong>g.<br />
http://practicalaction.org/docs/consult<strong>in</strong>g/UND<br />
P_Mech<strong>an</strong>ical_Power.pdf<br />
US <strong>Energy</strong> Information Adm<strong>in</strong>istration (2006).<br />
M<strong>an</strong>ufactur<strong>in</strong>g <strong>Energy</strong> Consumption Survey<br />
database.<br />
http://www.eia.doe.gov/emeu/mecs/contents.h<br />
tml<br />
WBCSD (2006). WBCSD Cement Susta<strong>in</strong>ability<br />
Initiative (CSI), Gett<strong>in</strong>g the Numbers Right<br />
(GNR), a global cement database. Geneva.<br />
WBCSD (2009). WBCSD Cement Susta<strong>in</strong>ability<br />
Initiative (CSI), A Sectoral Approach:<br />
Greenhouse Gas Mitigation <strong>in</strong> the Cement<br />
Industry. Geneva.<br />
42
REFERENCES<br />
Weiss, W., Biermayr, P. (2010) Potential of Solar<br />
Thermal <strong>in</strong> Europe. Europe<strong>an</strong> Solar Thermal<br />
Industry Federation. www.estif.org<br />
Werpy, T. And Petersen, G. (2004) Top Value<br />
Added Chemicals from Biomass Volume I-<br />
Results of Screen<strong>in</strong>g for Potential C<strong>an</strong>didates<br />
from Sugars <strong>an</strong>d Synthesis Gas. US<br />
Department of <strong>Energy</strong>.<br />
http://www1.eere.energy.gov/biomass/pdfs/355<br />
23.pdf<br />
Weiss, W., Mauthner, F. (2010) Solar Heat<br />
Worldwide. IEA Solar Heat<strong>in</strong>g <strong>an</strong>d Cool<strong>in</strong>g<br />
implement<strong>in</strong>g agreement.<br />
www.aee-<strong>in</strong>tec.at/0uploads/dateien351.pdf<br />
Weiss, W., Rommel, M. (2008) Process Heat<br />
Collectors - State of the Art with<strong>in</strong> Task 33/IV.<br />
IEA Solar Heat<strong>in</strong>g <strong>an</strong>d Cool<strong>in</strong>g Implement<strong>in</strong>g<br />
Agreement.<br />
43
VI. ANNEXES<br />
ANNEX 1<br />
Modell<strong>in</strong>g energy tr<strong>an</strong>sitions: the Logistic<br />
Substitution Model for biomass <strong>in</strong> <strong>in</strong>dustry<br />
The Logistic Substitution Model is used <strong>in</strong> the<br />
wider <strong>an</strong>alysis <strong>in</strong> this paper to assess the way <strong>in</strong><br />
which fossil fuels will be replaced by renewables<br />
as carbon emissions progressively attract a price<br />
that reflects their economic <strong>an</strong>d social cost.<br />
The model builds on a time series of the<br />
contribution of different energy sources <strong>in</strong> a<br />
specific sector <strong>in</strong> a specific region to project the<br />
development of new energy sources as<br />
percentage of the relev<strong>an</strong>t sector's total energy<br />
consumption. For this <strong>an</strong>alysis, the three ma<strong>in</strong><br />
sources compet<strong>in</strong>g with each other are taken to<br />
be bioenergy, fossil fuels <strong>an</strong>d electricity.<br />
The result<strong>in</strong>g dem<strong>an</strong>d for bioenergy is then<br />
aggregated by region <strong>an</strong>d checked aga<strong>in</strong>st the<br />
regional availability of susta<strong>in</strong>able biomass<br />
resources. In some regions, the potential dem<strong>an</strong>d<br />
for biomass is far below its availability. But <strong>in</strong><br />
others, particularly the OECD, dem<strong>an</strong>d exceeds<br />
supply <strong>in</strong> every scenario. This dem<strong>an</strong>d c<strong>an</strong> only<br />
be met by the trad<strong>in</strong>g of resources <strong>in</strong>ternationally<br />
from regions with excess supply to those with<br />
excess dem<strong>an</strong>d.<br />
The development of a liquid <strong>in</strong>ternational market<br />
for bioenergy will be fundamental both to<br />
economically effective <strong>in</strong>ternational trad<strong>in</strong>g <strong>an</strong>d<br />
to maximis<strong>in</strong>g the exploitation of the world's<br />
biomass resources <strong>in</strong> <strong>in</strong>dustrial applications. Such<br />
a market will be essential to the tr<strong>an</strong>sformation<br />
of the use of bioenergy <strong>in</strong> the <strong>in</strong>dustrial sector<br />
<strong>an</strong>d to the achievement of the sector's full<br />
potential for biomass use. The modell<strong>in</strong>g shows<br />
that, if liquid <strong>in</strong>ternational bioenergy markets are<br />
<strong>in</strong> place by 2050, there will be enough<br />
susta<strong>in</strong>able biomass to provide more th<strong>an</strong> 18 EJ<br />
of heat <strong>an</strong>d almost 7 EJ of petrochemical<br />
feedstocks. In the absence of such bioenergy<br />
markets, these figures are scaled down by almost<br />
50%, with most of the reduction <strong>in</strong> achieved<br />
potential occurr<strong>in</strong>g <strong>in</strong> the OECD countries.<br />
The development of <strong>an</strong> <strong>in</strong>ternational biomass<br />
market is likely to depend <strong>in</strong>itially on the<br />
emergence of large volume biomass traders who<br />
are active <strong>in</strong> the power generation market.<br />
Current subsidies for renewable energy are<br />
ma<strong>in</strong>ly <strong>in</strong> the form of feed-<strong>in</strong> tariffs or tradable<br />
green certificates for power generation. This<br />
attracts large volumes of biomass to the power<br />
sector for co-fir<strong>in</strong>g with coal or burn<strong>in</strong>g <strong>in</strong><br />
dedicated biomass power pl<strong>an</strong>ts. Biomass is<br />
used for heat still ma<strong>in</strong>ly <strong>in</strong> residential space<br />
heat<strong>in</strong>g.<br />
As the biomass quality becomes more consistent<br />
<strong>an</strong>d as the supply qu<strong>an</strong>tities become more<br />
reliable, <strong>in</strong>tercont<strong>in</strong>ental trad<strong>in</strong>g of biomass for<br />
energy purposes is already happen<strong>in</strong>g. Most of this<br />
trad<strong>in</strong>g is by sea. The higher the energy density of<br />
the biomass commodity, the cheaper, the more<br />
environmentally friendly <strong>an</strong>d the easier its long<br />
44
ANNEXES<br />
dist<strong>an</strong>ce shipp<strong>in</strong>g will be. A fully hydrophobic biocoal<br />
could make direct use of the exist<strong>in</strong>g<br />
overseas shipp<strong>in</strong>g <strong>an</strong>d delivery <strong>in</strong>frastructure for<br />
coal. The shipp<strong>in</strong>g of similarly large volumes of<br />
wood chips, however, would require the<br />
adaptation of exist<strong>in</strong>g energy tr<strong>an</strong>sport facilities<br />
<strong>an</strong>d would be considerably more expensive <strong>in</strong><br />
terms of the amount of useful energy moved.<br />
The pulp <strong>an</strong>d paper <strong>an</strong>d wood sectors, the<br />
feedstocks <strong>an</strong>d f<strong>in</strong>al products of which are<br />
woody commodities, already make signific<strong>an</strong>t use<br />
of bioenergy <strong>in</strong> their f<strong>in</strong>al consumption. The<br />
logistic substitution modell<strong>in</strong>g <strong>in</strong>dicates that this<br />
already high proportion of f<strong>in</strong>al energy use c<strong>an</strong><br />
be further <strong>in</strong>creased, from around 33% <strong>in</strong> 2007<br />
to 55% <strong>in</strong> 2050 <strong>in</strong> the paper <strong>an</strong>d pulp sector <strong>an</strong>d<br />
from 45% to almost 70% <strong>in</strong> 2050 <strong>in</strong> the wood<br />
sector (Figure 16).<br />
These numbers suggest a very high proportion of<br />
biomass use <strong>in</strong> these sectors. They may seem at<br />
first gl<strong>an</strong>ce to be unrealistically high <strong>an</strong>d to<br />
assume implausibly large technological<br />
tr<strong>an</strong>sitions. But <strong>in</strong> Lat<strong>in</strong> America (especially <strong>in</strong><br />
Brazil) the pulp <strong>an</strong>d paper sector already<br />
achieves higher proportions, at 63% <strong>in</strong> 2007. And<br />
<strong>in</strong> Fr<strong>an</strong>ce, biomass constitutes 81% of the wood<br />
sector's f<strong>in</strong>al energy consumption, with a number<br />
of other countries, most of them OECD countries,<br />
also perform<strong>in</strong>g very strongly. Emerg<strong>in</strong>g<br />
economies have a very high substitution<br />
potential for the use of biomass <strong>in</strong> these sectors<br />
which rema<strong>in</strong>s currently very far from be<strong>in</strong>g fully<br />
exploited.<br />
In the cement sector, around 3% of f<strong>in</strong>al energy<br />
consumption comes from biomass (IEA,WBCSD,<br />
2009), although the situation varies widely by<br />
region. In Brazil, 35% of the f<strong>in</strong>al energy <strong>in</strong> the<br />
non-metallic m<strong>in</strong>erals sector comes from<br />
biomass. But <strong>in</strong> Ch<strong>in</strong>a, where more th<strong>an</strong> 50% of<br />
the world's cement is currently produced, more<br />
biomass would be needed to meet 35% of the<br />
Figure 16<br />
Logistic substitution of biomass <strong>in</strong> the chemical <strong>an</strong>d petrochemical <strong>an</strong>d cement<br />
<strong>in</strong>dustries. UNIDO <strong>an</strong>alysis.<br />
90%<br />
Logistic substitution potential for biomass <strong>in</strong> <strong>in</strong>dustry:<br />
improv<strong>in</strong>g the already good results<br />
80%<br />
70%<br />
60%<br />
50%<br />
40%<br />
30%<br />
20%<br />
10%<br />
0%<br />
2000 2010 2020 2030 2040 2050 2060 2070 2080 2090 2100<br />
Paper, pulp <strong>an</strong>d pr<strong>in</strong>t<strong>in</strong>g Wood <strong>an</strong>d wood products<br />
45
RENEWABLE ENERGY IN INDUSTRIAL APPLICATIONS<br />
total f<strong>in</strong>al energy dem<strong>an</strong>d of the sector th<strong>an</strong><br />
could be produced susta<strong>in</strong>ably at a national<br />
level.<br />
In addition to conventional biomass, the cement<br />
sector makes signific<strong>an</strong>t use of alternative fuels,<br />
<strong>in</strong>clud<strong>in</strong>g municipal solid waste <strong>an</strong>d other<br />
discarded org<strong>an</strong>ic materials that are often<br />
accounted for <strong>in</strong> the renewables <strong>an</strong>d waste<br />
category <strong>in</strong> <strong>in</strong>ternational statistics. These<br />
alternative fuels are expected to meet a large<br />
part of the biomass substitution potential,<br />
thereby reduc<strong>in</strong>g the dem<strong>an</strong>d on conventional<br />
biomass resources.<br />
No countries yet use biomass signific<strong>an</strong>tly <strong>in</strong> the<br />
chemicals <strong>an</strong>d petrochemicals sector. Worldwide,<br />
biomass contributed 0.6% of the f<strong>in</strong>al energy<br />
use <strong>in</strong> the sector <strong>in</strong> 2007. Integrated<br />
bioref<strong>in</strong>eries may offer the prospect of the wider<br />
use of biomass for the co-production of plastics,<br />
fuels <strong>an</strong>d energy. Depend<strong>in</strong>g on the catalysts<br />
used, synthetic natural gas (SNG), hydrogen <strong>an</strong>d<br />
liquids c<strong>an</strong> be produced from biomass which,<br />
through meth<strong>an</strong>isation, de-hydration <strong>an</strong>d Fischer-<br />
Tropsch processes c<strong>an</strong> be turned <strong>in</strong>to fossilsubstitute<br />
products. For example, ammonia <strong>an</strong>d<br />
meth<strong>an</strong>ol c<strong>an</strong> both be produced from SNG <strong>in</strong><br />
much the same way as they are currently<br />
produced from fossil natural gas. Such<br />
developments offer the potential <strong>in</strong> the longer<br />
term for biomass to play a much stronger<br />
role <strong>in</strong> the chemicals <strong>an</strong>d petrochemicals sector<br />
(Figure 17).<br />
The ma<strong>in</strong> limits to the further penetration of<br />
biomass penetration <strong>in</strong> the chemicals <strong>an</strong>d<br />
petrochemicals <strong>in</strong>dustry are the availability of<br />
susta<strong>in</strong>able biomass resource <strong>an</strong>d its economic<br />
competitiveness. Local availability has so far<br />
been the most critical constra<strong>in</strong>t. The overcom<strong>in</strong>g<br />
of this barrier through the development of<br />
<strong>in</strong>ternational biomass energy markets will be<br />
heavily dependent on the emergence of <strong>an</strong><br />
effective tr<strong>an</strong>sformation sector that c<strong>an</strong> turn<br />
biomass from a geographically constra<strong>in</strong>ed fuel<br />
<strong>in</strong>to a modern energy commodity. This is<br />
discussed <strong>in</strong> more detail <strong>in</strong> Annex 2.<br />
Figure 17<br />
Logistic substitution of biomass <strong>in</strong> the chemical <strong>an</strong>d petrochemical <strong>an</strong>d cement<br />
<strong>in</strong>dustries. UNIDO <strong>an</strong>alysis.<br />
100%<br />
90%<br />
80%<br />
70%<br />
60%<br />
50%<br />
40%<br />
30%<br />
20%<br />
10%<br />
0%<br />
Logistic substitution potential for biomass <strong>in</strong> <strong>in</strong>dustry:<br />
high potential but <strong>in</strong> the very long term<br />
2000 2010 2020 2030 2040 2050 2060 2070 2080 2090 2100<br />
Chemical <strong>an</strong>d petrochemical<br />
Cement<br />
46
ANNEXES<br />
ANNEX 2<br />
Biomass preparation technologies<br />
If biomass is to be more widely traded as a<br />
commodity on <strong>in</strong>ternational markets, it will need<br />
to be available <strong>in</strong> very large volumes <strong>an</strong>d <strong>in</strong> a<br />
form which enables easy h<strong>an</strong>dl<strong>in</strong>g <strong>an</strong>d costeffective<br />
tr<strong>an</strong>sportation. Fundamental to the<br />
production of such commodities on <strong>an</strong> economic<br />
scale is the large scale provision of feedstocks to<br />
the tr<strong>an</strong>sformation <strong>in</strong>dustry. The biofuel<br />
process<strong>in</strong>g pl<strong>an</strong>ts that will be needed to<br />
underp<strong>in</strong> that tr<strong>an</strong>sformation <strong>in</strong>dustry will require<br />
the harvest<strong>in</strong>g, treatment, tr<strong>an</strong>sportation, storage,<br />
<strong>an</strong>d delivery of large volumes of biomass<br />
feedstock, to a desired quality, all-year-round.<br />
Supplies need to be guar<strong>an</strong>teed <strong>in</strong> adv<strong>an</strong>ce for a<br />
prolonged period to reduce the <strong>in</strong>vestment risks.<br />
These factors will be critical to the success of<br />
<strong>in</strong>vestments <strong>in</strong> biomass commodity production<br />
for the future.<br />
Pelletis<strong>in</strong>g<br />
In 2008, around 9 mt of wood pellets were<br />
produced worldwide. These replaced around 6.3<br />
mt of coal. Wood pellets conta<strong>in</strong> about 17 GJ of<br />
energy per tonne. The total primary energy<br />
obta<strong>in</strong>ed from wood pellets was accord<strong>in</strong>gly<br />
around 0.15 EJ/yr.<br />
It is estimated that pellet production will double<br />
over the next 4 - 5 years. Some <strong>in</strong>dustry experts<br />
forecast <strong>an</strong> <strong>an</strong>nual growth of 25% - 30% globally<br />
over the next ten years. Europe is currently the<br />
major market for pellets, but the dem<strong>an</strong>d for<br />
non-fossil fuels <strong>in</strong> North America is grow<strong>in</strong>g. As a<br />
result, Europe<strong>an</strong> pellet consumers will have to<br />
search for alternative supply sources <strong>in</strong> Asia,<br />
Lat<strong>in</strong> America, Africa <strong>an</strong>d Russia.<br />
If the trade <strong>in</strong> wood biomass for power<br />
generation is to <strong>in</strong>crease signific<strong>an</strong>tly, it will<br />
require the development of a st<strong>an</strong>dard around<br />
which tr<strong>an</strong>sportation logistics <strong>an</strong>d technology<br />
requirements c<strong>an</strong> be established. Wood pellets<br />
c<strong>an</strong> provide such a st<strong>an</strong>dard.<br />
The wood pellet production process is relatively<br />
simple: wood material is dried <strong>an</strong>d turned <strong>in</strong>to a<br />
dough-like mass by be<strong>in</strong>g passed through a<br />
hammer mill <strong>an</strong>d this mass is then squeezed<br />
through a high-pressure die with holes of the<br />
size required for the specific pellets be<strong>in</strong>g<br />
produced. The pressure causes a rise <strong>in</strong><br />
temperature which plastifies the lign<strong>in</strong> <strong>in</strong> the<br />
wood <strong>an</strong>d holds the pellet together.<br />
The raw materials primarily used for pellet<br />
m<strong>an</strong>ufactur<strong>in</strong>g have traditionally been sawdust<br />
<strong>an</strong>d shav<strong>in</strong>gs from the sawmill<strong>in</strong>g <strong>in</strong>dustry. As<br />
this supply source has started to be fully<br />
exploited, the search for alternative sources has<br />
widened. Europe<strong>an</strong> pellet m<strong>an</strong>ufacturers are<br />
expected <strong>in</strong>creas<strong>in</strong>gly to use forest residues,<br />
urb<strong>an</strong> wood waste <strong>an</strong>d fast-grow<strong>in</strong>g tree species.<br />
They will also beg<strong>in</strong> to compete more<br />
aggressively with pulpmills <strong>an</strong>d wood-p<strong>an</strong>el mills<br />
for sawmill chips <strong>an</strong>d pulp logs. Some pellet<br />
pl<strong>an</strong>ts may look to import wood chips from<br />
overseas.<br />
A surpris<strong>in</strong>gly large share of the global pellet<br />
production is already shipped to markets outside<br />
the produc<strong>in</strong>g country, not only between<br />
countries but also <strong>in</strong>tercont<strong>in</strong>entally. An<br />
estimated 25% of world production was exported<br />
<strong>in</strong> 2008. Most of this was shipped from British<br />
Columbia <strong>in</strong> C<strong>an</strong>ada to Belgium, the Netherl<strong>an</strong>ds<br />
<strong>an</strong>d Sweden. Despite the seem<strong>in</strong>gly prohibitively<br />
expensive 15 000 kilometre journey, this market<br />
is driven by the currently very low cost of<br />
shav<strong>in</strong>gs <strong>an</strong>d sawdust <strong>in</strong> C<strong>an</strong>ada <strong>an</strong>d the high<br />
prices for wood pellets <strong>in</strong> Europe.<br />
The Andritz Group currently has about a 50%<br />
share of the global market for wood pellet<br />
production equipment. Andritz is <strong>an</strong> Austri<strong>an</strong> firm<br />
that provides equipment <strong>an</strong>d services for the<br />
47
RENEWABLE ENERGY IN INDUSTRIAL APPLICATIONS<br />
global hydro power, pulp <strong>an</strong>d paper, steel, <strong>an</strong>imal<br />
feed <strong>an</strong>d biofuels <strong>an</strong>d other <strong>in</strong>dustries.<br />
The largest pellet<strong>in</strong>g mach<strong>in</strong>e produced to date,<br />
for a Russi<strong>an</strong> paper comp<strong>an</strong>y, produces over 900<br />
kt of pellets a year. It cost around USD 60/t<br />
capacity. The dem<strong>an</strong>d for such very large mach<strong>in</strong>es<br />
is limited by the availability of feedstock. A pl<strong>an</strong>t<br />
produc<strong>in</strong>g 125 kt/yr costs approximately USD 20<br />
million, i.e. around USD 160/t capacity. The capital<br />
costs of the pl<strong>an</strong>t depend on the type of feedstock<br />
material used. Material with moisture content<br />
greater th<strong>an</strong> 12% will need dry<strong>in</strong>g. A dryer c<strong>an</strong> cost<br />
up to 40% of the entire capital costs. Signific<strong>an</strong>t<br />
work<strong>in</strong>g capital is also needed to bridge the time<br />
it takes a pl<strong>an</strong>t to achieve profitability: m<strong>an</strong>y pellet<br />
pl<strong>an</strong>ts take 6 to 18 months to ref<strong>in</strong>e the process<br />
before becom<strong>in</strong>g profitable.<br />
Agricultural products <strong>an</strong>d residues such as straw,<br />
hay, misc<strong>an</strong>thus or other energy crops which are<br />
used to form so-called agri-pellets have attracted<br />
additional attention as feedstocks <strong>in</strong> recent<br />
years. Unfortunately, all of these products are<br />
harder to burn cle<strong>an</strong>ly th<strong>an</strong> wood. To meet<br />
exist<strong>in</strong>g emissions legislation <strong>in</strong> m<strong>an</strong>y countries,<br />
signific<strong>an</strong>t product development will be required<br />
before the widespread use of agri-pellets will be<br />
possible.<br />
Fast pyrolysis<br />
Pyrolysis is thermal decomposition that occurs <strong>in</strong><br />
the absence of air. The pyrolysis of carboniferous<br />
material generates gases, liquids <strong>an</strong>d char. Where<br />
biomass is pretreated by pyrolysis, the result<strong>in</strong>g<br />
higher energy density liquid c<strong>an</strong> be tr<strong>an</strong>sported,<br />
h<strong>an</strong>dled <strong>an</strong>d gasified more easily th<strong>an</strong> solid biomass.<br />
Although costs are higher, pretreatment<br />
would enable larger scale pl<strong>an</strong>ts <strong>an</strong>d char-free<br />
gasification processes, with economies of scale<br />
<strong>an</strong>d a reduced need for residues treatment <strong>in</strong> the<br />
gasifier.<br />
However the practical application of such<br />
Biomass to Liquid (BtL) approaches raises some<br />
import<strong>an</strong>t questions of scale. BtL pl<strong>an</strong>ts need to<br />
be very large to be economic. With a m<strong>in</strong>imum<br />
economic production capacity of 25 000 barrels<br />
(bbls) a day, a pl<strong>an</strong>t would require between<br />
5 million <strong>an</strong>d 7 million tonnes of dry biomass<br />
feedstock a year. The economic <strong>an</strong>d logistical<br />
challenges <strong>in</strong>volved <strong>in</strong> f<strong>in</strong><strong>an</strong>c<strong>in</strong>g, build<strong>in</strong>g <strong>an</strong>d<br />
operat<strong>in</strong>g such a biomass based pl<strong>an</strong>t are very<br />
considerable. To address these concerns, a<br />
number of alternative approaches are be<strong>in</strong>g<br />
considered. These <strong>in</strong>clud<strong>in</strong>g downscal<strong>in</strong>g, less<br />
dem<strong>an</strong>d<strong>in</strong>g process conditions that lower<br />
equipment requirements, us<strong>in</strong>g higher energy<br />
density gasification feedstocks, <strong>an</strong>d <strong>in</strong>tegrat<strong>in</strong>g<br />
the BtL process <strong>in</strong>to conventional ref<strong>in</strong>eries.<br />
Bio-coal<br />
Bio-coal c<strong>an</strong> already be produced from biomass.<br />
Several new comp<strong>an</strong>ies are enter<strong>in</strong>g the market<br />
with proprietary torrefaction 13 technologies. These<br />
are able to produce <strong>an</strong> energy commodity which<br />
has characteristics similar to coal from biomass of<br />
variable qualities <strong>an</strong>d grades. The product has the<br />
capability to be certified as renewable coal.<br />
These technologies offer the prospect of creat<strong>in</strong>g<br />
a st<strong>an</strong>dardised energy commodity that c<strong>an</strong> be<br />
h<strong>an</strong>dled <strong>an</strong>d m<strong>an</strong>aged with the exist<strong>in</strong>g fossil<br />
fuel coal <strong>in</strong>frastructure <strong>an</strong>d which c<strong>an</strong>, <strong>in</strong> due<br />
course, be traded on the same market. On this<br />
basis, the ma<strong>in</strong> additional cost is entailed <strong>in</strong><br />
<strong>in</strong>vestment <strong>in</strong> the torrefaction equipment, rather<br />
th<strong>an</strong> <strong>in</strong> <strong>an</strong>y downstream process.<br />
Several processes are currently used for the<br />
production of biocoal. These <strong>in</strong>clude TIES, a<br />
microwave-based process developed by Rotawave<br />
Ltd. <strong>an</strong>d the TORBED reactor from Mortimer<br />
Technology Hold<strong>in</strong>gs Ltd which is used for<br />
torrefied pellet production by Topell Enerby BV.<br />
13<br />
Torrefaction is a form of heat treatment.<br />
48
ANNEXES<br />
ANNEX 3<br />
The production of synthetic org<strong>an</strong>ic materials<br />
from biomass feedstocks<br />
Ethylene Production from Bioeth<strong>an</strong>ol<br />
In June 2007, Braskem <strong>an</strong>nounced the successful<br />
production of the first <strong>in</strong>ternationally certified<br />
plastics made from sugarc<strong>an</strong>e eth<strong>an</strong>ol. One<br />
month later, Dow entered <strong>in</strong>to a jo<strong>in</strong>t venture<br />
with Crystalsev, the lead<strong>in</strong>g Brazili<strong>an</strong> eth<strong>an</strong>ol<br />
producer, to produce bioplastics. Both comp<strong>an</strong>ies<br />
have moved quickly to achieve commercial<br />
production. Braskem is now build<strong>in</strong>g a USD 300<br />
million pl<strong>an</strong>t at its exist<strong>in</strong>g Triunfo complex with<br />
the capacity to produce 200 000 tonnes of green<br />
plastics a year. The pl<strong>an</strong>t came onl<strong>in</strong>e <strong>in</strong><br />
September 2010, the first facility of its k<strong>in</strong>d to<br />
enter commercial operation (Biopol, 2010).<br />
In parallel, Dow <strong>an</strong>d Crystalsev are develop<strong>in</strong>g<br />
the first facility to <strong>in</strong>tegrate a sugar c<strong>an</strong>e<br />
pl<strong>an</strong>tation with <strong>an</strong> eth<strong>an</strong>ol mill <strong>an</strong>d a plastics<br />
m<strong>an</strong>ufactur<strong>in</strong>g pl<strong>an</strong>t to produce bioplastics. This<br />
facility will produce 350 000 tonnes of plastics a<br />
year <strong>an</strong>d is expected to start production <strong>in</strong> 2011,<br />
becom<strong>in</strong>g a key part of Dow's growth strategy <strong>in</strong><br />
Brazil. Although the <strong>in</strong>tegrated facility will take<br />
longer to become operational th<strong>an</strong> the Braskem<br />
pl<strong>an</strong>t, it will allow Dow <strong>an</strong>d Crystalsev to take<br />
adv<strong>an</strong>tage of import<strong>an</strong>t synergies <strong>in</strong> the<br />
production process, such as us<strong>in</strong>g the water that<br />
results from the conversion of eth<strong>an</strong>ol <strong>in</strong>to<br />
eth<strong>an</strong>e <strong>an</strong>d co-generat<strong>in</strong>g electricity us<strong>in</strong>g the by<br />
products of the sugar c<strong>an</strong>e production.<br />
Braskem's second bioplastics pl<strong>an</strong>t, scheduled to<br />
start production between 2012 <strong>an</strong>d 2014, will<br />
also be a totally <strong>in</strong>tegrated facility <strong>in</strong> order to<br />
exploit production synergies.<br />
i. Meth<strong>an</strong>ol to Olef<strong>in</strong>s<br />
Olef<strong>in</strong>s (ethylene <strong>an</strong>d propylene) c<strong>an</strong> be<br />
produced from meth<strong>an</strong>ol. Bio-meth<strong>an</strong>ol c<strong>an</strong> be<br />
produced from biomass.<br />
The BioMCN process for bio-meth<strong>an</strong>ol production<br />
uses feedstock from non-food sources such as<br />
org<strong>an</strong>ic waste materials <strong>an</strong>d non-food crops.<br />
BioMCN, the world's first <strong>in</strong>dustrial scale biometh<strong>an</strong>ol<br />
producer, has received <strong>an</strong> <strong>in</strong>vestment<br />
of EUR 36 million from the private equity firm<br />
Waterl<strong>an</strong>d to go towards the cont<strong>in</strong>ued<br />
construction of its bio-meth<strong>an</strong>ol pl<strong>an</strong>t <strong>in</strong> Delfzijl,<br />
Holl<strong>an</strong>d. BioMCN opened <strong>in</strong> June 2010 the largest<br />
second generation biofuel pl<strong>an</strong>t <strong>in</strong> the world.<br />
With a production capacity of 250 million litres,<br />
BioMCN c<strong>an</strong> immediately fulfill the entire Dutch<br />
biofuel obligation - a m<strong>in</strong>imum of 4% blended<br />
<strong>in</strong>to gasol<strong>in</strong>e (BioMCN, 2010).<br />
Bio-meth<strong>an</strong>ol is produced through <strong>an</strong> <strong>in</strong>novative<br />
process, patented by BioMCN, <strong>an</strong>d is made from<br />
crude glycer<strong>in</strong>, a susta<strong>in</strong>able biomass which is a<br />
residue from the <strong>in</strong>dustrial process<strong>in</strong>g of<br />
vegetable oils <strong>an</strong>d <strong>an</strong>imal fats.. The facility is<br />
scheduled to exp<strong>an</strong>d aga<strong>in</strong> <strong>in</strong> future to<br />
800 000 mt.<br />
Two relatively new technologies have been<br />
developed to produce olef<strong>in</strong>s from meth<strong>an</strong>ol.<br />
These processes could as readily use biometh<strong>an</strong>ol<br />
as fossil fuel-based meth<strong>an</strong>ol.<br />
Lummus Technology <strong>an</strong>d Sha<strong>an</strong>xi X<strong>in</strong> X<strong>in</strong>g Coal<br />
Chemical Science & Technology Development<br />
have signed a cooperative market<strong>in</strong>g agreement<br />
globally to license dimethyl ether/meth<strong>an</strong>ol-toolef<strong>in</strong><br />
(DMTO) technology. This breakthrough<br />
technology not only enables the production of<br />
olef<strong>in</strong>s from meth<strong>an</strong>ol, but also produces<br />
enh<strong>an</strong>ced yields that will enable producers costeffectively<br />
to exp<strong>an</strong>d exist<strong>in</strong>g capacity-restricted<br />
olef<strong>in</strong>s pl<strong>an</strong>ts. The first application of this<br />
technology will be at the Shenhua Baotou Coal<br />
Chemicals pl<strong>an</strong>t <strong>in</strong> Baotou, Ch<strong>in</strong>a. The first<br />
DMTO commercial unit <strong>in</strong> the world, with a<br />
production capacity of 600 000 tonnes of lower<br />
olef<strong>in</strong>s from meth<strong>an</strong>ol per year, was proved to be<br />
successful <strong>in</strong> its first commission<strong>in</strong>g operation.<br />
49
RENEWABLE ENERGY IN INDUSTRIAL APPLICATIONS<br />
The DMTO process (DICP Meth<strong>an</strong>ol to Olef<strong>in</strong>s)<br />
was a proprietary technology developed by<br />
Dali<strong>an</strong> Institute of Chemical Physics, Ch<strong>in</strong>ese<br />
Academy of Sciences (DICP). The<br />
commercialisation of the DMTO process signified<br />
a new milestone <strong>in</strong> the production of olef<strong>in</strong>s via<br />
a non-petrochemical route. It was a signific<strong>an</strong>t<br />
R&D achievement, after the efforts of DICP<br />
researchers over more th<strong>an</strong> 20 years.<br />
Viva Meth<strong>an</strong>ol Limited, a subsidiary of Eurochem,<br />
has selected <strong>an</strong> olef<strong>in</strong> crack<strong>in</strong>g process<br />
technology to produce light olef<strong>in</strong>s, the basic<br />
build<strong>in</strong>g blocks for plastics, from natural gasderived<br />
meth<strong>an</strong>ol at a new facility <strong>in</strong> Nigeria. The<br />
new facility will produce 1.3 mt of ethylene <strong>an</strong>d<br />
propylene <strong>an</strong>nually for the production of<br />
polyethylene <strong>an</strong>d polypropylene. The new pl<strong>an</strong>t<br />
is expected to come onl<strong>in</strong>e <strong>in</strong> 2012.<br />
ii. Bioplastics<br />
Bioplastics are plastics that are up to 100% biobased.<br />
They may also be biodegradable. The<br />
percentage of bio-based <strong>in</strong>gredients <strong>an</strong>d the<br />
conditions under which the product biodegrades,<br />
if it does it at all, vary widely. The production of<br />
bioplastics has exp<strong>an</strong>ded rapidly <strong>in</strong> recent years.<br />
From <strong>an</strong> <strong>in</strong>ternational capacity of 150 kt <strong>in</strong> 2006,<br />
production is expected to rise to 2 Mt <strong>in</strong> 2011.<br />
This represents about 1% of the total global<br />
plastics market.<br />
Bioplastics are made from a variety of natural<br />
feedstocks <strong>in</strong>clud<strong>in</strong>g corn, potatoes, rice, tapioca,<br />
palm fibre, wood cellulose, wheat fibre <strong>an</strong>d<br />
bagasse. Products are available for a wide r<strong>an</strong>ge<br />
of applications such as cups, bottles, cutlery,<br />
plates, bags, bedd<strong>in</strong>g, furnish<strong>in</strong>gs, carpets, film,<br />
textiles <strong>an</strong>d packag<strong>in</strong>g materials. In the United<br />
States, the percentage of bio-based <strong>in</strong>gredients<br />
required for a product to be classified as be<strong>in</strong>g<br />
bio-based is def<strong>in</strong>ed by the U.S. Department of<br />
Agriculture (USDA) on a product-by-product basis.<br />
The Institute for Local Self-Reli<strong>an</strong>ce (ILSR) has<br />
recommended that the USDA set a m<strong>in</strong>imum<br />
threshold of 50 percent bio-based content for<br />
products to be considered bio-plastics.<br />
Perform<strong>an</strong>ce <strong>an</strong>d usage<br />
M<strong>an</strong>y bioplastics lack the perform<strong>an</strong>ce <strong>an</strong>d ease<br />
of process<strong>in</strong>g of traditional materials. PLA is<br />
be<strong>in</strong>g used by a h<strong>an</strong>dful of small comp<strong>an</strong>ies for<br />
water bottles. But shelf life is limited: the plastic<br />
is permeable to water so the bottles lose their<br />
contents <strong>an</strong>d slowly deform. Bioplastics are<br />
see<strong>in</strong>g some use <strong>in</strong> Europe, where they account<br />
for 60% of the biodegradable materials market.<br />
The most common end-use market is for<br />
packag<strong>in</strong>g materials. Jap<strong>an</strong> has also been a<br />
pioneer <strong>in</strong> bioplastics, <strong>in</strong>corporat<strong>in</strong>g them <strong>in</strong>to<br />
electronics <strong>an</strong>d automobiles.<br />
Starch based plastics<br />
Constitut<strong>in</strong>g about 50% of the bioplastics<br />
market, thermoplastic starch such as Plastarch<br />
currently represents the most import<strong>an</strong>t <strong>an</strong>d<br />
widely used bioplastic. Pure starch possesses the<br />
characteristic of be<strong>in</strong>g able to absorb humidity<br />
<strong>an</strong>d is thus be<strong>in</strong>g used for the production of<br />
drug capsules <strong>in</strong> the pharmaceutical sector.<br />
Additives such as sorbitol <strong>an</strong>d glycer<strong>in</strong>e are used<br />
to enable the starch to be processed thermoplastically.<br />
By vary<strong>in</strong>g the amounts of these<br />
additives, the characteristic of the material c<strong>an</strong><br />
be tailored to specific needs.<br />
Polylactic acid plastics<br />
PLA is a tr<strong>an</strong>sparent plastic produced from c<strong>an</strong>e<br />
sugar or glucose. It not only resembles<br />
conventional petrochemical mass plastics such as<br />
polyethylene or polypropylene <strong>in</strong> its<br />
characteristics, but it c<strong>an</strong> also be processed<br />
easily on st<strong>an</strong>dard equipment that already exists<br />
for the production of conventional plastics. PLA<br />
<strong>an</strong>d PLA-blends generally come <strong>in</strong> the form of<br />
gr<strong>an</strong>ulates. They are used <strong>in</strong> the plastic<br />
50
ANNEXES<br />
process<strong>in</strong>g <strong>in</strong>dustry for the production of foil,<br />
moulds, t<strong>in</strong>s, cups, bottles <strong>an</strong>d other packag<strong>in</strong>g.<br />
Poly-3-hydroxybutyrate<br />
The biopolymer poly-3-hydroxybutyrate (PHB) is a<br />
polyester produced by certa<strong>in</strong> bacteria as they<br />
process glucose or starch. Its characteristics are<br />
similar to those of petroplastic polypropylene.<br />
The South Americ<strong>an</strong> sugar <strong>in</strong>dustry has decided<br />
to exp<strong>an</strong>d PHB production to <strong>an</strong> <strong>in</strong>dustrial scale.<br />
PHB c<strong>an</strong> be used for production of tr<strong>an</strong>sparent<br />
film that is biodegradable without residue.<br />
Polyamide 11<br />
Polyamide 11 (PA 11) is a biopolymer derived<br />
from natural oil. It is also known by the trade<br />
name Rils<strong>an</strong> B, commercialised by Arkema. PA 11<br />
belongs to the technical polymers family <strong>an</strong>d is<br />
not biodegradable. PA 11 is used <strong>in</strong> high<br />
perform<strong>an</strong>ce applications such as automotive fuel<br />
l<strong>in</strong>es, pneumatic airbrake tub<strong>in</strong>g, electrical <strong>an</strong>titermite<br />
cable sheath<strong>in</strong>g, oil <strong>an</strong>d gas flexible<br />
pipes, sports shoes, electronic device<br />
components <strong>an</strong>d catheters.<br />
Genetically modified bioplastics<br />
Look<strong>in</strong>g further ahead, some of the second<br />
generation bioplastics m<strong>an</strong>ufactur<strong>in</strong>g<br />
technologies under development adopt a "pl<strong>an</strong>t<br />
factory" model <strong>in</strong> which they use genetically<br />
modified (GM) crops or genetically modified<br />
bacteria to optimise efficiency. A ch<strong>an</strong>ge <strong>in</strong> the<br />
consumer perception of GM technology <strong>in</strong> Europe<br />
will be required for these to be widely accepted.<br />
iii. Bio Build<strong>in</strong>g Blocks<br />
Hydrolysis pl<strong>an</strong>ts, based on a r<strong>an</strong>ge of processes,<br />
are already operat<strong>in</strong>g commercially.The Biof<strong>in</strong>e<br />
process, is a commercialised technology that<br />
uses two-step dilute m<strong>in</strong>eral acid hydrolysis to<br />
break down biomass conta<strong>in</strong><strong>in</strong>g lignocellulose<br />
<strong>in</strong>to <strong>in</strong>termediate chemicals that c<strong>an</strong> be further<br />
tr<strong>an</strong>sformed <strong>in</strong>to 2-Methyltetrahydrofur<strong>an</strong> (MeTHF)<br />
<strong>an</strong>d other chemical products. The Biof<strong>in</strong>e process<br />
was developed by BioMetics Inc with fund<strong>in</strong>g<br />
from the United States Department of <strong>Energy</strong>.<br />
A pilot pl<strong>an</strong>t produc<strong>in</strong>g 1 t/day of <strong>in</strong>termediate<br />
chemicals has been operat<strong>in</strong>g <strong>in</strong> South Glens<br />
Falls, New York s<strong>in</strong>ce 1998. The first commercialscale<br />
biomass-based pl<strong>an</strong>t, which produces 10<br />
t/day of levul<strong>in</strong>ic acid from local tobacco bagasse<br />
<strong>an</strong>d paper mill sludge, has been built <strong>in</strong> Caserta,<br />
Italy, by Le Calorie. This started operation <strong>in</strong><br />
2006.<br />
Levul<strong>in</strong>ic acid c<strong>an</strong> be produced <strong>in</strong> yields of up to<br />
70%, or about 0.5 kg per kg of cellulose, along<br />
with formic acid <strong>an</strong>d furfural as valuable by<br />
products. Used for years <strong>in</strong> food, fragr<strong>an</strong>ce, <strong>an</strong>d<br />
specialty chemical applications, levul<strong>in</strong>ic acid is a<br />
precursor for methyltetrahydrofur<strong>an</strong>,<br />
v-valerolactone, <strong>an</strong>d ethyl levul<strong>in</strong>ate, which c<strong>an</strong><br />
all be blended with diesel or gasol<strong>in</strong>e to create<br />
cle<strong>an</strong>er-burn<strong>in</strong>g fuels. Another derivative,<br />
diphenolic acid, is a potential replacement for<br />
bisphenol which is suspected to be <strong>an</strong> endocr<strong>in</strong>e<br />
disrupter.<br />
iv. Wood Board <strong>an</strong>d Eng<strong>in</strong>eered Wood Materials<br />
Wood board materials are made from th<strong>in</strong><br />
sheets (plywood), particles (particle board) <strong>an</strong>d<br />
oriented str<strong>an</strong>d board or fibers (fibreboard).<br />
Eng<strong>in</strong>eered wood <strong>in</strong>cludes a r<strong>an</strong>ge of derivative<br />
wood products which are m<strong>an</strong>ufactured by us<strong>in</strong>g<br />
adhesives to b<strong>in</strong>d together the str<strong>an</strong>ds,<br />
particles, fibers, or veneers of wood to form<br />
composite materials. These products are<br />
eng<strong>in</strong>eered to precise design specifications<br />
which are tested to meet national or<br />
<strong>in</strong>ternational st<strong>an</strong>dards.<br />
Typically, eng<strong>in</strong>eered wood products are made<br />
from the same hardwoods <strong>an</strong>d softwoods that<br />
are used to m<strong>an</strong>ufacture lumber. Sawmill scraps<br />
<strong>an</strong>d other wood waste c<strong>an</strong> be used for<br />
eng<strong>in</strong>eered wood composed of wood particles or<br />
51
RENEWABLE ENERGY IN INDUSTRIAL APPLICATIONS<br />
fibers, but whole logs are usually used for<br />
veneers, such as plywood. It is also possible to<br />
m<strong>an</strong>ufacture similar eng<strong>in</strong>eered cellulosic<br />
products from other lign<strong>in</strong>-conta<strong>in</strong><strong>in</strong>g materials<br />
such as bamboo, straw, or sugar c<strong>an</strong>e residue.<br />
Eng<strong>in</strong>eered wood products are beneficial from <strong>an</strong><br />
energy <strong>an</strong>d CO2 perspective because:<br />
• They c<strong>an</strong> be made from fast grow<strong>in</strong>g crops or<br />
residues;<br />
• Their properties are superior to those of<br />
natural wood;<br />
• They open up new markets where wood could<br />
not compete;<br />
• They reduce the dem<strong>an</strong>d for tropical<br />
hardwoods.<br />
The st<strong>an</strong>d<strong>in</strong>g wood stock is about 422 Gt<br />
worldwide. The total global production of woodbased<br />
p<strong>an</strong>els, <strong>in</strong>clud<strong>in</strong>g plywood, particle board,<br />
fibre board <strong>an</strong>d oriented str<strong>an</strong>d board, reached<br />
266 million m 3 <strong>in</strong> 2007, about 175 Mt).<br />
Production of saw logs <strong>an</strong>d veneer logs<br />
amounted to1 007 million m 3 <strong>in</strong> the same year,<br />
<strong>an</strong>d of <strong>in</strong>dustrial roundwood to around 1 705<br />
million m 3 . This is around half of the total<br />
roundwood production of 3 591 million m 3 <strong>in</strong> the<br />
same year, the other half of which was used <strong>in</strong><br />
energy production.<br />
Eng<strong>in</strong>eered wood products accounted for only<br />
600 000 m 3 <strong>in</strong> 2007, about 0.3 Mt. Eng<strong>in</strong>eered<br />
wood product markets are very small today<br />
compared to conventional wood markets.<br />
New products such as pressed bamboo c<strong>an</strong><br />
achieve considerable strengths, comparable to<br />
that of tropical hardwoods. This market is<br />
grow<strong>in</strong>g rapidly. Total global bamboo production<br />
is of the order of 100 Mt per year. Ch<strong>in</strong>a is by far<br />
the largest producer, produc<strong>in</strong>g 60 Mt 80 Mt/yr),<br />
followed by India. Bamboo production is rapidly<br />
exp<strong>an</strong>d<strong>in</strong>g worldwide.<br />
52
ANNEXES<br />
ANNEX 4<br />
Solar thermal heat<strong>in</strong>g <strong>an</strong>d cool<strong>in</strong>g systems<br />
for <strong>in</strong>dustry<br />
Solar heat<strong>in</strong>g is a well established <strong>an</strong>d<br />
commercial technology for residential hot water<br />
<strong>an</strong>d heat<strong>in</strong>g applications. So far, solar heat<strong>in</strong>g <strong>in</strong><br />
<strong>in</strong>dustry has been limited to a small number of<br />
demonstration projects. Solar thermal is not<br />
particularly well suited to the high temperatures<br />
that are generally needed for <strong>in</strong>dustrial<br />
applications other th<strong>an</strong> <strong>in</strong> the food sector. Solar<br />
thermal technologies could be attractive <strong>in</strong> the<br />
food sector, especially <strong>in</strong> develop<strong>in</strong>g countries<br />
with abund<strong>an</strong>t solar irradiation. Solar cool<strong>in</strong>g is<br />
<strong>an</strong> emerg<strong>in</strong>g technology, still at <strong>an</strong> earlier stage<br />
of development th<strong>an</strong> solar heat<strong>in</strong>g.<br />
This Annex provides a brief overview of current<br />
solar thermal technologies <strong>an</strong>d illustrates these<br />
with a selection of examples of <strong>in</strong>dustrial<br />
applications of solar heat<strong>in</strong>g <strong>an</strong>d cool<strong>in</strong>g.<br />
Operat<strong>in</strong>g Solar Thermal Pl<strong>an</strong>ts for <strong>Industrial</strong><br />
<strong>Applications</strong>:<br />
Statistics as of October 2006<br />
More th<strong>an</strong> 80 solar thermal pl<strong>an</strong>ts with a total<br />
collection area of about 34 000 m2 were <strong>in</strong><br />
operation <strong>in</strong> <strong>in</strong>dustrial applications <strong>in</strong> October<br />
2006. Most of these were <strong>in</strong> the food <strong>in</strong>dustry,<br />
particularly <strong>in</strong> dairies, <strong>in</strong> car wash<strong>in</strong>g facilities, or<br />
<strong>in</strong> metal treatment <strong>an</strong>d textile <strong>an</strong>d chemical<br />
pl<strong>an</strong>ts. The textile sector accounts for the highest<br />
share, at about 40%, of the capacity <strong>in</strong>stalled.<br />
Solar heat is used at 20° - 90°C for wash<strong>in</strong>g, the<br />
space heat<strong>in</strong>g of production halls <strong>an</strong>d the<br />
preheat<strong>in</strong>g of boiler feed-water. In the dairy<br />
sector, for example <strong>in</strong> Greece, solar is used to<br />
produce hot water for the wash<strong>in</strong>g of equipment<br />
<strong>an</strong>d to preheat boiler feed-water at temperature<br />
levels up to 80°C. In Austria, the space heat<strong>in</strong>g of<br />
production halls is the most common application.<br />
Car, lorry <strong>an</strong>d conta<strong>in</strong>er wash<strong>in</strong>g facilities account<br />
for 11 pl<strong>an</strong>ts <strong>in</strong> Austria, Germ<strong>an</strong>y <strong>an</strong>d Spa<strong>in</strong>.<br />
W<strong>in</strong>eries account for 4 of the 6 pl<strong>an</strong>ts reported<br />
with<strong>in</strong> the beverage sector, where there rema<strong>in</strong>s a<br />
large potential for future applications.<br />
The ma<strong>in</strong> solar thermal technologies are<br />
described briefly below. About 80% of the pl<strong>an</strong>ts<br />
supply heat below 100°C. These are mostly flat<br />
plate collectors or evacuated tube collector<br />
systems work<strong>in</strong>g at 60° - 100°C. Only evacuated<br />
tube collectors are used <strong>in</strong> the r<strong>an</strong>ge 100° -<br />
160°C. Above 160°C, parabolic trough collectors<br />
are used ma<strong>in</strong>ly for steam production or cool<strong>in</strong>g<br />
with double effect absorption chillers.<br />
Solar thermal for process heat: Collector<br />
Overview 14<br />
New designs for concentrat<strong>in</strong>g solar collectors are<br />
appear<strong>in</strong>g on the market, dedicated to specific<br />
niches or needs. Some of these c<strong>an</strong> be <strong>in</strong>tegrated<br />
<strong>in</strong>to roof structures, produc<strong>in</strong>g more th<strong>an</strong> 200°C of<br />
temperature <strong>in</strong>crease at 60% efficiency, such as the<br />
Chromasun design. Others enable the comb<strong>in</strong>ed<br />
production of electricity, heat, desal<strong>in</strong>ation <strong>an</strong>d air<br />
condition<strong>in</strong>g at a household level.<br />
In the field of solar concentrators, all the<br />
technologies use one of a limited r<strong>an</strong>ge of<br />
available optical designs. Cassegra<strong>in</strong> designs<br />
(Schmidt-Cassegra<strong>in</strong>, Maksutov-Cassegra<strong>in</strong>) that<br />
<strong>in</strong>tensely concentrate the light have not yet<br />
penetrated the solar thermal market, although<br />
they are very common <strong>in</strong> astronomical optics. A<br />
similar design has been recently implemented <strong>in</strong><br />
C<strong>an</strong>ada <strong>an</strong>d has been patented as the K<strong>in</strong>ley<br />
Dual Mirror System. In its <strong>in</strong>itial tests, this design<br />
reached 1755°C before melt<strong>in</strong>g the plat<strong>in</strong>um<br />
thermocouples that were measur<strong>in</strong>g the<br />
temperature reached by the system. In niche<br />
applications, this could provide <strong>an</strong> <strong>in</strong>terest<strong>in</strong>g<br />
14<br />
Overview from http://www.iea-shc.org/publications/downloads/task33-Process_Heat_Collectors.pdf<br />
Source: IEA Task 33<br />
53
RENEWABLE ENERGY IN INDUSTRIAL APPLICATIONS<br />
solution for the melt<strong>in</strong>g or even the vaporisation<br />
of small qu<strong>an</strong>tities of metals.<br />
A similar device is <strong>in</strong>stalled <strong>in</strong> the Paul Scherrer<br />
Institut (PSI) <strong>in</strong> Switzerl<strong>an</strong>d <strong>an</strong>d known as High-<br />
Flux Solar Furnace. The furnace consists of a 120m 2<br />
sun-track<strong>in</strong>g flat heliostat on-axis with <strong>an</strong> 8.5 m-<br />
diameter paraboloidal concentrator. It delivers up<br />
to 40 kW at peak concentration ratios exceed<strong>in</strong>g<br />
5000 suns (1 sun = 1 kW/m 2 ²). The solar flux<br />
<strong>in</strong>tensity c<strong>an</strong> be further augmented to up to<br />
10 000 suns by us<strong>in</strong>g CPC secondary concentrators.<br />
A veneti<strong>an</strong> bl<strong>in</strong>d-type shutter located between the<br />
heliostat <strong>an</strong>d the concentrator controls the power<br />
<strong>in</strong>put to the reactor.<br />
Examples of solar thermal systems applied<br />
to the Greek dairy <strong>in</strong>dustry<br />
Two applications of solar thermal systems <strong>in</strong> the<br />
dairy <strong>in</strong>dustry <strong>in</strong> Greece are described <strong>in</strong> the box<br />
below (Karagiorgas et al., 2001).<br />
M<strong>an</strong>drekas S.A.<br />
M<strong>an</strong>drekas S.A. is a small dairy situated on the outskirts of the city of Kor<strong>in</strong>thos. Its ma<strong>in</strong><br />
<strong>in</strong>dustrial activity is the production of dairy products such as yoghurt, milk <strong>an</strong>d cream. Steam is<br />
required by a r<strong>an</strong>ge of pl<strong>an</strong>t processes, <strong>in</strong>clud<strong>in</strong>g pasteurisation, sterilisation, evaporation <strong>an</strong>d<br />
dry<strong>in</strong>g, <strong>an</strong>d hot water is required to ma<strong>in</strong>ta<strong>in</strong> the yoghurt at 45°C dur<strong>in</strong>g its matur<strong>in</strong>g process.<br />
Steam is provided by a steam boiler runn<strong>in</strong>g on liquid prop<strong>an</strong>e gas (LPG), the cold water be<strong>in</strong>g<br />
supplied by the water supply grid, <strong>an</strong>d hot water is provided by the solar system. The factory<br />
uses 15m 3 of hot water a day.<br />
The solar system was <strong>in</strong>stalled <strong>in</strong> 1993. It consists of 170m 2 of tube-n, flat plate collectors<br />
coated with black pa<strong>in</strong>t located on the roof of the factory, <strong>an</strong> open loop circuit <strong>an</strong>d two parallel,<br />
horizontal, 1000 l closed storage t<strong>an</strong>ks located <strong>in</strong> the boiler room of the dairy. The water from<br />
the water supply grid enters the solar storage t<strong>an</strong>ks <strong>an</strong>d from there is fed to the solar collectors<br />
where it is heated <strong>an</strong>d returned to the solar storage t<strong>an</strong>ks. The hot water leav<strong>in</strong>g the solar<br />
storage t<strong>an</strong>ks is either fed directly to the factory's washrooms or is fed to the yoghurt matur<strong>in</strong>g<br />
process <strong>an</strong>d then returned to the t<strong>an</strong>ks. Any auxiliary heat<strong>in</strong>g required by the yoghurt matur<strong>in</strong>g<br />
process is provided via a heat exch<strong>an</strong>ger, which receives steam from the steam boiler.<br />
The system is still operational <strong>an</strong>d <strong>in</strong> very good work<strong>in</strong>g order. The hot water requirements of<br />
the yoghurt matur<strong>in</strong>g process are much smaller th<strong>an</strong> the amount of hot water produced by the<br />
solar system which is oversized for the need. In addition, given the low hot water requirement<br />
of the yoghurt matur<strong>in</strong>g process, the steam heat exch<strong>an</strong>ger is heat<strong>in</strong>g the solar storage t<strong>an</strong>ks<br />
thereby reduc<strong>in</strong>g the efficiency of the solar system.<br />
Mevgal S.A.<br />
Mevgal S.A. is a dairy situated on the outskirts of the city of Thessaloniki. Its ma<strong>in</strong> <strong>in</strong>dustrial<br />
activity is the production of dairy products such as butter, cheese <strong>an</strong>d buttermilk. Steam is<br />
required for pasteurisation, sterilisation, evaporation <strong>an</strong>d dry<strong>in</strong>g <strong>an</strong>d hot water is required for<br />
the cle<strong>an</strong><strong>in</strong>g <strong>an</strong>d dis<strong>in</strong>fect<strong>in</strong>g of utensils <strong>an</strong>d mach<strong>in</strong>ery. Orig<strong>in</strong>ally, steam was provided by steam<br />
boilers runn<strong>in</strong>g on heavy oil which fed cold water exch<strong>an</strong>gers. Today the hot water produced by<br />
a solar system is used to pre-heat the water; electric resist<strong>an</strong>ce heaters provide <strong>an</strong>y auxiliary<br />
heat<strong>in</strong>g required. The system is operational <strong>an</strong>d <strong>in</strong> excellent work<strong>in</strong>g order.<br />
54
ANNEXES<br />
Solar cool<strong>in</strong>g technologies for <strong>in</strong>dustrial<br />
applications<br />
Solar cool<strong>in</strong>g technologies have so far been used<br />
primarily for space cool<strong>in</strong>g. <strong>Applications</strong> for<br />
process cold, especially below zero degrees, have<br />
been typically powered with fossil fuel burners or<br />
electric chillers. For solar systems without<br />
traditional burners, adsorption technologies are<br />
the most promis<strong>in</strong>g. They r<strong>an</strong>ge from 5 kW to<br />
600 kW capacity, with m<strong>in</strong>imum water<br />
temperatures between 50° <strong>an</strong>d 60°C.<br />
For systems with auxiliary burners available, deep<br />
freez<strong>in</strong>g down to -50°C is possible us<strong>in</strong>g<br />
ammonia-water absorption chillers. Other options<br />
may be to use high temperature solar collectors,<br />
such as parabolic trough collectors (PTC) or<br />
l<strong>in</strong>ear fresnel collectors (LFC). Well established<br />
comp<strong>an</strong>ies with experience <strong>in</strong> high-temperature<br />
solar thermal systems <strong>an</strong>d solar cool<strong>in</strong>g such as<br />
Solitem are already deploy<strong>in</strong>g PTC systems<br />
successfully. The problem <strong>in</strong> deep freez<strong>in</strong>g with<br />
concentration solar technologies is that where<br />
direct solar radiation is strong enough to ensure<br />
the production of high temperature process heat<br />
for driv<strong>in</strong>g the absorption ammonia-water chiller,<br />
the outside temperature is also very high. The<br />
higher the outside temperature, the less cold the<br />
temperature that c<strong>an</strong> be reached, given a<br />
maximum temperature decrease of 55° Kelv<strong>in</strong> (K)<br />
(Table 7).<br />
DY Refrigeration from Ch<strong>in</strong>a (now acquired by the<br />
C<strong>an</strong>adi<strong>an</strong> comp<strong>an</strong>y Thermalfrost) is <strong>in</strong> the process<br />
of implement<strong>in</strong>g solar cool<strong>in</strong>g applications down<br />
to -30°C <strong>in</strong> a dairy <strong>in</strong>dustry demonstration pl<strong>an</strong>t.<br />
Table 7<br />
Ma<strong>in</strong> characteristics of thermally driven chillers<br />
S<strong>in</strong>gle effect Double effect Triple effect S<strong>in</strong>gle effect<br />
H2O/LiBr H2O/LiBr H2O/LiBr NH3/H2O<br />
Temperature drop (max) 25° K 25o K 25° K 55° K<br />
Temperature of Cold 5° to 20°C 5° to 20°C 5° to 20°C -20° to 20°C<br />
Driv<strong>in</strong>g temperature 70° to 90°C 140° to 180°C 230° to 270°C 160° to 180°C<br />
Max. COP 0.7 - 0.8 1.1 - 1.4 1.6 - 1.8 0.6 - 0.7<br />
55
RENEWABLE ENERGY IN INDUSTRIAL APPLICATIONS<br />
One of the largest solar cool<strong>in</strong>g systems is <strong>in</strong>stalled <strong>in</strong> Sud<strong>an</strong>. It provides cool<strong>in</strong>g to a hospital, the<br />
Salam Centre for Cardiac Surgery, run by the NGO Emergency under critical operat<strong>in</strong>g conditions as<br />
described <strong>in</strong> the Box below.<br />
Every hour, the Salam Centre requires 28 000 m 3 of cold air.<br />
This has been achieved by a system employ<strong>in</strong>g 288 vacuum-sealed solar collectors with a total<br />
surface of 900 m 2 . These produce 3 600 kWh with zero CO2 emissions, <strong>an</strong> amount of energy that<br />
would otherwise require the burn<strong>in</strong>g 335 kg of gasol<strong>in</strong>e per hour. Each solar collector houses<br />
copper tub<strong>in</strong>g lodged <strong>in</strong>side vacuum-chambered glass tubes through which water circulates,<br />
allow<strong>in</strong>g the sun to heat the water by irradiation without heat dispersion. The water runn<strong>in</strong>g<br />
through the pipes constitutes the vector fluid tr<strong>an</strong>sferr<strong>in</strong>g heat to a 50 m 3 reservoir, where water<br />
is stored at a temperature around 90°C. The tr<strong>an</strong>sformation of heat <strong>in</strong>to cool<strong>in</strong>g power takes<br />
place <strong>in</strong> two absorption chillers, where the circulat<strong>in</strong>g hot water heats up a solution of Lithium<br />
bromide. By reach<strong>in</strong>g the gaseous state, Lithium bromide removes heat <strong>an</strong>d water cools down to<br />
7°C. This cold water is then circulated <strong>in</strong> the Air Treatment Units (ATU), cool<strong>in</strong>g air to the desired<br />
temperatures. From the 8 ATU <strong>in</strong>stalled <strong>in</strong> the Centre, air is then further filtered by F7, F9 or<br />
absolute filters, accord<strong>in</strong>g to the needs of the different areas of the Centre. When solar energy is<br />
<strong>in</strong>sufficient to meet the Centre's cool<strong>in</strong>g requirements, two gasol<strong>in</strong>e boilers switch on<br />
automatically, re-adjust<strong>in</strong>g the water temperature <strong>in</strong> the reservoir, ensur<strong>in</strong>g <strong>an</strong> optimal<br />
function<strong>in</strong>g of the chillers.<br />
Another example is the use of solar heat for the dairy <strong>in</strong>dustry. Various designs have been<br />
demonstrated. One of them is the so-called ARUN concentrator (Kedare et al., 2008).<br />
56
ANNEXES<br />
ANNEX 5<br />
Cost-effectiveness of renewables for<br />
<strong>in</strong>dustrial use<br />
The competitiveness of renewables with fossil<br />
fuels is strongly dependent on national<br />
conditions <strong>an</strong>d on fluctuations of energy prices <strong>in</strong><br />
<strong>in</strong>ternational markets. Accord<strong>in</strong>g to the IEA<br />
<strong>Energy</strong> Prices <strong>an</strong>d Taxes database, between 1998<br />
<strong>an</strong>d 2009 natural gas end-use prices for <strong>in</strong>dustry<br />
were at a m<strong>in</strong>imum <strong>in</strong> 2000 of USD 16/tonne of<br />
oil equivalent (toe) <strong>in</strong> the Russi<strong>an</strong> Federation <strong>an</strong>d<br />
at a maximum <strong>in</strong> 2008 of USD 953/toe <strong>in</strong><br />
Hungary, vary<strong>in</strong>g by a factor of almost 60. At the<br />
end of 2009, the lowest <strong>an</strong>d highest <strong>in</strong>dustrial<br />
end-use natural gas prices varied by a factor of<br />
around 10, from USD 90/toe <strong>in</strong> Kazakhst<strong>an</strong> to<br />
USD 870/toe <strong>in</strong> Denmark.<br />
Similarly, coal prices varied by a factor of 30<br />
from a m<strong>in</strong>imum of USD 13/toe <strong>in</strong> Kazakhst<strong>an</strong> <strong>in</strong><br />
2003 <strong>an</strong>d a maximum of USD 422/toe <strong>in</strong> 2008 <strong>in</strong><br />
Switzerl<strong>an</strong>d. At the end of 2009, prices differed<br />
by a factor of almost 15, between USD 26/toe <strong>in</strong><br />
Kazakhst<strong>an</strong> <strong>an</strong>d USD 373/toe <strong>in</strong> Austria.<br />
If a liquid, effective <strong>an</strong>d efficient carbon market<br />
was be <strong>in</strong> place, the price of CO2 would be one<br />
of the ma<strong>in</strong> factors <strong>in</strong> determ<strong>in</strong><strong>in</strong>g the success of<br />
renewable energy <strong>an</strong>d the mix of fossil fuels<br />
(Figure 18). In the short term, the exist<strong>in</strong>g pl<strong>an</strong>t<br />
<strong>in</strong>frastructure is a signific<strong>an</strong>t barrier to pricedriven<br />
fuel switch<strong>in</strong>g. But <strong>in</strong> the longer term, if<br />
prices stabilise on the carbon market <strong>an</strong>d major<br />
energy consumers become more directly <strong>in</strong>volved,<br />
more carbon <strong>in</strong>tensive fuels such as coal will see<br />
their role reduced <strong>in</strong> favour of less carbon<strong>in</strong>tensive<br />
fuels such as natural gas <strong>an</strong>d<br />
renewables. Biomass, through pre-process<strong>in</strong>g<br />
technologies, will offer the only short term option<br />
for coal substitution without <strong>an</strong>y replacement of<br />
the exist<strong>in</strong>g equipment, especially <strong>in</strong> sectors<br />
where the carbon content of the fuel is<br />
fundamental to the <strong>in</strong>dustrial process such as <strong>in</strong><br />
the iron steel <strong>an</strong>d chemical <strong>an</strong>d petrochemical<br />
sectors.<br />
Figure 18<br />
Cost of useful process heat produced by ma<strong>in</strong> fossil fuels, under different CO2 prices<br />
35<br />
Comparison of <strong>in</strong>dustrial process heat costs<br />
under different CO2 prices<br />
30<br />
25<br />
USD/GJ<br />
20<br />
15<br />
10<br />
5<br />
0<br />
coal<br />
natural gas<br />
10 20 30 40 50 60 70 80 90 100 110 120 130 140 150 160 170 180 190 200<br />
USD/t CO2<br />
57
RENEWABLE ENERGY IN INDUSTRIAL APPLICATIONS<br />
58
UNITED NATIONS INDUSTRIAL DEVELOPMENT ORGANIZATION<br />
Vienna International Centre, P.O. Box 300, 1400 Vienna, Austria<br />
Telephone: (+43-1) 26026-0, Fax: (+43-1) 26926-69<br />
E-mail: unido@unido.org, Internet: www.unido.org