Contents - Middle East Journal of Family Medicine
Contents - Middle East Journal of Family Medicine
Contents - Middle East Journal of Family Medicine

You also want an ePaper? Increase the reach of your titles
YUMPU automatically turns print PDFs into web optimized ePapers that Google loves.
ORIGINAL CONTRIBUTION AND<br />
CLINICAL INVESTIGATION<br />
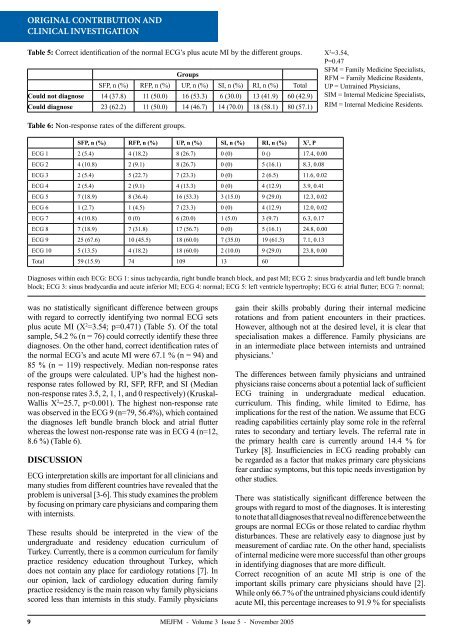
Table 5: Correct identification <strong>of</strong> the normal ECG’s plus acute MI by the different groups.<br />
Groups<br />
SFP, n (%) RFP, n (%) UP, n (%) SI, n (%) RI, n (%) Total<br />
Could not diagnose 14 (37.8) 11 (50.0) 16 (53.3) 6 (30.0) 13 (41.9) 60 (42.9)<br />
Could diagnose 23 (62.2) 11 (50.0) 14 (46.7) 14 (70.0) 18 (58.1) 80 (57.1)<br />
X 2 =3.54,<br />
P=0.47<br />
SFM = <strong>Family</strong> <strong>Medicine</strong> Specialists,<br />
RFM = <strong>Family</strong> <strong>Medicine</strong> Residents,<br />
UP = Untrained Physicians,<br />
SIM = Internal <strong>Medicine</strong> Specialists,<br />
RIM = Internal <strong>Medicine</strong> Residents.<br />
Table 6: Non-response rates <strong>of</strong> the different groups.<br />
SFP, n (%) RFP, n (%) UP, n (%) SI, n (%) RI, n (%) X 2 , P<br />
ECG 1 2 (5.4) 4 (18.2) 8 (26.7) 0 (0) 0 () 17.4, 0.00<br />
ECG 2 4 (10.8) 2 (9.1) 8 (26.7) 0 (0) 5 (16.1) 8.3, 0.08<br />
ECG 3 2 (5.4) 5 (22.7) 7 (23.3) 0 (0) 2 (6.5) 11.6, 0.02<br />
ECG 4 2 (5.4) 2 (9.1) 4 (13.3) 0 (0) 4 (12.9) 3.9, 0.41<br />
ECG 5 7 (18.9) 8 (36.4) 16 (53.3) 3 (15.0) 9 (29.0) 12.3, 0.02<br />
ECG 6 1 (2.7) 1 (4.5) 7 (23.3) 0 (0) 4 (12.9) 12.0, 0.02<br />
ECG 7 4 (10.8) 0 (0) 6 (20.0) 1 (5.0) 3 (9.7) 6.3, 0.17<br />
ECG 8 7 (18.9) 7 (31.8) 17 (56.7) 0 (0) 5 (16.1) 24.8, 0.00<br />
ECG 9 25 (67.6) 10 (45.5) 18 (60.0) 7 (35.0) 19 (61.3) 7.1, 0.13<br />
ECG 10 5 (13.5) 4 (18.2) 18 (60.0) 2 (10.0) 9 (29.0) 23.8, 0.00<br />
Total 59 (15.9) 74 109 13 60<br />
Diagnoses within each ECG: ECG 1: sinus tachycardia, right bundle branch block, and past MI; ECG 2: sinus bradycardia and left bundle branch<br />
block; ECG 3: sinus bradycardia and acute inferior MI; ECG 4: normal; ECG 5: left ventricle hypertrophy; ECG 6: atrial flutter; ECG 7: normal;<br />
was no statistically significant difference between groups<br />
with regard to correctly identifying two normal ECG sets<br />
plus acute MI (X 2 =3.54; p=0.471) (Table 5). Of the total<br />
sample, 54.2 % (n = 76) could correctly identify these three<br />
diagnoses. On the other hand, correct identification rates <strong>of</strong><br />
the normal ECG’s and acute MI were 67.1 % (n = 94) and<br />
85 % (n = 119) respectively. Median non-response rates<br />
<strong>of</strong> the groups were calculated. UP’s had the highest nonresponse<br />
rates followed by RI, SFP, RFP, and SI (Median<br />
non-response rates 3.5, 2, 1, 1, and 0 respectively) (Kruskal-<br />
Wallis X 2 =25.7, p