Contents - Middle East Journal of Family Medicine
Contents - Middle East Journal of Family Medicine
Contents - Middle East Journal of Family Medicine

Create successful ePaper yourself
Turn your PDF publications into a flip-book with our unique Google optimized e-Paper software.
ORIGINAL CONTRIBUTION AND<br />
CLINICAL INVESTIGATION<br />
total response rates (CS + FS) <strong>of</strong> SIM, RIM, SFM, RFM,<br />
UP were 11.05, 9.87, 9.59, 9.32, and 7.13 respectively<br />
(Figure 1). There was a statistically significant difference<br />
between these values (F=18.983, p=0.000). Tukey’s post<br />
hoc analysis was performed in order to search for the<br />
groups creating the difference (Table 3). This analysis<br />
revealed that untrained physicians were less successful<br />
compared with family practice specialists and internal<br />
medicine specialists, whereas family practice residents were<br />
less successful compared with internal medicine specialists<br />
and internal medicine residents.<br />
<strong>Family</strong> practice residents received the highest false scores<br />
whereas internal medicine specialists received the lowest<br />
false scores (mean ± SD: 2.73 ± 1.98 vs. 1.20 ± 1.15). The<br />
mean false scores for family practice specialists, internal<br />
medicine residents, and untrained physicians were 2.54 ±<br />
1.63, 1.71 ± 1.07, and 2.40 ± 1.54 respectively (Figure 1).<br />
There was a statistically significant difference between these<br />
values (F = 4.284, p = 0.003). Tukey’s post hoc analysis<br />
was performed in order to determine the groups responsible<br />
from the difference (Table 4).<br />
The highest error rate was in the ECG set with pacemaker<br />
and atrial fibrillation diagnoses. 32.8 % (n = 46) <strong>of</strong> the<br />
participants received false scores from this ECG set. The<br />
lowest error rate was in the ECG set with acute myocardial<br />
infarction and sinus bradycardia. Only 7.9 % <strong>of</strong> the<br />
participants (n = 11) got false scores from this ECG set.<br />
Normal ECG and acute MI were selected as the most<br />
important key diagnoses important for all specialties There<br />
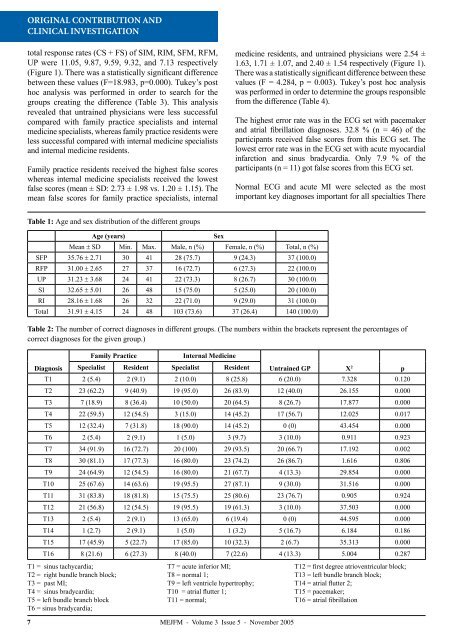
Table 1: Age and sex distribution <strong>of</strong> the different groups<br />
Table 2: The number <strong>of</strong> correct diagnoses in different groups. (The numbers within the brackets represent the percentages <strong>of</strong><br />
correct diagnoses for the given group.)<br />
Diagnosis<br />
Age (years)<br />
Mean ± SD Min. Max. Male, n (%) Female, n (%) Total, n (%)<br />
SFP 35.76 ± 2.71 30 41 28 (75.7) 9 (24.3) 37 (100.0)<br />
RFP 31.00 ± 2.65 27 37 16 (72.7) 6 (27.3) 22 (100.0)<br />
UP 31.23 ± 3.68 24 41 22 (73.3) 8 (26.7) 30 (100.0)<br />
SI 32.65 ± 5.01 26 48 15 (75.0) 5 (25.0) 20 (100.0)<br />
RI 28.16 ± 1.68 26 32 22 (71.0) 9 (29.0) 31 (100.0)<br />
Total 31.91 ± 4.15 24 48 103 (73.6) 37 (26.4) 140 (100.0)<br />
<strong>Family</strong> Practice<br />
Sex<br />
Internal <strong>Medicine</strong><br />
Specialist Resident Specialist Resident<br />
Untrained GP X 2 p<br />
T1 2 (5.4) 2 (9.1) 2 (10.0) 8 (25.8) 6 (20.0) 7.328 0.120<br />
T2 23 (62.2) 9 (40.9) 19 (95.0) 26 (83.9) 12 (40.0) 26.155 0.000<br />
T3 7 (18.9) 8 (36.4) 10 (50.0) 20 (64.5) 8 (26.7) 17.877 0.000<br />
T4 22 (59.5) 12 (54.5) 3 (15.0) 14 (45.2) 17 (56.7) 12.025 0.017<br />
T5 12 (32.4) 7 (31.8) 18 (90.0) 14 (45.2) 0 (0) 43.454 0.000<br />
T6 2 (5.4) 2 (9.1) 1 (5.0) 3 (9.7) 3 (10.0) 0.911 0.923<br />
T7 34 (91.9) 16 (72.7) 20 (100) 29 (93.5) 20 (66.7) 17.192 0.002<br />
T8 30 (81.1) 17 (77.3) 16 (80.0) 23 (74.2) 26 (86.7) 1.616 0.806<br />
T9 24 (64.9) 12 (54.5) 16 (80.0) 21 (67.7) 4 (13.3) 29.854 0.000<br />
T10 25 (67.6) 14 (63.6) 19 (95.5) 27 (87.1) 9 (30.0) 31.516 0.000<br />
T11 31 (83.8) 18 (81.8) 15 (75.5) 25 (80.6) 23 (76.7) 0.905 0.924<br />
T12 21 (56.8) 12 (54.5) 19 (95.5) 19 (61.3) 3 (10.0) 37.503 0.000<br />
T13 2 (5.4) 2 (9.1) 13 (65.0) 6 (19.4) 0 (0) 44.595 0.000<br />
T14 1 (2.7) 2 (9.1) 1 (5.0) 1 (3.2) 5 (16.7) 6.184 0.186<br />
T15 17 (45.9) 5 (22.7) 17 (85.0) 10 (32.3) 2 (6.7) 35.313 0.000<br />
T16 8 (21.6) 6 (27.3) 8 (40.0) 7 (22.6) 4 (13.3) 5.004 0.287<br />
T1 = sinus tachycardia;<br />
T2 = right bundle branch block;<br />
T3 = past MI;<br />
T4 = sinus bradycardia;<br />
T5 = left bundle branch block<br />
T6 = sinus bradycardia;<br />
T7 = acute inferior MI;<br />
T8 = normal 1;<br />
T9 = left ventricle hypertrophy;<br />
T10 = atrial flutter 1;<br />
T11 = normal;<br />
T12 = first degree atrioventricular block;<br />
T13 = left bundle branch block;<br />
T14 = atrial flutter 2;<br />
T15 = pacemaker;<br />
T16 = atrial fibrillation<br />
7<br />
MEJFM - Volume 3 Issue 5 - November 2005