percentage greater than specified scaled score - TISC
percentage greater than specified scaled score - TISC
percentage greater than specified scaled score - TISC

Create successful ePaper yourself
Turn your PDF publications into a flip-book with our unique Google optimized e-Paper software.
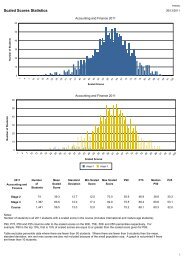
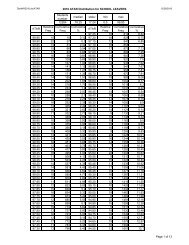
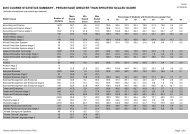
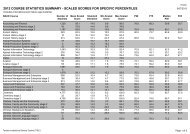
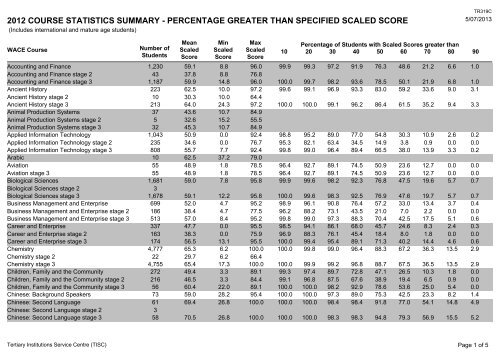
2012 COURSE STATISTICS SUMMARY - PERCENTAGE GREATER THAN SPECIFIED SCALED SCORE<br />
(Includes international and mature age students)<br />
TR319C<br />
5/07/2013<br />
WACE Course<br />
Number of<br />
Students<br />
Mean<br />
Scaled<br />
Score<br />
Min<br />
Scaled<br />
Score<br />
Max<br />
Scaled<br />
Score<br />
Percentage of Students with Scaled Scores <strong>greater</strong> <strong>than</strong><br />
10 20 30 40 50 60 70 80 90<br />
Accounting and Finance 1,230 59.1 8.8 96.0 99.9 99.3 97.2 91.9 76.3 48.6 21.2 6.6 1.0<br />
Accounting and Finance stage 2<br />
43 37.8 8.8 76.8<br />
Accounting and Finance stage 3 1,187 59.9 14.8 96.0 100.0 99.7 98.2 93.6 78.5 50.1 21.9 6.8 1.0<br />
Ancient History 223 62.5 10.0 97.2 99.6 99.1 96.9 93.3 83.0 59.2 33.6 9.0 3.1<br />
Ancient History stage 2<br />
10 30.3 10.0 64.4<br />
Ancient History stage 3 213 64.0 24.3 97.2 100.0 100.0 99.1 96.2 86.4 61.5 35.2 9.4 3.3<br />
Animal Production Systems<br />
37 43.6 10.7 84.9<br />
Animal Production Systems stage 2<br />
5 32.6 15.2 55.5<br />
Animal Production Systems stage 3<br />
32 45.3 10.7 84.9<br />
Applied Information Technology 1,043 50.9 0.0 92.4 98.8 95.2 89.0 77.0 54.8 30.3 10.9 2.6 0.2<br />
Applied Information Technology stage 2 235 34.6 0.0 76.7 95.3 82.1 63.4 34.5 14.9 3.8 0.9 0.0 0.0<br />
Applied Information Technology stage 3 808 55.7 7.7 92.4 99.8 99.0 96.4 89.4 66.5 38.0 13.9 3.3 0.2<br />
Arabic<br />
10 62.5 37.2 79.0<br />
Aviation 55 48.9 1.8 78.5 96.4 92.7 89.1 74.5 50.9 23.6 12.7 0.0 0.0<br />
Aviation stage 3 55 48.9 1.8 78.5 96.4 92.7 89.1 74.5 50.9 23.6 12.7 0.0 0.0<br />
Biological Sciences 1,681 59.0 7.8 95.8 99.9 99.6 98.2 92.3 76.8 47.5 19.6 5.7 0.7<br />
Biological Sciences stage 2<br />
3<br />
Biological Sciences stage 3 1,678 59.1 12.2 95.8 100.0 99.6 98.3 92.5 76.9 47.6 19.7 5.7 0.7<br />
Business Management and Enterprise 699 52.0 4.7 95.2 98.9 96.1 90.8 76.4 57.2 33.0 13.4 3.7 0.4<br />
Business Management and Enterprise stage 2 186 38.4 4.7 77.5 96.2 88.2 73.1 43.5 21.0 7.0 2.2 0.0 0.0<br />
Business Management and Enterprise stage 3 513 57.0 8.4 95.2 99.8 99.0 97.3 88.3 70.4 42.5 17.5 5.1 0.6<br />
Career and Enterprise 337 47.7 0.0 95.5 98.5 94.1 86.1 68.0 45.7 24.6 8.3 2.4 0.3<br />
Career and Enterprise stage 2 163 38.3 0.0 75.9 96.9 88.3 76.1 45.4 18.4 8.0 1.8 0.0 0.0<br />
Career and Enterprise stage 3 174 56.5 13.1 95.5 100.0 99.4 95.4 89.1 71.3 40.2 14.4 4.6 0.6<br />
Chemistry 4,777 65.3 6.2 100.0 100.0 99.8 99.0 96.4 88.3 67.2 36.3 13.5 2.9<br />
Chemistry stage 2<br />
22 29.7 6.2 66.4<br />
Chemistry stage 3 4,755 65.4 17.3 100.0 100.0 99.9 99.2 96.8 88.7 67.5 36.5 13.5 2.9<br />
Children, Family and the Community 272 49.4 3.3 89.1 99.3 97.4 89.7 72.8 47.1 26.5 10.3 1.8 0.0<br />
Children, Family and the Community stage 2 216 46.5 3.3 84.4 99.1 96.8 87.5 67.6 38.9 19.4 6.5 0.9 0.0<br />
Children, Family and the Community stage 3 56 60.4 22.0 89.1 100.0 100.0 98.2 92.9 78.6 53.6 25.0 5.4 0.0<br />
Chinese: Background Speakers 73 59.0 28.2 95.4 100.0 100.0 97.3 89.0 75.3 42.5 23.3 8.2 1.4<br />
Chinese: Second Language 61 69.4 26.8 100.0 100.0 100.0 98.4 98.4 91.8 77.0 54.1 14.8 4.9<br />
Chinese: Second Language stage 2<br />
3<br />
Chinese: Second Language stage 3 58 70.5 26.8 100.0 100.0 100.0 98.3 98.3 94.8 79.3 56.9 15.5 5.2<br />
Tertiary Institutions Service Centre (<strong>TISC</strong>)<br />
Page 1 of 5
2012 COURSE STATISTICS SUMMARY - PERCENTAGE GREATER THAN SPECIFIED SCALED SCORE<br />
(Includes international and mature age students)<br />
5/07/2013<br />
WACE Course<br />
Number of<br />
Students<br />
Mean<br />
Scaled<br />
Score<br />
Min<br />
Scaled<br />
Score<br />
Max<br />
Scaled<br />
Score<br />
Percentage of Students with Scaled Scores <strong>greater</strong> <strong>than</strong><br />
10 20 30 40 50 60 70 80 90<br />
Computer Science 416 52.0 0.8 93.3 99.8 98.1 92.8 78.1 56.0 29.8 10.3 2.9 0.5<br />
Computer Science stage 2 74 37.0 0.8 70.9 98.6 93.2 74.3 39.2 12.2 4.1 1.4 0.0 0.0<br />
Computer Science stage 3 342 55.3 17.6 93.3 100.0 99.1 96.8 86.5 65.5 35.4 12.3 3.5 0.6<br />
Dance 364 52.6 0.0 92.3 98.4 95.6 89.3 77.5 60.2 35.7 15.7 3.3 0.5<br />
Dance stage 2 76 32.6 0.0 77.7 92.1 82.9 59.2 28.9 11.8 2.6 1.3 0.0 0.0<br />
Dance stage 3 288 57.9 14.1 92.3 100.0 99.0 97.2 90.3 72.9 44.4 19.4 4.2 0.7<br />
Design 622 52.1 0.0 94.9 98.9 96.8 90.4 79.6 58.7 32.6 11.4 2.7 0.3<br />
Design stage 2 146 36.9 0.0 72.5 95.2 87.7 67.8 44.5 17.8 6.2 2.1 0.0 0.0<br />
Design stage 3 476 56.7 15.9 94.9 100.0 99.6 97.3 90.3 71.2 40.8 14.3 3.6 0.4<br />
Drama 994 55.8 0.0 94.1 99.2 97.9 94.2 87.1 68.0 40.2 15.4 4.4 0.7<br />
Drama stage 2 56 29.0 0.0 64.5 89.3 75.0 41.1 23.2 7.1 5.4 0.0 0.0 0.0<br />
Drama stage 3 938 57.4 7.8 94.1 99.8 99.3 97.3 90.9 71.6 42.3 16.3 4.7 0.7<br />
Dutch<br />
2<br />
Earth and Environmental Science 265 54.7 12.3 89.3 100.0 98.9 94.7 85.7 65.3 37.0 11.3 3.4 0.0<br />
Earth and Environmental Science stage 2<br />
17 30.7 12.3 62.0<br />
Earth and Environmental Science stage 3 248 56.3 18.9 89.3 100.0 99.6 98.0 90.7 69.4 39.1 12.1 3.6 0.0<br />
Economics 1,918 62.2 13.0 98.6 100.0 99.7 98.4 94.1 82.7 59.3 28.2 9.2 1.7<br />
Economics stage 2<br />
38 41.3 13.9 67.8<br />
Economics stage 3 1,880 62.6 13.0 98.6 100.0 99.8 98.7 94.9 83.9 60.4 28.7 9.4 1.8<br />
Engineering Studies 259 54.4 0.0 92.5 98.5 94.6 89.6 80.7 67.2 41.3 16.2 5.0 0.8<br />
Engineering Studies stage 2 56 33.0 0.0 61.7 92.9 75.0 58.9 32.1 17.9 1.8 0.0 0.0 0.0<br />
Engineering Studies stage 3 203 60.2 23.0 92.5 100.0 100.0 98.0 94.1 80.8 52.2 20.7 6.4 1.0<br />
English 11,616 56.0 0.0 96.4 99.2 97.6 93.2 84.3 68.4 43.0 18.2 5.2 0.6<br />
English stage 2 2,202 36.8 0.0 78.1 96.0 88.6 70.7 41.5 17.1 4.7 0.7 0.0 0.0<br />
English stage 3 9,414 60.5 7.7 96.4 100.0 99.7 98.4 94.4 80.4 51.9 22.3 6.4 0.7<br />
English as an Additional Language or Dialect 1,199 57.4 0.0 100.0 99.1 98.2 94.3 85.7 69.7 46.7 22.1 7.2 1.6<br />
English as an Additional Language or Dialect stage 279 44.5 0.0 82.4 97.1 95.0 83.9 64.9 33.7 14.7 4.3 0.4 0.0<br />
English as an Additional Language or Dialect stage 920 61.4 3.5 100.0 99.7 99.2 97.5 92.1 80.7 56.4 27.5 9.2 2.1<br />
Food Science and Technology 342 51.8 5.7 100.0 99.4 97.7 91.8 79.8 51.5 29.5 13.5 4.7 1.5<br />
Food Science and Technology stage 2 246 46.5 5.7 84.2 99.2 97.2 89.0 73.6 38.2 15.4 4.1 0.4 0.0<br />
Food Science and Technology stage 3 96 65.4 18.4 100.0 100.0 99.0 99.0 95.8 85.4 65.6 37.5 15.6 5.2<br />
French 480 68.4 30.9 100.0 100.0 100.0 100.0 97.7 92.1 74.4 46.7 19.0 5.6<br />
French stage 2<br />
1<br />
French stage 3 479 68.4 30.9 100.0 100.0 100.0 100.0 97.7 92.1 74.5 46.8 19.0 5.6<br />
Tertiary Institutions Service Centre (<strong>TISC</strong>)<br />
Page 2 of 5
2012 COURSE STATISTICS SUMMARY - PERCENTAGE GREATER THAN SPECIFIED SCALED SCORE<br />
(Includes international and mature age students)<br />
5/07/2013<br />
WACE Course<br />
Number of<br />
Students<br />
Mean<br />
Scaled<br />
Score<br />
Min<br />
Scaled<br />
Score<br />
Max<br />
Scaled<br />
Score<br />
Percentage of Students with Scaled Scores <strong>greater</strong> <strong>than</strong><br />
10 20 30 40 50 60 70 80 90<br />
Geography 1,970 55.7 0.0 92.3 99.8 99.1 96.2 88.7 69.1 37.5 13.5 3.1 0.2<br />
Geography stage 2 65 33.9 0.0 74.6 95.4 86.2 61.5 32.3 15.4 3.1 1.5 0.0 0.0<br />
Geography stage 3 1,905 56.4 7.7 92.3 99.9 99.6 97.4 90.6 70.9 38.6 13.9 3.2 0.2<br />
German 88 72.3 44.0 99.3 100.0 100.0 100.0 100.0 95.5 77.3 54.5 28.4 15.9<br />
German stage 3 88 72.3 44.0 99.3 100.0 100.0 100.0 100.0 95.5 77.3 54.5 28.4 15.9<br />
Health Studies 285 48.6 3.1 90.2 98.6 94.7 86.0 71.6 49.1 24.9 7.4 2.1 0.4<br />
Health Studies stage 2 56 30.7 3.1 67.0 92.9 75.0 50.0 25.0 8.9 3.6 0.0 0.0 0.0<br />
Health Studies stage 3 229 53.0 12.4 90.2 100.0 99.6 94.8 83.0 59.0 30.1 9.2 2.6 0.4<br />
Hebrew<br />
4<br />
Heritage Chinese Mandarin<br />
1<br />
Heritage Japanese<br />
1<br />
Heritage Korean<br />
3<br />
Human Biological Science 4,181 57.2 0.0 94.5 99.9 99.0 96.3 89.2 72.3 43.1 16.8 4.9 0.2<br />
Human Biological Science stage 2 166 34.8 0.0 71.8 97.0 87.3 63.9 31.9 15.7 3.6 0.6 0.0 0.0<br />
Human Biological Science stage 3 4,015 58.2 10.6 94.5 100.0 99.5 97.7 91.6 74.6 44.8 17.4 5.1 0.2<br />
Indonesian: Second Language 71 61.8 26.2 98.1 100.0 100.0 98.6 91.5 83.1 54.9 25.4 11.3 1.4<br />
Indonesian: Second Language stage 2<br />
3<br />
Indonesian: Second Language stage 3 68 62.8 26.2 98.1 100.0 100.0 98.5 94.1 85.3 57.4 26.5 11.8 1.5<br />
Integrated Science 132 47.3 4.6 94.3 98.5 97.0 85.6 65.2 43.2 22.0 9.1 2.3 0.8<br />
Integrated Science stage 2<br />
41 36.3 4.6 73.4<br />
Integrated Science stage 3 91 52.2 8.5 94.3 98.9 98.9 94.5 79.1 56.0 30.8 12.1 3.3 1.1<br />
Italian 264 63.5 0.0 98.8 99.2 98.5 97.3 94.3 84.5 61.4 32.6 12.9 2.7<br />
Italian stage 2<br />
8 27.7 0.0 57.9<br />
Italian stage 3 256 64.6 25.2 98.8 100.0 100.0 99.2 96.1 86.3 63.3 33.6 13.3 2.7<br />
Japanese: Background Speakers<br />
1<br />
Japanese: Second Language 333 64.4 2.8 100.0 99.7 99.4 97.9 93.4 84.1 67.0 36.9 13.5 3.9<br />
Japanese: Second Language stage 2<br />
24 40.1 2.8 72.1<br />
Japanese: Second Language stage 3 309 66.3 25.9 100.0 100.0 100.0 99.4 97.1 88.7 71.5 39.5 14.6 4.2<br />
Literature 1,817 67.8 19.7 100.0 100.0 99.9 99.6 97.5 91.3 74.2 43.8 17.3 4.0<br />
Literature stage 3 1,817 67.8 19.7 100.0 100.0 99.9 99.6 97.5 91.3 74.2 43.8 17.3 4.0<br />
Malay (background speakers)<br />
2<br />
Marine and Maritime Studies<br />
29 49.8 12.7 92.9<br />
Marine and Maritime Studies stage 2<br />
13 32.5 12.7 49.1<br />
Marine and Maritime Studies stage 3<br />
16 63.8 44.4 92.9<br />
Tertiary Institutions Service Centre (<strong>TISC</strong>)<br />
Page 3 of 5
2012 COURSE STATISTICS SUMMARY - PERCENTAGE GREATER THAN SPECIFIED SCALED SCORE<br />
(Includes international and mature age students)<br />
5/07/2013<br />
WACE Course<br />
Number of<br />
Students<br />
Mean<br />
Scaled<br />
Score<br />
Min<br />
Scaled<br />
Score<br />
Max<br />
Scaled<br />
Score<br />
Percentage of Students with Scaled Scores <strong>greater</strong> <strong>than</strong><br />
10 20 30 40 50 60 70 80 90<br />
Materials Design and Technology 329 51.2 0.0 87.3 98.5 96.4 88.4 77.5 55.3 31.6 12.2 3.0 0.0<br />
Materials Design and Technology stage 2 105 38.5 0.0 76.4 95.2 88.6 71.4 49.5 23.8 8.6 1.0 0.0 0.0<br />
Materials Design and Technology stage 3 224 57.2 20.6 87.3 100.0 100.0 96.4 90.6 70.1 42.4 17.4 4.5 0.0<br />
Mathematics 12,885 58.3 3.6 100.0 100.0 99.6 97.9 90.6 71.6 45.0 20.3 6.5 1.3<br />
Mathematics 2AB 383 34.6 3.6 65.8 98.4 90.1 68.4 30.5 8.6 0.8 0.0 0.0 0.0<br />
Mathematics 2CD 4,102 47.3 12.4 72.5 100.0 99.6 96.7 80.0 37.9 8.2 0.4 0.0 0.0<br />
Mathematics 3AB 4,643 59.4 25.1 83.8 100.0 100.0 99.8 97.7 86.2 47.8 11.4 0.6 0.0<br />
Mathematics 3CD 3,757 71.4 28.1 100.0 100.0 100.0 99.9 99.4 96.7 86.2 55.2 21.3 4.4<br />
Mathematics: Specialist 1,529 69.2 18.3 100.0 100.0 99.9 99.2 97.2 92.2 77.2 49.2 21.0 6.1<br />
Mathematics: Specialist 3AB<br />
36 46.1 18.3 79.6<br />
Mathematics: Specialist 3CD 1,493 69.8 21.3 100.0 100.0 100.0 99.4 97.9 93.4 78.7 50.3 21.5 6.2<br />
Media Production and Analysis 1,047 53.9 0.0 97.2 98.1 96.5 92.9 83.2 64.9 36.6 13.8 3.1 0.4<br />
Media Production and Analysis stage 2 69 28.9 0.0 68.0 79.7 72.5 53.6 29.0 8.7 4.3 0.0 0.0 0.0<br />
Media Production and Analysis stage 3 978 55.7 0.1 97.2 99.4 98.2 95.7 87.0 68.8 38.9 14.8 3.3 0.4<br />
Modern Greek<br />
1<br />
Modern History 2,692 58.4 6.4 96.4 99.9 99.6 97.4 91.2 75.5 45.5 18.6 5.1 0.7<br />
Modern History stage 2<br />
12 30.3 20.2 48.4<br />
Modern History stage 3 2,680 58.5 6.4 96.4 99.9 99.6 97.7 91.6 75.8 45.7 18.7 5.1 0.7<br />
Music 475 61.2 0.0 100.0 99.8 98.9 96.4 92.4 79.8 54.3 26.9 8.6 2.5<br />
Music stage 2<br />
27 37.9 0.0 85.1<br />
Music stage 3 448 62.6 15.1 100.0 100.0 99.1 98.2 95.5 83.5 57.4 28.3 8.9 2.7<br />
Outdoor Education 364 47.4 0.0 88.1 97.8 93.4 83.5 69.8 47.8 20.6 8.0 1.9 0.0<br />
Outdoor Education stage 2 102 31.0 0.0 74.6 92.2 78.4 49.0 25.5 7.8 2.0 1.0 0.0 0.0<br />
Outdoor Education stage 3 262 53.8 16.2 88.1 100.0 99.2 96.9 87.0 63.4 27.9 10.7 2.7 0.0<br />
Persian (background speakers)<br />
2<br />
Philosophy and Ethics 146 63.2 22.2 100.0 100.0 100.0 99.3 94.5 81.5 62.3 30.1 10.3 2.7<br />
Philosophy and Ethics stage 2<br />
3<br />
Philosophy and Ethics stage 3 143 63.5 22.2 100.0 100.0 100.0 99.3 95.1 82.5 62.9 30.8 10.5 2.8<br />
Physical Education Studies 2,288 53.8 0.0 91.9 98.6 96.9 92.6 83.7 64.5 37.6 12.6 2.5 0.1<br />
Physical Education Studies stage 2 278 33.2 0.0 72.9 91.4 80.9 59.7 35.3 13.3 4.3 0.7 0.0 0.0<br />
Physical Education Studies stage 3 2,010 56.7 0.8 91.9 99.7 99.2 97.1 90.3 71.5 42.2 14.2 2.9 0.1<br />
Physics 3,541 65.6 11.2 100.0 100.0 99.9 99.2 96.3 88.3 68.1 37.3 13.8 3.3<br />
Physics stage 2<br />
33 40.9 11.2 83.2<br />
Physics stage 3 3,508 65.8 15.3 100.0 100.0 99.9 99.4 96.8 88.9 68.6 37.6 13.9 3.3<br />
Tertiary Institutions Service Centre (<strong>TISC</strong>)<br />
Page 4 of 5
2012 COURSE STATISTICS SUMMARY - PERCENTAGE GREATER THAN SPECIFIED SCALED SCORE<br />
(Includes international and mature age students)<br />
5/07/2013<br />
WACE Course<br />
Number of<br />
Students<br />
Mean<br />
Scaled<br />
Score<br />
Min<br />
Scaled<br />
Score<br />
Max<br />
Scaled<br />
Score<br />
Percentage of Students with Scaled Scores <strong>greater</strong> <strong>than</strong><br />
10 20 30 40 50 60 70 80 90<br />
Plant Production Systems<br />
29 43.0 12.3 85.1<br />
Plant Production Systems stage 2<br />
5 32.0 12.3 49.4<br />
Plant Production Systems stage 3<br />
24 45.2 13.5 85.1<br />
Politics and Law 931 62.4 9.5 97.7 99.9 99.7 98.0 93.8 82.6 58.2 28.7 9.5 1.5<br />
Politics and Law stage 2<br />
27 36.7 9.5 67.1<br />
Politics and Law stage 3 904 63.2 18.7 97.7 100.0 99.9 98.7 95.5 84.6 59.8 29.5 9.7 1.5<br />
Portuguese<br />
1<br />
Psychology 956 57.0 5.4 95.2 99.7 98.6 95.5 86.1 71.0 44.7 18.6 5.3 0.6<br />
Psychology stage 2 94 37.5 5.4 70.1 96.8 89.4 71.3 40.4 17.0 5.3 1.1 0.0 0.0<br />
Psychology stage 3 862 59.2 13.2 95.2 100.0 99.7 98.1 91.1 76.9 49.0 20.5 5.9 0.7<br />
Religion and Life 1,791 60.5 1.1 94.7 99.9 99.5 98.2 92.0 79.8 53.8 23.8 6.5 0.7<br />
Religion and Life stage 2 180 42.4 1.1 79.2 99.4 95.0 85.6 54.4 26.1 9.4 2.8 0.0 0.0<br />
Religion and Life stage 3 1,611 62.6 23.8 94.7 100.0 100.0 99.6 96.2 85.8 58.7 26.2 7.3 0.8<br />
Russian<br />
2<br />
Sinhala<br />
2<br />
Spanish<br />
4<br />
Tamil<br />
4<br />
Turkish<br />
5 28.4 20.7 37.8<br />
Vietnamese<br />
2<br />
Visual Arts 1,188 55.4 0.0 96.1 98.9 97.1 94.3 85.0 67.3 39.9 16.3 4.0 0.7<br />
Visual Arts stage 2 77 32.1 0.0 79.4 89.6 75.3 59.7 29.9 11.7 1.3 1.3 0.0 0.0<br />
Visual Arts stage 3 1,111 57.0 5.9 96.1 99.5 98.6 96.7 88.8 71.1 42.6 17.4 4.2 0.7<br />
Notes:<br />
Number of students is all 2012 students with a <strong>scaled</strong> <strong>score</strong> in the course (includes international and mature age students).<br />
Table excludes <strong>percentage</strong> data where there are fewer <strong>than</strong> 50 students. Where there are fewer <strong>than</strong> 5 students in a course then only the number of students with a <strong>scaled</strong> <strong>score</strong> is<br />
reported.<br />
Tertiary Institutions Service Centre (<strong>TISC</strong>)<br />
Page 5 of 5