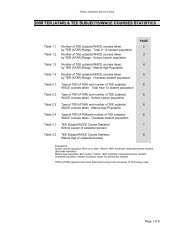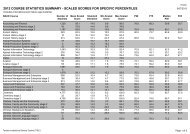
Histograms and Scaled Score Statistics for WACE Courses - TISC
Histograms and Scaled Score Statistics for WACE Courses - TISC
Histograms and Scaled Score Statistics for WACE Courses - TISC

You also want an ePaper? Increase the reach of your titles
YUMPU automatically turns print PDFs into web optimized ePapers that Google loves.
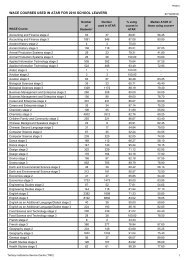
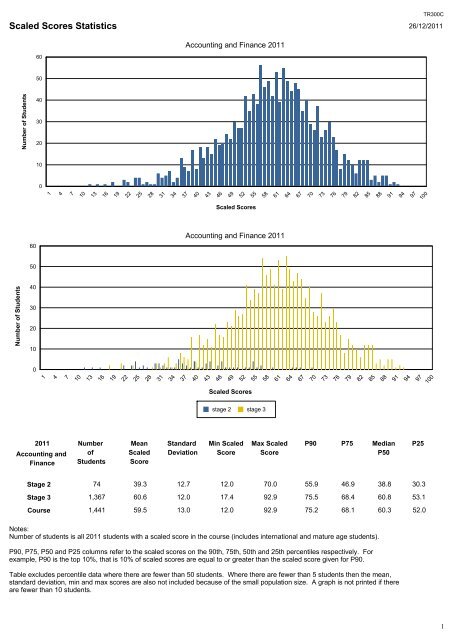
101316192225283134374043464952555861646770737679828588919497100<strong>Scaled</strong> <strong>Score</strong>s <strong>Statistics</strong> 26/12/201160Accounting <strong>and</strong> Finance 2011TR300C50Number of Students403020100147<strong>Scaled</strong> <strong>Score</strong>s60Accounting <strong>and</strong> Finance 201150Number of Students403020100147101316192225283134374043464952555861646770737679828588919497100<strong>Scaled</strong> <strong>Score</strong>sstage 2 stage 32011Accounting <strong>and</strong>FinanceNumberofStudentsMean<strong>Scaled</strong><strong>Score</strong>St<strong>and</strong>ardDeviationMin <strong>Scaled</strong><strong>Score</strong>Max <strong>Scaled</strong><strong>Score</strong>P90P75MedianP50P25Stage 2Stage 374 39.3 12.7 12.0 70.0 55.9 46.9 38.8 30.31,367 60.6 12.0 17.4 92.9 75.5 68.4 60.8 53.1Course 1,441 59.5 13.0 12.0 92.9 75.2 68.1 60.3 52.0Notes:Number of students is all 2011 students with a scaled score in the course (includes international <strong>and</strong> mature age students).P90, P75, P50 <strong>and</strong> P25 columns refer to the scaled scores on the 90th, 75th, 50th <strong>and</strong> 25th percentiles respectively. Forexample, P90 is the top 10%, that is 10% of scaled scores are equal to or greater than the scaled score given <strong>for</strong> P90.Table excludes percentile data where there are fewer than 50 students. Where there are fewer than 5 students then the mean,st<strong>and</strong>ard deviation, min <strong>and</strong> max scores are also not included because of the small population size. A graph is not printed if thereare fewer than 10 students.1
101316192225283134374043464952555861646770737679828588919497100<strong>Scaled</strong> <strong>Score</strong>s <strong>Statistics</strong> 26/12/201110Ancient History 20118Number of Students6420147<strong>Scaled</strong> <strong>Score</strong>s2011Ancient HistoryNumberofStudentsMean<strong>Scaled</strong><strong>Score</strong>St<strong>and</strong>ardDeviationMin <strong>Scaled</strong><strong>Score</strong>Max <strong>Scaled</strong><strong>Score</strong>P90P75MedianP50P25Stage 2Stage 34200 63.2 11.8 33.9 92.3 78.0 71.3 63.6 55.5Course 204 62.6 12.5 27.9 92.3 78.0 71.0 63.1 55.1Notes:Number of students is all 2011 students with a scaled score in the course (includes international <strong>and</strong> mature age students).P90, P75, P50 <strong>and</strong> P25 columns refer to the scaled scores on the 90th, 75th, 50th <strong>and</strong> 25th percentiles respectively. Forexample, P90 is the top 10%, that is 10% of scaled scores are equal to or greater than the scaled score given <strong>for</strong> P90.Table excludes percentile data where there are fewer than 50 students. Where there are fewer than 5 students then the mean,st<strong>and</strong>ard deviation, min <strong>and</strong> max scores are also not included because of the small population size. A graph is not printed if thereare fewer than 10 students.2
101316192225283134374043464952555861646770737679828588919497100<strong>Scaled</strong> <strong>Score</strong>s <strong>Statistics</strong> 26/12/20115Animal Production Systems 20114Number of Students3210147<strong>Scaled</strong> <strong>Score</strong>s3.2Animal Production Systems 20112.82.4Number of Students2.01.61.20.80.40.0147101316192225283134374043464952555861646770737679828588919497<strong>Scaled</strong> <strong>Score</strong>s100stage 2 stage 32011AnimalProductionSystemsStage 2Stage 3NumberofStudentsMean<strong>Scaled</strong><strong>Score</strong>St<strong>and</strong>ardDeviationMin <strong>Scaled</strong><strong>Score</strong>Max <strong>Scaled</strong><strong>Score</strong>22 29.5 10.8 12.7 58.037 45.9 12.4 22.8 79.6P90P75MedianP50Course 59 39.7 14.2 12.7 79.6 59.9 47.5 38.5 31.4Notes:Number of students is all 2011 students with a scaled score in the course (includes international <strong>and</strong> mature age students).P90, P75, P50 <strong>and</strong> P25 columns refer to the scaled scores on the 90th, 75th, 50th <strong>and</strong> 25th percentiles respectively. Forexample, P90 is the top 10%, that is 10% of scaled scores are equal to or greater than the scaled score given <strong>for</strong> P90.Table excludes percentile data where there are fewer than 50 students. Where there are fewer than 5 students then the mean,st<strong>and</strong>ard deviation, min <strong>and</strong> max scores are also not included because of the small population size. A graph is not printed if thereare fewer than 10 students.P253
101316192225283134374043464952555861646770737679828588919497100<strong>Scaled</strong> <strong>Score</strong>s <strong>Statistics</strong> 26/12/2011454035Applied In<strong>for</strong>mation Technology 2011Number of Students302520151050147<strong>Scaled</strong> <strong>Score</strong>s35Applied In<strong>for</strong>mation Technology 20113025Number of Students20151050147101316192225283134374043464952555861646770737679828588919497<strong>Scaled</strong> <strong>Score</strong>s100stage 2 stage 32011AppliedIn<strong>for</strong>mationTechnologyStage 2Stage 3NumberofStudentsMean<strong>Scaled</strong><strong>Score</strong>St<strong>and</strong>ardDeviationMin <strong>Scaled</strong><strong>Score</strong>Max <strong>Scaled</strong><strong>Score</strong>P90P75MedianP50486 42.0 11.6 3.0 74.9 56.6 49.7 42.1 34.4644 57.9 11.2 17.2 90.9 72.2 64.9 58.3 50.9Course 1,130 51.1 13.8 3.0 90.9 68.7 60.2 51.6 41.6Notes:Number of students is all 2011 students with a scaled score in the course (includes international <strong>and</strong> mature age students).P90, P75, P50 <strong>and</strong> P25 columns refer to the scaled scores on the 90th, 75th, 50th <strong>and</strong> 25th percentiles respectively. Forexample, P90 is the top 10%, that is 10% of scaled scores are equal to or greater than the scaled score given <strong>for</strong> P90.Table excludes percentile data where there are fewer than 50 students. Where there are fewer than 5 students then the mean,st<strong>and</strong>ard deviation, min <strong>and</strong> max scores are also not included because of the small population size. A graph is not printed if thereare fewer than 10 students.P254
101316192225283134374043464952555861646770737679828588919497100<strong>Scaled</strong> <strong>Score</strong>s <strong>Statistics</strong> 26/12/20112.0Arabic 20111.6Number of Students1.20.80.40.0147<strong>Scaled</strong> <strong>Score</strong>s2011ArabicNumberofStudentsMean<strong>Scaled</strong><strong>Score</strong>St<strong>and</strong>ardDeviationMin <strong>Scaled</strong><strong>Score</strong>Max <strong>Scaled</strong><strong>Score</strong>P90P75MedianP50P25Stage 311 60.1 4.8 49.2 65.6Course 11 60.1 4.8 49.2 65.6Notes:Number of students is all 2011 students with a scaled score in the course (includes international <strong>and</strong> mature age students).P90, P75, P50 <strong>and</strong> P25 columns refer to the scaled scores on the 90th, 75th, 50th <strong>and</strong> 25th percentiles respectively. Forexample, P90 is the top 10%, that is 10% of scaled scores are equal to or greater than the scaled score given <strong>for</strong> P90.Table excludes percentile data where there are fewer than 50 students. Where there are fewer than 5 students then the mean,st<strong>and</strong>ard deviation, min <strong>and</strong> max scores are also not included because of the small population size. A graph is not printed if thereare fewer than 10 students.5
101316192225283134374043464952555861646770737679828588919497100<strong>Scaled</strong> <strong>Score</strong>s <strong>Statistics</strong> 26/12/20113.2Aviation 20112.82.4Number of Students2.01.61.20.80.40.0147<strong>Scaled</strong> <strong>Score</strong>s2011AviationNumberofStudentsMean<strong>Scaled</strong><strong>Score</strong>St<strong>and</strong>ardDeviationMin <strong>Scaled</strong><strong>Score</strong>Max <strong>Scaled</strong><strong>Score</strong>P90P75MedianP50P25Stage 342 52.2 12.8 28.1 86.1Course 42 52.2 12.8 28.1 86.1Notes:Number of students is all 2011 students with a scaled score in the course (includes international <strong>and</strong> mature age students).P90, P75, P50 <strong>and</strong> P25 columns refer to the scaled scores on the 90th, 75th, 50th <strong>and</strong> 25th percentiles respectively. Forexample, P90 is the top 10%, that is 10% of scaled scores are equal to or greater than the scaled score given <strong>for</strong> P90.Table excludes percentile data where there are fewer than 50 students. Where there are fewer than 5 students then the mean,st<strong>and</strong>ard deviation, min <strong>and</strong> max scores are also not included because of the small population size. A graph is not printed if thereare fewer than 10 students.6
101316192225283134374043464952555861646770737679828588919497100<strong>Scaled</strong> <strong>Score</strong>s <strong>Statistics</strong> 26/12/201170Biological Sciences 201160Number of Students50403020100147<strong>Scaled</strong> <strong>Score</strong>s70Biological Sciences 20116050Number of Students403020100147101316192225283134374043464952555861646770737679828588919497<strong>Scaled</strong> <strong>Score</strong>s100stage 2 stage 32011BiologicalSciencesNumberofStudentsMean<strong>Scaled</strong><strong>Score</strong>St<strong>and</strong>ardDeviationMin <strong>Scaled</strong><strong>Score</strong>Max <strong>Scaled</strong><strong>Score</strong>P90P75MedianP50P25Stage 2Stage 321 33.9 13.7 14.8 59.31,609 59.7 12.3 16.2 94.2 75.6 67.7 59.8 52.3Course 1,630 59.4 12.7 14.8 94.2 75.5 67.6 59.7 51.8Notes:Number of students is all 2011 students with a scaled score in the course (includes international <strong>and</strong> mature age students).P90, P75, P50 <strong>and</strong> P25 columns refer to the scaled scores on the 90th, 75th, 50th <strong>and</strong> 25th percentiles respectively. Forexample, P90 is the top 10%, that is 10% of scaled scores are equal to or greater than the scaled score given <strong>for</strong> P90.Table excludes percentile data where there are fewer than 50 students. Where there are fewer than 5 students then the mean,st<strong>and</strong>ard deviation, min <strong>and</strong> max scores are also not included because of the small population size. A graph is not printed if thereare fewer than 10 students.7
101316192225283134374043464952555861646770737679828588919497100<strong>Scaled</strong> <strong>Score</strong>s <strong>Statistics</strong> 26/12/201120Business Management <strong>and</strong> Enterprise 201116Number of Students12840147<strong>Scaled</strong> <strong>Score</strong>s16Business Management <strong>and</strong> Enterprise 20111412Number of Students1086420147101316192225283134374043464952555861646770737679828588919497<strong>Scaled</strong> <strong>Score</strong>s100stage 2 stage 32011BusinessManagement<strong>and</strong> EnterpriseStage 2Stage 3NumberofStudentsMean<strong>Scaled</strong><strong>Score</strong>St<strong>and</strong>ardDeviationMin <strong>Scaled</strong><strong>Score</strong>Max <strong>Scaled</strong><strong>Score</strong>P90P75MedianP50319 41.9 10.9 9.5 73.5 56.8 48.9 41.7 34.6227 59.5 11.6 21.1 91.2 74.4 66.3 59.2 52.0Course 546 49.2 14.1 9.5 91.2 67.4 59.1 48.7 39.5Notes:Number of students is all 2011 students with a scaled score in the course (includes international <strong>and</strong> mature age students).P90, P75, P50 <strong>and</strong> P25 columns refer to the scaled scores on the 90th, 75th, 50th <strong>and</strong> 25th percentiles respectively. Forexample, P90 is the top 10%, that is 10% of scaled scores are equal to or greater than the scaled score given <strong>for</strong> P90.Table excludes percentile data where there are fewer than 50 students. Where there are fewer than 5 students then the mean,st<strong>and</strong>ard deviation, min <strong>and</strong> max scores are also not included because of the small population size. A graph is not printed if thereare fewer than 10 students.P258
101316192225283134374043464952555861646770737679828588919497100<strong>Scaled</strong> <strong>Score</strong>s <strong>Statistics</strong> 26/12/201116Career <strong>and</strong> Enterprise 20111412Number of Students1086420147<strong>Scaled</strong> <strong>Score</strong>s12Career <strong>and</strong> Enterprise 201110Number of Students86420147101316192225283134374043464952555861646770737679828588919497<strong>Scaled</strong> <strong>Score</strong>s100stage 2 stage 32011Career <strong>and</strong>EnterpriseNumberofStudentsMean<strong>Scaled</strong><strong>Score</strong>St<strong>and</strong>ardDeviationMin <strong>Scaled</strong><strong>Score</strong>Max <strong>Scaled</strong><strong>Score</strong>P90P75MedianP50P25Stage 2Stage 3228 39.0 11.3 9.9 71.8 53.9 46.5 39.2 31.4190 59.1 10.9 24.7 85.4 73.2 66.8 59.1 52.4Course 418 48.1 14.9 9.9 85.4 68.1 59.1 47.6 37.6Notes:Number of students is all 2011 students with a scaled score in the course (includes international <strong>and</strong> mature age students).P90, P75, P50 <strong>and</strong> P25 columns refer to the scaled scores on the 90th, 75th, 50th <strong>and</strong> 25th percentiles respectively. Forexample, P90 is the top 10%, that is 10% of scaled scores are equal to or greater than the scaled score given <strong>for</strong> P90.Table excludes percentile data where there are fewer than 50 students. Where there are fewer than 5 students then the mean,st<strong>and</strong>ard deviation, min <strong>and</strong> max scores are also not included because of the small population size. A graph is not printed if thereare fewer than 10 students.9
101316192225283134374043464952555861646770737679828588919497100<strong>Scaled</strong> <strong>Score</strong>s <strong>Statistics</strong> 26/12/2011180160140Chemistry 2011Number of Students120100806040200147<strong>Scaled</strong> <strong>Score</strong>s180Chemistry 2011160140Number of Students120100806040200147101316192225283134374043464952555861646770737679828588919497<strong>Scaled</strong> <strong>Score</strong>s100stage 2 stage 32011ChemistryNumberofStudentsMean<strong>Scaled</strong><strong>Score</strong>St<strong>and</strong>ardDeviationMin <strong>Scaled</strong><strong>Score</strong>Max <strong>Scaled</strong><strong>Score</strong>P90P75MedianP50P25Stage 2Stage 361 37.5 13.7 6.8 75.5 55.1 45.6 38.3 28.24,761 65.6 12.4 19.3 98.1 81.2 73.8 65.8 57.8Course 4,822 65.3 12.8 6.8 98.1 81.1 73.6 65.6 57.6Notes:Number of students is all 2011 students with a scaled score in the course (includes international <strong>and</strong> mature age students).P90, P75, P50 <strong>and</strong> P25 columns refer to the scaled scores on the 90th, 75th, 50th <strong>and</strong> 25th percentiles respectively. Forexample, P90 is the top 10%, that is 10% of scaled scores are equal to or greater than the scaled score given <strong>for</strong> P90.Table excludes percentile data where there are fewer than 50 students. Where there are fewer than 5 students then the mean,st<strong>and</strong>ard deviation, min <strong>and</strong> max scores are also not included because of the small population size. A graph is not printed if thereare fewer than 10 students.10
101316192225283134374043464952555861646770737679828588919497100<strong>Scaled</strong> <strong>Score</strong>s <strong>Statistics</strong> 26/12/201116Children Family <strong>and</strong> Community 20111412Number of Students1086420147<strong>Scaled</strong> <strong>Score</strong>s16Children Family <strong>and</strong> Community 20111412Number of Students1086420147101316192225283134374043464952555861646770737679828588919497<strong>Scaled</strong> <strong>Score</strong>s100stage 2 stage 32011Children Family<strong>and</strong> CommunityNumberofStudentsMean<strong>Scaled</strong><strong>Score</strong>St<strong>and</strong>ardDeviationMin <strong>Scaled</strong><strong>Score</strong>Max <strong>Scaled</strong><strong>Score</strong>P90P75MedianP50P25Stage 2Stage 3295 48.1 13.6 8.1 79.8 66.3 57.9 47.8 38.712 69.1 10.3 51.9 87.0Course 307 49.0 14.1 8.1 87.0 67.2 59.0 48.6 39.9Notes:Number of students is all 2011 students with a scaled score in the course (includes international <strong>and</strong> mature age students).P90, P75, P50 <strong>and</strong> P25 columns refer to the scaled scores on the 90th, 75th, 50th <strong>and</strong> 25th percentiles respectively. Forexample, P90 is the top 10%, that is 10% of scaled scores are equal to or greater than the scaled score given <strong>for</strong> P90.Table excludes percentile data where there are fewer than 50 students. Where there are fewer than 5 students then the mean,st<strong>and</strong>ard deviation, min <strong>and</strong> max scores are also not included because of the small population size. A graph is not printed if thereare fewer than 10 students.11
1013161922252831343740434649525558616467707376798285889194<strong>Scaled</strong> <strong>Score</strong>s <strong>Statistics</strong> 26/12/20114.0Chinese: Background Speakers 20113.53.0Number of Students2.52.01.51.00.50.0147<strong>Scaled</strong> <strong>Score</strong>s971002011Chinese:BackgroundSpeakersStage 3NumberofStudentsMean<strong>Scaled</strong><strong>Score</strong>St<strong>and</strong>ardDeviationMin <strong>Scaled</strong><strong>Score</strong>Max <strong>Scaled</strong><strong>Score</strong>P90P75MedianP5060 60.0 14.4 22.1 90.4 79.4 71.1 58.7 51.9Course 60 60.0 14.4 22.1 90.4 79.4 71.1 58.7 51.9Notes:Number of students is all 2011 students with a scaled score in the course (includes international <strong>and</strong> mature age students).P90, P75, P50 <strong>and</strong> P25 columns refer to the scaled scores on the 90th, 75th, 50th <strong>and</strong> 25th percentiles respectively. Forexample, P90 is the top 10%, that is 10% of scaled scores are equal to or greater than the scaled score given <strong>for</strong> P90.Table excludes percentile data where there are fewer than 50 students. Where there are fewer than 5 students then the mean,st<strong>and</strong>ard deviation, min <strong>and</strong> max scores are also not included because of the small population size. A graph is not printed if thereare fewer than 10 students.P2512
101316192225283134374043464952555861646770737679828588919497100<strong>Scaled</strong> <strong>Score</strong>s <strong>Statistics</strong> 26/12/20114.0Chinese: Second Language 20113.53.0Number of Students2.52.01.51.00.50.0147<strong>Scaled</strong> <strong>Score</strong>s2011Chinese: SecondLanguageNumberofStudentsMean<strong>Scaled</strong><strong>Score</strong>St<strong>and</strong>ardDeviationMin <strong>Scaled</strong><strong>Score</strong>Max <strong>Scaled</strong><strong>Score</strong>P90P75MedianP50P25Stage 2Stage 3146 70.5 14.6 31.7 100.0Course 47 70.2 14.6 31.7 100.0Notes:Number of students is all 2011 students with a scaled score in the course (includes international <strong>and</strong> mature age students).P90, P75, P50 <strong>and</strong> P25 columns refer to the scaled scores on the 90th, 75th, 50th <strong>and</strong> 25th percentiles respectively. Forexample, P90 is the top 10%, that is 10% of scaled scores are equal to or greater than the scaled score given <strong>for</strong> P90.Table excludes percentile data where there are fewer than 50 students. Where there are fewer than 5 students then the mean,st<strong>and</strong>ard deviation, min <strong>and</strong> max scores are also not included because of the small population size. A graph is not printed if thereare fewer than 10 students.13
101316192225283134374043464952555861646770737679828588919497100<strong>Scaled</strong> <strong>Score</strong>s <strong>Statistics</strong> 26/12/201124Computer Science 201120Number of Students1612840147<strong>Scaled</strong> <strong>Score</strong>s20Computer Science 201116Number of Students12840147101316192225283134374043464952555861646770737679828588919497<strong>Scaled</strong> <strong>Score</strong>s100stage 2 stage 32011ComputerScienceNumberofStudentsMean<strong>Scaled</strong><strong>Score</strong>St<strong>and</strong>ardDeviationMin <strong>Scaled</strong><strong>Score</strong>Max <strong>Scaled</strong><strong>Score</strong>P90P75MedianP50P25Stage 2Stage 3108 39.6 11.9 11.6 71.2 55.0 47.6 38.6 32.5343 57.9 10.8 25.8 86.0 71.9 64.8 58.1 50.9Course 451 53.5 13.6 11.6 86.0 70.3 63.3 54.8 44.3Notes:Number of students is all 2011 students with a scaled score in the course (includes international <strong>and</strong> mature age students).P90, P75, P50 <strong>and</strong> P25 columns refer to the scaled scores on the 90th, 75th, 50th <strong>and</strong> 25th percentiles respectively. Forexample, P90 is the top 10%, that is 10% of scaled scores are equal to or greater than the scaled score given <strong>for</strong> P90.Table excludes percentile data where there are fewer than 50 students. Where there are fewer than 5 students then the mean,st<strong>and</strong>ard deviation, min <strong>and</strong> max scores are also not included because of the small population size. A graph is not printed if thereare fewer than 10 students.14
101316192225283134374043464952555861646770737679828588919497100<strong>Scaled</strong> <strong>Score</strong>s <strong>Statistics</strong> 26/12/201114Dance 201112Number of Students1086420147<strong>Scaled</strong> <strong>Score</strong>s12Dance 201110Number of Students86420147101316192225283134374043464952555861646770737679828588919497<strong>Scaled</strong> <strong>Score</strong>s100stage 2 stage 32011DanceNumberofStudentsMean<strong>Scaled</strong><strong>Score</strong>St<strong>and</strong>ardDeviationMin <strong>Scaled</strong><strong>Score</strong>Max <strong>Scaled</strong><strong>Score</strong>P90P75MedianP50P25Stage 2Stage 3151 38.6 13.4 2.5 73.0 53.7 47.3 40.0 31.7216 59.7 11.0 25.8 89.7 73.6 67.5 59.6 52.1Course 367 51.0 15.9 2.5 89.7 70.4 62.1 52.0 41.2Notes:Number of students is all 2011 students with a scaled score in the course (includes international <strong>and</strong> mature age students).P90, P75, P50 <strong>and</strong> P25 columns refer to the scaled scores on the 90th, 75th, 50th <strong>and</strong> 25th percentiles respectively. Forexample, P90 is the top 10%, that is 10% of scaled scores are equal to or greater than the scaled score given <strong>for</strong> P90.Table excludes percentile data where there are fewer than 50 students. Where there are fewer than 5 students then the mean,st<strong>and</strong>ard deviation, min <strong>and</strong> max scores are also not included because of the small population size. A graph is not printed if thereare fewer than 10 students.15
101316192225283134374043464952555861646770737679828588919497100<strong>Scaled</strong> <strong>Score</strong>s <strong>Statistics</strong> 26/12/201128Design 201124Number of Students201612840147<strong>Scaled</strong> <strong>Score</strong>s24Design 201120Number of Students1612840147101316192225283134374043464952555861646770737679828588919497<strong>Scaled</strong> <strong>Score</strong>s100stage 2 stage 32011DesignNumberofStudentsMean<strong>Scaled</strong><strong>Score</strong>St<strong>and</strong>ardDeviationMin <strong>Scaled</strong><strong>Score</strong>Max <strong>Scaled</strong><strong>Score</strong>P90P75MedianP50P25Stage 2Stage 3296 43.6 11.1 4.0 74.2 58.7 50.5 43.9 37.2408 60.1 11.3 14.7 92.2 73.6 67.4 60.6 53.4Course 704 53.2 13.9 4.0 92.2 70.2 63.2 53.8 44.1Notes:Number of students is all 2011 students with a scaled score in the course (includes international <strong>and</strong> mature age students).P90, P75, P50 <strong>and</strong> P25 columns refer to the scaled scores on the 90th, 75th, 50th <strong>and</strong> 25th percentiles respectively. Forexample, P90 is the top 10%, that is 10% of scaled scores are equal to or greater than the scaled score given <strong>for</strong> P90.Table excludes percentile data where there are fewer than 50 students. Where there are fewer than 5 students then the mean,st<strong>and</strong>ard deviation, min <strong>and</strong> max scores are also not included because of the small population size. A graph is not printed if thereare fewer than 10 students.16
101316192225283134374043464952555861646770737679828588919497100<strong>Scaled</strong> <strong>Score</strong>s <strong>Statistics</strong> 26/12/201140Drama 20113530Number of Students2520151050147<strong>Scaled</strong> <strong>Score</strong>s40Drama 20113530Number of Students2520151050147101316192225283134374043464952555861646770737679828588919497<strong>Scaled</strong> <strong>Score</strong>s100stage 2 stage 32011DramaNumberofStudentsMean<strong>Scaled</strong><strong>Score</strong>St<strong>and</strong>ardDeviationMin <strong>Scaled</strong><strong>Score</strong>Max <strong>Scaled</strong><strong>Score</strong>P90P75MedianP50P25Stage 2Stage 345 33.9 14.9 0.0 64.4941 58.2 13.3 12.3 91.8 75.1 67.2 58.7 50.2Course 986 57.1 14.3 0.0 91.8 74.6 66.8 57.9 48.7Notes:Number of students is all 2011 students with a scaled score in the course (includes international <strong>and</strong> mature age students).P90, P75, P50 <strong>and</strong> P25 columns refer to the scaled scores on the 90th, 75th, 50th <strong>and</strong> 25th percentiles respectively. Forexample, P90 is the top 10%, that is 10% of scaled scores are equal to or greater than the scaled score given <strong>for</strong> P90.Table excludes percentile data where there are fewer than 50 students. Where there are fewer than 5 students then the mean,st<strong>and</strong>ard deviation, min <strong>and</strong> max scores are also not included because of the small population size. A graph is not printed if thereare fewer than 10 students.17
101316192225283134374043464952555861646770737679828588919497100<strong>Scaled</strong> <strong>Score</strong>s <strong>Statistics</strong> 26/12/201110Earth <strong>and</strong> Environmental Science 20118Number of Students6420147<strong>Scaled</strong> <strong>Score</strong>s10Earth <strong>and</strong> Environmental Science 20118Number of Students6420147101316192225283134374043464952555861646770737679828588919497<strong>Scaled</strong> <strong>Score</strong>s100stage 2 stage 32011Earth <strong>and</strong>EnvironmentalScienceStage 2Stage 3NumberofStudentsMean<strong>Scaled</strong><strong>Score</strong>St<strong>and</strong>ardDeviationMin <strong>Scaled</strong><strong>Score</strong>Max <strong>Scaled</strong><strong>Score</strong>38 40.1 10.7 17.2 69.8P90P75MedianP50150 58.0 10.2 32.6 87.1 71.2 64.9 58.5 50.8Course 188 54.3 12.6 17.2 87.1 70.2 63.4 55.6 46.5Notes:Number of students is all 2011 students with a scaled score in the course (includes international <strong>and</strong> mature age students).P90, P75, P50 <strong>and</strong> P25 columns refer to the scaled scores on the 90th, 75th, 50th <strong>and</strong> 25th percentiles respectively. Forexample, P90 is the top 10%, that is 10% of scaled scores are equal to or greater than the scaled score given <strong>for</strong> P90.Table excludes percentile data where there are fewer than 50 students. Where there are fewer than 5 students then the mean,st<strong>and</strong>ard deviation, min <strong>and</strong> max scores are also not included because of the small population size. A graph is not printed if thereare fewer than 10 students.P2518
101316192225283134374043464952555861646770737679828588919497100<strong>Scaled</strong> <strong>Score</strong>s <strong>Statistics</strong> 26/12/2011100Economics 201180Number of Students6040200147<strong>Scaled</strong> <strong>Score</strong>s100Economics 201180Number of Students6040200147101316192225283134374043464952555861646770737679828588919497<strong>Scaled</strong> <strong>Score</strong>s100stage 2 stage 32011EconomicsNumberofStudentsMean<strong>Scaled</strong><strong>Score</strong>St<strong>and</strong>ardDeviationMin <strong>Scaled</strong><strong>Score</strong>Max <strong>Scaled</strong><strong>Score</strong>P90P75MedianP50P25Stage 2Stage 350 39.3 12.5 11.8 69.3 54.9 47.9 37.8 31.32,050 62.8 12.2 18.6 96.8 78.7 70.9 62.9 55.0Course 2,100 62.3 12.8 11.8 96.8 78.5 70.7 62.5 54.5Notes:Number of students is all 2011 students with a scaled score in the course (includes international <strong>and</strong> mature age students).P90, P75, P50 <strong>and</strong> P25 columns refer to the scaled scores on the 90th, 75th, 50th <strong>and</strong> 25th percentiles respectively. Forexample, P90 is the top 10%, that is 10% of scaled scores are equal to or greater than the scaled score given <strong>for</strong> P90.Table excludes percentile data where there are fewer than 50 students. Where there are fewer than 5 students then the mean,st<strong>and</strong>ard deviation, min <strong>and</strong> max scores are also not included because of the small population size. A graph is not printed if thereare fewer than 10 students.19
101316192225283134374043464952555861646770737679828588919497100<strong>Scaled</strong> <strong>Score</strong>s <strong>Statistics</strong> 26/12/201110Engineering Studies 20118Number of Students6420147<strong>Scaled</strong> <strong>Score</strong>s10Engineering Studies 20118Number of Students6420147101316192225283134374043464952555861646770737679828588919497<strong>Scaled</strong> <strong>Score</strong>s100stage 2 stage 32011EngineeringStudiesNumberofStudentsMean<strong>Scaled</strong><strong>Score</strong>St<strong>and</strong>ardDeviationMin <strong>Scaled</strong><strong>Score</strong>Max <strong>Scaled</strong><strong>Score</strong>P90P75MedianP50P25Stage 2Stage 386 45.2 10.0 21.9 69.5 58.3 51.7 45.0 37.4137 63.4 9.5 36.5 87.0 75.9 69.6 63.1 57.1Course 223 56.4 13.1 21.9 87.0 72.1 66.2 57.2 47.0Notes:Number of students is all 2011 students with a scaled score in the course (includes international <strong>and</strong> mature age students).P90, P75, P50 <strong>and</strong> P25 columns refer to the scaled scores on the 90th, 75th, 50th <strong>and</strong> 25th percentiles respectively. Forexample, P90 is the top 10%, that is 10% of scaled scores are equal to or greater than the scaled score given <strong>for</strong> P90.Table excludes percentile data where there are fewer than 50 students. Where there are fewer than 5 students then the mean,st<strong>and</strong>ard deviation, min <strong>and</strong> max scores are also not included because of the small population size. A graph is not printed if thereare fewer than 10 students.20
101316192225283134374043464952555861646770737679828588919497100<strong>Scaled</strong> <strong>Score</strong>s <strong>Statistics</strong> 26/12/2011450400350English 2011Number of Students300250200150100500147<strong>Scaled</strong> <strong>Score</strong>s400English 2011350300Number of Students250200150100500147101316192225283134374043464952555861646770737679828588919497<strong>Scaled</strong> <strong>Score</strong>s100stage 2 stage 32011EnglishNumberofStudentsMean<strong>Scaled</strong><strong>Score</strong>St<strong>and</strong>ardDeviationMin <strong>Scaled</strong><strong>Score</strong>Max <strong>Scaled</strong><strong>Score</strong>P90P75MedianP50P25Stage 2Stage 32,725 38.9 11.3 0.8 72.0 53.1 46.5 39.1 31.88,976 61.3 10.4 20.2 91.4 74.4 68.1 61.4 54.7Course 11,701 56.1 14.2 0.8 91.4 72.8 66.0 58.0 47.3Notes:Number of students is all 2011 students with a scaled score in the course (includes international <strong>and</strong> mature age students).P90, P75, P50 <strong>and</strong> P25 columns refer to the scaled scores on the 90th, 75th, 50th <strong>and</strong> 25th percentiles respectively. Forexample, P90 is the top 10%, that is 10% of scaled scores are equal to or greater than the scaled score given <strong>for</strong> P90.Table excludes percentile data where there are fewer than 50 students. Where there are fewer than 5 students then the mean,st<strong>and</strong>ard deviation, min <strong>and</strong> max scores are also not included because of the small population size. A graph is not printed if thereare fewer than 10 students.21
101316192225283134374043464952555861646770737679828588919497100<strong>Scaled</strong> <strong>Score</strong>s <strong>Statistics</strong> 26/12/201150English as an Additional Language or Dialect 201140Number of Students3020100147<strong>Scaled</strong> <strong>Score</strong>s40English as an Additional Language or Dialect 20113530Number of Students2520151050147101316192225283134374043464952555861646770737679828588919497<strong>Scaled</strong> <strong>Score</strong>s100stage 2 stage 32011English as anAdditionalLanguage orStage 2Stage 3NumberofStudentsMean<strong>Scaled</strong><strong>Score</strong>St<strong>and</strong>ardDeviationMin <strong>Scaled</strong><strong>Score</strong>Max <strong>Scaled</strong><strong>Score</strong>P90P75MedianP50249 46.3 14.4 0.0 82.3 64.9 56.6 47.4 36.81,048 62.6 12.7 10.8 97.0 78.8 70.9 62.9 54.8Course 1,297 59.5 14.5 0.0 97.0 77.1 69.0 60.4 50.9Notes:Number of students is all 2011 students with a scaled score in the course (includes international <strong>and</strong> mature age students).P90, P75, P50 <strong>and</strong> P25 columns refer to the scaled scores on the 90th, 75th, 50th <strong>and</strong> 25th percentiles respectively. Forexample, P90 is the top 10%, that is 10% of scaled scores are equal to or greater than the scaled score given <strong>for</strong> P90.Table excludes percentile data where there are fewer than 50 students. Where there are fewer than 5 students then the mean,st<strong>and</strong>ard deviation, min <strong>and</strong> max scores are also not included because of the small population size. A graph is not printed if thereare fewer than 10 students.P2522
101316192225283134374043464952555861646770737679828588919497100<strong>Scaled</strong> <strong>Score</strong>s <strong>Statistics</strong> 26/12/201120Food Science <strong>and</strong> Technology 201116Number of Students12840147<strong>Scaled</strong> <strong>Score</strong>s18Food Science <strong>and</strong> Technology 20111614Number of Students121086420147101316192225283134374043464952555861646770737679828588919497<strong>Scaled</strong> <strong>Score</strong>s100stage 2 stage 32011Food Science<strong>and</strong> TechnologyNumberofStudentsMean<strong>Scaled</strong><strong>Score</strong>St<strong>and</strong>ardDeviationMin <strong>Scaled</strong><strong>Score</strong>Max <strong>Scaled</strong><strong>Score</strong>P90P75MedianP50P25Stage 2Stage 3307 49.5 10.7 17.7 79.8 63.2 56.5 49.8 42.467 66.8 11.1 43.7 97.6 80.0 73.9 66.3 59.4Course 374 52.6 12.7 17.7 97.6 68.7 60.8 52.3 43.7Notes:Number of students is all 2011 students with a scaled score in the course (includes international <strong>and</strong> mature age students).P90, P75, P50 <strong>and</strong> P25 columns refer to the scaled scores on the 90th, 75th, 50th <strong>and</strong> 25th percentiles respectively. Forexample, P90 is the top 10%, that is 10% of scaled scores are equal to or greater than the scaled score given <strong>for</strong> P90.Table excludes percentile data where there are fewer than 50 students. Where there are fewer than 5 students then the mean,st<strong>and</strong>ard deviation, min <strong>and</strong> max scores are also not included because of the small population size. A graph is not printed if thereare fewer than 10 students.23
101316192225283134374043464952555861646770737679828588919497100<strong>Scaled</strong> <strong>Score</strong>s <strong>Statistics</strong> 26/12/201124French 201120Number of Students1612840147<strong>Scaled</strong> <strong>Score</strong>s2011FrenchNumberofStudentsMean<strong>Scaled</strong><strong>Score</strong>St<strong>and</strong>ardDeviationMin <strong>Scaled</strong><strong>Score</strong>Max <strong>Scaled</strong><strong>Score</strong>P90P75MedianP50P25Stage 2Stage 37 42.4 15.2 18.3 67.3401 69.7 12.9 34.4 100.0 86.7 77.9 69.1 61.5Course 408 69.2 13.4 18.3 100.0 86.7 77.6 68.8 60.7Notes:Number of students is all 2011 students with a scaled score in the course (includes international <strong>and</strong> mature age students).P90, P75, P50 <strong>and</strong> P25 columns refer to the scaled scores on the 90th, 75th, 50th <strong>and</strong> 25th percentiles respectively. Forexample, P90 is the top 10%, that is 10% of scaled scores are equal to or greater than the scaled score given <strong>for</strong> P90.Table excludes percentile data where there are fewer than 50 students. Where there are fewer than 5 students then the mean,st<strong>and</strong>ard deviation, min <strong>and</strong> max scores are also not included because of the small population size. A graph is not printed if thereare fewer than 10 students.24
101316192225283134374043464952555861646770737679828588919497100<strong>Scaled</strong> <strong>Score</strong>s <strong>Statistics</strong> 26/12/201180Geography 20117060Number of Students50403020100147<strong>Scaled</strong> <strong>Score</strong>s80Geography 20117060Number of Students50403020100147101316192225283134374043464952555861646770737679828588919497<strong>Scaled</strong> <strong>Score</strong>s100stage 2 stage 32011GeographyNumberofStudentsMean<strong>Scaled</strong><strong>Score</strong>St<strong>and</strong>ardDeviationMin <strong>Scaled</strong><strong>Score</strong>Max <strong>Scaled</strong><strong>Score</strong>P90P75MedianP50P25Stage 2Stage 371 36.1 13.1 6.7 68.7 53.5 45.5 35.9 27.31,952 56.9 12.2 12.8 89.7 72.7 65.2 57.2 49.0Course 2,023 56.2 12.8 6.7 89.7 72.4 64.7 56.8 48.2Notes:Number of students is all 2011 students with a scaled score in the course (includes international <strong>and</strong> mature age students).P90, P75, P50 <strong>and</strong> P25 columns refer to the scaled scores on the 90th, 75th, 50th <strong>and</strong> 25th percentiles respectively. Forexample, P90 is the top 10%, that is 10% of scaled scores are equal to or greater than the scaled score given <strong>for</strong> P90.Table excludes percentile data where there are fewer than 50 students. Where there are fewer than 5 students then the mean,st<strong>and</strong>ard deviation, min <strong>and</strong> max scores are also not included because of the small population size. A graph is not printed if thereare fewer than 10 students.25
101316192225283134374043464952555861646770737679828588919497100<strong>Scaled</strong> <strong>Score</strong>s <strong>Statistics</strong> 26/12/20117German 20116Number of Students543210147<strong>Scaled</strong> <strong>Score</strong>s2011GermanNumberofStudentsMean<strong>Scaled</strong><strong>Score</strong>St<strong>and</strong>ardDeviationMin <strong>Scaled</strong><strong>Score</strong>Max <strong>Scaled</strong><strong>Score</strong>P90P75MedianP50P25Stage 2Stage 3488 69.1 10.7 45.9 97.3 82.4 76.7 68.5 61.4Course 92 68.4 11.1 45.9 97.3 81.7 75.6 68.3 60.9Notes:Number of students is all 2011 students with a scaled score in the course (includes international <strong>and</strong> mature age students).P90, P75, P50 <strong>and</strong> P25 columns refer to the scaled scores on the 90th, 75th, 50th <strong>and</strong> 25th percentiles respectively. Forexample, P90 is the top 10%, that is 10% of scaled scores are equal to or greater than the scaled score given <strong>for</strong> P90.Table excludes percentile data where there are fewer than 50 students. Where there are fewer than 5 students then the mean,st<strong>and</strong>ard deviation, min <strong>and</strong> max scores are also not included because of the small population size. A graph is not printed if thereare fewer than 10 students.26
101316192225283134374043464952555861646770737679828588919497100<strong>Scaled</strong> <strong>Score</strong>s <strong>Statistics</strong> 26/12/201112Health Studies 201110Number of Students86420147<strong>Scaled</strong> <strong>Score</strong>s8Health Studies 201176Number of Students543210147101316192225283134374043464952555861646770737679828588919497<strong>Scaled</strong> <strong>Score</strong>s100stage 2 stage 32011Health StudiesNumberofStudentsMean<strong>Scaled</strong><strong>Score</strong>St<strong>and</strong>ardDeviationMin <strong>Scaled</strong><strong>Score</strong>Max <strong>Scaled</strong><strong>Score</strong>P90P75MedianP50P25Stage 2Stage 3120 40.5 11.6 9.8 72.7 55.1 48.6 40.8 32.6108 58.6 9.5 35.5 86.0 70.9 64.4 58.6 52.3Course 228 49.1 14.0 9.8 86.0 66.9 59.2 50.6 39.8Notes:Number of students is all 2011 students with a scaled score in the course (includes international <strong>and</strong> mature age students).P90, P75, P50 <strong>and</strong> P25 columns refer to the scaled scores on the 90th, 75th, 50th <strong>and</strong> 25th percentiles respectively. Forexample, P90 is the top 10%, that is 10% of scaled scores are equal to or greater than the scaled score given <strong>for</strong> P90.Table excludes percentile data where there are fewer than 50 students. Where there are fewer than 5 students then the mean,st<strong>and</strong>ard deviation, min <strong>and</strong> max scores are also not included because of the small population size. A graph is not printed if thereare fewer than 10 students.27
<strong>Scaled</strong> <strong>Score</strong>s <strong>Statistics</strong> 26/12/2011Hebrew 20112011HebrewNumberofStudentsMean<strong>Scaled</strong><strong>Score</strong>St<strong>and</strong>ardDeviationMin <strong>Scaled</strong><strong>Score</strong>Max <strong>Scaled</strong><strong>Score</strong>P90P75MedianP50P25Stage 32Course 2Notes:Number of students is all 2011 students with a scaled score in the course (includes international <strong>and</strong> mature age students).P90, P75, P50 <strong>and</strong> P25 columns refer to the scaled scores on the 90th, 75th, 50th <strong>and</strong> 25th percentiles respectively. Forexample, P90 is the top 10%, that is 10% of scaled scores are equal to or greater than the scaled score given <strong>for</strong> P90.Table excludes percentile data where there are fewer than 50 students. Where there are fewer than 5 students then the mean,st<strong>and</strong>ard deviation, min <strong>and</strong> max scores are also not included because of the small population size. A graph is not printed if thereare fewer than 10 students.28
101316192225283134374043464952555861646770737679828588919497100<strong>Scaled</strong> <strong>Score</strong>s <strong>Statistics</strong> 26/12/2011180160140Human Biological Science 2011Number of Students120100806040200147<strong>Scaled</strong> <strong>Score</strong>s180Human Biological Science 2011160140Number of Students120100806040200147101316192225283134374043464952555861646770737679828588919497<strong>Scaled</strong> <strong>Score</strong>s100stage 2 stage 32011HumanBiologicalScienceStage 2Stage 3NumberofStudentsMean<strong>Scaled</strong><strong>Score</strong>St<strong>and</strong>ardDeviationMin <strong>Scaled</strong><strong>Score</strong>Max <strong>Scaled</strong><strong>Score</strong>P90P75MedianP50299 33.4 13.1 0.0 70.6 50.4 42.3 33.8 25.54,262 59.3 11.5 13.9 91.6 73.9 66.9 59.6 51.9Course 4,561 57.6 13.2 0.0 91.6 73.5 66.4 58.6 50.0Notes:Number of students is all 2011 students with a scaled score in the course (includes international <strong>and</strong> mature age students).P90, P75, P50 <strong>and</strong> P25 columns refer to the scaled scores on the 90th, 75th, 50th <strong>and</strong> 25th percentiles respectively. Forexample, P90 is the top 10%, that is 10% of scaled scores are equal to or greater than the scaled score given <strong>for</strong> P90.Table excludes percentile data where there are fewer than 50 students. Where there are fewer than 5 students then the mean,st<strong>and</strong>ard deviation, min <strong>and</strong> max scores are also not included because of the small population size. A graph is not printed if thereare fewer than 10 students.P2529
<strong>Scaled</strong> <strong>Score</strong>s <strong>Statistics</strong> 26/12/2011Indonesian Background Speakers 20112011IndonesianBackgroundSpeakersNumberofStudentsMean<strong>Scaled</strong><strong>Score</strong>St<strong>and</strong>ardDeviationMin <strong>Scaled</strong><strong>Score</strong>Max <strong>Scaled</strong><strong>Score</strong>P90P75MedianP50P25Stage 39 49.9 11.7 33.3 65.0Course 9 49.9 11.7 33.3 65.0Notes:Number of students is all 2011 students with a scaled score in the course (includes international <strong>and</strong> mature age students).P90, P75, P50 <strong>and</strong> P25 columns refer to the scaled scores on the 90th, 75th, 50th <strong>and</strong> 25th percentiles respectively. Forexample, P90 is the top 10%, that is 10% of scaled scores are equal to or greater than the scaled score given <strong>for</strong> P90.Table excludes percentile data where there are fewer than 50 students. Where there are fewer than 5 students then the mean,st<strong>and</strong>ard deviation, min <strong>and</strong> max scores are also not included because of the small population size. A graph is not printed if thereare fewer than 10 students.30
1013161922252831343740434649525558616467707376798285889194<strong>Scaled</strong> <strong>Score</strong>s <strong>Statistics</strong> 26/12/20115Indonesian: Second Language 20114Number of Students3210147<strong>Scaled</strong> <strong>Score</strong>s971002011Indonesian:SecondLanguageStage 2Stage 3NumberofStudents3Mean<strong>Scaled</strong><strong>Score</strong>St<strong>and</strong>ardDeviationMin <strong>Scaled</strong><strong>Score</strong>Max <strong>Scaled</strong><strong>Score</strong>P90P75MedianP5065 59.5 13.5 25.7 88.4 77.8 68.1 60.4 49.0Course 68 59.1 13.4 25.7 88.4 77.8 66.9 59.4 48.7Notes:Number of students is all 2011 students with a scaled score in the course (includes international <strong>and</strong> mature age students).P90, P75, P50 <strong>and</strong> P25 columns refer to the scaled scores on the 90th, 75th, 50th <strong>and</strong> 25th percentiles respectively. Forexample, P90 is the top 10%, that is 10% of scaled scores are equal to or greater than the scaled score given <strong>for</strong> P90.Table excludes percentile data where there are fewer than 50 students. Where there are fewer than 5 students then the mean,st<strong>and</strong>ard deviation, min <strong>and</strong> max scores are also not included because of the small population size. A graph is not printed if thereare fewer than 10 students.P2531
101316192225283134374043464952555861646770737679828588919497100<strong>Scaled</strong> <strong>Score</strong>s <strong>Statistics</strong> 26/12/201110Integrated Science 20118Number of Students6420147<strong>Scaled</strong> <strong>Score</strong>s8Integrated Science 201176Number of Students543210147101316192225283134374043464952555861646770737679828588919497<strong>Scaled</strong> <strong>Score</strong>s100stage 2 stage 32011IntegratedScienceNumberofStudentsMean<strong>Scaled</strong><strong>Score</strong>St<strong>and</strong>ardDeviationMin <strong>Scaled</strong><strong>Score</strong>Max <strong>Scaled</strong><strong>Score</strong>P90P75MedianP50P25Stage 2Stage 382 40.1 11.4 13.9 72.7 56.2 47.5 39.1 33.1108 56.3 10.7 32.0 84.8 70.0 64.1 55.7 50.4Course 190 49.3 13.7 13.9 84.8 66.9 58.5 50.6 38.7Notes:Number of students is all 2011 students with a scaled score in the course (includes international <strong>and</strong> mature age students).P90, P75, P50 <strong>and</strong> P25 columns refer to the scaled scores on the 90th, 75th, 50th <strong>and</strong> 25th percentiles respectively. Forexample, P90 is the top 10%, that is 10% of scaled scores are equal to or greater than the scaled score given <strong>for</strong> P90.Table excludes percentile data where there are fewer than 50 students. Where there are fewer than 5 students then the mean,st<strong>and</strong>ard deviation, min <strong>and</strong> max scores are also not included because of the small population size. A graph is not printed if thereare fewer than 10 students.32
101316192225283134374043464952555861646770737679828588919497100<strong>Scaled</strong> <strong>Score</strong>s <strong>Statistics</strong> 26/12/201112Italian 201110Number of Students86420147<strong>Scaled</strong> <strong>Score</strong>s12Italian 201110Number of Students86420147101316192225283134374043464952555861646770737679828588919497<strong>Scaled</strong> <strong>Score</strong>s100stage 2 stage 32011ItalianNumberofStudentsMean<strong>Scaled</strong><strong>Score</strong>St<strong>and</strong>ardDeviationMin <strong>Scaled</strong><strong>Score</strong>Max <strong>Scaled</strong><strong>Score</strong>P90P75MedianP50P25Stage 2Stage 323 36.2 13.1 10.5 63.7255 64.1 13.5 21.4 95.5 82.0 72.8 64.4 55.1Course 278 61.8 15.5 10.5 95.5 80.8 72.0 62.6 52.7Notes:Number of students is all 2011 students with a scaled score in the course (includes international <strong>and</strong> mature age students).P90, P75, P50 <strong>and</strong> P25 columns refer to the scaled scores on the 90th, 75th, 50th <strong>and</strong> 25th percentiles respectively. Forexample, P90 is the top 10%, that is 10% of scaled scores are equal to or greater than the scaled score given <strong>for</strong> P90.Table excludes percentile data where there are fewer than 50 students. Where there are fewer than 5 students then the mean,st<strong>and</strong>ard deviation, min <strong>and</strong> max scores are also not included because of the small population size. A graph is not printed if thereare fewer than 10 students.33
<strong>Scaled</strong> <strong>Score</strong>s <strong>Statistics</strong> 26/12/2011Japanese: Background Speakers 20112011Japanese:BackgroundSpeakersNumberofStudentsMean<strong>Scaled</strong><strong>Score</strong>St<strong>and</strong>ardDeviationMin <strong>Scaled</strong><strong>Score</strong>Max <strong>Scaled</strong><strong>Score</strong>P90P75MedianP50P25Stage 33Course 3Notes:Number of students is all 2011 students with a scaled score in the course (includes international <strong>and</strong> mature age students).P90, P75, P50 <strong>and</strong> P25 columns refer to the scaled scores on the 90th, 75th, 50th <strong>and</strong> 25th percentiles respectively. Forexample, P90 is the top 10%, that is 10% of scaled scores are equal to or greater than the scaled score given <strong>for</strong> P90.Table excludes percentile data where there are fewer than 50 students. Where there are fewer than 5 students then the mean,st<strong>and</strong>ard deviation, min <strong>and</strong> max scores are also not included because of the small population size. A graph is not printed if thereare fewer than 10 students.34
101316192225283134374043464952555861646770737679828588919497100<strong>Scaled</strong> <strong>Score</strong>s <strong>Statistics</strong> 26/12/201114Japanese: Second Language 201112Number of Students1086420147<strong>Scaled</strong> <strong>Score</strong>s14Japanese: Second Language 20111210Number of Students86420147101316192225283134374043464952555861646770737679828588919497<strong>Scaled</strong> <strong>Score</strong>s100stage 2 stage 32011Japanese:SecondLanguageStage 2Stage 3NumberofStudentsMean<strong>Scaled</strong><strong>Score</strong>St<strong>and</strong>ardDeviationMin <strong>Scaled</strong><strong>Score</strong>Max <strong>Scaled</strong><strong>Score</strong>21 42.8 16.3 0.0 77.4P90P75MedianP50229 65.7 11.0 33.8 93.4 79.3 73.0 65.8 58.5Course 250 63.8 13.2 0.0 93.4 78.7 72.7 64.8 57.3Notes:Number of students is all 2011 students with a scaled score in the course (includes international <strong>and</strong> mature age students).P90, P75, P50 <strong>and</strong> P25 columns refer to the scaled scores on the 90th, 75th, 50th <strong>and</strong> 25th percentiles respectively. Forexample, P90 is the top 10%, that is 10% of scaled scores are equal to or greater than the scaled score given <strong>for</strong> P90.Table excludes percentile data where there are fewer than 50 students. Where there are fewer than 5 students then the mean,st<strong>and</strong>ard deviation, min <strong>and</strong> max scores are also not included because of the small population size. A graph is not printed if thereare fewer than 10 students.P2535
101316192225283134374043464952555861646770737679828588919497100<strong>Scaled</strong> <strong>Score</strong>s <strong>Statistics</strong> 26/12/201170Literature 201160Number of Students50403020100147<strong>Scaled</strong> <strong>Score</strong>s70Literature 20116050Number of Students403020100147101316192225283134374043464952555861646770737679828588919497<strong>Scaled</strong> <strong>Score</strong>s100stage 2 stage 32011LiteratureNumberofStudentsMean<strong>Scaled</strong><strong>Score</strong>St<strong>and</strong>ardDeviationMin <strong>Scaled</strong><strong>Score</strong>Max <strong>Scaled</strong><strong>Score</strong>P90P75MedianP50P25Stage 2Stage 315 41.8 9.8 23.4 57.91,754 68.4 12.6 21.1 100.0 84.3 76.8 68.7 60.4Course 1,769 68.2 12.8 21.1 100.0 84.3 76.7 68.5 60.1Notes:Number of students is all 2011 students with a scaled score in the course (includes international <strong>and</strong> mature age students).P90, P75, P50 <strong>and</strong> P25 columns refer to the scaled scores on the 90th, 75th, 50th <strong>and</strong> 25th percentiles respectively. Forexample, P90 is the top 10%, that is 10% of scaled scores are equal to or greater than the scaled score given <strong>for</strong> P90.Table excludes percentile data where there are fewer than 50 students. Where there are fewer than 5 students then the mean,st<strong>and</strong>ard deviation, min <strong>and</strong> max scores are also not included because of the small population size. A graph is not printed if thereare fewer than 10 students.36
101316192225283134374043464952555861646770737679828588919497100<strong>Scaled</strong> <strong>Score</strong>s <strong>Statistics</strong> 26/12/20113.2Marine <strong>and</strong> Maritime Studies 20112.82.4Number of Students2.01.61.20.80.40.0147<strong>Scaled</strong> <strong>Score</strong>s2011Marine <strong>and</strong>Maritime StudiesNumberofStudentsMean<strong>Scaled</strong><strong>Score</strong>St<strong>and</strong>ardDeviationMin <strong>Scaled</strong><strong>Score</strong>Max <strong>Scaled</strong><strong>Score</strong>P90P75MedianP50P25Stage 328 52.6 16.1 27.1 98.9Course 28 52.6 16.1 27.1 98.9Notes:Number of students is all 2011 students with a scaled score in the course (includes international <strong>and</strong> mature age students).P90, P75, P50 <strong>and</strong> P25 columns refer to the scaled scores on the 90th, 75th, 50th <strong>and</strong> 25th percentiles respectively. Forexample, P90 is the top 10%, that is 10% of scaled scores are equal to or greater than the scaled score given <strong>for</strong> P90.Table excludes percentile data where there are fewer than 50 students. Where there are fewer than 5 students then the mean,st<strong>and</strong>ard deviation, min <strong>and</strong> max scores are also not included because of the small population size. A graph is not printed if thereare fewer than 10 students.37
101316192225283134374043464952555861646770737679828588919497100<strong>Scaled</strong> <strong>Score</strong>s <strong>Statistics</strong> 26/12/2011181614Materials Design <strong>and</strong> Technology 2011Number of Students121086420147<strong>Scaled</strong> <strong>Score</strong>s14Materials Design <strong>and</strong> Technology 20111210Number of Students86420147101316192225283134374043464952555861646770737679828588919497<strong>Scaled</strong> <strong>Score</strong>s100stage 2 stage 32011Materials Design<strong>and</strong> TechnologyNumberofStudentsMean<strong>Scaled</strong><strong>Score</strong>St<strong>and</strong>ardDeviationMin <strong>Scaled</strong><strong>Score</strong>Max <strong>Scaled</strong><strong>Score</strong>P90P75MedianP50P25Stage 2Stage 3200 43.9 13.7 0.1 73.8 60.8 53.1 45.4 36.8179 58.6 12.0 12.9 86.5 73.3 66.7 58.7 51.6Course 379 50.8 14.9 0.1 86.5 69.0 61.0 52.3 41.3Notes:Number of students is all 2011 students with a scaled score in the course (includes international <strong>and</strong> mature age students).P90, P75, P50 <strong>and</strong> P25 columns refer to the scaled scores on the 90th, 75th, 50th <strong>and</strong> 25th percentiles respectively. Forexample, P90 is the top 10%, that is 10% of scaled scores are equal to or greater than the scaled score given <strong>for</strong> P90.Table excludes percentile data where there are fewer than 50 students. Where there are fewer than 5 students then the mean,st<strong>and</strong>ard deviation, min <strong>and</strong> max scores are also not included because of the small population size. A graph is not printed if thereare fewer than 10 students.38
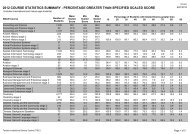
101316192225283134374043464952555861646770737679828588919497100<strong>Scaled</strong> <strong>Score</strong>s <strong>Statistics</strong> 26/12/2011400Mathematics 2011350300Number of Students250200150100500147<strong>Scaled</strong> <strong>Score</strong>s240Mathematics 2011200Number of Students16012080400147101316192225283134374043464952555861646770737679828588919497<strong>Scaled</strong> <strong>Score</strong>s1002AB 2CD 3AB 3CD2011MathematicsNumberofStudentsMean<strong>Scaled</strong><strong>Score</strong>St<strong>and</strong>ardDeviationMin <strong>Scaled</strong><strong>Score</strong>Max <strong>Scaled</strong><strong>Score</strong>P90P75MedianP50P252AB2CD3AB3CD577 33.2 10.6 0.2 61.2 46.4 40.1 33.4 26.54,578 47.8 9.8 9.8 74.5 60.2 54.3 48.0 41.74,637 60.6 9.7 23.7 87.8 73.1 67.1 60.7 54.43,494 73.4 10.0 35.6 100.0 85.9 80.0 73.6 67.2Course 13,286 58.4 15.0 0.2 100.0 77.7 69.1 58.5 48.2Notes:Number of students is all 2011 students with a scaled score in the course (includes international <strong>and</strong> mature age students).P90, P75, P50 <strong>and</strong> P25 columns refer to the scaled scores on the 90th, 75th, 50th <strong>and</strong> 25th percentiles respectively. Forexample, P90 is the top 10%, that is 10% of scaled scores are equal to or greater than the scaled score given <strong>for</strong> P90.Table excludes percentile data where there are fewer than 50 students. Where there are fewer than 5 students then the mean,st<strong>and</strong>ard deviation, min <strong>and</strong> max scores are also not included because of the small population size. A graph is not printed if thereare fewer than 10 students.39
101316192225283134374043464952555861646770737679828588919497100<strong>Scaled</strong> <strong>Score</strong>s <strong>Statistics</strong> 26/12/201160Mathematics: Specialist 201150Number of Students403020100147<strong>Scaled</strong> <strong>Score</strong>s60Mathematics: Specialist 201150Number of Students403020100147101316192225283134374043464952555861646770737679828588919497<strong>Scaled</strong> <strong>Score</strong>s1003AB3CD2011Mathematics:SpecialistNumberofStudentsMean<strong>Scaled</strong><strong>Score</strong>St<strong>and</strong>ardDeviationMin <strong>Scaled</strong><strong>Score</strong>Max <strong>Scaled</strong><strong>Score</strong>P90P75MedianP50P253AB3CD92 43.1 15.8 3.4 80.1 64.3 53.6 42.6 32.51,399 70.5 12.7 26.1 100.0 86.7 78.8 70.9 62.9Course 1,491 68.8 14.5 3.4 100.0 86.3 78.2 70.0 61.0Notes:Number of students is all 2011 students with a scaled score in the course (includes international <strong>and</strong> mature age students).P90, P75, P50 <strong>and</strong> P25 columns refer to the scaled scores on the 90th, 75th, 50th <strong>and</strong> 25th percentiles respectively. Forexample, P90 is the top 10%, that is 10% of scaled scores are equal to or greater than the scaled score given <strong>for</strong> P90.Table excludes percentile data where there are fewer than 50 students. Where there are fewer than 5 students then the mean,st<strong>and</strong>ard deviation, min <strong>and</strong> max scores are also not included because of the small population size. A graph is not printed if thereare fewer than 10 students.40
101316192225283134374043464952555861646770737679828588919497100<strong>Scaled</strong> <strong>Score</strong>s <strong>Statistics</strong> 26/12/2011454035Media Production <strong>and</strong> Analysis 2011Number of Students302520151050147<strong>Scaled</strong> <strong>Score</strong>s45Media Production <strong>and</strong> Analysis 20114035Number of Students302520151050147101316192225283134374043464952555861646770737679828588919497<strong>Scaled</strong> <strong>Score</strong>s100stage 2 stage 32011MediaProduction <strong>and</strong>AnalysisStage 2Stage 3NumberofStudentsMean<strong>Scaled</strong><strong>Score</strong>St<strong>and</strong>ardDeviationMin <strong>Scaled</strong><strong>Score</strong>Max <strong>Scaled</strong><strong>Score</strong>P90P75MedianP50176 35.7 12.6 0.0 62.4 52.4 44.8 35.5 28.7949 57.6 11.8 14.1 87.6 72.2 65.9 58.2 50.2Course 1,125 54.2 14.4 0.0 87.6 71.3 64.4 55.8 45.5Notes:Number of students is all 2011 students with a scaled score in the course (includes international <strong>and</strong> mature age students).P90, P75, P50 <strong>and</strong> P25 columns refer to the scaled scores on the 90th, 75th, 50th <strong>and</strong> 25th percentiles respectively. Forexample, P90 is the top 10%, that is 10% of scaled scores are equal to or greater than the scaled score given <strong>for</strong> P90.Table excludes percentile data where there are fewer than 50 students. Where there are fewer than 5 students then the mean,st<strong>and</strong>ard deviation, min <strong>and</strong> max scores are also not included because of the small population size. A graph is not printed if thereare fewer than 10 students.P2541
<strong>Scaled</strong> <strong>Score</strong>s <strong>Statistics</strong> 26/12/2011Modern Greek 20112011Modern GreekNumberofStudentsMean<strong>Scaled</strong><strong>Score</strong>St<strong>and</strong>ardDeviationMin <strong>Scaled</strong><strong>Score</strong>Max <strong>Scaled</strong><strong>Score</strong>P90P75MedianP50P25Stage 33Course 3Notes:Number of students is all 2011 students with a scaled score in the course (includes international <strong>and</strong> mature age students).P90, P75, P50 <strong>and</strong> P25 columns refer to the scaled scores on the 90th, 75th, 50th <strong>and</strong> 25th percentiles respectively. Forexample, P90 is the top 10%, that is 10% of scaled scores are equal to or greater than the scaled score given <strong>for</strong> P90.Table excludes percentile data where there are fewer than 50 students. Where there are fewer than 5 students then the mean,st<strong>and</strong>ard deviation, min <strong>and</strong> max scores are also not included because of the small population size. A graph is not printed if thereare fewer than 10 students.42
101316192225283134374043464952555861646770737679828588919497100<strong>Scaled</strong> <strong>Score</strong>s <strong>Statistics</strong> 26/12/2011120Modern History 2011100Number of Students806040200147<strong>Scaled</strong> <strong>Score</strong>s120Modern History 2011100Number of Students806040200147101316192225283134374043464952555861646770737679828588919497<strong>Scaled</strong> <strong>Score</strong>s100stage 2 stage 32011Modern HistoryNumberofStudentsMean<strong>Scaled</strong><strong>Score</strong>St<strong>and</strong>ardDeviationMin <strong>Scaled</strong><strong>Score</strong>Max <strong>Scaled</strong><strong>Score</strong>P90P75MedianP50P25Stage 2Stage 321 35.0 15.3 0.0 72.82,710 59.0 13.0 9.7 95.7 75.6 67.6 59.4 51.1Course 2,731 58.9 13.2 0.0 95.7 75.6 67.5 59.3 50.9Notes:Number of students is all 2011 students with a scaled score in the course (includes international <strong>and</strong> mature age students).P90, P75, P50 <strong>and</strong> P25 columns refer to the scaled scores on the 90th, 75th, 50th <strong>and</strong> 25th percentiles respectively. Forexample, P90 is the top 10%, that is 10% of scaled scores are equal to or greater than the scaled score given <strong>for</strong> P90.Table excludes percentile data where there are fewer than 50 students. Where there are fewer than 5 students then the mean,st<strong>and</strong>ard deviation, min <strong>and</strong> max scores are also not included because of the small population size. A graph is not printed if thereare fewer than 10 students.43
101316192225283134374043464952555861646770737679828588919497100<strong>Scaled</strong> <strong>Score</strong>s <strong>Statistics</strong> 26/12/201120Music 201116Number of Students12840147<strong>Scaled</strong> <strong>Score</strong>s20Music 201116Number of Students12840147101316192225283134374043464952555861646770737679828588919497<strong>Scaled</strong> <strong>Score</strong>s100stage 2 stage 32011MusicNumberofStudentsMean<strong>Scaled</strong><strong>Score</strong>St<strong>and</strong>ardDeviationMin <strong>Scaled</strong><strong>Score</strong>Max <strong>Scaled</strong><strong>Score</strong>P90P75MedianP50P25Stage 2Stage 331 37.8 13.2 8.7 68.2441 65.5 12.2 29.4 100.0 80.1 73.9 65.1 57.9Course 472 63.7 14.0 8.7 100.0 79.7 73.2 64.4 56.1Notes:Number of students is all 2011 students with a scaled score in the course (includes international <strong>and</strong> mature age students).P90, P75, P50 <strong>and</strong> P25 columns refer to the scaled scores on the 90th, 75th, 50th <strong>and</strong> 25th percentiles respectively. Forexample, P90 is the top 10%, that is 10% of scaled scores are equal to or greater than the scaled score given <strong>for</strong> P90.Table excludes percentile data where there are fewer than 50 students. Where there are fewer than 5 students then the mean,st<strong>and</strong>ard deviation, min <strong>and</strong> max scores are also not included because of the small population size. A graph is not printed if thereare fewer than 10 students.44
101316192225283134374043464952555861646770737679828588919497100<strong>Scaled</strong> <strong>Score</strong>s <strong>Statistics</strong> 26/12/2011181614Outdoor Education 2011Number of Students121086420147<strong>Scaled</strong> <strong>Score</strong>s14Outdoor Education 20111210Number of Students86420147101316192225283134374043464952555861646770737679828588919497<strong>Scaled</strong> <strong>Score</strong>s100stage 2 stage 32011OutdoorEducationNumberofStudentsMean<strong>Scaled</strong><strong>Score</strong>St<strong>and</strong>ardDeviationMin <strong>Scaled</strong><strong>Score</strong>Max <strong>Scaled</strong><strong>Score</strong>P90P75MedianP50P25Stage 2Stage 3192 40.0 10.5 13.7 70.2 53.3 46.9 39.9 32.7188 57.9 10.3 29.7 87.7 70.4 64.3 58.0 51.5Course 380 48.9 13.7 13.7 87.7 66.7 58.5 48.7 38.8Notes:Number of students is all 2011 students with a scaled score in the course (includes international <strong>and</strong> mature age students).P90, P75, P50 <strong>and</strong> P25 columns refer to the scaled scores on the 90th, 75th, 50th <strong>and</strong> 25th percentiles respectively. Forexample, P90 is the top 10%, that is 10% of scaled scores are equal to or greater than the scaled score given <strong>for</strong> P90.Table excludes percentile data where there are fewer than 50 students. Where there are fewer than 5 students then the mean,st<strong>and</strong>ard deviation, min <strong>and</strong> max scores are also not included because of the small population size. A graph is not printed if thereare fewer than 10 students.45
<strong>Scaled</strong> <strong>Score</strong>s <strong>Statistics</strong> 26/12/2011Persian Background Speakers 20112011PersianBackgroundSpeakersNumberofStudentsMean<strong>Scaled</strong><strong>Score</strong>St<strong>and</strong>ardDeviationMin <strong>Scaled</strong><strong>Score</strong>Max <strong>Scaled</strong><strong>Score</strong>P90P75MedianP50P25Stage 31Course 1Notes:Number of students is all 2011 students with a scaled score in the course (includes international <strong>and</strong> mature age students).P90, P75, P50 <strong>and</strong> P25 columns refer to the scaled scores on the 90th, 75th, 50th <strong>and</strong> 25th percentiles respectively. Forexample, P90 is the top 10%, that is 10% of scaled scores are equal to or greater than the scaled score given <strong>for</strong> P90.Table excludes percentile data where there are fewer than 50 students. Where there are fewer than 5 students then the mean,st<strong>and</strong>ard deviation, min <strong>and</strong> max scores are also not included because of the small population size. A graph is not printed if thereare fewer than 10 students.46
101316192225283134374043464952555861646770737679828588919497100<strong>Scaled</strong> <strong>Score</strong>s <strong>Statistics</strong> 26/12/20117Philosophy <strong>and</strong> Ethics 20116Number of Students543210147<strong>Scaled</strong> <strong>Score</strong>s2011Philosophy <strong>and</strong>EthicsNumberofStudentsMean<strong>Scaled</strong><strong>Score</strong>St<strong>and</strong>ardDeviationMin <strong>Scaled</strong><strong>Score</strong>Max <strong>Scaled</strong><strong>Score</strong>P90P75MedianP50P25Stage 2Stage 33131 64.7 13.1 27.6 97.7 81.7 73.7 64.2 55.0Course 134 64.1 13.7 14.3 97.7 81.7 73.6 64.1 54.2Notes:Number of students is all 2011 students with a scaled score in the course (includes international <strong>and</strong> mature age students).P90, P75, P50 <strong>and</strong> P25 columns refer to the scaled scores on the 90th, 75th, 50th <strong>and</strong> 25th percentiles respectively. Forexample, P90 is the top 10%, that is 10% of scaled scores are equal to or greater than the scaled score given <strong>for</strong> P90.Table excludes percentile data where there are fewer than 50 students. Where there are fewer than 5 students then the mean,st<strong>and</strong>ard deviation, min <strong>and</strong> max scores are also not included because of the small population size. A graph is not printed if thereare fewer than 10 students.47
101316192225283134374043464952555861646770737679828588919497100<strong>Scaled</strong> <strong>Score</strong>s <strong>Statistics</strong> 26/12/201180Physical Education Studies 20117060Number of Students50403020100147<strong>Scaled</strong> <strong>Score</strong>s80Physical Education Studies 20117060Number of Students50403020100147101316192225283134374043464952555861646770737679828588919497<strong>Scaled</strong> <strong>Score</strong>s100stage 2 stage 32011PhysicalEducationStudiesStage 2Stage 3NumberofStudentsMean<strong>Scaled</strong><strong>Score</strong>St<strong>and</strong>ardDeviationMin <strong>Scaled</strong><strong>Score</strong>Max <strong>Scaled</strong><strong>Score</strong>P90P75MedianP50516 38.8 12.7 0.7 68.6 53.0 47.1 39.9 31.61,729 58.7 10.8 12.8 88.1 72.2 66.0 59.3 52.0Course 2,245 54.1 14.0 0.7 88.1 70.6 63.9 55.9 45.9Notes:Number of students is all 2011 students with a scaled score in the course (includes international <strong>and</strong> mature age students).P90, P75, P50 <strong>and</strong> P25 columns refer to the scaled scores on the 90th, 75th, 50th <strong>and</strong> 25th percentiles respectively. Forexample, P90 is the top 10%, that is 10% of scaled scores are equal to or greater than the scaled score given <strong>for</strong> P90.Table excludes percentile data where there are fewer than 50 students. Where there are fewer than 5 students then the mean,st<strong>and</strong>ard deviation, min <strong>and</strong> max scores are also not included because of the small population size. A graph is not printed if thereare fewer than 10 students.P2548
101316192225283134374043464952555861646770737679828588919497100<strong>Scaled</strong> <strong>Score</strong>s <strong>Statistics</strong> 26/12/2011140Physics 2011120Number of Students100806040200147<strong>Scaled</strong> <strong>Score</strong>s140Physics 2011120100Number of Students806040200147101316192225283134374043464952555861646770737679828588919497<strong>Scaled</strong> <strong>Score</strong>s100stage 2 stage 32011PhysicsNumberofStudentsMean<strong>Scaled</strong><strong>Score</strong>St<strong>and</strong>ardDeviationMin <strong>Scaled</strong><strong>Score</strong>Max <strong>Scaled</strong><strong>Score</strong>P90P75MedianP50P25Stage 2Stage 337 36.5 15.4 3.5 78.43,556 65.6 12.6 16.5 99.1 81.6 73.9 66.0 57.7Course 3,593 65.3 12.9 3.5 99.1 81.5 73.9 65.8 57.5Notes:Number of students is all 2011 students with a scaled score in the course (includes international <strong>and</strong> mature age students).P90, P75, P50 <strong>and</strong> P25 columns refer to the scaled scores on the 90th, 75th, 50th <strong>and</strong> 25th percentiles respectively. Forexample, P90 is the top 10%, that is 10% of scaled scores are equal to or greater than the scaled score given <strong>for</strong> P90.Table excludes percentile data where there are fewer than 50 students. Where there are fewer than 5 students then the mean,st<strong>and</strong>ard deviation, min <strong>and</strong> max scores are also not included because of the small population size. A graph is not printed if thereare fewer than 10 students.49
101316192225283134374043464952555861646770737679828588919497100<strong>Scaled</strong> <strong>Score</strong>s <strong>Statistics</strong> 26/12/20115Plant Production Systems 20114Number of Students3210147<strong>Scaled</strong> <strong>Score</strong>s4.0Plant Production Systems 20113.53.0Number of Students2.52.01.51.00.50.0147101316192225283134374043464952555861646770737679828588919497<strong>Scaled</strong> <strong>Score</strong>s100stage 2 stage 32011Plant ProductionSystemsNumberofStudentsMean<strong>Scaled</strong><strong>Score</strong>St<strong>and</strong>ardDeviationMin <strong>Scaled</strong><strong>Score</strong>Max <strong>Scaled</strong><strong>Score</strong>P90P75MedianP50P25Stage 2Stage 320 30.4 12.2 16.6 58.825 45.1 10.5 30.4 66.7Course 45 38.6 13.4 16.6 66.7Notes:Number of students is all 2011 students with a scaled score in the course (includes international <strong>and</strong> mature age students).P90, P75, P50 <strong>and</strong> P25 columns refer to the scaled scores on the 90th, 75th, 50th <strong>and</strong> 25th percentiles respectively. Forexample, P90 is the top 10%, that is 10% of scaled scores are equal to or greater than the scaled score given <strong>for</strong> P90.Table excludes percentile data where there are fewer than 50 students. Where there are fewer than 5 students then the mean,st<strong>and</strong>ard deviation, min <strong>and</strong> max scores are also not included because of the small population size. A graph is not printed if thereare fewer than 10 students.50
<strong>Scaled</strong> <strong>Score</strong>s <strong>Statistics</strong> 26/12/2011Polish 20112011PolishNumberofStudentsMean<strong>Scaled</strong><strong>Score</strong>St<strong>and</strong>ardDeviationMin <strong>Scaled</strong><strong>Score</strong>Max <strong>Scaled</strong><strong>Score</strong>P90P75MedianP50P25Stage 35 71.2 6.1 62.5 80.7Course 5 71.2 6.1 62.5 80.7Notes:Number of students is all 2011 students with a scaled score in the course (includes international <strong>and</strong> mature age students).P90, P75, P50 <strong>and</strong> P25 columns refer to the scaled scores on the 90th, 75th, 50th <strong>and</strong> 25th percentiles respectively. Forexample, P90 is the top 10%, that is 10% of scaled scores are equal to or greater than the scaled score given <strong>for</strong> P90.Table excludes percentile data where there are fewer than 50 students. Where there are fewer than 5 students then the mean,st<strong>and</strong>ard deviation, min <strong>and</strong> max scores are also not included because of the small population size. A graph is not printed if thereare fewer than 10 students.51
101316192225283134374043464952555861646770737679828588919497100<strong>Scaled</strong> <strong>Score</strong>s <strong>Statistics</strong> 26/12/201140Politics <strong>and</strong> Law 20113530Number of Students2520151050147<strong>Scaled</strong> <strong>Score</strong>s40Politics <strong>and</strong> Law 20113530Number of Students2520151050147101316192225283134374043464952555861646770737679828588919497<strong>Scaled</strong> <strong>Score</strong>s100stage 2 stage 32011Politics <strong>and</strong> LawNumberofStudentsMean<strong>Scaled</strong><strong>Score</strong>St<strong>and</strong>ardDeviationMin <strong>Scaled</strong><strong>Score</strong>Max <strong>Scaled</strong><strong>Score</strong>P90P75MedianP50P25Stage 2Stage 337 39.6 13.2 11.2 71.2892 63.8 12.3 22.5 98.5 79.1 71.8 63.9 56.4Course 929 62.9 13.2 11.2 98.5 79.0 71.7 63.6 54.8Notes:Number of students is all 2011 students with a scaled score in the course (includes international <strong>and</strong> mature age students).P90, P75, P50 <strong>and</strong> P25 columns refer to the scaled scores on the 90th, 75th, 50th <strong>and</strong> 25th percentiles respectively. Forexample, P90 is the top 10%, that is 10% of scaled scores are equal to or greater than the scaled score given <strong>for</strong> P90.Table excludes percentile data where there are fewer than 50 students. Where there are fewer than 5 students then the mean,st<strong>and</strong>ard deviation, min <strong>and</strong> max scores are also not included because of the small population size. A graph is not printed if thereare fewer than 10 students.52
101316192225283134374043464952555861646770737679828588919497100<strong>Scaled</strong> <strong>Score</strong>s <strong>Statistics</strong> 26/12/201135Psychology 201130Number of Students2520151050147<strong>Scaled</strong> <strong>Score</strong>s32Psychology 20112824Number of Students201612840147101316192225283134374043464952555861646770737679828588919497<strong>Scaled</strong> <strong>Score</strong>s100stage 2 stage 32011PsychologyNumberofStudentsMean<strong>Scaled</strong><strong>Score</strong>St<strong>and</strong>ardDeviationMin <strong>Scaled</strong><strong>Score</strong>Max <strong>Scaled</strong><strong>Score</strong>P90P75MedianP50P25Stage 2Stage 3193 42.5 11.7 10.6 75.5 58.6 49.9 42.0 35.3626 60.3 11.0 27.1 88.6 74.7 67.4 60.5 53.2Course 819 56.1 13.5 10.6 88.6 72.9 65.3 57.5 47.2Notes:Number of students is all 2011 students with a scaled score in the course (includes international <strong>and</strong> mature age students).P90, P75, P50 <strong>and</strong> P25 columns refer to the scaled scores on the 90th, 75th, 50th <strong>and</strong> 25th percentiles respectively. Forexample, P90 is the top 10%, that is 10% of scaled scores are equal to or greater than the scaled score given <strong>for</strong> P90.Table excludes percentile data where there are fewer than 50 students. Where there are fewer than 5 students then the mean,st<strong>and</strong>ard deviation, min <strong>and</strong> max scores are also not included because of the small population size. A graph is not printed if thereare fewer than 10 students.53
101316192225283134374043464952555861646770737679828588919497100<strong>Scaled</strong> <strong>Score</strong>s <strong>Statistics</strong> 26/12/201180Religion <strong>and</strong> Life 20117060Number of Students50403020100147<strong>Scaled</strong> <strong>Score</strong>s80Religion <strong>and</strong> Life 20117060Number of Students50403020100147101316192225283134374043464952555861646770737679828588919497<strong>Scaled</strong> <strong>Score</strong>s100stage 2 stage 32011Religion <strong>and</strong> LifeNumberofStudentsMean<strong>Scaled</strong><strong>Score</strong>St<strong>and</strong>ardDeviationMin <strong>Scaled</strong><strong>Score</strong>Max <strong>Scaled</strong><strong>Score</strong>P90P75MedianP50P25Stage 2Stage 3234 42.6 11.6 0.4 73.1 57.8 50.3 42.5 35.21,588 62.7 10.7 21.4 91.6 76.5 69.3 63.0 55.9Course 1,822 60.1 12.8 0.4 91.6 75.3 68.4 61.4 52.6Notes:Number of students is all 2011 students with a scaled score in the course (includes international <strong>and</strong> mature age students).P90, P75, P50 <strong>and</strong> P25 columns refer to the scaled scores on the 90th, 75th, 50th <strong>and</strong> 25th percentiles respectively. Forexample, P90 is the top 10%, that is 10% of scaled scores are equal to or greater than the scaled score given <strong>for</strong> P90.Table excludes percentile data where there are fewer than 50 students. Where there are fewer than 5 students then the mean,st<strong>and</strong>ard deviation, min <strong>and</strong> max scores are also not included because of the small population size. A graph is not printed if thereare fewer than 10 students.54
<strong>Scaled</strong> <strong>Score</strong>s <strong>Statistics</strong> 26/12/2011Russian 20112011RussianNumberofStudentsMean<strong>Scaled</strong><strong>Score</strong>St<strong>and</strong>ardDeviationMin <strong>Scaled</strong><strong>Score</strong>Max <strong>Scaled</strong><strong>Score</strong>P90P75MedianP50P25Stage 32Course 2Notes:Number of students is all 2011 students with a scaled score in the course (includes international <strong>and</strong> mature age students).P90, P75, P50 <strong>and</strong> P25 columns refer to the scaled scores on the 90th, 75th, 50th <strong>and</strong> 25th percentiles respectively. Forexample, P90 is the top 10%, that is 10% of scaled scores are equal to or greater than the scaled score given <strong>for</strong> P90.Table excludes percentile data where there are fewer than 50 students. Where there are fewer than 5 students then the mean,st<strong>and</strong>ard deviation, min <strong>and</strong> max scores are also not included because of the small population size. A graph is not printed if thereare fewer than 10 students.55
<strong>Scaled</strong> <strong>Score</strong>s <strong>Statistics</strong> 26/12/2011Spanish 20112011SpanishNumberofStudentsMean<strong>Scaled</strong><strong>Score</strong>St<strong>and</strong>ardDeviationMin <strong>Scaled</strong><strong>Score</strong>Max <strong>Scaled</strong><strong>Score</strong>P90P75MedianP50P25Stage 34Course 4Notes:Number of students is all 2011 students with a scaled score in the course (includes international <strong>and</strong> mature age students).P90, P75, P50 <strong>and</strong> P25 columns refer to the scaled scores on the 90th, 75th, 50th <strong>and</strong> 25th percentiles respectively. Forexample, P90 is the top 10%, that is 10% of scaled scores are equal to or greater than the scaled score given <strong>for</strong> P90.Table excludes percentile data where there are fewer than 50 students. Where there are fewer than 5 students then the mean,st<strong>and</strong>ard deviation, min <strong>and</strong> max scores are also not included because of the small population size. A graph is not printed if thereare fewer than 10 students.56
<strong>Scaled</strong> <strong>Score</strong>s <strong>Statistics</strong> 26/12/2011Vietnamese 20112011VietnameseNumberofStudentsMean<strong>Scaled</strong><strong>Score</strong>St<strong>and</strong>ardDeviationMin <strong>Scaled</strong><strong>Score</strong>Max <strong>Scaled</strong><strong>Score</strong>P90P75MedianP50P25Stage 35 52.3 15.0 23.0 63.1Course 5 52.3 15.0 23.0 63.1Notes:Number of students is all 2011 students with a scaled score in the course (includes international <strong>and</strong> mature age students).P90, P75, P50 <strong>and</strong> P25 columns refer to the scaled scores on the 90th, 75th, 50th <strong>and</strong> 25th percentiles respectively. Forexample, P90 is the top 10%, that is 10% of scaled scores are equal to or greater than the scaled score given <strong>for</strong> P90.Table excludes percentile data where there are fewer than 50 students. Where there are fewer than 5 students then the mean,st<strong>and</strong>ard deviation, min <strong>and</strong> max scores are also not included because of the small population size. A graph is not printed if thereare fewer than 10 students.57
101316192225283134374043464952555861646770737679828588919497100<strong>Scaled</strong> <strong>Score</strong>s <strong>Statistics</strong> 26/12/2011454035Visual Arts 2011Number of Students302520151050147<strong>Scaled</strong> <strong>Score</strong>s40Visual Arts 20113530Number of Students2520151050147101316192225283134374043464952555861646770737679828588919497<strong>Scaled</strong> <strong>Score</strong>s100stage 2 stage 32011Visual ArtsNumberofStudentsMean<strong>Scaled</strong><strong>Score</strong>St<strong>and</strong>ardDeviationMin <strong>Scaled</strong><strong>Score</strong>Max <strong>Scaled</strong><strong>Score</strong>P90P75MedianP50P25Stage 2Stage 3139 37.2 14.2 0.0 74.0 54.0 46.4 38.3 28.5928 58.7 11.7 17.6 93.0 73.7 66.5 59.2 51.2Course 1,067 55.9 14.1 0.0 93.0 72.6 65.6 57.2 48.2Notes:Number of students is all 2011 students with a scaled score in the course (includes international <strong>and</strong> mature age students).P90, P75, P50 <strong>and</strong> P25 columns refer to the scaled scores on the 90th, 75th, 50th <strong>and</strong> 25th percentiles respectively. Forexample, P90 is the top 10%, that is 10% of scaled scores are equal to or greater than the scaled score given <strong>for</strong> P90.Table excludes percentile data where there are fewer than 50 students. Where there are fewer than 5 students then the mean,st<strong>and</strong>ard deviation, min <strong>and</strong> max scores are also not included because of the small population size. A graph is not printed if thereare fewer than 10 students.58