Histograms and Scaled Score Statistics for WACE Courses - TISC
Histograms and Scaled Score Statistics for WACE Courses - TISC
Histograms and Scaled Score Statistics for WACE Courses - TISC

Create successful ePaper yourself
Turn your PDF publications into a flip-book with our unique Google optimized e-Paper software.
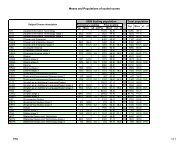
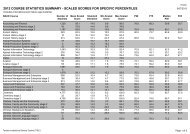
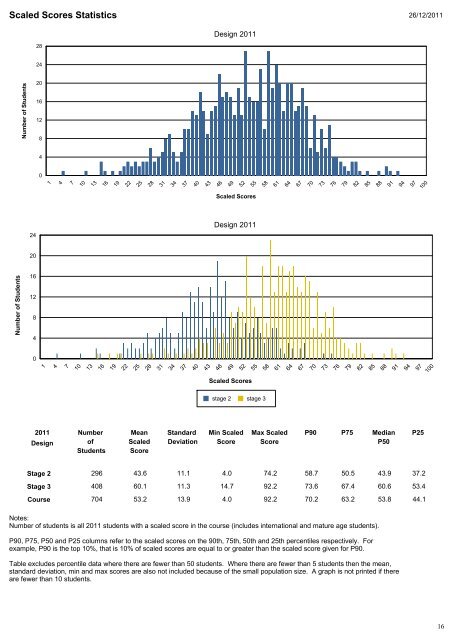
101316192225283134374043464952555861646770737679828588919497100<strong>Scaled</strong> <strong>Score</strong>s <strong>Statistics</strong> 26/12/201128Design 201124Number of Students201612840147<strong>Scaled</strong> <strong>Score</strong>s24Design 201120Number of Students1612840147101316192225283134374043464952555861646770737679828588919497<strong>Scaled</strong> <strong>Score</strong>s100stage 2 stage 32011DesignNumberofStudentsMean<strong>Scaled</strong><strong>Score</strong>St<strong>and</strong>ardDeviationMin <strong>Scaled</strong><strong>Score</strong>Max <strong>Scaled</strong><strong>Score</strong>P90P75MedianP50P25Stage 2Stage 3296 43.6 11.1 4.0 74.2 58.7 50.5 43.9 37.2408 60.1 11.3 14.7 92.2 73.6 67.4 60.6 53.4Course 704 53.2 13.9 4.0 92.2 70.2 63.2 53.8 44.1Notes:Number of students is all 2011 students with a scaled score in the course (includes international <strong>and</strong> mature age students).P90, P75, P50 <strong>and</strong> P25 columns refer to the scaled scores on the 90th, 75th, 50th <strong>and</strong> 25th percentiles respectively. Forexample, P90 is the top 10%, that is 10% of scaled scores are equal to or greater than the scaled score given <strong>for</strong> P90.Table excludes percentile data where there are fewer than 50 students. Where there are fewer than 5 students then the mean,st<strong>and</strong>ard deviation, min <strong>and</strong> max scores are also not included because of the small population size. A graph is not printed if thereare fewer than 10 students.16