demonstration of biogas production using low moisture content
demonstration of biogas production using low moisture content
demonstration of biogas production using low moisture content

You also want an ePaper? Increase the reach of your titles
YUMPU automatically turns print PDFs into web optimized ePapers that Google loves.
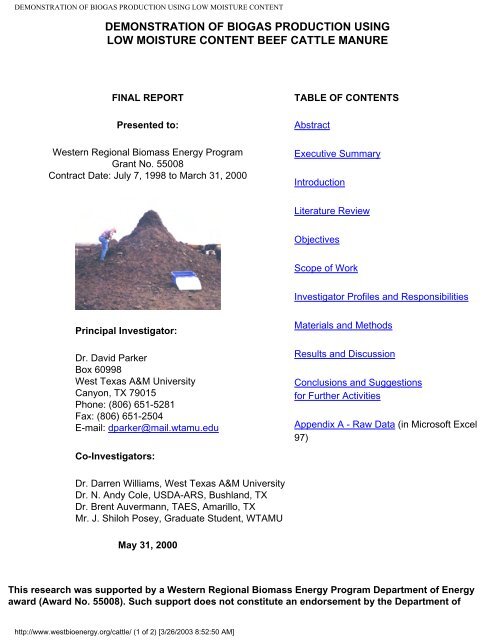
DEMONSTRATION OF BIOGAS PRODUCTION USING LOW MOISTURE CONTENT<br />
DEMONSTRATION OF BIOGAS PRODUCTION USING<br />
LOW MOISTURE CONTENT BEEF CATTLE MANURE<br />
FINAL REPORT<br />
Presented to:<br />
Western Regional Biomass Energy Program<br />
Grant No. 55008<br />
Contract Date: July 7, 1998 to March 31, 2000<br />
TABLE OF CONTENTS<br />
Abstract<br />
Executive Summary<br />
Introduction<br />
Literature Review<br />
Objectives<br />
Scope <strong>of</strong> Work<br />
Investigator Pr<strong>of</strong>iles and Responsibilities<br />
Principal Investigator:<br />
Dr. David Parker<br />
Box 60998<br />
West Texas A&M University<br />
Canyon, TX 79015<br />
Phone: (806) 651-5281<br />
Fax: (806) 651-2504<br />
E-mail: dparker@mail.wtamu.edu<br />
Materials and Methods<br />
Results and Discussion<br />
Conclusions and Suggestions<br />
for Further Activities<br />
Appendix A - Raw Data (in Micros<strong>of</strong>t Excel<br />
97)<br />
Co-Investigators:<br />
Dr. Darren Williams, West Texas A&M University<br />
Dr. N. Andy Cole, USDA-ARS, Bushland, TX<br />
Dr. Brent Auvermann, TAES, Amarillo, TX<br />
Mr. J. Shiloh Posey, Graduate Student, WTAMU<br />
May 31, 2000<br />
This research was supported by a Western Regional Biomass Energy Program Department <strong>of</strong> Energy<br />
award (Award No. 55008). Such support does not constitute an endorsement by the Department <strong>of</strong><br />
http://www.westbioenergy.org/cattle/ (1 <strong>of</strong> 2) [3/26/2003 8:52:50 AM]
DEMONSTRATION OF BIOGAS PRODUCTION USING LOW MOISTURE CONTENT<br />
Energy or the Western Regional Biomass Energy Program <strong>of</strong> the views expressed herein.<br />
http://www.westbioenergy.org/cattle/ (2 <strong>of</strong> 2) [3/26/2003 8:52:50 AM]
DEMONSTRATION OF BIOGAS PRODUCTION USING LOW MOISTURE CONTENT<br />
DEMONSTRATION OF BIOGAS PRODUCTION USING<br />
LOW MOISTURE CONTENT BEEF CATTLE MANURE<br />
ABSTRACT<br />
A research and <strong>demonstration</strong> project was performed to evaluate <strong>biogas</strong> <strong>production</strong> at ambient temperatures<br />
<strong>using</strong> beef cattle manure scraped from open lot feedyards. Laboratory experiments were conducted to measure<br />
potential <strong>biogas</strong> <strong>production</strong> rates <strong>using</strong> beef cattle manure at 21° C (70° F). Manure with an initial volatile solids<br />
<strong>content</strong> <strong>of</strong> 32.0% produced <strong>biogas</strong> at rates <strong>of</strong> 0.0046, 0.12, 0.14, 0.13, and 0.035 liters per gram VS at wet<br />
basis <strong>moisture</strong> <strong>content</strong>s <strong>of</strong> 50, 60, 70, 80, and 95%, respectively. A field <strong>demonstration</strong> project was conducted<br />
to determine feasibility <strong>of</strong> collecting <strong>biogas</strong> <strong>using</strong> "landfill-type" cells. Two 91m 3 cells were excavated in native<br />
soil, lined on the top and bottom with EPDM geomembranes, and manure at a wet basis <strong>moisture</strong> <strong>content</strong> <strong>of</strong><br />
60% was placed within the cells. The first cell was loaded with manure in February, 1999, and began <strong>biogas</strong><br />
<strong>production</strong> on August 1, 1999. Biogas <strong>production</strong> ceased around October 23, 1999. During the 12 week period,<br />
the first cell produced 1,500 m 3 (53,000 ft 3 ) <strong>of</strong> <strong>biogas</strong> with a maximum methane concentration <strong>of</strong> 52%. The<br />
<strong>biogas</strong> <strong>production</strong> rate in the first cell was 0.10 L/g VS, which compares favorably to the laboratory results. The<br />
second cell was loaded with manure (initial VS= 41.9%dry weight basis) in January, 2000, and has not<br />
produced any <strong>biogas</strong> to date. This research and <strong>demonstration</strong> project demonstrated that <strong>biogas</strong> could be<br />
produced in landfill cells <strong>using</strong> beef cattle manure scraped from open lots. However, further work is required<br />
before <strong>biogas</strong> <strong>production</strong> with beef cattle manure will be feasible.<br />
Back<br />
http://www.westbioenergy.org/cattle/abstract.html [3/26/2003 8:52:51 AM]
DEMONSTRATION OF BIOGAS PRODUCTION USING LOW MOISTURE CONTENT<br />
DEMONSTRATION OF BIOGAS PRODUCTION USING<br />
LOW MOISTURE CONTENT BEEF CATTLE MANURE<br />
EXECUTIVE SUMMARY<br />
Beef cattle feedlots in the Texas panhandle produce more than 6 million beef cattle annually. The manure is<br />
deposited in open-lots, and is removed every 6 to 12 months. Traditionally, this manure has gone directly to<br />
land application fol<strong>low</strong>ing removal from the pens. At these beef cattle feedyards, annual manure <strong>production</strong> is<br />
about 36 billion pounds <strong>of</strong> fresh manure, equating to about 1.3 billion pounds after drying on the pen surface for<br />
6 to 12 months. This amount <strong>of</strong> manure represents a tremendous <strong>biogas</strong> energy potential should economically<br />
methods be developed to harvest that energy. This research and <strong>demonstration</strong> project was performed to<br />
evaluate <strong>biogas</strong> <strong>production</strong> at ambient temperatures <strong>using</strong> beef cattle manure scraped from open lot feedyards.<br />
Three laboratory experiments were conducted to determine potential <strong>biogas</strong> <strong>production</strong> rates. In the first two<br />
laboratory experiments, <strong>biogas</strong> was produced in collapsible <strong>low</strong> density polyethylene (LDPE) containers. The<br />
permeability <strong>of</strong> the containers resulted in <strong>low</strong> <strong>biogas</strong> <strong>production</strong> rates and abnormal gas concentrations. The<br />
experimental procedures were modified for the third experiment and the <strong>biogas</strong> was collected by water<br />
displacement in Nalgene containers kept at 21° C (70° F). Manure in the third experiment had an initial volatile<br />
solids (VS) <strong>content</strong> <strong>of</strong> 32.0% dry weight basis. Biogas <strong>production</strong> rates were 0.0046, 0.12, 0.14, 0.13, and<br />
0.035 liters per gram VS at wet basis <strong>moisture</strong> <strong>content</strong>s <strong>of</strong> 50, 60, 70, 80, and 95%, respectively. Biogas<br />
<strong>production</strong> rates were steady throughout the 8 months that <strong>biogas</strong> was produced.<br />
A field <strong>demonstration</strong> project was conducted to determine feasibility <strong>of</strong> collecting <strong>biogas</strong> <strong>using</strong> "landfill-type"<br />
cells. Two 91m 3 (3,200 ft 3 ) cells were excavated in the native soil to a depth <strong>of</strong> 6 feet. The cells were lined on<br />
the top and bottom with EPDM geomembranes, and manure at a wet basis <strong>moisture</strong> <strong>content</strong> <strong>of</strong> 60% was<br />
placed within the cells. The first cell was loaded with manure (initial VS=32.0% dry weight basis) in February,<br />
1999, and began <strong>biogas</strong> <strong>production</strong> around August 1, 1999. Biogas <strong>production</strong> ceased around October 23,<br />
1999. During the 12 week period, the first cell produced a total <strong>of</strong> about 1,500 m 3 (53,000 ft 3 ) <strong>of</strong> <strong>biogas</strong> with a<br />
maximum methane concentration <strong>of</strong> 52%, for a <strong>biogas</strong> <strong>production</strong> rate <strong>of</strong> 0.10 liters per gram VS. The second<br />
cell was loaded with manure (initial VS=41.9% dry weight basis) in January, 2000, and has not produced any<br />
<strong>biogas</strong> to date.<br />
This research and <strong>demonstration</strong> project demonstrated that <strong>biogas</strong> could be produced in landfill cells <strong>using</strong> beef<br />
cattle manure scraped from open lots. The <strong>biogas</strong> <strong>production</strong> appears to be highly temperature dependent, as<br />
<strong>biogas</strong> was produced for only 7 weeks out <strong>of</strong> the year. Thus, <strong>biogas</strong> <strong>production</strong> with beef cattle manure may not<br />
be feasible unless the cells are heated so that <strong>biogas</strong> could be produced year-round. Further studies are<br />
warranted to continue development <strong>of</strong> an economical method for <strong>biogas</strong> <strong>production</strong> from beef cattle manure<br />
collected in open lots.<br />
Back<br />
http://www.westbioenergy.org/cattle/execsumm.html [3/26/2003 8:52:51 AM]
INTRODUCTION<br />
DEMONSTRATION OF BIOGAS PRODUCTION USING<br />
LOW MOISTURE CONTENT BEEF CATTLE MANURE<br />
INTRODUCTION<br />
About 6.3 million beef cattle are fed each year in feedyards in the Texas Panhandle area (Figure 1). In addition,<br />
more than 3.4 million hogs are grown in the same area. There are 70 feedyards in the area with capacities<br />
greater than 20,000 cattle, with several lots as large as 50,000 to 85,000 head. About 36 billion pounds or 16<br />
million metric tons <strong>of</strong> manure (wet basis) are produced at beef cattle feedyards alone (Parker et al., 1997). The<br />
potential <strong>biogas</strong> energy <strong>production</strong> from this vast amount <strong>of</strong> manure would be immense if an economical<br />
method <strong>of</strong> <strong>production</strong> was found.<br />
Figure 1. Cattle Feeding Area Covering Twenty-Six Counties in Texas, Two<br />
Counties in New Mexico, Three Counties in Oklahoma, and Three Counties in Kansas<br />
Manure <strong>production</strong> and management at beef cattle feedlots differs from most dairies and swine operations. At<br />
beef cattle feedlots, manure that is deposited on the ground is scraped and removed every 120 to 365 days, as<br />
opposed to swine and dairy operations that scrape or remove manure as <strong>of</strong>ten as every day. As a result, beef<br />
cattle manure contains more foreign matter (soil, rocks) and less volatile solids than swine or dairy manure.<br />
These solids cause problems in conventional <strong>biogas</strong> digesters. A typical open-lot beef cattle feedyard is shown<br />
in Figure 2.<br />
Beef cattle manure has a much <strong>low</strong>er <strong>moisture</strong> <strong>content</strong> than dairy and swine waste because water is not added<br />
http://www.westbioenergy.org/cattle/intro.htm (1 <strong>of</strong> 2) [3/26/2003 8:52:52 AM]
INTRODUCTION<br />
during the waste management process. Because water is a precious commodity in the Texas High Plains, the<br />
addition <strong>of</strong> large amounts <strong>of</strong> water to beef cattle manure for digestion is impractical.<br />
Figure 2. A typical open-lot beef cattle feedyard in the Texas panhandle.<br />
On August 4, 1997, a biomass workshop entitled "Livestock Waste Streams: Energy and Environment" was<br />
held in Amarillo, Texas. The workshop was sponsored by the Western Regional Biomass Energy Program,<br />
Texas Renewable Energy Industries Association, and West Texas A&M University’s Alternative Energy<br />
Institute. The focus on the workshop was on producing energy from livestock manure. One <strong>of</strong> the research and<br />
<strong>demonstration</strong> opportunities identified by participants at the workshop was to produce <strong>biogas</strong> from manure in a<br />
landfill cell type arrangement. The <strong>demonstration</strong> project presented in this report was one <strong>of</strong> the ideas that<br />
resulted from discussions among a group <strong>of</strong> experts involved in that workshop.<br />
Back<br />
http://www.westbioenergy.org/cattle/intro.htm (2 <strong>of</strong> 2) [3/26/2003 8:52:52 AM]
LITERATURE REVIEW<br />
DEMONSTRATION OF BIOGAS PRODUCTION USING<br />
LOW MOISTURE CONTENT BEEF CATTLE MANURE<br />
LITERATURE REVIEW<br />
The development <strong>of</strong> alternative energy and fuel sources began well before 1970, but the interest in producing<br />
<strong>biogas</strong> from manures peaked during that time because <strong>of</strong> rising prices in the fossil fuel market. Due to high cost,<br />
high maintenance, and design problems, interest in <strong>biogas</strong> <strong>production</strong> at beef cattle feedyards declined. Recent<br />
interest has surfaced in areas that deal with more than just the conservation <strong>of</strong> fossil fuels. These areas include<br />
controlling odors and groundwater contamination.<br />
Biogas is composed almost exclusively <strong>of</strong> methane and carbon dioxide with traces <strong>of</strong> H2 S, N 2 , H 2 and CO. The<br />
energy value <strong>of</strong> <strong>biogas</strong> is typically 400-700 BTU/ft 3 as compared to 1,000 BTU/ft 3 for natural gas. The<br />
breakdown <strong>of</strong> cattle manure in <strong>biogas</strong> is accomplished by three types <strong>of</strong> bacteria, 1) hydrolytic, 2) transitional,<br />
and 3) methanogenic. Hydrolytic bacteria are utilized in the first steps <strong>of</strong> <strong>production</strong> by reducing large<br />
macromolecules (proteins, fats, carbohydrates) into much smaller molecules such as amino acids, sugars,<br />
acids, and alcohols. Transitional bacteria further reduce these molecules into acetic acid, H 2 and CO 2 . The final<br />
step <strong>of</strong> breakdown is accomplished by methanogenic bacteria, which reduce the molecules into methane (CH 4 )<br />
and carbon dioxide (CO 2 ) (Engler et al., 1995). Hansen et al. (1998) states that acetate-utilizing methanogens<br />
are responsible for 70% <strong>of</strong> methane produced in a <strong>biogas</strong> reactor. Biogas <strong>production</strong> is also a temperaturedependent<br />
process (Misra et al., 1992). The process takes place in either psychrophilic (
OBJECTIVES<br />
OBJECTIVES<br />
The objectives <strong>of</strong> this research and <strong>demonstration</strong> project were to 1) determine how <strong>moisture</strong> <strong>content</strong> affects<br />
<strong>biogas</strong> <strong>production</strong> rates from beef cattle manure collected from open lots, and 2) evaluate the feasibility <strong>of</strong><br />
producing <strong>biogas</strong> <strong>using</strong> beef cattle manure in a <strong>low</strong> cost, <strong>low</strong> maintenance landfill-type cell.<br />
SCOPE OF WORK<br />
The scope <strong>of</strong> work, as outlined in the WRBEP Contract No. 55008 dated 7/1/98, consisted <strong>of</strong> the nine tasks<br />
outlined be<strong>low</strong>:<br />
Task 1 Laboratory Closed-Cell Biogas Production Experiments<br />
Task 2 Biogas and Product Evaluation for the Laboratory Closed-Cell Biogas<br />
Experiments<br />
Task 3 Construction <strong>of</strong> Anaerobic Landfill-Cell Digesters<br />
Task 4 Add Manure to Cell One and Seal<br />
Task 5 Monitor Biogas Production for Cell One<br />
Task 6 Add Manure to Cell Two and Seal<br />
Task 7 Monitor Biogas Production for Cells One and Two<br />
Task 8 Evaluate the Data for Biogas Production for Cells One and Two<br />
Task 9 Prepare Final Reports<br />
INVESTIGATOR PROFILES AND RESPONSIBILITIES<br />
This project was completed as a group effort <strong>of</strong> several scientists and one graduate student. Pr<strong>of</strong>iles <strong>of</strong> the<br />
investigators and roles played by each individual are presented be<strong>low</strong>.<br />
Dr. David Parker is an agricultural engineer and assistant pr<strong>of</strong>essor at West Texas A&M University in Canyon,<br />
Texas. Dr. Parker has a 75% research, 25% teaching appointment and devotes his research time to animal<br />
waste research. He also teaches graduate courses in agricultural waste management and environmental<br />
statistics. Dr. Parker was responsible for overall management <strong>of</strong> this project, and for preparation <strong>of</strong> quarterly<br />
and final reports. In addition, Dr. Parker was the thesis advisor for the graduate student working on the project.<br />
Dr. Darren Williams is an assistant pr<strong>of</strong>essor <strong>of</strong> chemistry at West Texas A&M University specializing in<br />
instrumental analysis. Dr. Darren Williams was responsible for the analysis <strong>of</strong> the <strong>biogas</strong> samples, and served<br />
on the graduate committee for the graduate student working on the project.<br />
http://www.westbioenergy.org/cattle/objectives.htm (1 <strong>of</strong> 6) [3/26/2003 8:52:54 AM]
OBJECTIVES<br />
Dr. Brent Auvermann is an agricultural engineer and assistant pr<strong>of</strong>essor employed by Texas A&M University in<br />
Amarillo, Texas. Dr. Auvermann has a 35% research and 65% extension appointment. His duties include<br />
performing research and technology transfer related to livestock manure management and protection <strong>of</strong> air and<br />
water quality. Dr. Auvermann provided assistance and guidance throughout the project, assisted with data<br />
evaluation and interpretation, and served on the graduate committee for the graduate student working on the<br />
project.<br />
Dr. Andy Cole is an animal scientist working at the USDA-ARS Conservation and Produciton Research<br />
Laboratory in Bushland, Texas. Dr. Cole has a 100% research appointment in the area <strong>of</strong> animal waste<br />
management. Dr. Cole provided assistance and guidance throughout the project, assisted with data evaluation<br />
and interpretation, and served on the graduate committee for the graduate student working on the project.<br />
Mr. J. Shiloh Posey is a M.S. graduate student in Biology at West Texas A&M University. Mr. Posey is originally<br />
from Plainview, TX, and was responsible for supervising the construction <strong>of</strong> the <strong>biogas</strong> cells, daily monitoring <strong>of</strong><br />
the experiments and <strong>demonstration</strong> project, and preparation <strong>of</strong> a thesis on the project.<br />
MATERIALS AND METHODS<br />
This project consisted <strong>of</strong> three laboratory experiments and a field <strong>demonstration</strong> project. The laboratory<br />
experiments were conducted in the Environmental Agriculture Lab at West Texas A&M University’s Kilgore<br />
Research Center. The field <strong>demonstration</strong> project was conducted at the WTAMU Research Feedlot located 6<br />
miles east <strong>of</strong> Canyon, TX.<br />
Laboratory Experiment No.1<br />
http://www.westbioenergy.org/cattle/objectives.htm (2 <strong>of</strong> 6) [3/26/2003 8:52:54 AM]
OBJECTIVES<br />
Figure 3. Low density polyethylene collapsible containers used in experiments 1 and 2.<br />
Manure (120 g total, 50 g VS) was placed into 4-L <strong>low</strong> density polyethylene (LDPE) collapsible containers<br />
(Figure 3) and water was added to obtain seven <strong>moisture</strong> <strong>content</strong>s <strong>of</strong> 12.9, 20, 30, 40, 50, 75% (wet weight<br />
basis) with five replications for each <strong>moisture</strong> <strong>content</strong>. The manure as received from the commercial feedyard<br />
had an initial <strong>moisture</strong> <strong>content</strong> <strong>of</strong> 12.9% (dry weight basis) and the initial VS <strong>content</strong> was 48.0% (dry weight<br />
basis). Moisture <strong>content</strong> was determined by oven drying at 100 o C, and volatile solids (VS) was determined<br />
<strong>using</strong> a muffle furnace at 500 o C (ASAE, 1999). The containers were filled with CO 2 , flattened and sealed to<br />
remove oxygen. The containers were maintained at 21° C (70° F) throughout the experiment to simulate<br />
psychrophilic temperature conditions. Biogas <strong>production</strong> was measured by immersing the containers in water<br />
and calculating <strong>biogas</strong> volumes by displacement.<br />
Laboratory Experiment No. 2<br />
The second experiment was similar to the first, except that samples were kept at 35° C (95° F) to simulate<br />
thermophilic temperature conditions. The treatments consisted <strong>of</strong> six <strong>moisture</strong> <strong>content</strong>s (35, 50, 57.5, 65, 72.5,<br />
and 80% by weight), also with five replications for each. These samples were kept in a 1.3 m x 1.3 m x 0.67 m<br />
deep plywood box which was equipped with a NuTone wall heater (model 9376N) and thermostat. After the<br />
samples reached a stabilization point (70 days for Experiment 1 and 45 days for Experiment 2), they were<br />
analyzed for CH 4 , CO 2 , N 2 , and other gases <strong>using</strong> a Hewlett Packard GCD 1800 GC/MS. Hydrogen sulfide was<br />
analyzed <strong>using</strong> a Jerome 631-X (Arizona Instrument Corp., Phoenix, AZ) hydrogen sulfide meter.<br />
Laboratory Experiment No. 3<br />
Manure (VS=32.0%) at <strong>moisture</strong> <strong>content</strong>s <strong>of</strong> 50, 60, 70, 80, and 95% (wet weight basis) wase placed into 250<br />
ml Erlenmeyer flasks equipped with rubber stoppers and plastic hoses (1/4" O.D. polyurethane-Cole Parmer<br />
Instrument Company). Three replications <strong>of</strong> each were used. The 1000 ml Nalgene containers were filled with<br />
water and inverted into containers filled to half volume with water. Ahose was inserted into each container, for a<br />
total <strong>of</strong> fifteen samples. The total volume for each container was recorded over time. As each container filled<br />
with gas, it was sealed, removed, and replaced by another Nalgene container. A schematic <strong>of</strong> the laboratory<br />
apparatus used in Experiment 3 is shown in Figure 4.<br />
Figure 4. Schematic <strong>of</strong> laboratory apparatus used in experiment 3.<br />
Field Demonstration Project<br />
http://www.westbioenergy.org/cattle/objectives.htm (3 <strong>of</strong> 6) [3/26/2003 8:52:54 AM]
OBJECTIVES<br />
The field phase <strong>of</strong> the experiment was conducted at West Texas A&M University’s Research Feedlot. Two<br />
be<strong>low</strong> ground "landfill" cells were constructed in Fall, 1998. The excavation was completed by Earthworks, Inc.<br />
on September 23-25, 1998. The <strong>low</strong>er liner was installed in the two landfill-cell digesters on October 8-9, 1998.<br />
Each cell measured 11 m x 11 m (34 ft x 34 ft) at ground level and was 2 m (6 ft) in depth with a 3 m x 3 m (10<br />
ft x 10 ft) base. Each cell had a capacity <strong>of</strong> 91 m 3 (3,200 ft 3 ). A schematic <strong>of</strong> the landfill cells is shown in Figure<br />
5.<br />
Figure 5. Schematic <strong>of</strong> landfill-type <strong>biogas</strong> reacter.<br />
Each cell was lined with an EPDM geosynthetic liner (Colorado Lining International, Parker, CO) on the bottom<br />
and top (Figure 6). The first cell was filled with manure, saturated to 60% <strong>moisture</strong> <strong>content</strong> by weight, and<br />
capped on February 12, 1999 (Figure 7). Initial volatile solids <strong>content</strong> <strong>of</strong> manure in the first cell was 32.0%. The<br />
second cell was filled (60% <strong>moisture</strong> <strong>content</strong> by weight, initial VS=41.9%), and capped on January 5, 2000. A<br />
gas collection apparatus was constructed <strong>of</strong> PVC pipe to collect gas samples at the top <strong>of</strong> each cell. Each cell<br />
was equipped with a data logger (Starlogger Model 6004) and thermisters to monitor manure temperatures at<br />
0.7 and 1.3 m above the bottom <strong>of</strong> each cell.<br />
Each cell was capped by placing a single piece <strong>of</strong> EPDM geomembrane over the top <strong>of</strong> each cell and the<br />
perimeter <strong>of</strong> the liner was buried. The gas was al<strong>low</strong>ed to collect for several days, thus inflating the upper liner<br />
into a dome. The volume <strong>of</strong> the dome was measured with surveying instruments.<br />
To collect the <strong>biogas</strong> from the cells, a large plastic bag was attached to the exit port and was periodically tested<br />
for methane <strong>content</strong> <strong>using</strong> a GT Land Surveyor portable methane analyzer (Gastech, Newark, CA).<br />
http://www.westbioenergy.org/cattle/objectives.htm (4 <strong>of</strong> 6) [3/26/2003 8:52:54 AM]
OBJECTIVES<br />
Figure 6. Installing the EPDM geomembrane on the bottoms <strong>of</strong> the cells.<br />
http://www.westbioenergy.org/cattle/objectives.htm (5 <strong>of</strong> 6) [3/26/2003 8:52:54 AM]
OBJECTIVES<br />
Figure 7. Loading manure into cell no. 1 <strong>using</strong> a front-end loader.<br />
Statistical Analyses<br />
Mean <strong>biogas</strong> <strong>production</strong> rates (L/g VS) were compared <strong>using</strong> LSD comparisons at a significant level <strong>of</strong> 0.05.<br />
Statistical analyses were performed <strong>using</strong> the SPSS Version 10 s<strong>of</strong>tware package.<br />
Back<br />
http://www.westbioenergy.org/cattle/objectives.htm (6 <strong>of</strong> 6) [3/26/2003 8:52:54 AM]
Results and Discussion<br />
RESULTS AND DISCUSSION<br />
Experiments 1 and 2<br />
The gas volumes for Experiments 1 are plotted in Figures 8a – 8g. At 21° C, gas <strong>production</strong> was negligible at<br />
<strong>moisture</strong> <strong>content</strong>s <strong>of</strong> 50% or less. The average <strong>biogas</strong> <strong>production</strong> rate at 75% <strong>moisture</strong> <strong>content</strong> was 0.067 L/g<br />
VS (Table 1). At 35° C, average gas <strong>production</strong> was 0.0, 0.0041, 0.0061, 0.012, 0.018, and 0.025 L/g VS for<br />
<strong>moisture</strong> <strong>content</strong>s <strong>of</strong> 35, 50, 57.5, 65, 72.5, and 80%, respectively (Table 2).<br />
The average concentrations <strong>of</strong> N 2 , CO 2 , H 2 O, and CH 4 in the <strong>biogas</strong> produced in Experiment 1 are<br />
summarized in Table 1. For Experiment 2, none <strong>of</strong> the average methane concentrations were above 5%, and<br />
only 6 <strong>of</strong> the containers were above 2% methane <strong>content</strong> (Figures 9a-9f). In Experiment 1 there was a greater<br />
percentage <strong>of</strong> CH 4 in the containers than in Experiment 2. All containers showed high concentrations <strong>of</strong> N 2 ,<br />
which is not typical for <strong>biogas</strong>. Because these results were abnormal for <strong>biogas</strong> generation, the LDPE<br />
containers were investigated to determine the cause <strong>of</strong> the atypical results.<br />
The fol<strong>low</strong>ing gas permeabilities have been reported for LDPE (Nalgene, 1999):<br />
MATERIAL<br />
Water<br />
PERMEABILITY<br />
1.0-1.5g.mil/100in 2 /day<br />
Nitrogen<br />
180 cc mil/100 in 2 /day<br />
Oxygen<br />
500 cc mil/100in 2 /day<br />
Carbon Dioxide<br />
2700 cc mil/100in 2 /day<br />
No permeability values were found for methane. However, three containers were filled with CO 2 , CH 4 , and air<br />
and monitored for about two weeks. The container <strong>of</strong> CO 2 shrank to approximately half <strong>of</strong> the original volume,<br />
the container <strong>of</strong> air did not change volume appreciably, and the container <strong>of</strong> CH 4 shrank 5-10%. This quick test<br />
suggests that CO 2 produced in the <strong>biogas</strong> might leave the container more rapidly than the N 2 or O 2 could enter<br />
the container. Because there was a several month time span between the completion <strong>of</strong> the experiment and the<br />
time <strong>of</strong> analysis <strong>of</strong> the gas concentrations, it was reasoned that diffusion through the LDPE affected the original<br />
<strong>biogas</strong> concentrations. Because significant O 2 probably entered the containers during the experiment, the<br />
<strong>biogas</strong> <strong>production</strong> rates are questionable. For these reasons, a third experiment was performed <strong>using</strong> 1,000 ml<br />
Nalgene containers that were less permeable to gas diffusion.<br />
Experiment 3<br />
The results <strong>of</strong> Experiment 3 are plotted in Figures 10a-10e.. As each container filled with gas, it was removed,<br />
and sealed with a screw-on cap. Some <strong>of</strong> the samples were not analyzed immediately, and the results showed<br />
increased N 2 <strong>content</strong> and very little or no CH 4 <strong>content</strong> (Table 3). These results appear to be the result <strong>of</strong><br />
http://www.westbioenergy.org/cattle/results.htm (1 <strong>of</strong> 15) [3/26/2003 8:52:57 AM]
Results and Discussion<br />
diffusion through the threads used to seal the cap onto the container. Samples analyzed immediately after<br />
removal from the water had the highest methane <strong>content</strong>s.<br />
Total <strong>biogas</strong> volumes for Experiment 3 were variable within the same <strong>moisture</strong> <strong>content</strong> (Figures 10a-10e and<br />
Table 3). In an experiment comparing <strong>biogas</strong> <strong>production</strong> between dry and fresh dairy manure, Chen et al.<br />
(1988) found that varying levels <strong>of</strong> methane were produced because <strong>of</strong> microbial variations. This is supported<br />
by Hashimoto et al. (1981) who stated that the degree <strong>of</strong> contamination by inorganics also affect ultimate<br />
methane yields (B 0 ). The <strong>biogas</strong> <strong>production</strong> volumes for Experiments 1 and 2 are significantly <strong>low</strong>er than<br />
previously published values for beef cattle manure (Safley et al., 1992). Safley states that B 0 should be<br />
approximately 0.33 m 3 /kg VS. As expected, <strong>production</strong> volumes increased as <strong>moisture</strong> <strong>content</strong> increased, with<br />
minimal <strong>production</strong> be<strong>low</strong> 40% <strong>moisture</strong> <strong>content</strong> for both Experiment 1 and Experiment 2. As shown in Table 1,<br />
there were no statistically significant differences in mean <strong>biogas</strong> <strong>production</strong> rates among the first five <strong>moisture</strong><br />
<strong>content</strong>s, but mean <strong>biogas</strong> <strong>production</strong> rates were significantly higher for the two highest <strong>moisture</strong> <strong>content</strong>s for<br />
Experiment 1.<br />
Field Demonstration Project<br />
The first cell began <strong>biogas</strong> <strong>production</strong> on August 1, 1999, and ceased quickly on October 23, 1999. During the<br />
12 week period, the first cell produced a total <strong>of</strong> about 1,500 m 3 (53,000 ft 3 ) <strong>of</strong> <strong>biogas</strong> with a maximum<br />
methane concentration <strong>of</strong> 52%. This was considerably less than was produced in the laboratory experiment 3,<br />
thus we believe that all <strong>of</strong> the volatile solids have not been expended, and <strong>biogas</strong> <strong>production</strong> should occur<br />
again during the summer 2000 as soon as the temperature is warm enough.<br />
Biogas <strong>production</strong> volumes and methane concentrations are shown in Table 4 and plotted in Figure 11. A<br />
photograph <strong>of</strong> the <strong>biogas</strong> cell when it was full <strong>of</strong> <strong>biogas</strong> is shown in Figure 12.<br />
Shown in Figure 13 is the temperature <strong>of</strong> the manure within cell no. 1 since it was loaded in January, 1999.<br />
Initially the manure temperature was about 25° C (77° F), but temperatures dropped rapidly during the first<br />
month as the manure became anaerobic. Temperatures began rising during the summer months, a result <strong>of</strong><br />
warmer ambient temperatures, and peaked around the first <strong>of</strong> August at 22.4° C (72° F). The manure<br />
temperature dropped be<strong>low</strong> 15° C (59° F) in the middle <strong>of</strong> October and has remained be<strong>low</strong> 15° C until the<br />
present (May, 2000). The pH <strong>of</strong> the manure in cell 1 was tested immediately after cessation <strong>of</strong> <strong>biogas</strong><br />
<strong>production</strong>. The pH <strong>of</strong> the three samples was 7.26, 6.98, and 7.00.<br />
The total volatile solids in cell 1 was 1.55 x 10 7 g. The total volume <strong>of</strong> <strong>biogas</strong> produced in cell 1 was 1.51x 10 6 L<br />
for the 12 weeks <strong>of</strong> <strong>production</strong>, which equates to a <strong>biogas</strong> <strong>production</strong> rate <strong>of</strong> 0.10 L/g VS.<br />
http://www.westbioenergy.org/cattle/results.htm (2 <strong>of</strong> 15) [3/26/2003 8:52:58 AM]
Results and Discussion<br />
Figure 8a. Experiment 1, Control Moisture.<br />
Figure 8b. Experiment 1, 20% Moisture.<br />
http://www.westbioenergy.org/cattle/results.htm (3 <strong>of</strong> 15) [3/26/2003 8:52:58 AM]
Results and Discussion<br />
Figure 8c. Experiment 1, 25% Moisture.<br />
Figure 8d. Experiment 1, 30% Moisture.<br />
http://www.westbioenergy.org/cattle/results.htm (4 <strong>of</strong> 15) [3/26/2003 8:52:58 AM]
Results and Discussion<br />
Figure 8e. Experiment 1, 40% Moisture.<br />
Figure 8f. Experiment 1, 50% Moisture.<br />
Figure 8g. Experiment 1, 75% Moisture.<br />
http://www.westbioenergy.org/cattle/results.htm (5 <strong>of</strong> 15) [3/26/2003 8:52:58 AM]
Results and Discussion<br />
Figure 9a. Experiment 2, 35% Moisture.<br />
Figure 9b. Experiment 2, 50% Moisture.<br />
http://www.westbioenergy.org/cattle/results.htm (6 <strong>of</strong> 15) [3/26/2003 8:52:58 AM]
Results and Discussion<br />
Figure 9c. Experiment 2, 57.5% Moisture.<br />
Figure 9d. Experiment 2, 65% Moisture.<br />
Figure 9e. Experiment 2, 72.5% Moisture.<br />
http://www.westbioenergy.org/cattle/results.htm (7 <strong>of</strong> 15) [3/26/2003 8:52:58 AM]
Results and Discussion<br />
Figure 9f. Experiment 2, 80% Moisture.<br />
Figure 10a. Experiment 3, 50% Moisture.<br />
http://www.westbioenergy.org/cattle/results.htm (8 <strong>of</strong> 15) [3/26/2003 8:52:58 AM]
Results and Discussion<br />
Figure 10b. Experiment 3, 60% Moisture.<br />
Figure 10c. Experiment 3, 70% Moisture.<br />
http://www.westbioenergy.org/cattle/results.htm (9 <strong>of</strong> 15) [3/26/2003 8:52:58 AM]
Results and Discussion<br />
Figure 10d. Experiment 3, 80% Moisture.<br />
Figure 10e. Experiment 3, 95% Moisture.<br />
Figure 11. Biogas <strong>production</strong> rates measured in cell no. 1.<br />
http://www.westbioenergy.org/cattle/results.htm (10 <strong>of</strong> 15) [3/26/2003 8:52:58 AM]
Results and Discussion<br />
Figure 12. Photograph <strong>of</strong> cell no. 1 showing the full dome <strong>of</strong> <strong>biogas</strong><br />
produced from anaerobic digestion <strong>of</strong> beef cattle manure. The<br />
dome holds about 71 m 3 (2,500 ft 3 ) <strong>of</strong> <strong>biogas</strong> when full.<br />
http://www.westbioenergy.org/cattle/results.htm (11 <strong>of</strong> 15) [3/26/2003 8:52:58 AM]
Results and Discussion<br />
Figure 13. Temperature <strong>of</strong> manure in Cell No. 1.<br />
Temperature was less than 15° C between 10/27/99 and 5/15/00.<br />
Treatment (%<br />
Moisture)<br />
Table 1. Biogas <strong>production</strong> rates and other gas concentrations for<br />
Experiment 1, conducted <strong>using</strong> LDPE containers at 21° C (70° F).<br />
Biogas Production Rate Gas Concentrations (%)<br />
Mean<br />
(L/g VS)*<br />
St. Dev.<br />
Nitrogen<br />
(N 2 ) %<br />
Methane<br />
(CH 4 ) %<br />
Carbon Dioxide<br />
( CO 2 ) %<br />
Water<br />
(H 2 O) %<br />
Control<br />
Moisture<br />
20% Moisture<br />
Content<br />
25% Moisture<br />
Content<br />
30% Moisture<br />
Content<br />
40% Moisture<br />
Content<br />
50% Moisture<br />
Content<br />
75% Moisture<br />
Content<br />
1.28 E-03 a 7.155 E-04 84.5 0 13.5 2<br />
1.28 E-03 a 7.155 E-04 86 0 12.5 2<br />
1.28 E-03 a 7.155 E-04 79 0 18 3<br />
9.60 E-04 a 1.431 E-03 83 .75 14.4 1.6<br />
1.60 E-03 ab 2.263 E-03 76 6 16 2<br />
3.52 E-03 b 7.155 E-04 68 14 16 2<br />
3.87 E-02 c 2.629 E-03 61.5 20 15.7 2<br />
http://www.westbioenergy.org/cattle/results.htm (12 <strong>of</strong> 15) [3/26/2003 8:52:58 AM]
Results and Discussion<br />
* Using LSD comparisons, mean <strong>biogas</strong> <strong>production</strong> rates with same letters are not significantly<br />
different (α =0.05).<br />
Table 2. Biogas <strong>production</strong> rates and other gas concentrations for Experiment 2,<br />
conducted <strong>using</strong> LDPE containers at 35° C (95° F).<br />
Treatment (%<br />
Moisture)<br />
Biogas Production Rate Gas Concentrations (%)<br />
Mean (L/g<br />
VS)*<br />
St. Dev. Nitrogen (N 2 )<br />
%<br />
Methane<br />
(CH 4 ) %<br />
Carbon Dioxide<br />
(CO 2 ) %<br />
Water (H 2 O)<br />
%<br />
35% Moisture<br />
Content<br />
50% Moisture<br />
Content<br />
0.00 a 0..00 NA 4.5 NA NA<br />
1.248 E-02 b 3.03 E-03 NA BD NA NA<br />
57.5% Moisture<br />
Content<br />
65% Moisture<br />
Content<br />
1.920 E-02<br />
bc<br />
2.848 E-02<br />
cd<br />
4.80 E-03 NA BD NA NA<br />
6.34 E-03 NA 3.14 NA NA<br />
72.5% Moisture<br />
Content<br />
80% Moisture<br />
Content<br />
3.64 E-02 d 1.55 E-02 NA .23 NA NA<br />
4.80 E-02 e 4.66 E-03 NA 2.97 NA NA<br />
NA=not analyzed BD=be<strong>low</strong> detection limit<br />
* Using LSD comparisons, mean <strong>biogas</strong> <strong>production</strong> rates with same letters are not significantly<br />
different (α =0.05).<br />
Table 3. Biogas Production Rate and other gas concentrations for Experiment 3.<br />
Treatment (%<br />
Moisture)<br />
Biogas Production Rate Mean Gas Concentrations (%)<br />
Mean (L/g<br />
VS) *<br />
St. Dev. Nitrogen (N 2 )<br />
%<br />
Methane<br />
(CH 4 ) %<br />
Carbon Dioxide<br />
(CO 2 ) %<br />
Water (H 2 O)<br />
%<br />
50% Moisture<br />
Content<br />
60% Moisture<br />
Content<br />
70% Moisture<br />
Content<br />
80% Moisture<br />
Content<br />
4.57 E-03 a 3.98 E-03 67.85 6.57 23.6 2.47<br />
1.15 E-01 b 3.97 E-02 7.68 58.93 28.45 4.96<br />
1.45 E-01 b 3.19 E-02 10.7 60.16 27.02 2.12<br />
1.33 E-01 b 8.83 E-03 11.67 52.48 32.85 3.0<br />
http://www.westbioenergy.org/cattle/results.htm (13 <strong>of</strong> 15) [3/26/2003 8:52:58 AM]
Results and Discussion<br />
95% Moisture<br />
Content<br />
3.47 E-02 a 3.03 E-02 38.4 52.8 7.20 1.56<br />
* Using LSD comparisons, mean <strong>biogas</strong> <strong>production</strong> rates with same letters are not significantly<br />
different (α =0.05).<br />
Table 4 Biogas Project Gas Production Log<br />
Wed, February 17, 1999 4:00 PM Covered manure with membrane<br />
Tue, August 3, 1999 10:00 AM Tent full first time<br />
Thur, August 5, 1999 3:00 PM Opened Vent 40% CH 4<br />
Fri, August 6, 1999 1:00 PM Plugged Vent<br />
Tue, August 10, 1999 3:00 PM Opened Vent 50% CH 4<br />
Wed, August 11, 1999 3:30 PM Plugged Vent<br />
Sun, August 15, 1999 8:00 AM Opened Vent 50% CH 4<br />
Sun, August 15, 1999 3:00 PM Plugged Vent<br />
Wed, August 18, 1999 3:00 PM Opened Vent<br />
Mon, August 23, 1999 2:00 PM Plugged Vent<br />
Thurs Aug 26, 1999 3:00 PM Opened Vent<br />
Tue Aug 31, 1999 3:00 PM Plugged Vent<br />
Fri Sept. 3, 1999 1:00 PM Opened Vent 52% CH 4<br />
Mon Sept 20 4:00 PM Plugged Vent<br />
Sat Sept 25 9:00 AM Opened Vent<br />
Wed Sept 29 2:00 PM Plugged Vent<br />
Mon Oct 4 12:00 PM Opened Vent<br />
Wed Oct 6, 1999 2:00 PM Plugged Vent<br />
Mon Oct. 11, 1999 Opened Vent 49% CH 4<br />
Wed Oct 13<br />
Plugged Vent<br />
Tue Oct 19 3:00 PM Opened Vent 52% CH 4<br />
Mon Oct 23 1:00 PM Plugged Vent<br />
No <strong>biogas</strong> produced between 10/23/99 and 5/15/2000<br />
http://www.westbioenergy.org/cattle/results.htm (14 <strong>of</strong> 15) [3/26/2003 8:52:58 AM]
Results and Discussion<br />
Back<br />
http://www.westbioenergy.org/cattle/results.htm (15 <strong>of</strong> 15) [3/26/2003 8:52:58 AM]
Conclusions<br />
CONCLUSIONS AND SUGGESTIONS FOR FURTHER ACTIVITIES<br />
Beef cattle feedlots in the Texas panhandle produce more than 6 million beef cattle annually, and the manure<br />
from these feedlots represents a tremendous <strong>biogas</strong> energy potential. This project utilized laboratory and field<br />
experiments to evaluate <strong>biogas</strong> <strong>production</strong> from beef cattle manure scraped from open lots. The field project<br />
evaluated <strong>using</strong> landfill-type cells for producing <strong>biogas</strong> from beef cattle manure. In laboratory experiments<br />
where <strong>low</strong> density polyethylene (LDPE) containers were used as mini digesters, we discovered that the<br />
containers were too permeable to gases to obtain representative <strong>biogas</strong> <strong>production</strong> rates. In modified<br />
experiments, <strong>biogas</strong> <strong>production</strong> rates reached a maximum <strong>of</strong> 0.14 liters per gram VS at a wet basis <strong>moisture</strong><br />
<strong>content</strong>s <strong>of</strong> 70%, which is <strong>low</strong>er than published values <strong>of</strong> about 0.3 liters per gram VS.<br />
In the field <strong>demonstration</strong> project, <strong>biogas</strong> was produced during a 12 week period in August through October. A<br />
total <strong>of</strong> 1,500 m 3 <strong>of</strong> <strong>biogas</strong> was produced at a rate <strong>of</strong> 0.10 liters per gram VS. While the results are promising,<br />
only producing <strong>biogas</strong> for 3 months out <strong>of</strong> the year severely limits the application <strong>of</strong> this method at beef cattle<br />
feedyards. A heated digester would produce <strong>biogas</strong> year-round, however, additional studies and engineering<br />
work are warranted to see if the landfill-cell method would be economically justifiable for use at beef cattle<br />
feedyards.<br />
REFERENCES<br />
Angelidaki, I. and B.K. Ahring. 1994 Anaerobic thermophilic digestion <strong>of</strong> manure at different ammonia leads:<br />
Effect <strong>of</strong> temperature. Water Research 28: 727-731.<br />
ASAE, 1999. Uniform terminology for rural waste management. ASAE Standard S292.5. American Society <strong>of</strong><br />
Agricultural Engineers, St. Joseph, MI.<br />
Engler, Cady R. and Marshall J. McFarland. 1997. Dairy manure digestion research and <strong>demonstration</strong> project.<br />
In Proceedings <strong>of</strong> Workshop #1, Livestock Waste Streams: Energy and Environment. pp. 64-68. Texas<br />
Renewable Energy Industries Association:Austin, TX.<br />
Hansen, Kaare Hvid, Irini Angelidaki and Birgitte Kiger Ahring. 1998. Anaerobic digestion <strong>of</strong> swine manures:<br />
inhibition by ammonia. Water Research 32:5-12.<br />
Kottwitz, D.A. and D.D. Schulte. 1982. Tumble-mix anaerobic digestion <strong>of</strong> dry beef manure. ASAE Paper<br />
Presented at the 1982 Winter Meeting, American Society <strong>of</strong> Agricultural Engineers, St. Joseph, MI.<br />
Misra, Upama, Sonjay Singh, Amarika Singh, and G.N. Pandey. 1992. A new temperature controlled digester<br />
for anaerobic digestion for <strong>biogas</strong> <strong>production</strong>. Energy Conservation Management 33:983-986.<br />
Nalgene, 1999. Physical properties <strong>of</strong> Nalgene Labware, Internet Source.<br />
Parker, D.B., B.W. Auvermann, B.A. Stewart and C.A. Robinson. 1997. Agricultural energy consumption,<br />
http://www.westbioenergy.org/cattle/conclusions.htm (1 <strong>of</strong> 2) [3/26/2003 8:52:58 AM]
Conclusions<br />
biomass generation, and livestock manure value in the Southern High Plains. In Proceedings <strong>of</strong> Workshop #1,<br />
Livestock Waste Streams: Energy and Environment. Texas Renewable Energy Industries Association:Austin,<br />
TX.<br />
Parker, D.B. and R.E. Smith. 1997. A roundtable discussion on energy <strong>production</strong> from livestock wastes. In<br />
Proceedings Livestock Waste Streams: Energy and Environment. Texas Renewable Energy Industries<br />
Association. Austin, TX. In Press.<br />
Schulte, D.D. 1997. Swine manure digestion systems. In Proceedings <strong>of</strong> Workshop #1, Livestock Waste<br />
Streams: Energy and Environment. pp.. 44-51. Texas Renewable Energy Industries Association:Austin, TX.<br />
SERI. 1995. Anaerobic digestion data base: Guide for operation and data analysis. Biomass Program Office,<br />
Solar Energy Research Institute. Golden, CO.<br />
SPS. 1996. Cattle-feeding Capitol <strong>of</strong> the World - 1996 Fed Cattle Survey. Southwestern Public Service<br />
Company, Amarillo, TX.<br />
Back<br />
http://www.westbioenergy.org/cattle/conclusions.htm (2 <strong>of</strong> 2) [3/26/2003 8:52:58 AM]
75% Moisture 50% Moisture 40% Moisture 30% Moisture 25% Moisture 20% Moisture Control Moisture<br />
Time (days) Volume (L) Vol. (t=0) (t=0)/50gVS Time (days) Volume (L) Vol. (t=0) (t=0)/50gVS Time (days) Volume (L) Vol. (t=0) (t=0)/50gVS Time (days) Volume (L) Vol. (t=0) (t=0)/50gVS Time (days) Volume (L) Vol. (t=0) (t=0)/50gVS Time (days) Volume (L) Vol. (t=0) (t=0)/50gVS Time (days) Volume (L) Vol. (t=0) (t=0)/50gVS<br />
0 0.4 0 0 0 0.48 0 0 0 0.48 0 0 0 0.56 0 0 0 0.48 0 0 0 0.48 0 0 0 0.4 0 0<br />
45 1.2 0.8 0.016 45 0.64 0.16 0.0032 45 0.48 0 0 45 0.56 0 0 45 0.56 0.08 0.0016 45 0.56 0.08 0.0016 45 0.48 0.08 0.0016<br />
55 2.32 1.92 0.0384 55 0.64 0.16 0.0032 55 0.48 0 0 55 0.56 0 0 55 0.56 0.08 0.0016 55 0.56 0.08 0.0016 55 0.48 0.08 0.0016<br />
70 2.4 2 0.04 70 0.64 0.16 0.0032 70 0.48 0 0 70 0.56 0 0 70 0.56 0.08 0.0016 70 0.56 0.08 0.0016 70 0.48 0.08 0.0016<br />
0 0.4 0 0 0 0.4 0 0 0 0.56 0 0 0 0.48 0 0 0 0.48 0 0 0 0.48 0 0 0 0.4 0 0<br />
45 1.04 0.64 0.0128 45 0.64 0.24 0.0048 45 0.56 0 0 45 0.56 0.08 0.0016 45 0.56 0.08 0.0016 45 0.56 0.08 0.0016 45 0.48 0.08 0.0016<br />
55 1.92 1.52 0.0304 55 0.64 0.24 0.0048 55 0.56 0 0 55 0.56 0.08 0.0016 55 0.56 0.08 0.0016 55 0.56 0.08 0.0016 55 0.48 0.08 0.0016<br />
70 2.24 1.84 0.0368 70 0.64 0.24 0.0048 70 0.56 0 0 70 0.56 0.08 0.0016 70 0.56 0.08 0.0016 70 0.56 0.08 0.0016 70 0.48 0.08 0.0016<br />
0 0.4 0 0 0 0.48 0 0 0 0.4 0 0 0 0.56 0 0 0 0.48 0 0 0 0.48 0 0 0 0.4 0 0<br />
45 1.04 0.64 0.0128 45 0.64 0.16 0.0032 45 0.64 0.24 0.0048 45 0.56 0 0 45 0.56 0.08 0.0016 45 0.56 0.08 0.0016 45 0.48 0.08 0.0016<br />
55 1.84 1.44 0.0288 55 0.64 0.16 0.0032 55 0.64 0.24 0.0048 55 0.56 0 0 55 0.56 0.08 0.0016 55 0.56 0.08 0.0016 55 0.48 0.08 0.0016<br />
70 2.16 1.76 0.0352 70 0.64 0.16 0.0032 70 0.64 0.24 0.0048 70 0.56 0 0 70 0.56 0.08 0.0016 70 0.56 0.08 0.0016 70 0.48 0.08 0.0016<br />
0 0.4 0 0 0 0.48 0 0 0 0.56 0 0 0 0.56 0 0 0 0.48 0 0 0 0.48 0 0 0 0.4 0 0<br />
45 1.04 0.64 0.0128 45 0.64 0.16 0.0032 45 0.56 0 0 45 0.56 0 0 45 0.56 0.08 0.0016 45 0.56 0.08 0.0016 45 0.4 0 0<br />
55 2.08 1.68 0.0336 55 0.64 0.16 0.0032 55 0.56 0 0 55 0.56 0 0 55 0.56 0.08 0.0016 55 0.56 0.08 0.0016 55 0.4 0 0<br />
70 2.4 2 0.04 70 0.64 0.16 0.0032 70 0.56 0 0 70 0.56 0 0 70 0.56 0.08 0.0016 70 0.56 0.08 0.0016 70 0.4 0 0<br />
0 0.4 0 0 0 0.4 0 0 0 0.4 0 0 0 0.48 0 0 0 0.56 0 0 0 0.56 0 0 0 0.4 0 0<br />
45 1.2 0.8 0.016 45 0.56 0.16 0.0032 45 0.56 0.16 0.0032 45 0.64 0.16 0.0032 45 0.56 0 0 45 0.56 0 0 45 0.48 0.08 0.0016<br />
55 2 1.6 0.032 55 0.56 0.16 0.0032 55 0.56 0.16 0.0032 55 0.64 0.16 0.0032 55 0.56 0 0 55 0.56 0 0 55 0.48 0.08 0.0016<br />
70 2.48 2.08 0.0416 70 0.56 0.16 0.0032 70 0.56 0.16 0.0032 70 0.64 0.16 0.0032 70 0.56 0 0 70 0.56 0 0 70 0.48 0.08 0.0016<br />
Mean 0.0214 0.0026 Mean 0.0012 0.0007 Mean 0.0010 0.0010 Mean 0.0010<br />
St. Dev. 0.0159 0.0017 St.Dev. 0.0019 0.0012 St. Dev. 0.0008 0.0008 St. Dev. 0.0008<br />
0.006<br />
40% Moisture<br />
0.005<br />
Production (L/g VS)<br />
0.004<br />
0.003<br />
0.002<br />
0.001<br />
Rep 1<br />
Rep 2<br />
Rep 3<br />
Rep 4<br />
Rep 5<br />
0<br />
0 20 40 60 80<br />
Time (days)<br />
0.06<br />
75% Moisture<br />
0.006<br />
25% Moisture<br />
Production (L/g VS)<br />
0.05<br />
0.04<br />
0.03<br />
0.02<br />
Rep 1<br />
Rep 2<br />
0.01<br />
Rep 3<br />
Rep 4<br />
0<br />
0 20<br />
Time<br />
40<br />
(days)<br />
60 80<br />
Rep 5<br />
Production (L/g VS)<br />
0.006<br />
0.005<br />
0.004<br />
0.003<br />
0.002<br />
0.001<br />
0<br />
30% Moisture<br />
0 20 40 60 80<br />
Time (days)<br />
Rep 1<br />
Rep 2<br />
Rep 3<br />
Rep 4<br />
Rep 5<br />
Production (L/g VS)<br />
0.005<br />
0.004<br />
0.003<br />
0.002<br />
0.001<br />
0<br />
0 20 40 60 80<br />
Time (days)<br />
Rep 1<br />
Rep 2<br />
Rep 3<br />
Rep 4<br />
Rep 5<br />
Production (L/g VS)<br />
0.006<br />
50% Moisture<br />
0.005<br />
0.004<br />
0.003<br />
0.002<br />
Rep 1<br />
Rep 2<br />
0.001<br />
Rep 3<br />
0<br />
Rep 4<br />
0 20 40 60 80Rep 5<br />
Time (days)<br />
Production (L/g VS)<br />
0.006<br />
0.005<br />
0.004<br />
0.003<br />
0.002<br />
0.001<br />
0<br />
20% Moisture<br />
0 20 40 60 80<br />
Time (days)<br />
Rep 1<br />
Rep 2<br />
Rep 3<br />
Rep 4<br />
Rep 5<br />
Production (L/g VS)<br />
0.006<br />
0.005<br />
0.004<br />
0.003<br />
0.002<br />
0.001<br />
0<br />
Control Moisture<br />
0 20 40 60 80<br />
Time (days)<br />
Rep 1<br />
Rep 2<br />
Rep 3<br />
Rep 4<br />
Rep 5
35% Moisture 50% Moisture 57.5% Moisture 65% Moisture 72.5% Moisture 80% Moisture<br />
Time (days) Volume (L) Vol. (t=0) (t=0)/50gVS Time (days) Volume (L) Vol. (t=0) (t=0)/50gVS Time (days) Volume (L) Vol. (t=0) (t=0)/50gVS Time (days) Volume (L) Vol. (t=0) (t=0)/50gVS Time (days) Volume (L) Vol. (t=0) (t=0)/50gVS Time (days) Volume (L) Vol. (t=0) (t=0)/50gVS<br />
0 0.48 0 0 0 0.56 0 0 0 0.48 0 0 0 0.48 0 0 0 0.64 0 0 0 0.64 0 0<br />
7 0.48 0 0 7 0.56 0 0 7 0.48 0 0 7 0.48 0 0 7 0.64 0 0 7 0.64 0 0<br />
14 0.48 0 0 14 0.56 0 0 14 0.48 0 0 14 0.56 0.08 0.0016 14 0.72 0.08 0.0016 14 1.36 0.72 0.0144<br />
21 0.48 0 0 21 0.56 0 0 21 0.48 0 0 21 1.04 0.56 0.0112 21 1.6 0.96 0.0192 21 2.72 2.08 0.0416<br />
28 0.48 0 0 28 0.72 0.16 0.0032 28 0.96 0.48 0.0096 28 1.28 0.8 0.016 28 2.4 1.76 0.0352 28 2.88 2.24 0.0448<br />
35 0.48 0 0 35 1.04 0.48 0.0096 35 1.04 0.56 0.0112 35 1.68 1.2 0.024 35 2.56 1.92 0.0384 35 3.04 2.4 0.048<br />
44 0.48 0 0 44 1.04 0.48 0.0096 44 1.04 0.56 0.0112 44 2.08 1.6 0.032 44 2.72 2.08 0.0416 44 3.04 2.4 0.048<br />
0 0.48 0 0 0 0.56 0 0 0 0.56 0 0 0 0.48 0 0 0 0.64 0 0 0 0.72 0 0<br />
7 0.48 0 0 7 0.56 0 0 7 0.56 0 0 7 0.56 0.08 0.0016 7 0.64 0 0 7 0.72 0 0<br />
14 0.48 0 0 14 0.56 0 0 14 0.56 0 0 14 0.64 0.16 0.0032 14 0.8 0.16 0.0032 14 1.6 0.88 0.0176<br />
21 0.48 0 0 21 0.56 0 0 21 0.56 0 0 21 1.04 0.56 0.0112 21 1.2 0.56 0.0112 21 2.72 2 0.04<br />
28 0.48 0 0 28 0.8 0.24 0.0048 28 1.28 0.72 0.0144 28 1.12 0.64 0.0128 28 1.2 0.56 0.0112 28 2.8 2.08 0.0416<br />
35 0.48 0 0 35 1.04 0.48 0.0096 35 1.6 1.04 0.0208 35 1.36 0.88 0.0176 35 1.2 0.56 0.0112 35 2.88 2.16 0.0432<br />
44 0.48 0 0 44 1.04 0.48 0.0096 44 1.6 1.04 0.0208 44 1.52 1.04 0.0208 44 1.2 0.56 0.0112 44 3.04 2.32 0.0464<br />
0 0.64 0 0 0 0.52 0 0 0 0.56 0 0 0 0.48 0 0 0 0.64 0 0 0 0.72 0 0<br />
7 0.64 0 0 7 0.52 0 0 7 0.56 0 0 7 0.48 0 0 7 0.64 0 0 7 0.8 0.08 0.0016<br />
14 0.64 0 0 14 0.52 0 0 14 0.56 0 0 14 0.64 0.16 0.0032 14 0.8 0.16 0.0032 14 1.04 0.32 0.0064<br />
21 0.64 0 0 21 0.52 0 0 21 0.56 0 0 21 1.04 0.56 0.0112 21 2 1.36 0.0272 21 2.56 1.84 0.0368<br />
28 0.64 0 0 28 0.8 0.28 0.0056 28 0.88 0.32 0.0064 28 1.2 0.72 0.0144 28 2.48 1.84 0.0368 28 2.96 2.24 0.0448<br />
35 0.64 0 0 35 1.12 0.6 0.012 35 1.44 0.88 0.0176 35 1.52 1.04 0.0208 35 2.56 1.92 0.0384 35 3.44 2.72 0.0544<br />
44 0.64 0 0 44 1.12 0.6 0.012 44 1.76 1.2 0.024 44 1.6 1.12 0.0224 44 2.56 1.92 0.0384 44 3.52 2.8 0.056<br />
0 0.4 0 0 0 0.48 0 0 0 0.56 0 0 0 0.4 0 0 0 0.64 0 0 0 0.64 0 0<br />
7 0.4 0 0 7 0.48 0 0 7 0.56 0 0 7 0.48 0.08 0.0016 7 0.64 0 0 7 0.64 0 0<br />
14 0.4 0 0 14 0.48 0 0 14 0.56 0 0 14 0.48 0.08 0.0016 14 0.64 0 0 14 0.8 0.16 0.0032<br />
21 0.4 0 0 21 0.48 0 0 21 0.56 0 0 21 0.88 0.48 0.0096 21 1.44 0.8 0.016 21 1.92 1.28 0.0256<br />
28 0.4 0 0 28 0.8 0.32 0.0064 28 0.8 0.24 0.0048 28 1.12 0.72 0.0144 28 2.56 1.92 0.0384 28 2.32 1.68 0.0336<br />
35 0.4 0 0 35 1.28 0.8 0.016 35 1.6 1.04 0.0208 35 1.84 1.44 0.0288 35 3.2 2.56 0.0512 35 2.88 2.24 0.0448<br />
44 0.4 0 0 44 1.28 0.8 0.016 44 1.6 1.04 0.0208 44 2.08 1.68 0.0336 44 3.28 2.64 0.0528 44 2.88 2.24 0.0448<br />
0 0.48 0 0 0 0.44 0 0 0 0.56 0 0 0 0.4 0 0 0 0.56 0 0 0 0.64 0 0<br />
7 0.48 0 0 7 0.44 0 0 7 0.56 0 0 7 0.48 0.08 0.0016 7 0.56 0 0 7 0.72 0.08 0.0016<br />
14 0.48 0 0 14 0.44 0 0 14 0.56 0 0 14 0.48 0.08 0.0016 14 0.56 0 0 14 0.72 0.08 0.0016<br />
21 0.48 0 0 21 0.44 0 0 21 0.56 0 0 21 0.8 0.4 0.008 21 1.44 0.88 0.0176 21 1.36 0.72 0.0144<br />
28 0.48 0 0 28 0.64 0.2 0.004 28 0.72 0.16 0.0032 28 1.44 1.04 0.0208 28 2.4 1.84 0.0368 28 2.4 1.76 0.0352<br />
35 0.48 0 0 35 0.96 0.52 0.0104 35 1.04 0.48 0.0096 35 1.92 1.52 0.0304 35 2.64 2.08 0.0416 35 2.88 2.24 0.0448<br />
44 0.48 0 0 44 1.2 0.76 0.0152 44 1.52 0.96 0.0192 44 2.08 1.68 0.0336 44 2.64 2.08 0.0416 44 2.88 2.24 0.0448<br />
Mean 0.0000 0.0041 Mean 0.0061 0.0117 Mean 0.0178 0.0251<br />
St. Dev. 0.0000 0.0055 St. Dev. 0.0084 0.0113 St. Dev. 0.0184 0.0209<br />
0.06<br />
57.5% Moisture Experiment 2<br />
0.06<br />
35% Moisture Experiment 2<br />
0.05<br />
Production (L/gVS)<br />
0.05<br />
0.04<br />
0.03<br />
0.02<br />
Rep 1<br />
Rep 2<br />
Rep 3<br />
Rep 4<br />
Rep 5<br />
Production (L/gVS)<br />
0.04<br />
0.03<br />
0.02<br />
0.01<br />
Rep 1<br />
Rep 2<br />
Rep 3<br />
Rep 4<br />
Rep 5<br />
0.01<br />
0<br />
0 20 40 60 80<br />
Time (days)<br />
0<br />
0 20 40 60 80<br />
Time (days)<br />
0.06<br />
65% Moisture Experiment 2<br />
Production (L/gVS)<br />
0.06<br />
0.05<br />
0.04<br />
0.03<br />
0.02<br />
50% Moisture Experiment 2<br />
Rep 1<br />
Rep 2<br />
Rep 3<br />
Rep 4<br />
Rep 5<br />
Production (L/gVS)<br />
0.05<br />
0.04<br />
0.03<br />
0.02<br />
0.01<br />
0<br />
0 20 40 60 80<br />
Time (days)<br />
Rep 1<br />
Rep 2<br />
Rep 3<br />
Rep 4<br />
Rep 5<br />
0.01<br />
0<br />
0 20 40 60 80<br />
Time (days)
Experiment 3<br />
50%Moisture 60% Moisture 70% Moisture 80% Moisture 95% Moisture<br />
Time (days) Vol (t=0) (L) (t=0)/21.9gVS Time (days) Vol (t=0) (L) (t=0)/20.7gVS Time (days) Vol (t=0) (L) (t=0)/15.4gVS Time (days) Vol (t=0) (L) (t=0)/11.6gVS Time (days) Vol (t=0) (L) (t=0)/2.5gVS<br />
0 0.0000 0.0000 0 0.0000 0.0000 0 0.0000 0.0000 0 0.0000 0.0000 0 0.0000 0.0000<br />
46 0.0800 0.0037 46 0.0200 0.0010 46 0.0100 0.0006 46 0.0200 0.0017 46 0.1100 0.0440<br />
57 0.1000 0.0046 57 0.0200 0.0010 57 0.0200 0.0013 57 0.0200 0.0017 57 0.1300 0.0520<br />
66 0.1000 0.0046 66 0.0200 0.0010 66 0.1300 0.0084 66 0.0200 0.0017 66 0.1400 0.0560<br />
80 0.1000 0.0046 80 0.0200 0.0010 80 0.4400 0.0286 80 0.0200 0.0017 80 0.1400 0.0560<br />
92 0.1000 0.0046 92 0.0200 0.0010 92 0.9000 0.0584 92 0.0200 0.0017 92 0.1400 0.0560<br />
104 0.1000 0.0046 104 0.0400 0.0019 104 1.1600 0.0753 104 0.0900 0.0078 104 0.1400 0.0560<br />
113 0.1000 0.0046 113 0.0400 0.0019 113 1.2000 0.0779 113 0.1400 0.0121 113 0.1400 0.0560<br />
125 0.1400 0.0064 125 0.0400 0.0019 125 1.3600 0.0883 125 0.1400 0.0121 125 0.1400 0.0560<br />
134 0.1400 0.0064 134 0.1000 0.0048 134 1.5000 0.0974 134 0.1600 0.0138 134 0.1400 0.0560<br />
139 0.1400 0.0064 139 0.1200 0.0058 139 1.5400 0.1000 139 0.3000 0.0259 139 0.1400 0.0560<br />
143 0.1600 0.0073 143 0.1600 0.0077 143 1.6000 0.1039 143 0.4400 0.0379 143 0.1400 0.0560<br />
155 0.1600 0.0073 155 0.2600 0.0126 155 1.6400 0.1065 155 0.5800 0.0500 155 0.1400 0.0560<br />
161 0.1600 0.0073 161 0.3600 0.0174 161 1.6800 0.1091 161 0.6000 0.0517 161 0.1400 0.0560<br />
182 0.1600 0.0073 182 0.4200 0.0203 182 1.9000 0.1234 182 0.7800 0.0672 182 0.1400 0.0560<br />
196 0.1600 0.0073 196 0.7200 0.0348 196 1.9800 0.1286 196 0.8600 0.0741 196 0.1400 0.0560<br />
206 0.1600 0.0073 206 0.8600 0.0415 206 2.1800 0.1416 206 1.0200 0.0879 206 0.1400 0.0560<br />
218 0.1600 0.0073 218 1.0600 0.0512 218 2.3000 0.1494 218 1.1600 0.1000 218 0.1400 0.0560<br />
232 0.1600 0.0073 232 1.2600 0.0609 232 2.4800 0.1610 232 1.3000 0.1121 232 0.1400 0.0560<br />
246 0.1600 0.0073 246 1.6600 0.0802 246 2.7000 0.1753 246 1.5200 0.1310 246 0.1400 0.0560<br />
0 0.0000 0.0000 0 0.0000 0.0000 0 0.0000 0.0000 0 0.0000 0.0000 0 0.0000 0.0000<br />
46 0.0500 0.0023 46 0.0100 0.0005 46 0.0400 0.0026 46 0.0000 0.0000 46 0.0400 0.0160<br />
57 0.0500 0.0023 57 0.0100 0.0005 57 0.0600 0.0039 57 0.0300 0.0026 57 0.0600 0.0240<br />
66 0.0500 0.0023 66 0.0200 0.0010 66 0.0700 0.0045 66 0.2600 0.0224 66 0.0700 0.0280<br />
80 0.0500 0.0023 80 0.1800 0.0087 80 0.1000 0.0065 80 0.5800 0.0500 80 0.1000 0.0400<br />
92 0.0600 0.0027 92 0.5200 0.0251 92 0.1800 0.0117 92 0.7600 0.0655 92 0.1000 0.0400<br />
104 0.0600 0.0027 104 1.0000 0.0483 104 0.3800 0.0247 104 0.7800 0.0672 104 0.1000 0.0400<br />
113 0.0600 0.0027 113 1.0100 0.0488 113 0.5600 0.0364 113 0.8200 0.0707 113 0.1000 0.0400<br />
125 0.1200 0.0055 125 1.2700 0.0614 125 0.8000 0.0519 125 0.9200 0.0793 125 0.1000 0.0400<br />
134 0.1400 0.0064 134 1.3900 0.0671 134 0.8600 0.0558 134 1.0200 0.0879 134 0.1000 0.0400<br />
139 0.1400 0.0064 139 1.4700 0.0710 139 1.1200 0.0727 139 1.0600 0.0914 139 0.1000 0.0400<br />
143 0.1400 0.0064 143 1.5300 0.0739 143 1.1800 0.0766 143 1.0600 0.0914 143 0.1000 0.0400<br />
155 0.1400 0.0064 155 1.5700 0.0758 155 1.1800 0.0766 155 1.1600 0.1000 155 0.1200 0.0480<br />
161 0.1400 0.0064 161 1.6300 0.0787 161 1.2600 0.0818 161 1.2200 0.1052 161 0.1200 0.0480<br />
182 0.1400 0.0064 182 1.9300 0.0932 182 1.5200 0.0987 182 1.3200 0.1138 182 0.1200 0.0480<br />
196 0.1400 0.0064 196 2.7300 0.1319 196 1.5600 0.1013 196 1.3600 0.1172 196 0.1200 0.0480<br />
206 0.1400 0.0064 206 2.9500 0.1425 206 1.6200 0.1052 206 1.3800 0.1190 206 0.1200 0.0480<br />
218 0.1400 0.0064 218 3.1100 0.1502 218 1.8200 0.1182 218 1.4400 0.1241 218 0.1200 0.0480<br />
232 0.1400 0.0064 232 3.1900 0.1541 232 2.0000 0.1299 232 1.5200 0.1310 232 0.1200 0.0480<br />
246 0.1400 0.0064 246 3.2700 0.1580 246 2.2600 0.1468 246 1.6600 0.1431 246 0.1200 0.0480<br />
0 0.0000 0.0000 0 0.0000 0.0000 0 0.0000 0.0000 0 0.0000 0.0000 0 0.0000 0.0000<br />
46 0.0000 0.0000 46 0.0100 0.0005 46 0.0000 0.0000 46 0.0700 0.0060 46 0.0000 0.0000<br />
57 0.0000 0.0000 57 0.0100 0.0005 57 0.2000 0.0130 57 0.3000 0.0259 57 0.0000 0.0000<br />
66 0.0000 0.0000 66 0.0200 0.0010 66 0.1100 0.0071 66 0.5000 0.0431 66 0.0000 0.0000<br />
80 0.0000 0.0000 80 0.0200 0.0010 80 0.1400 0.0091 80 0.7400 0.0638 80 0.0000 0.0000<br />
92 0.0000 0.0000 92 0.0200 0.0010 92 0.4600 0.0299 92 0.8000 0.0690 92 0.0000 0.0000<br />
104 0.0000 0.0000 104 0.0400 0.0019 104 0.6200 0.0403 104 0.8400 0.0724 104 0.0000 0.0000<br />
113 0.0000 0.0000 113 0.0600 0.0029 113 0.6800 0.0442 113 0.8400 0.0724 113 0.0000 0.0000<br />
125 0.0000 0.0000 125 0.1800 0.0087 125 0.8200 0.0532 125 0.9600 0.0828 125 0.0000 0.0000<br />
134 0.0000 0.0000 134 0.2600 0.0126 134 0.8400 0.0545 134 1.0000 0.0862 134 0.0000 0.0000<br />
139 0.0000 0.0000 139 0.3200 0.0155 139 0.8600 0.0558 139 1.0400 0.0897 139 0.0000 0.0000<br />
143 0.0000 0.0000 143 0.3700 0.0179 143 0.8600 0.0558 143 1.0400 0.0897 143 0.0000 0.0000<br />
155 0.0000 0.0000 155 0.6300 0.0304 155 0.9000 0.0584 155 1.1000 0.0948 155 0.0000 0.0000<br />
161 0.0000 0.0000 161 0.8600 0.0415 161 0.9400 0.0610 161 1.1600 0.1000 161 0.0000 0.0000<br />
182 0.0000 0.0000 182 1.3200 0.0638 182 1.1200 0.0727 182 1.2600 0.1086 182 0.0000 0.0000<br />
196 0.0000 0.0000 196 1.4400 0.0696 196 1.1400 0.0740 196 1.2800 0.1103 196 0.0000 0.0000<br />
206 0.0000 0.0000 206 1.6200 0.0783 206 1.2400 0.0805 206 1.3000 0.1121 206 0.0000 0.0000<br />
218 0.0000 0.0000 218 1.7200 0.0831 218 1.4200 0.0922 218 1.3200 0.1138 218 0.0000 0.0000<br />
232 0.0000 0.0000 232 2.0400 0.0986 232 1.5200 0.0987 232 1.4200 0.1224 232 0.0000 0.0000<br />
246 0.0000 0.0000 246 2.1800 0.1053 246 1.7200 0.1117 246 1.4600 0.1259 246 0.0000 0.0000<br />
Mean 0.0035 0.0395 Mean 0.0659 0.0660 Mean 0.0303<br />
St. Dev. 0.0030 0.0456 St. Dev. 0.0478 0.0446 St. Dev. 0.0246<br />
0.06<br />
80% Moisture Experiment 2<br />
0.2500<br />
50% Moisture Experiment 3<br />
Production (L/gVS)<br />
0.05<br />
0.04<br />
0.03<br />
0.02<br />
Rep 1<br />
Rep 2<br />
Rep 3<br />
Rep 4<br />
Rep 5<br />
Production (L/g VS)<br />
0.2000<br />
0.1500<br />
0.1000<br />
0.0500<br />
Rep 1<br />
Rep 2<br />
Rep 3<br />
0.01<br />
0<br />
0 20 40 60 80<br />
Time (days)<br />
0.0000<br />
0 50 100 150 200 250 300<br />
Time (days)<br />
0.06<br />
80% Moisture Experiment 2<br />
Production (L/gVS)<br />
0.06<br />
0.05<br />
0.04<br />
0.03<br />
0.02<br />
0.01<br />
72.5% Moisture Experiment 2<br />
Rep 1<br />
Rep 2<br />
Rep 3<br />
Rep 4<br />
Rep 5<br />
Production (L/gVS)<br />
0.05<br />
0.04<br />
0.03<br />
0.02<br />
0.01<br />
0<br />
0 20 40 60 80<br />
Time (days)<br />
Rep 1<br />
Rep 2<br />
Rep 3<br />
Rep 4<br />
Rep 5<br />
0<br />
0 20 40 60 80<br />
Time (days)
Volatile Solids (dry weight basis) Volatile Solids Daily Biogas Production for Field Experiment Pit No. I<br />
Experiment 1 Pit II Time (days) Production ft. 3 Production m 3<br />
1 2 3 4 5 Avg. 1 2 3 4 5 Avg. 7/28/99 0 0<br />
45% 49.20% 48.00% 49% 48.80% 48.00% 31.50% 42.60% 43.80% 45.30% 46.50% 41.94% 7/31/99 625 17.72<br />
8/1/99 625 17.72<br />
Experiment 2 8/2/99 625 17.72<br />
1 2 3 4 5 Avg. 8/3/99 625 17.72<br />
44% 45.30% 46.50% 32% 42.60% 41.94% Field Experiment Data 8/6/99 625 17.72<br />
Avg. Moisture Content <strong>of</strong> Manure in Pit II: 14.32% 8/7/99 625 17.72<br />
Experiment 3 8/8/99 625 17.72<br />
1 2 3 4 5 Avg. Desired Moisture Content <strong>of</strong> Manure/Water in Pit II: 60-65% 8/9/99 625 17.72<br />
30.62% 32.99% 32.02% 32.12% 32.32% 32.01% 8/10/99 625 17.72<br />
Density <strong>of</strong> Manure: .673g/cm cu. 8/12/99 625 17.72<br />
Pit I 8/13/99 625 17.72<br />
1 2 3 4 5 Avg. Weight <strong>of</strong> Water: 62.4 lbs./ ft. cu. 8/14/99 625 17.72<br />
30.62% 32.99% 32.02% 32.12% 32.32% 32.01% 8/15/99 625 17.72<br />
Weight <strong>of</strong> Manure: .673 x 62.4 = 42 lbs./ ft. cu. 8/15/99 833 23.61<br />
Field Experiment Data 8/16/99 833 23.61<br />
Avg. Moisture Content <strong>of</strong> Manure in Pit I: 20% Total Available Volume <strong>of</strong> Pit II: 3,200 ft. cu. 8/17/99 833 23.61<br />
8/18/99 833 23.61<br />
Desired Moisture Content <strong>of</strong> Manure/Water in Pit I: 60-65% Total Wet Weight <strong>of</strong> Manure in Pit II: 3,200 x 42 = 134,000 lbs. 8/23/99 833 23.61<br />
8/24/99 833 23.61<br />
Density <strong>of</strong> Manure: .673g/cm cu. Total Dry Weight <strong>of</strong> Solids in Pit II: 134,000 lbs x .1432 = 114,811lbs 8/25/99 833 23.61<br />
8/26/99 833 23.61<br />
Weight <strong>of</strong> Water: 62.4 lbs./ ft. cu. Total Weight <strong>of</strong> Volatile Solids in Pit II: 114,811 x 41.94% = 48,151 lbs 8/31/99 833 23.61<br />
9/1/99 833 23.61<br />
Weight <strong>of</strong> Manure: .673 x 62.4 = 42 lbs./ ft. cu. Grams <strong>of</strong> Voltatile Solids = 48,151 lbs / 2.2(lbs/Kg) = 21,887 Kg x 1000 = 21,887,000 g 9/2/99 833 23.61<br />
9/3/99 833 23.61<br />
Total Available Volume <strong>of</strong> Pit I: 3,200 ft. cu. 9/20/99 833 23.61<br />
9/21/99 500 14.17<br />
Total Wet Weight <strong>of</strong> Manure in Pit I: 3,200 x 42 = 134,000 lbs. 9/22/99 500 14.17<br />
9/23/99 500 14.17<br />
Total Dry Weight <strong>of</strong> Solids in Pit I: 134,000 lbs x .20 = 107,000lbs 9/24/99 500 14.17<br />
9/25/99 500 14.17<br />
Total Weight <strong>of</strong> Volatile Solids in Pit I: 107,000 x 32.01% = 34,250 lbs 9/29/99 500 14.17<br />
9/30/99 500 14.17<br />
Grams <strong>of</strong> Voltatile Solids = 34,250 lbs / 2.2(lbs/Kg) = 15,569 Kg x 1000 = 15,569,000 g 10/1/99 500 14.17<br />
10/2/99 500 14.17<br />
Total <strong>biogas</strong> Production for Pit I: 25,000 ft. cu. 10/3/99 500 14.17<br />
10/4/99 500 14.17<br />
35.28 ft. cu. = 1 m cu. 10/6/99 500 14.17<br />
10/7/99 500 14.17<br />
25,000 ft. cu. / 35.28 = 708.6 m cu. 10/8/99 500 14.17<br />
10/9/99 500 14.17<br />
1,000 L = 1 m cu. 708.6 x 1,000 = 708,600 L 10/10/99 500 14.17<br />
10/11/99 500 14.17<br />
708,600 L / 20,400,000 VS = .03474 L / g VS 10/13/99 500 14.17<br />
g<br />
10/14/99 416 11.79<br />
10/15/99 416 11.79<br />
10/16/99 416 11.79<br />
10/17/99 416 11.79<br />
10/18/99 416 11.79<br />
10/19/99 416 11.79<br />
10/23/99 0 0.00<br />
0.2500<br />
60% Moisture Experiment 3<br />
0.2500<br />
80% Moisture Experiment 3<br />
Production (L/g VS)<br />
0.2000<br />
0.1500<br />
0.1000<br />
0.0500<br />
Rep 1<br />
Rep 2<br />
Rep 3<br />
Production (L/g VS)<br />
0.2000<br />
0.1500<br />
0.1000<br />
0.0500<br />
Rep 1<br />
Rep 2<br />
Rep 3<br />
25<br />
22.5<br />
Field Experiment (Pit 1)<br />
0.0000<br />
Production (L/g VS)<br />
0.2500<br />
0.2000<br />
0.1500<br />
0.1000<br />
0.0500<br />
0 50 100 150 200 250 300<br />
Time (days)<br />
70% Moisture Experiment 3<br />
Rep 1<br />
Rep 2<br />
Rep 3<br />
0.0000<br />
Production (L/g VS)<br />
0.2500<br />
0.2000<br />
0.1500<br />
0.1000<br />
0.0500<br />
0 50 100 150 200 250 300<br />
Time (days)<br />
95% Moisture Experiment 3<br />
Rep 1<br />
Rep 2<br />
Rep 3<br />
Production (m cu. / day)<br />
20<br />
17.5<br />
15<br />
12.5<br />
10<br />
7.5<br />
5<br />
2.5<br />
0<br />
7/19/99 8/8/99 8/28/99 9/17/99 10/7/99 10/27/99 11/16/99<br />
Time (days)<br />
0.0000<br />
0 50 100 150 200 250 300<br />
Time (days)<br />
0.0000<br />
0 50 100 150 200 250 300<br />
Time (days)