demonstration of biogas production using low moisture content
demonstration of biogas production using low moisture content
demonstration of biogas production using low moisture content
Create successful ePaper yourself
Turn your PDF publications into a flip-book with our unique Google optimized e-Paper software.
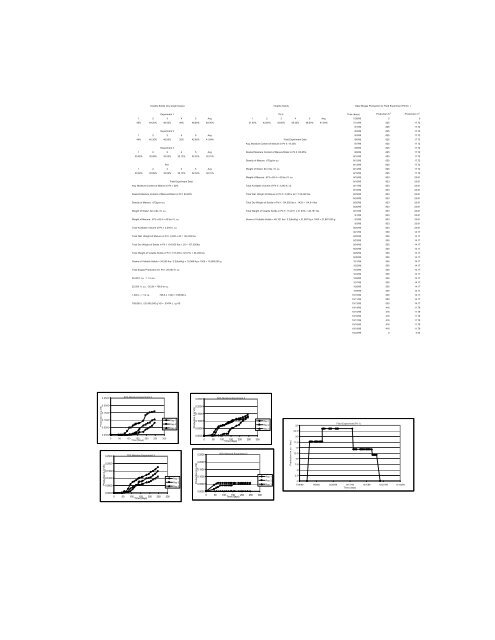
Volatile Solids (dry weight basis) Volatile Solids Daily Biogas Production for Field Experiment Pit No. I<br />
Experiment 1 Pit II Time (days) Production ft. 3 Production m 3<br />
1 2 3 4 5 Avg. 1 2 3 4 5 Avg. 7/28/99 0 0<br />
45% 49.20% 48.00% 49% 48.80% 48.00% 31.50% 42.60% 43.80% 45.30% 46.50% 41.94% 7/31/99 625 17.72<br />
8/1/99 625 17.72<br />
Experiment 2 8/2/99 625 17.72<br />
1 2 3 4 5 Avg. 8/3/99 625 17.72<br />
44% 45.30% 46.50% 32% 42.60% 41.94% Field Experiment Data 8/6/99 625 17.72<br />
Avg. Moisture Content <strong>of</strong> Manure in Pit II: 14.32% 8/7/99 625 17.72<br />
Experiment 3 8/8/99 625 17.72<br />
1 2 3 4 5 Avg. Desired Moisture Content <strong>of</strong> Manure/Water in Pit II: 60-65% 8/9/99 625 17.72<br />
30.62% 32.99% 32.02% 32.12% 32.32% 32.01% 8/10/99 625 17.72<br />
Density <strong>of</strong> Manure: .673g/cm cu. 8/12/99 625 17.72<br />
Pit I 8/13/99 625 17.72<br />
1 2 3 4 5 Avg. Weight <strong>of</strong> Water: 62.4 lbs./ ft. cu. 8/14/99 625 17.72<br />
30.62% 32.99% 32.02% 32.12% 32.32% 32.01% 8/15/99 625 17.72<br />
Weight <strong>of</strong> Manure: .673 x 62.4 = 42 lbs./ ft. cu. 8/15/99 833 23.61<br />
Field Experiment Data 8/16/99 833 23.61<br />
Avg. Moisture Content <strong>of</strong> Manure in Pit I: 20% Total Available Volume <strong>of</strong> Pit II: 3,200 ft. cu. 8/17/99 833 23.61<br />
8/18/99 833 23.61<br />
Desired Moisture Content <strong>of</strong> Manure/Water in Pit I: 60-65% Total Wet Weight <strong>of</strong> Manure in Pit II: 3,200 x 42 = 134,000 lbs. 8/23/99 833 23.61<br />
8/24/99 833 23.61<br />
Density <strong>of</strong> Manure: .673g/cm cu. Total Dry Weight <strong>of</strong> Solids in Pit II: 134,000 lbs x .1432 = 114,811lbs 8/25/99 833 23.61<br />
8/26/99 833 23.61<br />
Weight <strong>of</strong> Water: 62.4 lbs./ ft. cu. Total Weight <strong>of</strong> Volatile Solids in Pit II: 114,811 x 41.94% = 48,151 lbs 8/31/99 833 23.61<br />
9/1/99 833 23.61<br />
Weight <strong>of</strong> Manure: .673 x 62.4 = 42 lbs./ ft. cu. Grams <strong>of</strong> Voltatile Solids = 48,151 lbs / 2.2(lbs/Kg) = 21,887 Kg x 1000 = 21,887,000 g 9/2/99 833 23.61<br />
9/3/99 833 23.61<br />
Total Available Volume <strong>of</strong> Pit I: 3,200 ft. cu. 9/20/99 833 23.61<br />
9/21/99 500 14.17<br />
Total Wet Weight <strong>of</strong> Manure in Pit I: 3,200 x 42 = 134,000 lbs. 9/22/99 500 14.17<br />
9/23/99 500 14.17<br />
Total Dry Weight <strong>of</strong> Solids in Pit I: 134,000 lbs x .20 = 107,000lbs 9/24/99 500 14.17<br />
9/25/99 500 14.17<br />
Total Weight <strong>of</strong> Volatile Solids in Pit I: 107,000 x 32.01% = 34,250 lbs 9/29/99 500 14.17<br />
9/30/99 500 14.17<br />
Grams <strong>of</strong> Voltatile Solids = 34,250 lbs / 2.2(lbs/Kg) = 15,569 Kg x 1000 = 15,569,000 g 10/1/99 500 14.17<br />
10/2/99 500 14.17<br />
Total <strong>biogas</strong> Production for Pit I: 25,000 ft. cu. 10/3/99 500 14.17<br />
10/4/99 500 14.17<br />
35.28 ft. cu. = 1 m cu. 10/6/99 500 14.17<br />
10/7/99 500 14.17<br />
25,000 ft. cu. / 35.28 = 708.6 m cu. 10/8/99 500 14.17<br />
10/9/99 500 14.17<br />
1,000 L = 1 m cu. 708.6 x 1,000 = 708,600 L 10/10/99 500 14.17<br />
10/11/99 500 14.17<br />
708,600 L / 20,400,000 VS = .03474 L / g VS 10/13/99 500 14.17<br />
g<br />
10/14/99 416 11.79<br />
10/15/99 416 11.79<br />
10/16/99 416 11.79<br />
10/17/99 416 11.79<br />
10/18/99 416 11.79<br />
10/19/99 416 11.79<br />
10/23/99 0 0.00<br />
0.2500<br />
60% Moisture Experiment 3<br />
0.2500<br />
80% Moisture Experiment 3<br />
Production (L/g VS)<br />
0.2000<br />
0.1500<br />
0.1000<br />
0.0500<br />
Rep 1<br />
Rep 2<br />
Rep 3<br />
Production (L/g VS)<br />
0.2000<br />
0.1500<br />
0.1000<br />
0.0500<br />
Rep 1<br />
Rep 2<br />
Rep 3<br />
25<br />
22.5<br />
Field Experiment (Pit 1)<br />
0.0000<br />
Production (L/g VS)<br />
0.2500<br />
0.2000<br />
0.1500<br />
0.1000<br />
0.0500<br />
0 50 100 150 200 250 300<br />
Time (days)<br />
70% Moisture Experiment 3<br />
Rep 1<br />
Rep 2<br />
Rep 3<br />
0.0000<br />
Production (L/g VS)<br />
0.2500<br />
0.2000<br />
0.1500<br />
0.1000<br />
0.0500<br />
0 50 100 150 200 250 300<br />
Time (days)<br />
95% Moisture Experiment 3<br />
Rep 1<br />
Rep 2<br />
Rep 3<br />
Production (m cu. / day)<br />
20<br />
17.5<br />
15<br />
12.5<br />
10<br />
7.5<br />
5<br />
2.5<br />
0<br />
7/19/99 8/8/99 8/28/99 9/17/99 10/7/99 10/27/99 11/16/99<br />
Time (days)<br />
0.0000<br />
0 50 100 150 200 250 300<br />
Time (days)<br />
0.0000<br />
0 50 100 150 200 250 300<br />
Time (days)


