Application of Microwave Moisture Sensor for Determination of Oil ...
Application of Microwave Moisture Sensor for Determination of Oil ...
Application of Microwave Moisture Sensor for Determination of Oil ...

You also want an ePaper? Increase the reach of your titles
YUMPU automatically turns print PDFs into web optimized ePapers that Google loves.
10.2478/v10048-010-0002-x<br />
MEASUREMENT SCIENCE REVIEW, Volume 10, No. 1, 2010<br />
<strong>Application</strong> <strong>of</strong> <strong>Microwave</strong> <strong>Moisture</strong> <strong>Sensor</strong> <strong>for</strong> <strong>Determination</strong><br />
<strong>of</strong> <strong>Oil</strong> Palm Fruit Ripeness<br />
You Kok Yeow, Zulkifly Abbas 1 , Kaida Khalid 1<br />
Department <strong>of</strong> Radio Communication Engineering, Faculty <strong>of</strong> Electrical Engineering, Universiti Teknologi Malaysia,<br />
81310 UTM Skudai, Malaysia, kyyou@fke.utm.my<br />
1 Department <strong>of</strong> Physics, Faculty <strong>of</strong> Science, Universiti Putra Malaysia, 43400 UPM Serdang, Malaysia, za@fsas.upm.edu.my<br />
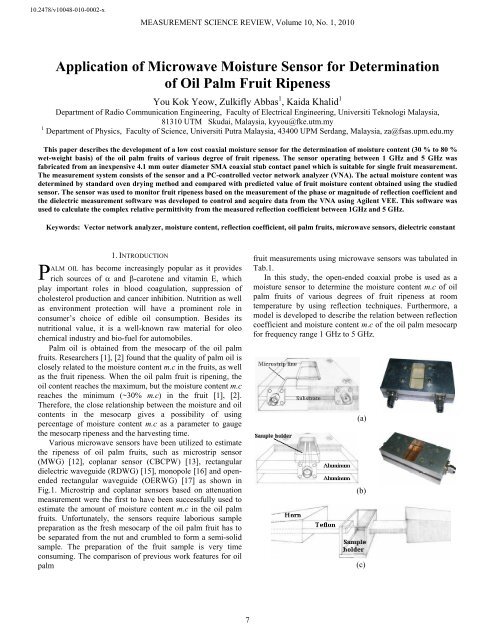
This paper describes the development <strong>of</strong> a low cost coaxial moisture sensor <strong>for</strong> the determination <strong>of</strong> moisture content (30 % to 80 %<br />
wet-weight basis) <strong>of</strong> the oil palm fruits <strong>of</strong> various degree <strong>of</strong> fruit ripeness. The sensor operating between 1 GHz and 5 GHz was<br />
fabricated from an inexpensive 4.1 mm outer diameter SMA coaxial stub contact panel which is suitable <strong>for</strong> single fruit measurement.<br />
The measurement system consists <strong>of</strong> the sensor and a PC-controlled vector network analyzer (VNA). The actual moisture content was<br />
determined by standard oven drying method and compared with predicted value <strong>of</strong> fruit moisture content obtained using the studied<br />
sensor. The sensor was used to monitor fruit ripeness based on the measurement <strong>of</strong> the phase or magnitude <strong>of</strong> reflection coefficient and<br />
the dielectric measurement s<strong>of</strong>tware was developed to control and acquire data from the VNA using Agilent VEE. This s<strong>of</strong>tware was<br />
used to calculate the complex relative permittivity from the measured reflection coefficient between 1GHz and 5 GHz.<br />
Keywords: Vector network analyzer, moisture content, reflection coefficient, oil palm fruits, microwave sensors, dielectric constant<br />
P<br />
1. INTRODUCTION<br />
ALM OIL has become increasingly popular as it provides<br />
rich sources <strong>of</strong> α and β-carotene and vitamin E, which<br />
play important roles in blood coagulation, suppression <strong>of</strong><br />
cholesterol production and cancer inhibition. Nutrition as well<br />
as environment protection will have a prominent role in<br />
consumer’s choice <strong>of</strong> edible oil consumption. Besides its<br />
nutritional value, it is a well-known raw material <strong>for</strong> oleo<br />
chemical industry and bio-fuel <strong>for</strong> automobiles.<br />
Palm oil is obtained from the mesocarp <strong>of</strong> the oil palm<br />
fruits. Researchers [1], [2] found that the quality <strong>of</strong> palm oil is<br />
closely related to the moisture content m.c in the fruits, as well<br />
as the fruit ripeness. When the oil palm fruit is ripening, the<br />
oil content reaches the maximum, but the moisture content m.c<br />
reaches the minimum (~30% m.c) in the fruit [1], [2].<br />
There<strong>for</strong>e, the close relationship between the moisture and oil<br />
contents in the mesocarp gives a possibility <strong>of</strong> using<br />
percentage <strong>of</strong> moisture content m.c as a parameter to gauge<br />
the mesocarp ripeness and the harvesting time.<br />
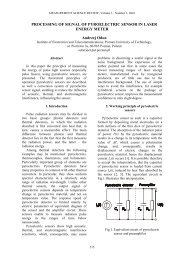
Various microwave sensors have been utilized to estimate<br />
the ripeness <strong>of</strong> oil palm fruits, such as microstrip sensor<br />
(MWG) [12], coplanar sensor (CBCPW) [13], rectangular<br />
dielectric waveguide (RDWG) [15], monopole [16] and openended<br />
rectangular waveguide (OERWG) [17] as shown in<br />
Fig.1. Microstrip and coplanar sensors based on attenuation<br />
measurement were the first to have been successfully used to<br />
estimate the amount <strong>of</strong> moisture content m.c in the oil palm<br />
fruits. Un<strong>for</strong>tunately, the sensors require laborious sample<br />
preparation as the fresh mesocarp <strong>of</strong> the oil palm fruit has to<br />
be separated from the nut and crumbled to <strong>for</strong>m a semi-solid<br />
sample. The preparation <strong>of</strong> the fruit sample is very time<br />
consuming. The comparison <strong>of</strong> previous work features <strong>for</strong> oil<br />
palm<br />
fruit measurements using microwave sensors was tabulated in<br />
Tab.1.<br />
In this study, the open-ended coaxial probe is used as a<br />
moisture sensor to determine the moisture content m.c <strong>of</strong> oil<br />
palm fruits <strong>of</strong> various degrees <strong>of</strong> fruit ripeness at room<br />
temperature by using reflection techniques. Furthermore, a<br />
model is developed to describe the relation between reflection<br />
coefficient and moisture content m.c <strong>of</strong> the oil palm mesocarp<br />
<strong>for</strong> frequency range 1 GHz to 5 GHz.<br />
(a)<br />
(b)<br />
(c)<br />
7
MEASUREMENT SCIENCE REVIEW, Volume 10, No. 1, 2010<br />
Fig.1 (a) Microstrip sensor (MWG) [12] (b) Coplanar sensor<br />
(CBCPW) [13] (c) Rectangular dielectric waveguide (RDWG) [15]<br />
(d) Rectangular waveguide (OERWG) [17] (e) Monopole [16] (f)<br />
coaxial waveguide (OECWG) (This work).<br />
(d)<br />
(e)<br />
(f)<br />
2. EXPERIMENT AND METHODS<br />
Experimentation planning includes fabrication and<br />
construction <strong>of</strong> open-ended coaxial sensor, oil palm sample<br />
preparation, sensor calibration, reflection measurements and<br />
moisture content m.c measurements in this study.<br />
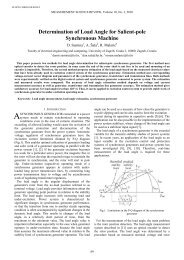
A. Fabrication <strong>of</strong> sensor<br />
The probe was fabricated from a 12.7 mm by 12.7 mm<br />
square flange, SMA stub contact panel. The stub was<br />
machined flat and polished. The diameter <strong>of</strong> the inner and<br />
outer conductors was 1.3 mm and 4.1 mm, respectively. The<br />
dielectric material separating the inner and outer conductor<br />
was Teflon (PTFE), as shown in Fig.2.<br />
B. <strong>Sensor</strong> calibration<br />
For this measurement calibration, no loss was assumed <strong>for</strong><br />
the electromagnetic wave when it is transmitted in <strong>of</strong>fset<br />
coaxial line (see Fig.2 (a)). Thus, the error network calibration<br />
parameters <strong>of</strong> S 11 and S 22 in Fig.2 (b) are equal to zero.<br />
Finally, the concept <strong>of</strong> Fig.2 (b) was simplified as in Fig.2 (c),<br />
where the S 12 and S 21 are replaced by transmission factor,<br />
exp(-jk c d c ) [18].<br />
Actual<br />
AA′ exp( 2 jkcd<br />
c<br />
)<br />
Γ = Γ<br />
(1)<br />
where d c and k c are the physical length (in meter) and<br />
propagation constant <strong>of</strong> coaxial line, respectively.<br />
Table 1 Comparison <strong>of</strong> previous work features <strong>for</strong> oil palm fruit measurements using microwave sensors<br />
Type <strong>of</strong><br />
sensor<br />
Operating<br />
frequency<br />
Comparison features <strong>of</strong> microwave sensor <strong>for</strong> oil palm fruits measurements<br />
Nondestructive<br />
test<br />
Set-up<br />
speed<br />
Cost <strong>of</strong><br />
sensor<br />
One-port<br />
measurements<br />
Single fruit<br />
measurements<br />
Sensitivity<br />
Precision<br />
MWG, [12] 10.7 GHz No Slow Low No No Good Good<br />
CBCPW, [13] 2.2 GHz No Slow Low No No Good Good<br />
Commercial<br />
HP 85070B<br />
OECWG, [14]<br />
0.13 – 20<br />
GHz<br />
No Slow Expensive Yes No Good Good<br />
RDWG, [15] 8 – 12 GHz No Slow Low No No Good Good<br />
Monopole,<br />
[16]<br />
0.5 GHz Yes Very<br />
fast<br />
Very low Yes Yes Very good Poor<br />
OERWG, [17] 8 – 12 GHz No Fast Very low Yes No Good Good<br />
OECWG<br />
(This work)<br />
II. 1 – EXPERIMENTATION<br />
5 GHz Yes Very<br />
fast<br />
Very low Yes Yes Good Good<br />
8
MEASUREMENT SCIENCE REVIEW, Volume 10, No. 1, 2010<br />
A ’<br />
7.45<br />
C. Reflection measurements<br />
The measurement consists <strong>of</strong> a computer controlled HP<br />
8720B vector network analyzer (VNA) that operates between<br />
1 GHz and 5 GHz. The moisture sensor was connected to<br />
VNA port by coaxial cable as shown in Fig.3. All reflection<br />
measurements <strong>of</strong> fruit samples were carried out at room<br />
temperature (25 ± 1) o C.<br />
ε c<br />
Teflon<br />
B<br />
HP8270B VNA<br />
4.1 1.3<br />
A<br />
B<br />
(a)<br />
Computer<br />
Open-ended<br />
coaxial probe<br />
Fig.3 Experimental set-up<br />
D. Sample preparation<br />
Γ A A ′<br />
S 21<br />
S 11 S 22<br />
S 12<br />
ΓActual<br />
(b)<br />
Twenty bunches <strong>of</strong> tenera variety from different oil palms<br />
were selected from the university farm <strong>for</strong> this study. The<br />
surface <strong>of</strong> the fruit was wiped dry to free excess surface<br />
moisture. Part <strong>of</strong> the fresh mesocarp <strong>of</strong> each fruit was sliced in<br />
the longitudinal direction to ensure good contact between the<br />
surface <strong>of</strong> the mesocarp and the open-ended coaxial probe as<br />
illustrated in Fig.4.<br />
Coaxial cable<br />
jk c d<br />
e − c<br />
(c)<br />
Γ A A ′<br />
Γ Actual<br />
Adapter<br />
jk c dc<br />
e −<br />
<strong>Oil</strong> palm fruit<br />
Coaxial sensor<br />
Fig.2 (a) Open-ended coaxial sensor with physical length, dc equal<br />
to 7.45 mm. (b) Error network calibration. (c) Alternative<br />
transmission line calibration.<br />
Fig.4 Part <strong>of</strong> the experimental set-up<br />
9
MEASUREMENT SCIENCE REVIEW, Volume 10, No. 1, 2010<br />
E. <strong>Moisture</strong> content m.c measurements<br />
The actual moisture content <strong>of</strong> the fruit sample was<br />
determined by PORIM test method or standard oven drying<br />
method [7]. Be<strong>for</strong>e drying, the single fruit sample was<br />
weighted by digital scale and the value was recorded. Next,<br />
the fruit sample was dried at (103 ± 2) o C in the oven <strong>for</strong> two<br />
to three days. During the drying time, the fruit was taken out<br />
and cooled <strong>of</strong>f, then re-weighed once every day to ensure the<br />
weight <strong>of</strong> the fruit reached a constant level. The relative<br />
moisture content m.c <strong>of</strong> oil palm fruit, in percentage (wet<br />
basis), was calculated from:<br />
mBe<strong>for</strong>e<br />
_ Dry<br />
− m<br />
After _ Dry<br />
% m . c =<br />
× 100% (2)<br />
m<br />
Be<strong>for</strong>e _ Dry<br />
where m<br />
Be<strong>for</strong>e _ Dry<br />
and m<br />
After _ Dry<br />
are the weight <strong>of</strong> fruit<br />
sample be<strong>for</strong>e and after drying in the oven, respectively. It is<br />
important to emphasize that the weight <strong>of</strong> the fruit nut is<br />
accounted <strong>for</strong> in the calculation.<br />
3. RELATIVE PERMITTIVITY CALCULATION<br />
In this study, the measured reflection coefficient Γ <strong>of</strong><br />
Actual<br />
oil palm mesocarp was converted to relative permittivity<br />
via [8]:<br />
=<br />
Y<br />
⎛1− Γ<br />
⎜<br />
⎝1+ Γ<br />
o<br />
Actual<br />
ε<br />
r<br />
(3)<br />
jω<br />
CT<br />
Actual<br />
where ω is the angular frequency. The Yo<br />
and<br />
T<br />
are the<br />
characteristic admittance and the total aperture capacitance <strong>of</strong><br />
the coaxial sensor, respectively. The characteristic admittance<br />
is expressed as:<br />
Y o<br />
Y<br />
o<br />
o<br />
( b a)<br />
⎞<br />
⎟<br />
⎠<br />
C<br />
2π<br />
ε ε<br />
o c<br />
= (4)<br />
μ ln<br />
where ε o and μ o are the free space permittivity and<br />
permeability, respectively. ε c is the dielectric constant <strong>of</strong> the<br />
Teflon filling the coaxial line. The a and b are the inner and<br />
outer radius <strong>of</strong> the coaxial conductors, respectively. The total<br />
capacitance is calculated from [9]:<br />
C T<br />
C<br />
T<br />
ε<br />
r<br />
= 2 .38ε ε ( b − a)<br />
(5)<br />
o<br />
r<br />
For this design sensor, the values <strong>of</strong> Yo<br />
and<br />
T<br />
are equal to<br />
0.0203 S and 0.03 pF.<br />
4. RESULTS AND DISCUSSION<br />
The measurement results were presented in terms <strong>of</strong><br />
reflection coefficient Γ and the comparison with the<br />
analytical [19] and numerical calculations was carried out.<br />
Subsequently, the estimation <strong>of</strong> complex relative permittivity<br />
ε<br />
r<br />
<strong>of</strong> the oil palm mesocarp based on measured reflection<br />
coefficient Γ<br />
Actual<br />
was calculated using (3).<br />
A. Calibration at the aperture <strong>of</strong> the coaxial sensor<br />
The conventional one-port calibration normally involves<br />
measuring an open, a short and a reference material (water) <strong>of</strong><br />
which the properties are known. The calibration procedures<br />
are implemented using the basic error-correction method as is<br />
shown in Fig.2(b) [10]. However, we have learned that the<br />
measuring <strong>of</strong> standard short is quite difficult to determine<br />
accurately and precisely, since it depends on how dense the<br />
coaxial probe is pressed to a metal material. In addition, a<br />
small air gap between aperture probe and metal material will<br />
cause significant measuring errors. To solve this problem, a<br />
perfect standard <strong>of</strong> short calibration must be designed to suite<br />
the probe which is used. Even if the perfect short standard has<br />
been designed, the calibration using the basic error-correction<br />
method gives more repeatable and precise measurement<br />
results than the transmission method, which only inputs the<br />
physical length <strong>of</strong> the probe. Nevertheless, by using the<br />
transmission line approach, the cost and measuring time will<br />
be reduced. In addition, the measurement uncertainties will<br />
not contribute to the calibration procedures, since the<br />
calibration transmission model [Eq (1)] is based on the<br />
theoretical principle.<br />
B. Significant sensing area <strong>of</strong> the coaxial sensor<br />
The significant sample thickness is estimated based on<br />
distance d at which the measured reflection coefficient Γ<br />
Actual<br />
becomes constant when the metallic plate is moved away from<br />
the probe surface in a sample as shown in Fig.5. Fig.6 shows<br />
that when the sample thickness exceeds 3.5 mm, the measured<br />
magnitude and phase <strong>of</strong> reflection coefficient Γ at 4 GHz<br />
remains unchanged <strong>for</strong> half-infinite free space and water,<br />
respectively. It can be concluded that the minimum significant<br />
thickness <strong>of</strong> sample under test is assumed to be 3.5 mm <strong>for</strong><br />
this study probe below 4 GHz.<br />
C<br />
10
MEASUREMENT SCIENCE REVIEW, Volume 10, No. 1, 2010<br />
|Γ|<br />
1.02<br />
1.01<br />
0.99<br />
0.98<br />
Fig.5 Finite thickness samp le, d backed by metallic plate<br />
1<br />
Free space<br />
0.97<br />
0 2 4 6 8<br />
Thickness Medium (mm)<br />
2 b<br />
2 a<br />
Thickness Sample<br />
Metallic Plate<br />
φ (rad)<br />
-0.07<br />
-0.1<br />
-0.2<br />
-0.3<br />
-0.4<br />
-0.5<br />
d<br />
Free space<br />
-0.6<br />
0 2 4 6 8<br />
Thickness medium (mm)<br />
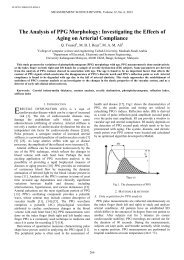
C. Variation in reflection coefficient Γ with frequency <strong>for</strong><br />
different moisture content m.c<br />
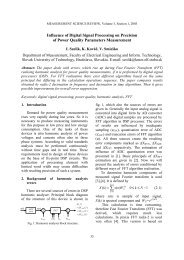
The variations in magnitude |Γ| and phase φ <strong>of</strong> the<br />
reflection coefficient with moisture content m.c <strong>for</strong> different<br />
frequencies were shown in Fig.7 and Fig.8, respectively. The<br />
measured magnitude |Γ| and phase φ were in good agreement<br />
with Finite Element (FEM) simulation and analytical<br />
calculation results. The relative complex permittivity ε r<br />
<strong>of</strong><br />
the oil palm mesocarp, used in simulations and calculation,<br />
was obtained from measurements using commercial HP<br />
85070B probe. The figures suggested that φ vary linearly with<br />
the amount <strong>of</strong> moisture content m.c in the oil palm mesocarp,<br />
but not |Γ|, since |Γ| illustrates a quadratic plotted shape with<br />
respect to moisture content m.c at frequency up to 3 GHz.<br />
Besides, the measured data <strong>of</strong> |Γ| were less precise than phase<br />
φ. It was also observed that the data <strong>for</strong> |Γ| was less sensitive<br />
to moisture content up to 4 GHz. Obviously, magnitude <strong>of</strong><br />
reflection coefficient |Γ| was less suitable in monitoring the<br />
fruit ripeness based on bandwidth measurements. In contrast,<br />
the sensitivity in φ with respect to moisture content m.c is<br />
quite constant <strong>for</strong> all frequencies. There<strong>for</strong>e, it was suggested<br />
that the phase <strong>of</strong> reflection coefficient φ was the most flexible<br />
parameter to relate the moisture content m.c <strong>of</strong> mesocarp.<br />
Finally, the empirical <strong>for</strong>mulation <strong>of</strong> moisture content m.c as a<br />
function <strong>of</strong> phase reflection coefficient φ was created by using<br />
Gaussian Elimination Method as:<br />
4<br />
3<br />
2<br />
( 1.6251f<br />
−14.6265f<br />
+ 40.672f<br />
−25.4363f<br />
−53.4792)<br />
⎪⎧<br />
φ + ⎪⎫<br />
% mc . = ⎨<br />
3<br />
2<br />
⎪⎩( ) ⎬<br />
−0.0564f<br />
+ 0.5604f<br />
−5.3215f<br />
+ 33.377<br />
⎪ ⎭<br />
(6)<br />
0.95<br />
0.9<br />
-2.5<br />
-2.6<br />
where φ and f are the phase refection coefficient (in rad) and<br />
operating frequency (in Hz), respectively.<br />
|Γ|<br />
0.85<br />
Water<br />
φ (rad)<br />
-2.7<br />
-2.8<br />
Water<br />
D. Variation in relative complex permittivity, ε r<br />
with<br />
frequency <strong>for</strong> different moisture content m.c <strong>of</strong> oil palm<br />
mesocarp<br />
0.8<br />
0.75<br />
0 2 4 6 8<br />
Thickness Medium (mm)<br />
-2.9<br />
-3<br />
0 2 4 6 8<br />
Thickness Medium (mm)<br />
Fig.6 Variation in magnitude and phase <strong>of</strong> reflection coefficient Γ<br />
with medium thickness (free space and water) <strong>for</strong> 4 GHz<br />
The relationship between both dielectric constant ε′ r<br />
and<br />
loss factor ε ′′<br />
r<br />
<strong>of</strong> oil palm mesocarp and frequency (1 GHz to<br />
5 GHz) <strong>for</strong> various percentages <strong>of</strong> water content m.c was<br />
shown in Fig.9 and Fig.10. The dielectric constant ε′ r<br />
is<br />
calculated from measured reflection coefficient Γ<br />
Actual<br />
using<br />
(3), as well as the comparison <strong>of</strong> the measurements using<br />
commercial HP85070B coaxial probe. Fig.9 revealed that the<br />
predicted and measured dielectric constant ε′<br />
r<br />
overall<br />
decreased with the increase in frequency.<br />
11
MEASUREMENT SCIENCE REVIEW, Volume 10, No. 1, 2010<br />
|Γ|<br />
|Γ|<br />
1.2<br />
1<br />
0.8<br />
0.6<br />
1 GHz<br />
0.55<br />
30 40 60 80<br />
1<br />
0.9<br />
0.8<br />
0.7<br />
m.c (%)<br />
0.67<br />
30 40 60 80<br />
m.c (%)<br />
3 GHz<br />
|Γ|<br />
|Γ|<br />
1<br />
0.95<br />
0.9<br />
0.85<br />
0.8<br />
0.75<br />
0.7<br />
0.65<br />
2 GHz<br />
0.6<br />
30 40 60 80<br />
1<br />
0.9<br />
0.8<br />
0.7<br />
m.c (%)<br />
Measured Data<br />
FEM<br />
Model [19]<br />
4 GHz<br />
0.65<br />
30 40 60 80<br />
m.c (%)<br />
Fig.7 Variation in reflection coefficient magnitude, |Γ| with<br />
percentage moisture content m.c<br />
φ (rad)<br />
-0.2<br />
-0.4<br />
-0.6<br />
-0.8<br />
-1<br />
1 GHz<br />
-1.15<br />
30 40 60 80<br />
m.c (%)<br />
φ (rad)<br />
-0.1<br />
-0.5<br />
-1<br />
-1.5<br />
2 GHz<br />
-1.8<br />
30 40 60 80<br />
m.c (%)<br />
In all measured fruits, the loss factor ε r<br />
′′ decreased at low<br />
frequency, reached a broad minimum between 1 and 3 GHz,<br />
then increased again as shown in Fig.10. This behavior is<br />
influenced by ionic conductivity at lower frequencies, since<br />
dielectric properties in agriculture are believed to be primary<br />
dependant on water activity and ionic conductivity <strong>of</strong> fluids<br />
contained in their cellular structure. Overall, the estimated<br />
relative permittivity ε r<br />
<strong>of</strong> oil palm mesocarp using (3)<br />
corresponded well with measurements using commercial<br />
HP85070B coaxial probe. Based on this study, the relationship<br />
between dielectric constant ε′ r<br />
and percentage <strong>of</strong> moisture<br />
content in mesocarp, <strong>for</strong> example at 3 GHz, is obtained and<br />
listed in Tab.2. The decrease in relative dielectric constant<br />
ε′<br />
r<br />
<strong>of</strong> the oil palm mesocarp is presumably caused by the<br />
displacement <strong>of</strong> water by oil and fibers contents. The water<br />
content m.c. is the main contributor to the value <strong>of</strong> the<br />
dielectric constant <strong>of</strong> the oil palm mesocarp, since the<br />
dielectric constant <strong>of</strong> water ( ε′<br />
r<br />
= 80 at DC) is far greater than<br />
that <strong>of</strong> other substances in the oil palm mesocarp (such as oil<br />
and fiber). In addition, the orientation <strong>of</strong> water molecules is<br />
sensitive to the microwave frequencies, especially at 2.45<br />
GHz.<br />
Table 2 Relationship between % water content m.c and dielectric<br />
constant<br />
ε′ <strong>of</strong> oil palm mesocarp <strong>for</strong> 3 GHz at ( 25 ± 1 ) o C<br />
r<br />
Water Content,<br />
m.c (%)<br />
30 – 40<br />
40 – 50<br />
50 – 60<br />
60 – 70<br />
70 – 80<br />
Dielectric<br />
Constant,<br />
10 – 15<br />
15 – 25<br />
25 – 35<br />
35 – 52<br />
52 – 62<br />
ε′<br />
r<br />
φ (rad)<br />
-0.5<br />
-1<br />
-1.5<br />
-2<br />
3 GHz<br />
-2.2<br />
30 40 60 80<br />
φ (rad)<br />
-0.3<br />
-0.5<br />
-2.5<br />
30 40 60 80<br />
m.c (%)<br />
m.c (%)<br />
Fig.8 Variation in phase shift φ with percentage moisture content m.c<br />
-1<br />
-1.5<br />
-2<br />
4 GHz<br />
Measured Data<br />
FEM<br />
Model [19]<br />
Equation (6)<br />
In this work, the relative permittivity ε r<br />
<strong>of</strong> oil palm<br />
mesocarp, ranging from 30 % to 80 % <strong>of</strong> water content at (25<br />
± 1 o C), can be represented by a sum <strong>of</strong> the two relaxation<br />
processes dielectric model as:<br />
ε = ε +<br />
r<br />
∞<br />
ε − ε<br />
+<br />
ε − ε<br />
jσ<br />
s 1<br />
1 ∞<br />
a a<br />
a<br />
2<br />
3<br />
4<br />
[ 1+<br />
( jωa<br />
τ ) ] 1+<br />
( jωτ<br />
) ωε<br />
2<br />
o<br />
1<br />
1<br />
−<br />
(7)<br />
where τ<br />
1<br />
and τ 2<br />
are the relaxation time <strong>for</strong> low and high-<br />
12
MEASUREMENT SCIENCE REVIEW, Volume 10, No. 1, 2010<br />
frequency processes, respectively. The ε s<br />
and ε<br />
1<br />
are the<br />
static permittivity <strong>for</strong> first and second relaxation processes, as<br />
well as<br />
ε is the optical permittivity. The ω is the angular<br />
∞<br />
frequency and σ is the conductivity <strong>of</strong> oil palm mesocarp at<br />
lower frequencies. The , , and a are the empirical<br />
a1<br />
a2<br />
a3<br />
4<br />
constants, which are determined by optimized, up to 120 set<br />
measured data using commercial HP85070B probe. The<br />
parameters in (7) as a function <strong>of</strong> water content m.c (%) are<br />
listed in Appendix. Equation (7) is quite in agreement with<br />
random selected measured data using the study coaxial probe.<br />
At moisture above 70 %, the higher measurement uncertainty<br />
appeared due to the water accumulated at the surface between<br />
the sensor and the fruit when the sensor is pressed firmly to<br />
the sample fruits.<br />
55<br />
50<br />
70 % m.c<br />
measurements using commercial HP85070B coaxial probe.<br />
The microwave sensor can be also applied to other fields such<br />
as soil moisture determination and quality control <strong>of</strong> latex.<br />
Loss factor, ε ,,<br />
r<br />
30<br />
25<br />
20<br />
15<br />
10<br />
Commercial HP85070B coaxial probe<br />
Study coaxial probe<br />
Equation (7)<br />
70 % m.c<br />
60 % m.c<br />
Dielectric constant <strong>of</strong> oil palm mesocarp, ε , r<br />
45<br />
40<br />
35<br />
30<br />
25<br />
20<br />
Commercial HP85070B coaxial probe<br />
Study coaxial probe<br />
Equation (7)<br />
60 % m.c<br />
48 % m.c<br />
5<br />
48 % m.c<br />
38 % m.c<br />
0<br />
1 1.5 2 2.5 3 3.5 4 4.5 5<br />
Frequency (GHz)<br />
ε ′′<br />
r <strong>of</strong> oil palm mesocarp with<br />
Fig.10 The variations in loss factor<br />
frequency <strong>for</strong> various % moisture content at ( 25 ± 1 ) o C<br />
APPENDIX<br />
15<br />
38 % m.c<br />
The parameters in (7) as a function <strong>of</strong> water content m.c (%)<br />
are listed below:<br />
10<br />
1 1.5 2 2.5 3 3.5 4 4.5 5<br />
Frequency (GHz)<br />
ε ′<br />
r <strong>of</strong> oil palm mesocarp<br />
Fig.9 The variations in dielectric constant,<br />
with frequency <strong>for</strong> various % moisture content at ( 25 ± 1 ) o C<br />
4. CONCLUSION<br />
For this study, the coaxial sensor is suitable to determine the<br />
fruit quality based on measured phase <strong>of</strong> the reflection<br />
coefficient φ alone <strong>for</strong> medium fruit up to 5 GHz. The<br />
estimated relative permittivity ε r<br />
<strong>of</strong> oil palm mesocarp from<br />
directly inverse solutions corresponded well with<br />
ε s<br />
⎡−<br />
3.9899<br />
= ⎢<br />
⎣−<br />
3.8988<br />
⎡−1.8394×<br />
10<br />
ε = ⎢<br />
⎢⎣<br />
−0.27371<br />
−4<br />
3<br />
−2<br />
× 10 ( mc . ) + 8.0046×<br />
10 ( mc . )<br />
( mc . ) + 67.258<br />
−5<br />
4<br />
−−3<br />
( mc . ) + 3.8076×<br />
10 ( mc . )<br />
2<br />
( mc . ) + 8.7394( mc . ) −98.783<br />
⎤<br />
⎥ ±<br />
⎦<br />
3<br />
1 ⎥ ±<br />
<strong>Oil</strong><br />
Fiber<br />
( 0 .84−v<br />
) ε 0.<br />
ε = 16ε<br />
Water<br />
∞<br />
vwaterε<br />
∞<br />
+<br />
water ∞<br />
+<br />
∞<br />
2<br />
⎤<br />
⎥⎦<br />
0.9792<br />
0.5093<br />
13
MEASUREMENT SCIENCE REVIEW, Volume 10, No. 1, 2010<br />
v<br />
water<br />
0.01mc<br />
.<br />
=<br />
ρ<br />
( 0.16ρ<br />
−0.16ρ<br />
+ ρ )<br />
Water<br />
Fiber<br />
−0.01ρ<br />
Water<br />
<strong>Oil</strong><br />
+ 0.01ρ<br />
Water<br />
<strong>Oil</strong><br />
Fiber<br />
where ε<br />
∞<br />
= 4.9 , ε<br />
∞<br />
= 2. 5 , ε<br />
∞<br />
= 2. 2 ,<br />
-1<br />
ρ water<br />
= 0.9959gml , ρ = 0.9073gml −1<br />
<strong>Oil</strong><br />
and<br />
−3<br />
= 0.9200gcm<br />
ρ Fiber<br />
<strong>Oil</strong><br />
<strong>Oil</strong><br />
ω = 2π f<br />
σ = 6.2861× 10 -4 (m.c) 2 - 3.6521× 10 -2 (m.c) + 6.3931× 10 -1<br />
± 0.02482 Ω m<br />
− 1 − 1<br />
a = -2.2890× 10 -4 (m.c) 2 + 3.6771× 10 -2 (m.c) + 1.4734× 10 -1<br />
1<br />
±0.0008234<br />
a = -3.5634× 10 -6 (m.c) 2 - 4.5790× 10 -4 (m.c) + 1.0124<br />
2<br />
±0.00002904<br />
a = 4.0888× 10 -5 (m.c) 2 - 8.7443× 10 -3 (m.c) + 1.1543<br />
3<br />
±0.0008381<br />
a = 3.5374× 10 -5 (m.c) 2 - 2.5052× 10 -3 (m.c) + 8.7535× 10 -1<br />
4<br />
±0.004263<br />
ACKNOWLEDGMENT<br />
This work was supported in part by the Ministry <strong>of</strong><br />
Science, and Environment <strong>of</strong> Malaysia under project IRPA<br />
09-02-04-0460-EA001.<br />
REFERENCES<br />
[1] Ariffin, A., Mat, S.R., Banjari, M., Wan, O.W.E.<br />
(1990). Morphological changes <strong>of</strong> the cellular<br />
component <strong>of</strong> the developing palm fruit (Terera: Elaeis<br />
guineensis). Palm <strong>Oil</strong> Research Institute <strong>of</strong> Malaysia<br />
Bulletin, 21, 30-34.<br />
[2] Siregar, I.M. (1976). Assessment <strong>of</strong> ripeness and crop<br />
control in oil palm. In Wastie, R.L., Earps, D.A. (eds.)<br />
Proc. <strong>of</strong> Malaysian Int. Aqric. <strong>Oil</strong> Palm Conf.<br />
(Incorporated Society <strong>of</strong> Planters). Kuala Lumpur:<br />
PORIM, 711-723.<br />
[3] Southworth, A. (1976). <strong>Oil</strong> palm harvesting – a<br />
practical approach to the optimization <strong>of</strong> oil quantity<br />
and quality. In Wastie, R.L., Earps, D.A. (eds.) Proc. <strong>of</strong><br />
Malaysian Int. Aqric. <strong>Oil</strong> Palm Conf. (Incorporated<br />
Society <strong>of</strong> Planters). Kuala Lumpur: PORIM, 721-740.<br />
[4] Kaatze, U. (2005). Electromagnetic Aquametry (ed. K.<br />
Kupfer). New York: Springer.<br />
[5] Marcuvitz, N. (1964). Waveguide Handbook. Boston:<br />
Boston Technical Publishers.<br />
[6] Ny<strong>for</strong>s, E., Vainikainen, P. (1989). Industrial<br />
<strong>Microwave</strong> <strong>Sensor</strong>s. Norwood, MA: Artech House, Inc.<br />
[7] Siew, W.L., Tang, T.S., Tan, T.A. (1995). PORIM Test<br />
Methods. Bangi: Palm <strong>Oil</strong> Research Institute <strong>of</strong><br />
Malaysia.<br />
[8] Stuchly, M.A., Atley, T.W., Samaras, G.M., Taylor,<br />
G.E. (1982). Measurement <strong>of</strong> radio frequency<br />
permittivity <strong>of</strong> biological tissues with an open-ended<br />
coaxial line: Part II - experimental results. IEEE Trans.<br />
<strong>Microwave</strong> Theory Tech., 30, 87-91.<br />
[9] Gajda, G.B., Stuchly, S.S. (1983). Numerical analysis<br />
<strong>of</strong> open-ended coaxial lines. IEEE Trans. <strong>Microwave</strong><br />
Theory Tech., 31, 380-384.<br />
[10] Kraszewski, A., Stuchly, M.A., Stuchly, S.S. (1983).<br />
ANA calibration method <strong>for</strong> measurements <strong>of</strong> dielectric<br />
properties. IEEE Trans. Instrum. Meas., 32, 385-386.<br />
[11] Hartley, C.W.S. (1977). The <strong>Oil</strong> Palm. London:<br />
Longman Group Limited.<br />
[12] Abbas, Z. (1994). A Microstrip <strong>Sensor</strong> <strong>for</strong><br />
<strong>Determination</strong> <strong>of</strong> Harvesting Time <strong>for</strong> <strong>Oil</strong> Palm Fruits.<br />
MSc Thesis, Universiti Putra Malaysia.<br />
[13] Teoh, L.H. (1997). Development <strong>of</strong> Conductor-Backed<br />
Coplanar Waveguide <strong>Moisture</strong> <strong>Sensor</strong>. MSc Thesis,<br />
Universiti Putra Malaysia.<br />
[14] Zakaria, Z. (1998). Dielectric Properties <strong>of</strong> <strong>Oil</strong> Palm<br />
Mesocarp at Various <strong>Moisture</strong> Content. MSc Thesis,<br />
Universiti Putra Malaysia.<br />
[15] Mokhtar, R. (2004). RDWG Technique <strong>for</strong><br />
<strong>Determination</strong> <strong>of</strong> Complex Permittivity and <strong>Moisture</strong><br />
Content <strong>of</strong> <strong>Oil</strong> Palm Fruits. MSc Thesis, Universiti<br />
Putra Malaysia.<br />
[16] Lee, K.Y. (2004). Development <strong>of</strong> a 500 MHz<br />
Reflectometer using Stripline Coupler <strong>for</strong> <strong>Moisture</strong><br />
Measurement <strong>of</strong> <strong>Oil</strong> Palm Fruits. MSc Thesis,<br />
Universiti Putra Malaysia.<br />
[17] Ali, A. (2007). A Study on Relationship between<br />
Reflection Coefficient and <strong>Moisture</strong> Content in <strong>Oil</strong><br />
Palm Fruits using Rectangular Waveguide. MSc<br />
Thesis, Universiti Putra Malaysia.<br />
[18] You, K.Y. (2006). <strong>Application</strong> <strong>of</strong> Open-Ended Coaxial<br />
<strong>Sensor</strong> to Determine <strong>Oil</strong> Palm Fruit Ripeness. Ph.D<br />
Thesis, Universiti Putra Malaysia.<br />
[19] Marcuvitz, N. (1964). Waveguide Handbook. Boston:<br />
Boston Technical Publishers.<br />
Received November 10, 2009.<br />
Accepted February 3, 2010.<br />
14