Reserve Bank of Australia Annual Report 2011
Reserve Bank of Australia Annual Report 2011
Reserve Bank of Australia Annual Report 2011

Create successful ePaper yourself
Turn your PDF publications into a flip-book with our unique Google optimized e-Paper software.
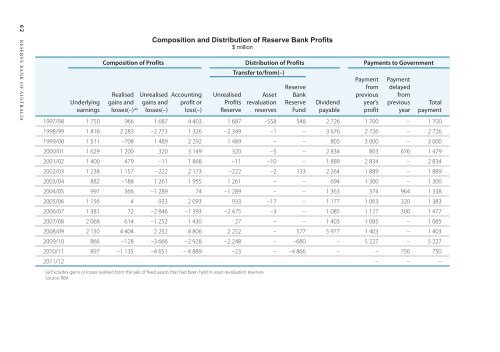
62 <strong>Reserve</strong> bank <strong>of</strong> <strong>Australia</strong><br />
Underlying<br />
earnings<br />
Composition and Distribution <strong>of</strong> <strong>Reserve</strong> <strong>Bank</strong> Pr<strong>of</strong>its<br />
$ million<br />
Composition <strong>of</strong> Pr<strong>of</strong>its Distribution <strong>of</strong> Pr<strong>of</strong>its Payments to Government<br />
Realised<br />
gains and<br />
losses(–)<br />
(a)<br />
Unrealised<br />
gains and<br />
losses(–)<br />
Accounting<br />
pr<strong>of</strong>it or<br />
loss(–)<br />
Unrealised<br />
Pr<strong>of</strong>its <br />
<strong>Reserve</strong><br />
Transfer to/from(–)<br />
Asset <br />
revaluation<br />
reserves<br />
<strong>Reserve</strong><br />
<strong>Bank</strong><br />
<strong>Reserve</strong><br />
Fund<br />
Dividend<br />
payable<br />
Payment<br />
from <br />
previous<br />
year’s<br />
pr<strong>of</strong>it<br />
Payment<br />
delayed<br />
from <br />
previous<br />
year<br />
Total<br />
payment<br />
1997/98 1 750 966 1 687 4 403 1 687 –558 548 2 726 1 700 – 1 700<br />
1998/99 1 816 2 283 –2 773 1 326 –2 349 –1 – 3 676 2 726 – 2 726<br />
1999/00 1 511 –708 1 489 2 292 1 489 – – 803 3 000 – 3 000<br />
2000/01 1 629 1 200 320 3 149 320 –5 – 2 834 803 676 1 479<br />
2001/02 1 400 479 –11 1 868 –11 –10 – 1 889 2 834 – 2 834<br />
2002/03 1 238 1 157 –222 2 173 –222 –2 133 2 264 1 889 – 1 889<br />
2003/04 882 –188 1 261 1 955 1 261 – – 694 1 300 – 1 300<br />
2004/05 997 366 –1 289 74 –1 289 – – 1 363 374 964 1 338<br />
2005/06 1 156 4 933 2 093 933 –17 – 1 177 1 063 320 1 383<br />
2006/07 1 381 72 –2 846 –1 393 –2 475 –3 – 1 085 1 177 300 1 477<br />
2007/08 2 068 614 –1 252 1 430 27 – – 1 403 1 085 – 1 085<br />
2008/09 2 150 4 404 2 252 8 806 2 252 – 577 5 977 1 403 – 1 403<br />
2009/10 866 –128 –3 666 –2 928 –2 248 – –680 – 5 227 – 5 227<br />
2010/11 897 –1 135 –4 651 – 4 889 –23 – –4 866 – – 750 750<br />
<strong>2011</strong>/12 – – –<br />
(a) Excludes gains or losses realised from the sale <strong>of</strong> fixed assets that had been held in asset revaluation reserves<br />
Source: RBA
![KNOW YOUR NEW GIBRALTAR BANKNOTES - [Home] bThe/b](https://img.yumpu.com/50890985/1/184x260/know-your-new-gibraltar-banknotes-home-bthe-b.jpg?quality=85)
![PAPUA NEW GUINEA - [Home] - Polymer Bank Notes of the World](https://img.yumpu.com/49758743/1/190x143/papua-new-guinea-home-polymer-bank-notes-of-the-world.jpg?quality=85)