Reserve Bank of Australia Annual Report 2011
Reserve Bank of Australia Annual Report 2011
Reserve Bank of Australia Annual Report 2011

Create successful ePaper yourself
Turn your PDF publications into a flip-book with our unique Google optimized e-Paper software.
Accounting Valuation<br />
For financial statement purposes, the financial positions <strong>of</strong> the superannuation schemes are valued in<br />
accordance with AASB 119. Under AASB 119, accrued benefits are determined by discounting future benefits<br />
payable to current fund members at the yield on government bonds <strong>of</strong> similar maturity on the reporting date.<br />
The approach under AASB 119, in contrast with the results <strong>of</strong> the actuaries’ triennial valuations noted above,<br />
does not take into account that the assets held by the superannuation schemes to fund future benefits have<br />
generally earned a higher rate <strong>of</strong> return on average than government bonds.<br />
The principal actuarial assumptions for the AASB 119 valuation used in the case <strong>of</strong> the OSF were a discount<br />
rate <strong>of</strong> 5.38 per cent (5.27 per cent in 2009/10), future salary increases <strong>of</strong> 3.5 per cent (3.5 per cent in 2009/10),<br />
future pension increases <strong>of</strong> 3.5 per cent (3.5 per cent in 2009/10) and an assumed return on plan assets <strong>of</strong><br />
8.5 per cent (8.5 per cent in 2009/10). The actual return on plan assets <strong>of</strong> the OSF for 2010/11 was 8.1 per cent<br />
(10.6 per cent in 2009/10). The assumptions used for the UK Pension Scheme were a discount rate <strong>of</strong> 5.4 per<br />
cent (5.3 per cent in 2009/10), future salary increases <strong>of</strong> 5.65 per cent (5.25 per cent in 2009/10), future pension<br />
increases <strong>of</strong> 3.65 per cent (3.25 per cent in 2009/10) and an assumed return on plan assets <strong>of</strong> 4.1 per cent<br />
(4.4 per cent in 2009/10). The actual return on plan assets <strong>of</strong> the UK Pension Scheme for 2010/11 was 10.0 per<br />
cent (6.1 per cent in 2009/10). The expected overall rates <strong>of</strong> return are based on the actuaries’ models <strong>of</strong> returns<br />
for major asset classes and reflect the historic rates <strong>of</strong> return and volatility for each class and correlations across<br />
asset classes.<br />
Details <strong>of</strong> the funds are as shown on the following pages. In the case <strong>of</strong> the OSF, these details relate only to the<br />
defined benefit component <strong>of</strong> the fund; defined contribution accumulation balances, on which the <strong>Bank</strong> has<br />
no actuarial risk, are excluded. This has no effect on the measurement <strong>of</strong> the surpluses in the OSF. At 30 June<br />
<strong>2011</strong> accumulation balances in the OSF totalled $165.4 million ($150.5 million as at 30 June 2010).<br />
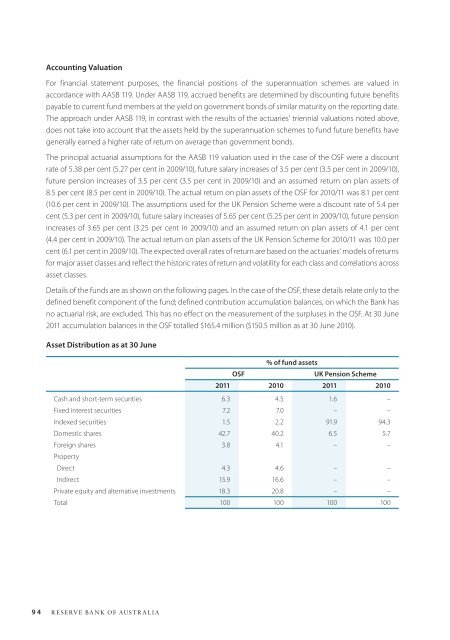
Asset Distribution as at 30 June<br />
% <strong>of</strong> fund assets<br />
OSF<br />
UK Pension Scheme<br />
<strong>2011</strong> 2010 <strong>2011</strong> 2010<br />
Cash and short-term securities 6.3 4.5 1.6 –<br />
Fixed interest securities 7.2 7.0 – –<br />
Indexed securities 1.5 2.2 91.9 94.3<br />
Domestic shares 42.7 40.2 6.5 5.7<br />
Foreign shares 3.8 4.1 – –<br />
Property<br />
Direct 4.3 4.6 – –<br />
Indirect 15.9 16.6 – –<br />
Private equity and alternative investments 18.3 20.8 – –<br />
Total 100 100 100 100<br />
94 <strong>Reserve</strong> bank <strong>of</strong> <strong>Australia</strong>
![KNOW YOUR NEW GIBRALTAR BANKNOTES - [Home] bThe/b](https://img.yumpu.com/50890985/1/184x260/know-your-new-gibraltar-banknotes-home-bthe-b.jpg?quality=85)
![PAPUA NEW GUINEA - [Home] - Polymer Bank Notes of the World](https://img.yumpu.com/49758743/1/190x143/papua-new-guinea-home-polymer-bank-notes-of-the-world.jpg?quality=85)