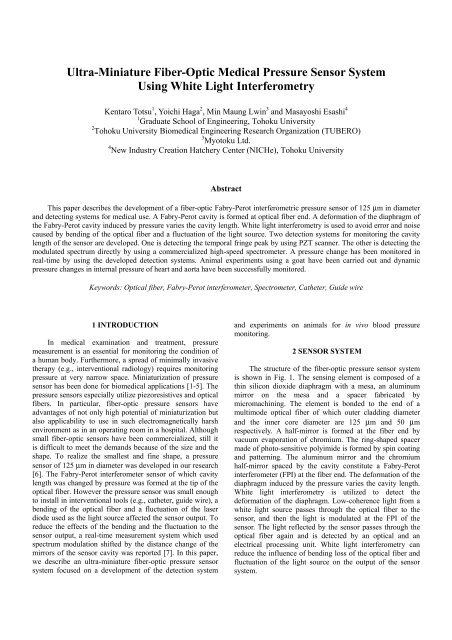
Ultra-Miniature Fiber-Optic Medical Pressure Sensor System Using ...
Ultra-Miniature Fiber-Optic Medical Pressure Sensor System Using ...
Ultra-Miniature Fiber-Optic Medical Pressure Sensor System Using ...

You also want an ePaper? Increase the reach of your titles
YUMPU automatically turns print PDFs into web optimized ePapers that Google loves.
<strong>Ultra</strong>-<strong>Miniature</strong> <strong>Fiber</strong>-<strong>Optic</strong> <strong>Medical</strong> <strong>Pressure</strong> <strong>Sensor</strong> <strong>System</strong><br />
<strong>Using</strong> White Light Interferometry<br />
Kentaro Totsu 1 , Yoichi Haga 2 , Min Maung Lwin 3 and Masayoshi Esashi 4<br />
1 Graduate School of Engineering, Tohoku University<br />
2 Tohoku University Biomedical Engineering Research Organization (TUBERO)<br />
3 Myotoku Ltd.<br />
4 New Industry Creation Hatchery Center (NICHe), Tohoku University<br />
Abstract<br />
This paper describes the development of a fiber-optic Fabry-Perot interferometric pressure sensor of 125 µm in diameter<br />
and detecting systems for medical use. A Fabry-Perot cavity is formed at optical fiber end. A deformation of the diaphragm of<br />
the Fabry-Perot cavity induced by pressure varies the cavity length. White light interferometry is used to avoid error and noise<br />
caused by bending of the optical fiber and a fluctuation of the light source. Two detection systems for monitoring the cavity<br />
length of the sensor are developed. One is detecting the temporal fringe peak by using PZT scanner. The other is detecting the<br />
modulated spectrum directly by using a commercialized high-speed spectrometer. A pressure change has been monitored in<br />
real-time by using the developed detection systems. Animal experiments using a goat have been carried out and dynamic<br />
pressure changes in internal pressure of heart and aorta have been successfully monitored.<br />
Keywords: <strong>Optic</strong>al fiber, Fabry-Perot interferometer, Spectrometer, Catheter, Guide wire<br />
1 INTRODUCTION<br />
In medical examination and treatment, pressure<br />
measurement is an essential for monitoring the condition of<br />
a human body. Furthermore, a spread of minimally invasive<br />
therapy (e.g., interventional radiology) requires monitoring<br />
pressure at very narrow space. Miniaturization of pressure<br />
sensor has been done for biomedical applications [1-5]. The<br />
pressure sensors especially utilize piezoresistives and optical<br />
fibers. In particular, fiber-optic pressure sensors have<br />
advantages of not only high potential of miniaturization but<br />
also applicability to use in such electromagnetically harsh<br />
environment as in an operating room in a hospital. Although<br />
small fiber-optic sensors have been commercialized, still it<br />
is difficult to meet the demands because of the size and the<br />
shape. To realize the smallest and fine shape, a pressure<br />
sensor of 125 µm in diameter was developed in our research<br />
[6]. The Fabry-Perot interferometer sensor of which cavity<br />
length was changed by pressure was formed at the tip of the<br />
optical fiber. However the pressure sensor was small enough<br />
to install in interventional tools (e.g., catheter, guide wire), a<br />
bending of the optical fiber and a fluctuation of the laser<br />
diode used as the light source affected the sensor output. To<br />
reduce the effects of the bending and the fluctuation to the<br />
sensor output, a real-time measurement system which used<br />
spectrum modulation shifted by the distance change of the<br />
mirrors of the sensor cavity was reported [7]. In this paper,<br />
we describe an ultra-miniature fiber-optic pressure sensor<br />
system focused on a development of the detection system<br />
and experiments on animals for in vivo blood pressure<br />
monitoring.<br />
2 SENSOR SYSTEM<br />
The structure of the fiber-optic pressure sensor system<br />
is shown in Fig. 1. The sensing element is composed of a<br />
thin silicon dioxide diaphragm with a mesa, an aluminum<br />
mirror on the mesa and a spacer fabricated by<br />
micromachining. The element is bonded to the end of a<br />
multimode optical fiber of which outer cladding diameter<br />
and the inner core diameter are 125 µm and 50 µm<br />
respectively. A half-mirror is formed at the fiber end by<br />
vacuum evaporation of chromium. The ring-shaped spacer<br />
made of photo-sensitive polyimide is formed by spin coating<br />
and patterning. The aluminum mirror and the chromium<br />
half-mirror spaced by the cavity constitute a Fabry-Perot<br />
interferometer (FPI) at the fiber end. The deformation of the<br />
diaphragm induced by the pressure varies the cavity length.<br />
White light interferometry is utilized to detect the<br />
deformation of the diaphragm. Low-coherence light from a<br />
white light source passes through the optical fiber to the<br />
sensor, and then the light is modulated at the FPI of the<br />
sensor. The light reflected by the sensor passes through the<br />
optical fiber again and is detected by an optical and an<br />
electrical processing unit. White light interferometry can<br />
reduce the influence of bending loss of the optical fiber and<br />
fluctuation of the light source on the output of the sensor<br />
system.
350 °C. After bonding, the silicon part supporting the<br />
sensing element is etched by XeF 2 .<br />
The fabricated pressure sensor of 125 µm in diameter is<br />
shown in Fig. 3. The deformable thin silicon dioxide<br />
diaphragm is observed at the end of the optical fiber.<br />
4 MEASUREMENTS<br />
Two systems for detecting the cavity length of the<br />
sensor interferometer were developed. One is detecting the<br />
temporal fringe peak by using PZT scanner for changing the<br />
cavity length of the detector interferometer. The other is<br />
detecting the spectrum directly by using a commercialized<br />
high-speed spectrometer.<br />
Figure 1. Schematic of sensor system.<br />
3 SENSOR FABRICATION<br />
First, the sensing element is fabricated by silicon<br />
micromachining, followed by bonding to an optical fiber end<br />
coated by thin chromium layer as the half-mirror. Fig. 2<br />
shows the fabrication process of the sensor structure.<br />
(a) Silicon dioxide film is deposited on both sides of a 200<br />
µm thick silicon wafer by plasma CVD using TEOS<br />
(tetraethoxysilane) source. The film thickness of the top<br />
side is 2.3 µm and that of the bottom side is 1.2 µm.<br />
These silicon dioxide films are patterned for the mesa (top<br />
side) which keeps the aluminum reflecting mirror flat and<br />
the etching mask (bottom side) used in the latter silicon<br />
deep RIE etching process (e).<br />
(b) Silicon dioxide film (0.7 µm thick) is deposited by<br />
atmospheric pressure CVD.<br />
(c) Aluminum is evaporated in vacuum and patterned by<br />
lift-off process for the reflecting mirror.<br />
(d) Photo-sensitive polyimide is spin-coated and patterned<br />
for the bonding layer and the spacer for the sensor<br />
interferometer.<br />
(e) The silicon wafer is etched through by silicon deep RIE.<br />
Then the sensing element is released from the wafer.<br />
(f) The sensing element is bonded to the optical fiber end<br />
coated by thin chromium for the half-mirror. The bonding<br />
process is carried out in a glass micro capillary as a guide<br />
[6]. The inner diameter of the capillary is 127 µm. The<br />
silicon column with the sensing element and a micro glass<br />
ball of 120 µm in diameter are inserted into the capillary.<br />
The optical fiber is inserted into the capillary so as to face<br />
the sensing element on the silicon column. Another<br />
optical fiber is inserted from the other side and presses the<br />
polyimide layer of the sensing element on the fiber end.<br />
After fixing the optical fibers, the capillary is heated up to<br />
Figure 2. Schematic of process for micromachined<br />
sensor structure.<br />
Figure 3. SEM photograph of fabricated pressure sensor<br />
of 125 µm in diameter.
4.1 PZT Scanner-type Detection <strong>System</strong><br />
Figure 4 shows the PZT scanner-type detection system<br />
for the temporal fringe measurement. The system consists of<br />
a Fabry-Perot interferometer mounted on the stacked PZT<br />
(TOKIN, AE0203D16) to scan one of the mirrors of the<br />
interferometer, the photo diode (HAMAMATSU<br />
PHOTONICS, S5973) to detect the transmitted light from<br />
the interferometer, the microcontroller (RENESAS<br />
TECHNOLOGY, SH7045), the A/D converter (ANALOG<br />
DEVICES, AD9220) and the D/A converter<br />
(BURR-BROWN, DAC7644). The microcontroller transfers<br />
scanning signal to the PZT via the D/A converter and the<br />
amplifier for driving the PZT. When the PZT scans the<br />
cavity length, fringe patterns are observed as shown in Fig. 5.<br />
The normalized intensity I of the fringe patterns can be<br />
White light source<br />
<strong>Sensor</strong><br />
Output signal [mV]<br />
100<br />
80<br />
60<br />
40<br />
20<br />
0<br />
0 100 200 300 400 500<br />
<strong>Pressure</strong> [mmHg]<br />
Figure 6. The output signal of PZT scanner-type<br />
detection system as a function of pressure.<br />
Photo diode<br />
PZT Half-mirror<br />
PZT<br />
PZT drive<br />
amplifier<br />
I-V<br />
converter<br />
Amp.<br />
δ/2<br />
<strong>Optic</strong>al fiber<br />
D/A<br />
converter<br />
A/D<br />
converter<br />
Photo diode signal<br />
100 mV<br />
60 V<br />
Coupler<br />
Micro<br />
controller<br />
D/A<br />
converter<br />
2 ms<br />
PZT scanning signal<br />
Output<br />
Figure 4. Schematic of PZT scanner-type detection<br />
system.<br />
Figure 5. Output fringe patterns captured by photo diode<br />
when PZT scans cavity length of detector interferometer.<br />
The peak of center fringe is obtained where cavity<br />
length of sensor interferometer is equal to that of<br />
detector interferometer.<br />
δ s<br />
/2<br />
expressed as<br />
I<br />
( δ )<br />
( δ −δ<br />
)<br />
⎡<br />
2<br />
⎛<br />
⎤<br />
⎡<br />
⎢<br />
2 ⎞<br />
⎜ s ⎥<br />
2π<br />
= exp − ⎟ ⎢<br />
⎢<br />
cos<br />
s<br />
⎥<br />
⎣<br />
⎝ λcC<br />
⎠<br />
⎦<br />
⎣ λc<br />
⎤<br />
( δ −δ<br />
) ⎥⎦<br />
(1)<br />
where δ is the optical difference in the detector<br />
interferometer, δ s is the optical difference in the sensor<br />
interferometer, C is the coherence length of the light source,<br />
λ c is the central wavelength of the light source [8]. When the<br />
cavity length of the detector is equal to that of the sensor, the<br />
center fringe with the highest intensity is obtained. The<br />
intensity data captured by the A/D converter is transferred to<br />
the microcontroller. The microcontroller identifies the<br />
central fringe and converts the cavity length of the sensor to<br />
the corresponding pressure value. The acquired pressure data<br />
can be obtained via the D/A converter.<br />
The detection system continuously captures the central<br />
fringe. The maximum operating frequency is 1 kHz.<br />
A pressure measurement using the PZT scanner-type<br />
detection system is presented in Fig. 6. A least-squares fit of<br />
these data yields the sensitivity of –0.17 mV/mmHg with the<br />
correlation coefficient having a value of 0.9997 and the<br />
resolution of 10 mmHg for pressures ranging from 0 to 450<br />
mmHg.<br />
4.2 Spectrometer-type Detection <strong>System</strong><br />
Figure 7 shows the spectrometer-type detection system,<br />
which consists of the spectrometer and the personal<br />
computer (PC). The sensor cavity length d corresponding to<br />
applied pressure is determined by the spectrum of the<br />
reflection light from the sensor. The cavity length d can be<br />
obtained by using<br />
λ λ<br />
d =<br />
1 2<br />
2 n ( λ2<br />
− λ1<br />
)<br />
(2)
Intensity [a.u.]<br />
White light source<br />
Spectrometer<br />
<strong>Optic</strong>al fiber<br />
Coupler<br />
Personal computer<br />
<strong>Sensor</strong><br />
Figure 7. Schematic of spectrometer-type detection<br />
system.<br />
1400<br />
1200<br />
1000<br />
800<br />
600<br />
400<br />
200<br />
0<br />
400 450 500 550 600 650 700 750 800<br />
Wavelength [nm]<br />
400<br />
300200<br />
100<br />
0<br />
-100 [mmHg]<br />
Figure 8. Reflection spectrum of developed pressure<br />
sensor for different applied pressure.<br />
where n represents the refractive index of the material of<br />
the sensor cavity, λ 1 and λ 2 represent adjacent peaks in the<br />
reflection spectrum [9]. A miniature fiber-optic high-speed<br />
spectrometer (OCEAN OPTICS, USB2000) is used for the<br />
sensor system. Fig. 8 shows the reflection spectrum of the<br />
sensor for different pressures. Spectrum modulation was<br />
obtained and the peak shifts were clearly monitored. The<br />
cavity length calculated by the PC using the spectrum data,<br />
as a function of applied pressure is shown in Fig. 9. A<br />
least-squares fit of these data yields the sensitivity of –0.25<br />
nm/mmHg with the correlation coefficient having a value<br />
of 0.9993 and the resolution of 4 mmHg for pressures<br />
ranging from –100 to 400 mmHg. The total rate of<br />
sampling at the spectrometer, data transfer from the<br />
spectrometer to PC, calculation and data display is about<br />
70 Hz. Averaging of the acquired cavity lengths calculated<br />
using more than one pair of peaks and interpolation<br />
between sampling data of pixels of the spectrometer<br />
contribute high resolution and low noise measurement.<br />
The spectrometer-type detection system does not<br />
contain mechanical moving parts. Therefore, this system is<br />
more stable and reliable than the PZT scanner-type<br />
detection system.<br />
5 EXPERIMENTS ON ANIMALS<br />
Experiments using animals have been carried out. The<br />
developed spectrometer-type detection system including<br />
the ultra-miniature fiber-optic pressure sensor was applied<br />
for monitoring pressure in a left ventricle, left atrium, right<br />
atrium and blood pressure in aorta of a goat. The sensor<br />
was set in an injection needle of which outer diameter was<br />
about 0.6 mm. The pressures are successfully monitored<br />
and the waveform of the dynamic pressure change is<br />
clearly observed as shown in Fig. 10.<br />
Owing to the low sampling frequency of the sensor<br />
1740<br />
Cavity Length [nm]<br />
1720<br />
1700<br />
1680<br />
1660<br />
1640<br />
1620<br />
1600<br />
-100 0 100 200 300 400<br />
<strong>Pressure</strong> [mmHg]<br />
Figure 9. Calculated sensor cavity length as a function<br />
of pressure.<br />
Figure 10. Continuous display of blood pressure in aorta<br />
of goat.
system, disturbed waveforms of pressure have been<br />
observed.<br />
The pressure sensor is small enough for variable<br />
applications but a temperature change affects the sensor<br />
output. The problem is caused by expansion of the air in the<br />
sensor cavity. Therefore, careful calibration is required<br />
before a pressure measurement. To avoid the thermal drift, a<br />
packaging process using soldering to keep the sensor cavity<br />
in vacuum has been proposed and the development is going<br />
on [7]. Such absolute sensor is necessary for a long term<br />
monitoring.<br />
Considering clinical uses, we have to examine not only<br />
fundamental sensor characteristics (e.g., thermal drift) but<br />
the packaging and the biocompatibility as well. We continue<br />
experiments on animals to test the structure and the<br />
materials of the sensor.<br />
6 CONCLUSIONS<br />
We have developed an ultra-miniature fiber-optic<br />
pressure sensor system. The diameter of the sensor is 125<br />
µm. A Fabry-Perot cavity is formed at the optical fiber end<br />
and a deformation of the diaphragm induced by pressure<br />
varies the cavity length. The sensing element is bonded to<br />
the optical fiber end utilizing a ring-shaped polyimide layer.<br />
White light interferometry is adopted to reduce error and<br />
noise caused by a bending of the optical fiber and a<br />
fluctuation of the light source. Two measurement systems<br />
for detecting the cavity length of the sensor have been<br />
developed. One is detecting the temporal fringe peak by<br />
using PZT scanner for changing the cavity length of the<br />
detector interferometer. The other is directly detecting the<br />
modulated spectrum of the reflection light from the sensor<br />
interferometer using a commercialized high-speed<br />
spectrometer. By tracking the shift of the peak wavelengths<br />
of the spectrum, the cavity length is calculated and the<br />
measured pressure is continuously displayed. <strong>Pressure</strong> is<br />
successfully monitored in a heart and an artery of a goat in<br />
real-time using the developed spectrometer-type detection<br />
system. To realize higher sampling frequency, development<br />
of a microcontroller-based detecting system is going on now.<br />
In a preliminary test, sampling frequency of 500 Hz has<br />
been achieved.<br />
Because of the ultra-miniature sensor head, this sensor<br />
can be installed in a catheter and a guide wire. Hence, the<br />
developed sensor system can be utilized to monitor a local<br />
pressure, which is required for safe and precision<br />
interventional procedures.<br />
Engineering Based on Bio-nanotechnology”.<br />
REFERENCES<br />
[1] R. A. Wolthuis, G. L. Mitchell, E. Saaski, J. C. Hartl and<br />
M. A. Afromowitz, "Development of medical pressure and<br />
temperature sensors employing optical spectrum modulation,<br />
" IEEE Trans. BME, vol. 38, pp.974-981, 1991.<br />
[2] E. Kalvesten, L. Smith, L. Tenerz and G. Stemme, "The<br />
first surface micromachined pressure sensor for<br />
cardiovascular pressure measurements," Proc. of IEEE<br />
International Workshop on Micro Electro Mechanical<br />
<strong>System</strong>s (MEMS 98), Heidelberg, Germany, Jan. 25-29,<br />
1998, pp.574-579.<br />
[3] O. Tohyama, M. Kohashi, M. Sugihara and H. Itoh, "A<br />
fiber-optic pressure microsensor for biomedical<br />
applications," Sens. Actuators A: Phys., vol. A66,<br />
pp.150-154, 1998.<br />
[4] P. Melvås, E. Kälvesten and G. Stemme, "A temperature<br />
compensated dual beam pressure sensor," Sens. Actuators A:<br />
Phys., vol. A100, pp.46-53, 2002.<br />
[5] K. D. Reesink, T. Nagel, J. Bovelander, J. R. C. Jansen,<br />
F. H. Veen and J. J. Schreuder, "Feasibility study of a<br />
fiber-optic system for invasive blood pressure<br />
measurements," Cathet. Cardiovasc. Intervent., vol. 57,<br />
pp.272-276, 2002.<br />
[6] T. Katsumata, Y. Haga, K. Minami and M. Esashi,<br />
"Micromachined 125 µm diameter ultra miniature<br />
fiber-optic pressure sensor for catheter," Trans. IEEJ, vol.<br />
120-E, no. 4, pp.58-63, 2000.<br />
[7] K. Totsu, Y. Haga and M. Esashi, "Vacuum sealed ultra<br />
miniature fiber-optic pressure sensor using white light<br />
interferometry," Digest of Technical Papers of the 12th<br />
International Conference on Solid State <strong>Sensor</strong>s, Actuators<br />
and Microsystems (Transducers’03), Boston, USA, June<br />
9-12, 2003, pp.931-934.<br />
[8] S. Chen, K. T. V. Grattan, B. T. Maggit and A. W.<br />
Palmer, "Instantaneous fringe-order identification using dual<br />
broadband sources with widely spaced wavelength,"<br />
Electron. Lett., vol. 29, no. 4, pp.334-335, 1993.<br />
[9] V. Bhatia, M. B. Sen, K. A. Murphy and R. O. Claus,<br />
"Wavelength-tracked white light interferometry for highly<br />
sensitive strain and temperature measurements," Electron.<br />
Lett., vol. 32, p.248, 1996.<br />
7 ACKNOWLEDGEMENTS<br />
This work was supported in part by a Health and Labour<br />
Science Research Grants (Research on Advanced <strong>Medical</strong><br />
Technology) from the Ministry of Health, Labour and<br />
Welfare of Japan. The authors acknowledge the support of<br />
Tohoku University 21COE Program “Future <strong>Medical</strong>