Learning from Repetitive Acquisitions: Evidence from the Time ...
Learning from Repetitive Acquisitions: Evidence from the Time ...
Learning from Repetitive Acquisitions: Evidence from the Time ...

You also want an ePaper? Increase the reach of your titles
YUMPU automatically turns print PDFs into web optimized ePapers that Google loves.
<strong>Learning</strong> <strong>from</strong> <strong>Repetitive</strong> <strong>Acquisitions</strong>:<br />
<strong>Evidence</strong> <strong>from</strong> <strong>the</strong> <strong>Time</strong> Between Deals<br />
Nihat Aktas, Eric de Bodt*, and Richard Roll<br />
This draft: June 24, 2011<br />
ABSTRACT<br />
<strong>Repetitive</strong> acquisitions involve benefits and integration costs. <strong>Learning</strong>, <strong>the</strong> transfer of positive<br />
experience <strong>from</strong> one acquisition to <strong>the</strong> subsequent one, is value creating if <strong>the</strong> increase in acquisition<br />
benefits dominates <strong>the</strong> increase in integration costs. But benefits and costs are not directly observable<br />
<strong>from</strong> outside <strong>the</strong> firm. This paper proposes a simple model to infer <strong>the</strong> relative importance of <strong>the</strong>ir<br />
variations <strong>from</strong> <strong>the</strong> time between successive deals. The data requirements are minimal and allow <strong>the</strong><br />
use of all mergers and acquisitions during 1992–2009 (more than 300,000 deals). The results provide<br />
strong and robust evidence of learning gains associated with repetitive acquisitions.<br />
JEL classification: G34.<br />
Keywords: acquisitions program, learning, integration costs, time between successive deals.<br />
Address<br />
Aktas de Bodt Roll<br />
EMLYON Business School<br />
23 av. Guy de Collongue<br />
69130 Ecully<br />
France<br />
Univ. Lille Nord de France<br />
SKEMA<br />
1 place Déliot - BP381<br />
59020 Lille Cédex<br />
France<br />
1<br />
UCLA Anderson<br />
110 Westwood Plaza<br />
Los Angeles, CA 90095-<br />
1481<br />
USA<br />
Voice +33-4-7833-7847 +33-3-2090-7477 +1-310-825-6118<br />
Fax +33-4-7833-7928 +33-3-2090-7629 +1-310-206-8404<br />
E-mail aktas@em-lyon.com eric.debodt@univ-lille2.fr rroll@anderson.ucla.edu<br />
*Corresponding author<br />
Acknowledgements<br />
We thank Luc Bauwens, Riccardo Calcagno, Piotr Korczak, Michel Levasseur, Neslihan Ozkan, Nikola<br />
Petrovic, and Armin Schwienbacher, as well as participants of <strong>the</strong> Bristol University accounting and finance<br />
seminar, <strong>the</strong> CORE Econometrics seminar, <strong>the</strong> European Center for Corporate Control Studies (www.ecccs.eu)<br />
finance seminar, and <strong>the</strong> Louvain School of Management finance seminar, for <strong>the</strong>ir many comments and<br />
suggestions. The second author acknowledges financial support <strong>from</strong> <strong>the</strong> University of Lille 2 (Finance,<br />
Banking, and Accounting Department) and <strong>the</strong> SKEMA Business School.
Athletes know that repetition is an essential ingredient of training, but too much repetition can<br />
cause damage. <strong>Repetitive</strong> acquirers face <strong>the</strong> same sort of trade-off: by repetitively undertaking<br />
acquisitions, acquirers may build experience, garnering expertise and o<strong>the</strong>r knowledge about<br />
<strong>the</strong> takeover process, which in turn increases acquisition related benefits. But successive<br />
acquisitions increase firm size and diversity as well, and thus generate additional integration<br />
costs. We define learning gains as <strong>the</strong> difference between increases in acquisition benefits and<br />
in integration costs, and investigative whe<strong>the</strong>r repetitive acquirers develop learning-by-doing.<br />
For repetition to translate into learning gains, <strong>the</strong> increase in acquisition benefits have to<br />
dominate <strong>the</strong> change in integration costs. Is it <strong>the</strong> case in practice?<br />
Potential for learning in <strong>the</strong> mergers and acquisitions (M&A) market possibly represent<br />
sizeable economic effects. The M&A market is a prime resource allocation channel; as Netter,<br />
Stegemoller, and Wintoki (forthcoming) report, <strong>the</strong> average annual aggregated deal value by<br />
U.S. acquirers during 1992–2009 was $928 billion, with a peak value in 1998 of $1,806<br />
billion, or 13% of U.S. stock market capitalization.<br />
Academics have long been aware of <strong>the</strong> presence of repetitive acquirers in <strong>the</strong> M&A<br />
market (e.g., Schipper and Thompson (1983)). Fuller, Netter, and Stegemoller (2002) provide<br />
stylized facts about <strong>the</strong> value creation effects of repetitive acquisitions using a sample of<br />
3,135 deals announced during 1990–2000: buying public firms generate significant negative<br />
returns, but buying private targets and subsidiaries generate positive ones. These latter<br />
positive returns are even stronger when <strong>the</strong> deals are financed with equity.<br />
Yet we know little about potential learning associated with repetitive acquisitions. 1<br />
Empirical evidence reported by Fuller, Netter, and Stegemoller (2002) is discouraging:<br />
acquirers that completed at least five deals during a three-year period earn 1.7% cumulative<br />
1 Management and strategy literature pertaining to learning in an M&A setting is much more developed, but <strong>the</strong><br />
empirical evidence is at best mixed (Barkema and Schijven (2008)). Moreover, most empirical evidence is<br />
limited to case study analyses or focuses on a single or small set of industries with relatively few observations.<br />
For example, Hayward (2002) uses a sample of 214 acquisitions made by 120 firms in six industries. Barkema<br />
and Scheijven (2008) provide a thorough summary of this literature.<br />
2
abnormal returns (CAR) on average, but <strong>from</strong> <strong>the</strong> fifth deal onward, <strong>the</strong>y earn only a 0.52%<br />
average CAR.<br />
The decline in average CAR during acquisitions programs may indicate growing<br />
overconfidence (or related behavioral biases). Billet and Qian (2008), for example, report a<br />
negative CAR for deals subsequent to <strong>the</strong> first among a sample of 3,537 public acquisitions<br />
during 1985–2002 and conclude that <strong>the</strong>ir results are consistent with a managerial self-<br />
attribution bias, leading to overconfidence. However, Aktas, de Bodt, and Roll (2009) argue<br />
that <strong>the</strong> declining CAR during acquisitions programs is not incompatible with learning,<br />
because learning-by-doing might lead acquirers to assess expected synergies with <strong>the</strong> next<br />
target more accurately and thus to bid more aggressively to acquire it. Such learning could<br />
increase <strong>the</strong> probability of completing transactions, though at <strong>the</strong> cost of sharing a higher<br />
fraction of <strong>the</strong> value creation with target shareholders. Consequently, an ex-post observable<br />
declining CAR trend is not a conclusive proof of growing overconfidence. In a recent study,<br />
Ahern (2010) argues also that declining acquirer CAR is consistent with acquirer value-<br />
maximization behaviors. By applying <strong>the</strong> q−<strong>the</strong>ory of investment to corporate acquisitions,<br />
<strong>the</strong> author develops a model in which firms optimally choose a target size that maximizes<br />
profits, though <strong>the</strong> ratio of profits to acquirer size is diminishing as acquirers get larger, thus<br />
percentage returns decline, but dollar returns increase.<br />
The M&A literature relies most often on relatively small samples of large M&A<br />
transactions (typically, a few thousand transactions by U.S. public acquirers). A notable<br />
exception is Netter, Stegemoller, and Wintoki (forthcoming), who assess <strong>the</strong> effect of data<br />
screens on <strong>the</strong> scope and characteristics of M&A activity. 2 These authors show in particular<br />
that some commonly known results in M&A literature (e.g., acquirers’ shareholders do not<br />
gain <strong>from</strong> acquisitions) do not generalize to larger samples. With respect to <strong>the</strong> question of<br />
2 Without being exhaustive, two o<strong>the</strong>r examples of large-sample M&A research are Erel, Liao, and Weisbach<br />
(forthcoming) and Ellis et al. (2011) with 56,798 and 37,414 observations, respectively.<br />
3
potential learning associated with repetitive acquisitions, we suspect that such sample biases<br />
are relevant. For example, Hayward (2002) argues that learning depends on <strong>the</strong> time between<br />
successive transactions, such that short periods between successive acquisitions do not allow<br />
experience building processes to take place, but acquisitions that are too distant in time<br />
hamper organizational learning by creating memory losses. If one limits attention to a<br />
subsample of large transactions undertaken by serial acquirers, <strong>the</strong> time between successive<br />
transactions cannot be estimated properly, because smaller intermediate transactions are<br />
dropped <strong>from</strong> <strong>the</strong> sample. The resulting measurement error may bias inferences about learning<br />
by repetitive acquirers. Moreover, large deals are significantly more value destroying<br />
(Moeller, Schlingemann, and Stulz (2005)) and integration costs relate (at least intuitively) to<br />
deal size, so one should expect that subsamples of large transactions are not entirely<br />
representative.<br />
We <strong>the</strong>refore undertake <strong>the</strong> first, to <strong>the</strong> best of our knowledge, very large-scale study of<br />
learning in M&A markets. Our goal is to test whe<strong>the</strong>r increases in acquisition benefits<br />
dominate increases in integration costs, or vice versa. If repetition translates into learning<br />
gains for firms that implement acquisitions programs, structuring learning processes within<br />
<strong>the</strong> organization could be a key driver of value creation. On <strong>the</strong> contrary, if <strong>the</strong> increase in<br />
integration costs overcomes <strong>the</strong> change in acquisition benefits, strict governance mechanisms<br />
to control acquisitions programs are needed – especially if CEO remuneration entails M&A<br />
bonuses (see Grinstein and Hribar (2004)).<br />
But investigating learning processes is challenging because nei<strong>the</strong>r changes in acquisition<br />
benefits nor variations in integration costs are directly observable <strong>from</strong> outside <strong>the</strong> firm; <strong>the</strong>y<br />
are latent factors for <strong>the</strong> econometrician. We overcome this problem with a simple structural<br />
model that relates <strong>the</strong> behavior of <strong>the</strong> time elapsed between successive deals (TBD) through<br />
<strong>the</strong> acquisition sequence to <strong>the</strong> ratio of changes in acquisition benefits to changes in<br />
4
integrations costs. We characterize <strong>the</strong> acquisition sequence for a given acquirer with <strong>the</strong><br />
variable deal order number (DON), which is equal to one for <strong>the</strong> first deal of <strong>the</strong> firm and<br />
increases by one unit <strong>from</strong> deal to deal. In our <strong>the</strong>oretical framework, <strong>the</strong> acquirer chooses <strong>the</strong><br />
TBD (<strong>the</strong> time before undertaking a new transaction) to maximize its expected profit, which is<br />
a function of <strong>the</strong> trade-off between acquisition benefits and integration costs. Starting <strong>from</strong><br />
Hayward’s (2002) results about experience building and memory loss organizational<br />
processes, we show that (1) as long as learning gains are increasing in <strong>the</strong> TBD (experience<br />
building situation), a negative correlation between TBD and <strong>the</strong> DON suggests <strong>the</strong> existence<br />
of positive learning gains (increases in acquisition benefits dominate increases in integration<br />
costs) while (2) when learning gains are decreasing in <strong>the</strong> TBD (memory loss situation), a<br />
positive correlation between TBD and <strong>the</strong> DON indicates <strong>the</strong> existence of positive learning<br />
gains. These results are central to our method, because <strong>the</strong>y allow us to infer, <strong>from</strong> an analysis<br />
of <strong>the</strong> relation between <strong>the</strong> TBD and <strong>the</strong> DON, whe<strong>the</strong>r repetitive acquirers develop learning<br />
gains.<br />
Our main empirical evidence is drawn <strong>from</strong> a sample of 321,610 deals spanning <strong>the</strong><br />
period 1992–2009, which are extracted <strong>from</strong> <strong>the</strong> Thomson-Reuters Securities Data Company<br />
(SDC) database. This very large sample parallels <strong>the</strong> sample used by Netter, Stegemoller, and<br />
Wintoki (forthcoming) and is designed to reveal M&A market activity as a whole. Because<br />
<strong>the</strong> TBD involves minimal data (i.e., one needs to know only <strong>the</strong> acquirer’s identity and <strong>the</strong><br />
announcement date or <strong>the</strong> completion date of <strong>the</strong> deal), we impose no restrictions with respect<br />
to deal size (known or unknown), acquirer/target status (public or private), acquirer/target<br />
nationality (U.S. or non-U.S.), or deal type (merger, acquisition, partial acquisition, etc.). Our<br />
results are <strong>the</strong>refore not likely to be affected by endogenous sample selection. We<br />
complement <strong>the</strong> main analysis using a subsample of transactions with a richer set of<br />
information.<br />
5
Our main measure of <strong>the</strong> TBD is <strong>the</strong> number of days between <strong>the</strong> most recent completed<br />
deal and <strong>the</strong> announcement date of <strong>the</strong> current deal, as reported in <strong>the</strong> SDC database. We<br />
compute <strong>the</strong> DON by recomposing, for each acquirer, <strong>the</strong> history of its M&A activity. The<br />
TBD is likely affected by industry-wide factors, unrelated to <strong>the</strong> trade-off between learning<br />
and integration costs, as suggested by <strong>the</strong> well-documented existence of M&A waves (see<br />
Mitchell and Mulherin (1996); Harford, (2005)). We control for this source of interference by<br />
computing an abnormal TBD using two methods. First, we take <strong>the</strong> difference between <strong>the</strong><br />
TBD and <strong>the</strong> median TBD in <strong>the</strong> same industry/year. Second, we regress <strong>the</strong> TBD on a set of<br />
industry and market-wide potential determinants, <strong>the</strong>n use <strong>the</strong> estimated residuals of this<br />
regression as a second measure of abnormal TBD. Most of our results are based on <strong>the</strong><br />
industry median–adjusted abnormal TBD, but we obtain consistent results using <strong>the</strong><br />
regression-based approach. Finally, we study <strong>the</strong> relation between <strong>the</strong> abnormal TBD and <strong>the</strong><br />
DON using a quadratic fixed-effect panel regression model to account for <strong>the</strong> convex relation<br />
between <strong>the</strong> TBD and <strong>the</strong> DON, and to control for <strong>the</strong> correlation between successive<br />
transactions undertaken by an acquirer.<br />
Our results provide strong and robust evidence that learning gains increase through <strong>the</strong><br />
deal sequence for repetitive acquirers. First, for <strong>the</strong> main sample of 38,887 unique firms that<br />
have completed at least two deals during 1992–2009, <strong>the</strong> abnormal TBD is significantly and<br />
negatively correlated with <strong>the</strong> DON. The relation is moreover convex, as indicated by <strong>the</strong><br />
positive and significant coefficient of <strong>the</strong> squared term. This result holds whe<strong>the</strong>r we use <strong>the</strong><br />
industry median–adjusted abnormal TBD or <strong>the</strong> regression-adjusted abnormal TBD. Since our<br />
predictions depend on <strong>the</strong> sign of <strong>the</strong> learning curve slope (i.e., whe<strong>the</strong>r <strong>the</strong> experience<br />
building or <strong>the</strong> memory loss effect is at play, see Hayward (2002)), we split <strong>the</strong> main sample<br />
into a short TBD subsample (i.e., observations for which <strong>the</strong> TBD is less than <strong>the</strong> sample<br />
median TBD) and its complement, a long TBD subsample. For <strong>the</strong> short TBD subsample<br />
6
(experience building), <strong>the</strong> negative correlation between <strong>the</strong> abnormal TBD and <strong>the</strong> DON is<br />
confirmed. For <strong>the</strong> long TBD subsample (memory loss), <strong>the</strong> correlation between <strong>the</strong> abnormal<br />
TBD and <strong>the</strong> DON is positive, indicating that acquisition benefits also dominate integration<br />
costs on average for this subsample. An increasing TBD <strong>from</strong> deal to deal for <strong>the</strong> long TBD<br />
subsample is moreover not consistent with an overconfidence- or hubris-based explanation in<br />
deal making, since overconfident or hubris-infected CEOs are known to be more acquisitive<br />
and aggressive during <strong>the</strong> bidding process (Roll (1986); Malmendier and Tate (2008); Aktas,<br />
de Bodt, and Roll (2009)). Our results <strong>the</strong>refore bring a strong support to <strong>the</strong> learning<br />
hypo<strong>the</strong>sis.<br />
Second, <strong>the</strong> presence of several acquisitions by a firm over a period as long as 1992–2009<br />
does not necessarily mean that <strong>the</strong> firm implemented an acquisitions program, defined as a<br />
succession of related acquisitions (Schipper and Thompson (1983)). Therefore, we create<br />
ano<strong>the</strong>r subsample that includes only firms that did not announce any acquisitions during a<br />
period of at least 24 months, <strong>the</strong>n engaged in successive acquisitions separated by at most 6<br />
months (a short TBD). We identify 1,816 such nearby sequences (13,010 observations) that<br />
we define as acquisitions programs. Results obtained for this subsample of acquisitions<br />
programs are even more supportive of <strong>the</strong> learning hypo<strong>the</strong>sis. The decrease in <strong>the</strong> TBD <strong>from</strong><br />
deal to deal is economically significant, with an average reduction of more than 60 days <strong>from</strong><br />
<strong>the</strong> second deal to <strong>the</strong> third deal within <strong>the</strong> program. This corresponds to a 20% reduction<br />
with respect to <strong>the</strong> sample average abnormal TBD. Perhaps acquirers starting an acquisitions<br />
program focus more on putting learning processes into place throughout <strong>the</strong>ir organization as<br />
emphasized by consulting firms and <strong>the</strong> business press (see, e.g., Ashkenas, DeMonaco, and<br />
Francis (1998); Harding and Rovit (2004)). For example, General Electric, a well-known<br />
repetitive acquirer, has managed to specialize its acquisition process in order to effectively<br />
integrate most of its acquisitions within 100 days (Ashkenas, DeMonaco, and Francis (1998)).<br />
7
Third, we investigate whe<strong>the</strong>r our results are due to <strong>the</strong> presence of many small<br />
transactions in <strong>the</strong> selected sample of M&A transactions. On a sample of 22,648 observations<br />
limited to M&A transactions with deal size above $50 million, we get comparable results<br />
(only <strong>the</strong> results for <strong>the</strong> long TBD cases appear somehow to be weaker).<br />
We provide many robustness checks. Among o<strong>the</strong>rs, we investigate <strong>the</strong> role of financial<br />
resources committed into <strong>the</strong> acquisition process. By design, we do not take into account <strong>the</strong><br />
amounts invested into acquisitions, because our goal is to study <strong>the</strong> whole M&A market and<br />
impose minimal data requirements. Yet we expect that deal size may relate to acquisition<br />
benefits (i.e., acquirers may learn by undertaking small deals; Harding and Rovit (2004)) and<br />
integration costs (i.e., large acquisitions require more resources to merge with existing<br />
activities), so its omission <strong>from</strong> our analyses may raise an issue of a correlated missing factor.<br />
To investigate this issue, we replicate our analyses using <strong>the</strong> cumulative deal size of previous<br />
transactions, in place of <strong>the</strong> DON variable, which captures both <strong>the</strong> number of deals already<br />
undertaken (similar to <strong>the</strong> DON) and <strong>the</strong> size of <strong>the</strong>se previous transactions. We obtain<br />
consistent results using this new specification. Our results are <strong>the</strong>refore robust to <strong>the</strong> inclusion<br />
of <strong>the</strong> importance of financial resources invested in an M&A. O<strong>the</strong>r robustness checks bears<br />
on <strong>the</strong> classification of M&A transactions, <strong>the</strong> choice of <strong>the</strong> econometric estimators, and <strong>the</strong><br />
choice of <strong>the</strong> threshold to identify short and long TBD transactions.<br />
Our results not only generalize limited existing empirical evidence about learning but<br />
also focus on <strong>the</strong> TBD, an attribute of acquisition sequences that previously has gone<br />
unexplored in finance literature.<br />
The paper is organized as follows. Section I introduces a simple <strong>the</strong>oretical framework to<br />
infer learning <strong>from</strong> <strong>the</strong> time between successive deals. Section II is devoted to <strong>the</strong> empirical<br />
analysis. Section III provides additional results and robustness checks. Section IV concludes.<br />
8
I. A Simple Framework to Infer <strong>Learning</strong> <strong>from</strong> <strong>the</strong> TBD<br />
A. The Setup<br />
Our goal is to study learning by a firm undertaking acquisitions. Following Barkema and<br />
Schijven (2008), learning corresponds to <strong>the</strong> transfer of an organization’s experience <strong>from</strong> one<br />
deal to a subsequent deal, and it is expected to affect positively acquisition profit (i.e., positive<br />
experience transfer). 3 We define <strong>the</strong> acquisition profit by invested dollars as <strong>the</strong> difference<br />
between acquisition benefits and integration costs, scaled by <strong>the</strong> invested amount (<strong>the</strong> deal<br />
size): 4<br />
9<br />
, (1)<br />
where is <strong>the</strong> deal subscript, B denotes acquisition benefits, C corresponds to integration<br />
costs, and I is <strong>the</strong> invested amount. For <strong>the</strong> ease of exposition, we fix <strong>the</strong> invested amount to<br />
one. Acquisition benefits correspond to synergy realization and any acquisition-induced<br />
scale/scope economies, while integration costs are costs incurred by <strong>the</strong> acquirer to reconcile<br />
various business activities; to melt administrative, accounting, controlling, and information<br />
systems; and to manage corporate culture differences.<br />
<strong>Learning</strong> affects potentially both acquisition benefits and integration costs. In fact,<br />
learning might bear on multiple dimensions of <strong>the</strong> takeover process (Hitt, Harrison, and<br />
Ireland (2001)), including <strong>the</strong> selection and valuation of targets, due diligence, negotiation,<br />
offer specification (e.g., premium, mode of payment), and management of regulatory issues<br />
(e.g., intervention of <strong>the</strong> Federal Trade Commission and/or Department of Justice). <strong>Learning</strong><br />
3 Arrow (1962) is one of <strong>the</strong> first author to analyze <strong>the</strong>oretically <strong>the</strong> economic implications of learning-bv-doing<br />
and to acknowledge that experience effects are positive, such that growing stock experience improves inputoutput<br />
ratios of a given operational task.<br />
4 Kaplan, Mitchell, and Wruck (2000) argue that acquisition profit does not only depend on initial due diligence<br />
and information ga<strong>the</strong>ring but also on postmerger incentives and organizational design. M&A scholars in<br />
management document also that <strong>the</strong> realization of expected synergies and acquisition profit depends on effective<br />
post-acquisition integration (see, e.g., Datta (1991); Chatterjee et al. (1992); Larsson and Finkelstein (1999);<br />
Weber and Camerer (2003)).
also bears on <strong>the</strong> post-acquisition phase and, at that stage, captures efficiency of integration<br />
processes.<br />
The measure of learning gains (L) at deal d (<strong>the</strong> focal deal) is <strong>the</strong> change in acquisition<br />
profit by invested dollars <strong>from</strong> deal d – 1 to deal d :<br />
10<br />
, (2)<br />
where is <strong>the</strong> deal subscript and denotes acquisition profit by invested dollars. <strong>Learning</strong> is<br />
<strong>the</strong>refore evaluated as <strong>the</strong> net change in value by invested dollars induced by <strong>the</strong> positive<br />
transfer of experience <strong>from</strong> one deal to <strong>the</strong> subsequent one.<br />
The CEO decision variable is <strong>the</strong> time <strong>the</strong> firm waits before making a new acquisition<br />
attempt (TBD). We use <strong>the</strong> deal order number (DON) to proxy for <strong>the</strong> history of transactions<br />
already completed by <strong>the</strong> firm. The DON in itself is not a decision variable; ra<strong>the</strong>r, it<br />
encapsulates past decisions. To keep <strong>the</strong> model as simple as possible, we abstract <strong>from</strong><br />
information asymmetry issues and agency conflicts (e.g., among <strong>the</strong> CEO, shareholders,<br />
and/or creditors). We assume that firm decisions are made by <strong>the</strong> CEO, in <strong>the</strong> best interest of<br />
shareholders and with no budget constraints. The firm shareholders are risk neutral, so <strong>the</strong><br />
CEO maximizes <strong>the</strong> firm’s expected profit, and <strong>the</strong> timing decision (TBD) affects acquisition<br />
profit only through <strong>the</strong> influence on acquisition benefits and integration costs.<br />
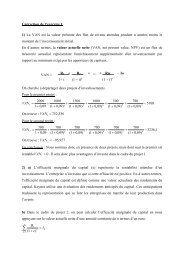
Following Hayward (2002), learning for a given deal attempt d is a concave function of<br />
<strong>the</strong> TBD (see Figure 1): learning is increasing in <strong>the</strong> TBD up to a threshold value, because<br />
acquisitions made too quickly in succession do not provide enough time to build experience<br />
(experience building effect), <strong>the</strong>n, starting <strong>from</strong> <strong>the</strong> threshold value, learning is decreasing in<br />
<strong>the</strong> TBD, because acquisition expertise decays if successive takeovers are too far apart <strong>from</strong><br />
each o<strong>the</strong>r (memory loss effect). Therefore, <strong>the</strong>re is a TBD threshold value denoted<br />
such that signs of <strong>the</strong> first and second derivatives of Ld with respect to <strong>the</strong> TBD are:<br />
̅̅̅̅̅̅<br />
̅̅̅̅̅̅,<br />
̅̅̅̅̅̅, (3)
B. The Acquirer’s Decision Problem<br />
[Figure 1 About Here]<br />
11<br />
. (4)<br />
The firm’s decision problem is to choose when to undertake <strong>the</strong> next acquisition, that is,<br />
<strong>the</strong> time between <strong>the</strong> previous deal and <strong>the</strong> next deal attempt (TBD). 5 Given <strong>the</strong> characteristics<br />
of <strong>the</strong> selected target, <strong>the</strong> firm’s expected rate of return <strong>from</strong> <strong>the</strong> acquisition is:<br />
( ) ( ( ) ). (5)<br />
In equilibrium, <strong>the</strong> firm achieves its required rate of return such that ( ) , where is<br />
<strong>the</strong> cost of capital.<br />
In <strong>the</strong> absence of (invertible) functional specifications of acquisition profit, no closed<br />
form expression of <strong>the</strong> optimal TBD can be derived. Our strategy is <strong>the</strong>refore to develop<br />
predictions about <strong>the</strong> relation between <strong>the</strong> TBD and <strong>the</strong> DON (two variables that are<br />
observable and <strong>the</strong>ir relation characterizes <strong>the</strong> dynamic of <strong>the</strong> TBD in a sequence of<br />
acquisitions) using <strong>the</strong> implicit function <strong>the</strong>orem. The derivative of <strong>the</strong> TBD with respect to<br />
<strong>the</strong> DON can be expressed as follows: 6<br />
( )<br />
( )<br />
. (6)<br />
Equation (6) allows us to derive empirical testable predictions, because TBD and DON are<br />
observable.<br />
C. Empirical Predictions<br />
5<br />
Recall that <strong>the</strong> DON is not a decision variable but summarizes <strong>the</strong> history of acquisitions completed by <strong>the</strong><br />
firm.<br />
6<br />
Since <strong>the</strong> acquisition profit of <strong>the</strong> previous deal, is constant with respect to <strong>the</strong> TBD (DON) of <strong>the</strong> focal<br />
deal, <strong>the</strong> derivate of with respect to <strong>the</strong> TBD (DON) is equal to <strong>the</strong> derivative of with respect to <strong>the</strong> TBD<br />
(DON).
<strong>Learning</strong> gains are increasing for TBD below ̅̅̅̅̅̅ (experience building effect) and<br />
decreasing for TBD above<br />
<strong>the</strong>refore on <strong>the</strong> sign of<br />
When<br />
.<br />
̅̅̅̅̅̅ (memory loss effect). Our empirical predictions depend<br />
is strictly positive (experience building effect), <strong>the</strong> denominator of Equation<br />
(6) is strictly positive. Therefore, <strong>the</strong> sign of<br />
-<br />
-<br />
12<br />
depends on <strong>the</strong> sign of<br />
: if learning gains increase through <strong>the</strong> deal sequence, <strong>the</strong>n,<br />
:<br />
should be<br />
negative (i.e., <strong>the</strong> time that elapses between successive deals should decrease during <strong>the</strong><br />
acquisition sequence).<br />
: if learning gains decrease through <strong>the</strong> deal sequence, <strong>the</strong>n<br />
should be<br />
positive ((i.e., <strong>the</strong> time that elapses between successive deals should increase during <strong>the</strong><br />
acquisition sequence).<br />
These empirical predictions reverse when<br />
thus summarize our empirical predictions in Proposition 1.<br />
Proposition 1. <strong>Learning</strong> gains inferred <strong>from</strong> <strong>the</strong> sign of<br />
is strictly negative (memory loss effect). We<br />
(a) Under <strong>the</strong> experience building effect: if acquirers develop learning gains through<br />
<strong>the</strong> deal sequence (<br />
), <strong>the</strong>n<br />
should be negative (and vice versa).<br />
(b) Under <strong>the</strong> memory loss effect: if acquirers develop learning gains through <strong>the</strong> deal<br />
sequence (<br />
), <strong>the</strong>n<br />
should be positive (and vice versa).<br />
Proposition 1 allows us to infer <strong>from</strong> <strong>the</strong> sign of <strong>the</strong> relation between <strong>the</strong> TBD and <strong>the</strong><br />
DON <strong>the</strong> existence of learning gains for repetitive acquirers, conditional on whe<strong>the</strong>r <strong>the</strong><br />
experience building or <strong>the</strong> memory loss effect is at play. Experience building manifests itself<br />
for TBD below ̅̅̅̅̅̅ and memory loss appears for TBD above ̅̅̅̅̅̅.
II. Empirical <strong>Evidence</strong><br />
A. Sample<br />
The Securities Data Company (SDC) provides <strong>the</strong> sample of takeovers. To examine all<br />
completed transactions, we adopt <strong>the</strong> selection criteria used by Netter, Stegemoller, and<br />
Wintoki (forthcoming). We first select all completed takeovers available <strong>from</strong> January 1,<br />
1992, to December 31, 2009, including transactions classified by SDC as mergers,<br />
acquisitions, acquisitions of majority interest, acquisitions of assets, acquisitions of certain<br />
assets, acquisitions of remaining interest, and exchange offers. All <strong>the</strong>se diverse transactions<br />
are retained in <strong>the</strong> sample because our focus is on <strong>the</strong> acquirer and because SDC’s transaction<br />
definitions are often vague. For example, almost half <strong>the</strong> transactions reported by Microsoft as<br />
mergers and acquisitions are classified by SDC as acquisitions of assets. 7 We have no reason<br />
to overlook such transactions. However, to limit <strong>the</strong> analysis to acquisitions with an explicit<br />
change of control, we retain <strong>the</strong>m only when <strong>the</strong> acquirer purchases 50% or more of <strong>the</strong><br />
target’s shares and owns less than 50% of <strong>the</strong> target six months prior to <strong>the</strong> deal<br />
announcement.<br />
No restrictions are imposed with respect to deal size (whe<strong>the</strong>r or not SDC reports <strong>the</strong> deal<br />
value), to <strong>the</strong> status of acquirers and targets (public or private), or to <strong>the</strong> nationality of<br />
acquirers and targets (U.S. or non-U.S.). The earliest sample year is 1992 when SDC begin<br />
covering deals of any value, even those with unknown deal size. This is particularly relevant<br />
for our goal of building a complete acquisition history of every firm and minimizing <strong>the</strong> risk<br />
of missing a transaction.<br />
After removing 1,394 duplicate observations, identified by <strong>the</strong>ir announcement date,<br />
acquirer, and target CUSIP, we retain 321,610 transactions (<strong>the</strong> main sample). Table I<br />
contains summary statistics of <strong>the</strong> annual acquisition activity by all acquirers and by U.S.<br />
7 See http://www.microsoft.com/investor/Stock/AcquisitonHistory/All/default.aspx.<br />
13
acquirers. For both groups of acquirers, <strong>the</strong> sample exhibits a first peak in <strong>the</strong> number of<br />
transactions between 1997 and 2000, consistent with <strong>the</strong> well-documented “friendly” M&A<br />
wave of <strong>the</strong> end of <strong>the</strong> 1990s (Betton, Eckbo, and Thorburn (2008)), and a second peak<br />
between 2005 and 2007. The differences between <strong>the</strong> yearly average and median deal size<br />
highlight <strong>the</strong> impact of large transactions on reported aggregate deal sizes. Forty percent of<br />
<strong>the</strong>se 321,610 transactions were undertaken by U.S. acquirers. We report <strong>the</strong> aggregate deal<br />
size for U.S. acquirers in 2008 constant dollars, to provide a direct comparison with Netter,<br />
Stegemoller, and Wintoki (forthcoming). 8 These authors report on 128,900 transactions for<br />
<strong>the</strong> period 1992–2009, with an aggregate deal value of $16,702 billion (in 2008 constant<br />
dollars). We replicate <strong>the</strong>ir sample with 126,878 transactions and an aggregate deal value of<br />
$16,032 billion. Our main sample also matches <strong>the</strong>ir universe with respect to <strong>the</strong> form of <strong>the</strong><br />
deal, according to SDC’s classification (unreported results). Most transactions are classified<br />
as acquisitions of assets (64.67% for all acquirers; 73.49% for U.S. acquirers). Mergers are<br />
<strong>the</strong> second most common deal form, with more than 20% of transactions classified as such,<br />
regardless of <strong>the</strong> nationality of <strong>the</strong> acquirer.<br />
B. Variables and Methods<br />
B.1. Deal Order Number (DON)<br />
[Table I About Here]<br />
To infer <strong>the</strong> existence of learning gains, Proposition 1 predicts relations between <strong>the</strong> deal<br />
order number (DON) and <strong>the</strong> time between successive deals (TBD). We <strong>the</strong>refore start by<br />
tracing acquisitions sequences by acquirer to compute <strong>the</strong> DON variable. Specifically, we<br />
identify first each acquirer using its historical CUSIP code, extracted <strong>from</strong> <strong>the</strong> main sample all<br />
of its acquisitions, and sort <strong>the</strong> acquisition list by announcement date. Then, acquirer by<br />
8 Transactions with missing deal value in SDC are not taken into account to obtain aggregate, average and<br />
median deal size by year. This creates a downward bias in <strong>the</strong> reported statistics. But deal values are most often<br />
missing for small transactions in SDC.<br />
14
acquirer, a DON is assigned to each transaction by increasing announcement date, <strong>from</strong> 1 for<br />
<strong>the</strong> first acquisition of <strong>the</strong> acquirer to N for its last acquisition.<br />
Table II reports <strong>the</strong> distribution of deal order numbers. More than 55% of all deals are a<br />
first deal for a particular acquirer, though multiple acquisitions are still quite common: 67,387<br />
transactions are associated with a DON of at least 5, 36,835 transactions indicate a number of<br />
at least 10, and 19,341 transactions have a DON of at least 21. Schipper and Thompson (1983)<br />
and Fuller, Netter, and Stegemoller (2002) similarly have highlighted <strong>the</strong> presence of serial<br />
acquirers. The average deal size by DON in Table II is clearly increasing through <strong>the</strong><br />
acquisition sequence. For example, <strong>the</strong> fifth deal in a sequence has an average (median) deal<br />
size three (two) times higher than <strong>the</strong> first deal, and <strong>the</strong> tenth deal has an average (median)<br />
deal size approximately four (three) times higher than <strong>the</strong> first deal. After <strong>the</strong> fifteenth deal,<br />
<strong>the</strong> average deal size seems not to increase much more, with an average deal size five times<br />
higher than <strong>the</strong> first. This substantial increase of <strong>the</strong> deal size throughout <strong>the</strong> acquisition<br />
sequence appears consistent with learning. That is, firms would begin with smaller deals to<br />
learn <strong>the</strong> basics, <strong>the</strong>n as <strong>the</strong>y gain more knowledge, <strong>the</strong>y would risk bigger acquisitions (as<br />
indicated in <strong>the</strong> business press; Harding and Rovit (2004)). But ano<strong>the</strong>r interpretation is that<br />
deal size is correlated with acquirer size and that larger acquirers do more deals. The apparent<br />
positive correlation between DON and <strong>the</strong> deal size would <strong>the</strong>n be driven by <strong>the</strong> acquirer size<br />
(a latent factor here). The last two columns of Table II (average and median acquirer market<br />
value in millions of dollars) are consistent with this second interpretation.<br />
B.2. <strong>Time</strong> Between Deals (TBD)<br />
[Table II About Here]<br />
Potentially, increase in acquisition benefits starts as soon as an acquisition is attempted,<br />
whe<strong>the</strong>r or not it is completed, because target identification, <strong>the</strong> choice of buying procedure,<br />
<strong>the</strong> offer specification, etc., can be as much source of learning as <strong>the</strong> post-acquisition<br />
15
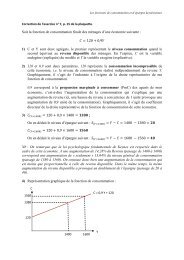
activities. But changes in integration costs arise only after <strong>the</strong> acquisition is completed. Thus,<br />
<strong>the</strong> choice of whe<strong>the</strong>r to compute <strong>the</strong> TBD as <strong>the</strong> difference between <strong>the</strong> announcement date<br />
of <strong>the</strong> current transaction and <strong>the</strong> completion date of <strong>the</strong> most recently completed transaction<br />
or as <strong>the</strong> difference between announcement dates of successive transactions is an important<br />
issue (see Figure 2). We use mostly <strong>the</strong> TBD defined as <strong>the</strong> days between <strong>the</strong> announcement<br />
date of <strong>the</strong> current transaction and <strong>the</strong> completion date of <strong>the</strong> preceding transaction, which we<br />
denote TBDC. The TBDC spans a conservative interval of learning, because it does not<br />
include <strong>the</strong> earliest part of <strong>the</strong> potential learning period (<strong>the</strong> pre-acquisition phase of <strong>the</strong><br />
preceding transaction). We provide also results using <strong>the</strong> days between <strong>the</strong> announcement<br />
dates of <strong>the</strong> current deal and <strong>the</strong> previous deal (denoted TBDA) as a robustness check.<br />
[Figure 2 About Here]<br />
M&As exhibit waves at <strong>the</strong> aggregate and industry levels (Mitchell and Mulherin (1996);<br />
Harford (2005)), which should materially influence <strong>the</strong> TBD. However, our model postulates<br />
a trade-off between changes in acquisition benefits and in integration costs at <strong>the</strong> firm level.<br />
It is firm specific, so we must control for industry and aggregate influences on <strong>the</strong> TBD in<br />
empirical tests. Accordingly, we compute <strong>the</strong> abnormal TBD as <strong>the</strong> difference between <strong>the</strong><br />
TBD and median TBD of deals in <strong>the</strong> same industry/year as <strong>the</strong> deal under consideration,<br />
16<br />
( ), (7)<br />
where d is <strong>the</strong> current deal, and Median is <strong>the</strong> median TBD of <strong>the</strong> set of deals in <strong>the</strong> same<br />
industry/year. We use <strong>the</strong> three-digit SIC code to define <strong>the</strong> industry. (In our robustness<br />
checks, we assess <strong>the</strong> stability of <strong>the</strong> results using <strong>the</strong> two-digit SIC code, and we complement<br />
this median-adjusted abnormal TBD approach with a regression-based approach.)<br />
Table III lists <strong>the</strong> summary statistics for <strong>the</strong> TBD variables for <strong>the</strong> entire sample. We also<br />
report statistics for transactions with a TBD below <strong>the</strong> sample median (short TBD) and above<br />
<strong>the</strong> sample median (long TBD). Empirical predictions of Proposition 1 depend indeed on
whe<strong>the</strong>r <strong>the</strong> experience building part of <strong>the</strong> learning curve or <strong>the</strong> memory loss part is at play.<br />
Hayward (2002) argues that experience building manifests itself when transactions are not too<br />
close to each o<strong>the</strong>r while memory loss appears when <strong>the</strong>y are too distant in time. The author<br />
uncovers a convex relation between acquirer CAR and <strong>the</strong> TBD, and reports, on a sample of<br />
192 acquisitions by 100 large U.S. acquirers during <strong>the</strong> period 1985–1995, an optimal TBD of<br />
220 days. We choose to split our sample between short and long TBD subsamples using <strong>the</strong><br />
median TBD (174 days). This threshold is not too far away <strong>from</strong> <strong>the</strong> estimate reported by<br />
Hayward (2002). 9,10<br />
[Table III About Here]<br />
Panel A of Table III reports on TBDC, <strong>the</strong> number of days between <strong>the</strong> announcement<br />
date of <strong>the</strong> current deal and <strong>the</strong> completion date of <strong>the</strong> previous deal (TBDC). In total <strong>the</strong>re<br />
are 129,400 TBDCs, because <strong>the</strong>re must be at least two deals for any given firm. The average<br />
TBDC is 420 days (about 14 months), and <strong>the</strong> corresponding median is 174 days (almost 6<br />
months). The TBDC is clearly decreasing throughout <strong>the</strong> deal sequence: <strong>from</strong> 577 days (19<br />
months) on average during <strong>the</strong> first five transactions to 61 days (2 months) for deal order<br />
numbers greater than 20. The same decreasing pattern emerges for both <strong>the</strong> short and long<br />
TBD subsamples.<br />
Panel B of Table III reports on TBDA, <strong>the</strong> number of days between <strong>the</strong> announcement<br />
dates of <strong>the</strong> current and previous deals. The patterns of TBDA and TBDC are similar, which<br />
suggests that <strong>the</strong> analyses might not be seriously affected by <strong>the</strong> particular way TBD is<br />
computed.<br />
Panel C of Table III focuses on <strong>the</strong> abnormal TBDC. Removing <strong>the</strong> industry median<br />
TBDC significantly affects our results in one key respect: for <strong>the</strong> short TBD subsample, <strong>the</strong><br />
9<br />
We also check <strong>the</strong> robustness of our results in Section III by reporting results based on <strong>the</strong> first quartile for<br />
short TBD and <strong>the</strong> third quartile for long TBD.<br />
10<br />
We note also that our sample includes many small transactions, absent <strong>from</strong> <strong>the</strong> Hayward (2002) sample.<br />
Increases in integrations costs are expected to be less important for smaller transactions and <strong>the</strong>refore, <strong>the</strong><br />
optimal TBD should be lower in our sample than in <strong>the</strong> Hayward (2002) sample.<br />
17
abnormal TBDC is almost constant <strong>from</strong> DON = 1 to DON = 20, <strong>the</strong>n drops substantially for<br />
DON greater than 20. This indicates that industry determinants play a role in <strong>the</strong> decreasing<br />
trend shown by TBD in Panels A and B.<br />
It is tempting to interpret <strong>the</strong> trends in <strong>the</strong> TBDC, TBDA, and abnormal TBDC in light of<br />
Proposition 1, but successive transactions by a given acquirer are not independent<br />
observations. Statistical inference <strong>the</strong>refore could be distorted, a concern we address in<br />
Section II.C.<br />
B.3. Control Variables<br />
Some of our analyses require <strong>the</strong> use of additional control variables. We collect several<br />
transaction-level control variables: a dummy variable identifying horizontal deals (at <strong>the</strong> four-<br />
digit SIC industry level), a dummy variable identifying private targets, a dummy variable<br />
identifying U.S. targets, and deal size in millions of dollars. Panel A of Table IV provides <strong>the</strong><br />
number of observations in our main sample for which <strong>the</strong>se variables are available, <strong>the</strong><br />
fraction of horizontal transactions, <strong>the</strong> fractions of private targets and domestic targets, and<br />
<strong>the</strong> average and median deal sizes. Panels B and C contain <strong>the</strong> corresponding figures for <strong>the</strong><br />
short and long TBD subsamples, respectively. Although <strong>the</strong> three dummy variables are<br />
available for all transactions, <strong>the</strong> SDC reports deal size for less than half of <strong>the</strong>m (see also<br />
Netter, Stegemoller, and Wintoki (forthcoming)). The percentage of horizontal transactions<br />
appears slightly higher for <strong>the</strong> long TBD subsample, whereas domestic targets seem slightly<br />
more present in <strong>the</strong> short TBD subsample. The percentage of private targets is stable between<br />
<strong>the</strong> two subsamples. The average deal size is substantially higher for short TBD transactions<br />
(a difference of almost $40 million), but this difference likely driven by a few large<br />
transactions, because <strong>the</strong> median deal sizes are comparable.<br />
[Table IV About Here]<br />
18
B.4. Econometric Specifications<br />
Proposition 1 establishes testable empirical predictions about <strong>the</strong> sign of <strong>the</strong> relation<br />
between <strong>the</strong> TBD and <strong>the</strong> DON depending on whe<strong>the</strong>r <strong>the</strong> experience building or memory loss<br />
part of <strong>the</strong> learning curve is at play. But Proposition 1 is silent about <strong>the</strong> shape of <strong>the</strong> relation<br />
between <strong>the</strong> TBD and <strong>the</strong> DON. We investigate this issue in Figure 3 for <strong>the</strong> All Transactions<br />
Sample (129,400 deals, see Table III, Panel C) and <strong>the</strong> sub-sample of Large Transactions<br />
(22,453 transactions with deal size above $50 million). Panel A presents a scatter plot<br />
between <strong>the</strong> abnormal TBDC and <strong>the</strong> DON. Panel B reports <strong>the</strong> corresponding fitted values<br />
<strong>from</strong> a Gaussian kernel regression (using 255 kernels for <strong>the</strong> All Transactions Sample and 157<br />
kernels for <strong>the</strong> Large Transactions Sample). Panel C displays <strong>the</strong> fitted values <strong>from</strong> a linear<br />
and a quadratic model.<br />
Panels A (<strong>the</strong> data cloud) and B (<strong>the</strong> non-parametric regression fitted values) clearly<br />
highlights <strong>the</strong> non-linear relation between <strong>the</strong> abnormal TBD and <strong>the</strong> DON. The convex shape<br />
is captured by <strong>the</strong> quadratic model (Panel C). We adopt <strong>the</strong>refore <strong>the</strong> following specification:<br />
19<br />
, (8)<br />
where i is <strong>the</strong> acquisition index, j is <strong>the</strong> firm index, and is <strong>the</strong> firm-fixed effect that captures<br />
unobservable factors constant through time. Successive transactions by a given acquirer are<br />
indeed not independent observations. We control for this potential source of correlation<br />
among observations by using a fixed-effect panel data specification. The section on<br />
robustness checks reports additional results using a pooled estimator and clustered standard<br />
errors (Petersen (2009); Thompson (2011)).<br />
C. Results<br />
[Figure 3 About Here]<br />
Our main results, <strong>the</strong> estimation of Equation (8), are reported in Table V. The dependent<br />
variable is <strong>the</strong> industry-adjusted abnormal TBDC. The first column in Panel A of Table V
summarizes <strong>the</strong> main sample results for 129,400 observations. 11 These observations involve<br />
38,887 unique acquirers, for an average of 3.3 observations per acquirer. Fixed-effect<br />
coefficients are <strong>the</strong>refore not included in Table V (<strong>the</strong>re are 38,887). The Fisher statistic is<br />
highly significant, with a value of 82.54 (despite <strong>the</strong> large number of estimated coefficients).<br />
The DON variable is negatively related to <strong>the</strong> abnormal TBDC, with a statistically significant<br />
coefficient estimate of –3.831. The estimated coefficient of <strong>the</strong> squared term (DON²) is<br />
positive with a value of 0.015 and statistically significant. These coefficient estimates confirm<br />
<strong>the</strong> convex relation between <strong>the</strong> abnormal TBDC and <strong>the</strong> DON, even after controlling for<br />
acquirer fixed effects. The behavior of <strong>the</strong> abnormal TBDC starts by a decreasing phase. From<br />
<strong>the</strong> second deal to <strong>the</strong> fifth deal (80% of <strong>the</strong> sample, see Table II), <strong>the</strong> decrease in TBDC is on<br />
average 15 days. The average abnormal TBDC <strong>from</strong> deal number 2 to deal number 5 is 330<br />
days (see Table III, Panel C). The abnormal TBDC decreases <strong>the</strong>refore by 4.5% on average<br />
during this phase.<br />
[Table V About Here]<br />
Proposition 1 allows us to infer <strong>the</strong> existence of learning gains <strong>from</strong> <strong>the</strong> relation between<br />
<strong>the</strong> TBD and <strong>the</strong> DON. Proposition 1 predictions are however conditional on <strong>the</strong> sign of <strong>the</strong><br />
learning curve slope. To empirically identify experience building situations (i.e., learning is<br />
increasing in <strong>the</strong> TBD, see Figure 1) and memory loss situations (i.e., learning is decreasing in<br />
<strong>the</strong> TBD, see Figure 1), we use <strong>the</strong> short TBD (in column 2 of Table V) and long TBD<br />
subsamples (in column 3 of Table V), respectively. For <strong>the</strong> short TBD subsample in column 2,<br />
<strong>the</strong> DON coefficient is negative and statistically significant with a value of –2.374, while <strong>the</strong><br />
coefficient of <strong>the</strong> squared term is positive and statistically significant with a value of 0.009.<br />
This result indicates that learning gains increases <strong>from</strong> deal to deal in experience building<br />
situations. For <strong>the</strong> long TBD subsample in column 3, <strong>the</strong> DON variable has a highly<br />
11 This number of observations may appear as a significant reduction in sample size relative to <strong>the</strong> 321,610<br />
transactions identified in Table I. But we need at least two transactions to compute <strong>the</strong> TBD, and 179,057<br />
transactions are for <strong>the</strong> first deal (see Table II).<br />
20
significant positive coefficient of 2.423 and <strong>the</strong> squared term has a highly significant negative<br />
coefficient of –0.010. This inversion in <strong>the</strong> sign of <strong>the</strong> relation between <strong>the</strong> abnormal TBDC<br />
and <strong>the</strong> DON <strong>from</strong> experience building to memory loss confirms that learning gains are<br />
increasing through <strong>the</strong> deal sequence in both situations.<br />
An increasing TBD <strong>from</strong> deal to deal for <strong>the</strong> long TBD subsample is moreover not<br />
consistent with an overconfidence- or hubris-based explanation in deal making, since<br />
overconfident or hubris-infected CEOs are known to be more acquisitive and aggressive<br />
during <strong>the</strong> bidding process (Roll (1986); Malmendier and Tate (2008); Aktas, de Bodt, and<br />
Roll (2009)). There are no clear reasons why <strong>the</strong> effect of overconfidence would revert<br />
between short and long TBD subsamples. Our results <strong>the</strong>refore bring a strong support to <strong>the</strong><br />
learning hypo<strong>the</strong>sis.<br />
The results in columns 2 and 3 refer to subsamples formed by selecting observations on<br />
<strong>the</strong> dependent variable (TBDC). This procedure might raise concerns about endogenous<br />
subsampling, but our aim is not to generalize <strong>the</strong>se results to <strong>the</strong> whole population of<br />
transactions (which are in column 1). Ra<strong>the</strong>r, columns 2 and 3 offer direct tests of Proposition<br />
1. We note finally that <strong>the</strong> results for <strong>the</strong> full sample seem driven mainly by <strong>the</strong> short TBDC<br />
subsample: in both cases, <strong>the</strong> relation between <strong>the</strong> abnormal TBDC and <strong>the</strong> DON is decreasing<br />
and convex.<br />
These results pertain to a long period of time (1992 to 2009), and it is possible that<br />
acquirers undertaking a few transactions (e.g., 2 or 3) over a 18-year period are not really<br />
implementing acquisitions programs (Schipper and Thompson (1983)). Therefore, to refine<br />
our analysis, Panel B of Table V reports results for a subsample of acquisitions sequences that<br />
clearly reflect acquisitions programs, according to two criteria. First, <strong>the</strong> acquirer must remain<br />
quiet for 24 months (no acquisition attempts in our main sample), similar to Song and<br />
Walkling’s (forthcoming) dormant period (though <strong>the</strong>y use a period of 12 months). This<br />
21
makes it likely that we capture <strong>the</strong> starts of new acquisitions programs. Second, <strong>the</strong> maximum<br />
time elapsed between two successive transactions is 6 months and thus includes only<br />
sequences of related (or at least close to each o<strong>the</strong>r) transactions. With respect to our main<br />
sample, in which <strong>the</strong> median TBD is 174 days (see Panel A, Table III), we select only<br />
sequences of short TBD transactions. In comparison, Fuller, Netter, and Stegemoller (2002)<br />
demand that “<strong>the</strong> acquirer completes bids for five or more targets in any three-year window<br />
during <strong>the</strong> sample period” (p. 1771), which implies a six-month maximum average time<br />
between transactions for <strong>the</strong> window of three years. Their criterion is thus somewhat less<br />
strict than ours, because we apply <strong>the</strong> six-month threshold on a transaction-by-transaction<br />
basis.<br />
The results in Panel B of Table V confirm our initial evidence: <strong>the</strong> DON coefficient is<br />
negative and statistically significant with a value of –71.311, while <strong>the</strong> coefficient of <strong>the</strong><br />
squared term is positive and statistically significant with a value of 1.211. The value of <strong>the</strong><br />
DON coefficient (in absolute terms) is almost 20 times higher than <strong>the</strong> coefficients reported in<br />
Panel A of Table V for <strong>the</strong> total sample (column 1). This result indicates that <strong>the</strong> decrease in<br />
<strong>the</strong> TBDC through <strong>the</strong> deal sequence for <strong>the</strong> acquisitions programs subsample is even more<br />
supportive of <strong>the</strong> learning hypo<strong>the</strong>sis. Perhaps acquirers starting an acquisitions program<br />
focus more on putting learning processes into place throughout <strong>the</strong>ir organization as<br />
emphasized by consulting firms and <strong>the</strong> business press (see, e.g., Ashkenas, DeMonace, and<br />
Francis (1998); Harding and Rovit (2004)). The impact of learning on <strong>the</strong> abnormal TBDC for<br />
acquisition programs is remarkable: <strong>from</strong> deal number 2 to deal number 3, <strong>the</strong> average<br />
abnormal TBDC shrinks by 65 days. This corresponds to a 20% reduction with respect to <strong>the</strong><br />
sample average abnormal TBDC of 330 days (see Panel C of Table III).<br />
Are our results driven essentially by small transactions? One might in particular argue<br />
that acquisition benefits captured in small deals do not transpose to large and complex<br />
22
transactions, even if <strong>the</strong> business press argues that doing small acquisitions is a route to<br />
organizational learning (Harding and Rovit (2004)). Panel C of Table V focuses on large<br />
transactions with deal size above $50 million. Estimated coefficients for <strong>the</strong> all sample<br />
(22,648 observations, column 1) and <strong>the</strong> short TBD subsample (10,231 observations, column<br />
2) are close to estimations obtained for <strong>the</strong> main sample (Table V, Panel A). For <strong>the</strong> long TBD<br />
subsample, <strong>the</strong> coefficient estimates of <strong>the</strong> linear and squared term keep <strong>the</strong> same signs as for<br />
<strong>the</strong> main sample (Table V, Panel A, column 3) but lose <strong>the</strong>ir statistical significance. For large<br />
transactions <strong>the</strong>refore, <strong>the</strong> increase in learning through <strong>the</strong> deal sequence is confirmed for<br />
experience building situations but not for memory loss ones. The costs associated with<br />
memory loss are probably higher for such large deals, lowering incentives to delay <strong>the</strong><br />
subsequent acquisitions.<br />
III. Robustness Checks<br />
This section checks <strong>the</strong> robustness of our results with respect to various potential issues,<br />
including <strong>the</strong> computation of <strong>the</strong> TBD, <strong>the</strong> sample composition, <strong>the</strong> financial resources<br />
committed to acquisitions, <strong>the</strong> correlation between successive observations for a given<br />
acquirer, and <strong>the</strong> threshold chosen to indentify short and long TBD deals. For brevity, results<br />
are given only for <strong>the</strong> main sample (i.e., <strong>the</strong> sample discussed in column 1, Panel A, Table<br />
V). 12<br />
A. TBD Computation<br />
The results in Table V are based on <strong>the</strong> TBDC, <strong>the</strong> number of days between <strong>the</strong> current<br />
transaction announcement date and <strong>the</strong> completion date of <strong>the</strong> most recent transaction (see<br />
Figure 2). An alternative computation would use <strong>the</strong> number of days between successive<br />
announcement dates (TBDA). The first column of Table VI provides <strong>the</strong> results when TBDA is<br />
12 The full set of results are available on request.<br />
23
<strong>the</strong> dependent variable. The coefficients of <strong>the</strong> DON variable and its squared term are highly<br />
significant and very close to <strong>the</strong> values reported in Panel A of Table V (column 1). Hence,<br />
defining <strong>the</strong> time elapsed between two successive deals, commencing with <strong>the</strong> announcement<br />
date or <strong>the</strong> completion date of <strong>the</strong> previous deal, does not affect <strong>the</strong> results.<br />
[Table VI About Here]<br />
The range of <strong>the</strong> TBDC is large (<strong>from</strong> 1 to 6,430 days in <strong>the</strong> main sample). We check<br />
whe<strong>the</strong>r <strong>the</strong> results are affected by using <strong>the</strong> natural logarithm of <strong>the</strong> TBDC before computing<br />
<strong>the</strong> abnormal TBDC. The second column of Table VI displays <strong>the</strong> results. The coefficients of<br />
<strong>the</strong> DON variable and its squared term are again respectively negative (–0.027) and positive<br />
(0.001), both coefficients are highly significant.<br />
We also compute <strong>the</strong> industry median–adjusted TBDC using <strong>the</strong> two-digit ra<strong>the</strong>r than <strong>the</strong><br />
three-digit SIC code. The results are in column 3 of Table VI. Our results are almost<br />
unaffected by this change.<br />
In column 4 of Table VI, we finally assess <strong>the</strong> robustness of <strong>the</strong> results by computing <strong>the</strong><br />
abnormal TBD using a regression-based approach. We start by regressing <strong>the</strong> TBDC on a set<br />
of industry- and market-wide determinants: HHI, industry concentration (i.e., <strong>the</strong> Herfindahl-<br />
Hirschman index for firms with a given three-digit SIC code, computed using firm total assets<br />
reported in <strong>the</strong> Compustat database); Median Firm Size, (estimated using firm market value<br />
<strong>from</strong> <strong>the</strong> CRSP database); Median ROA, <strong>the</strong> industry median return on assets; Median Growth<br />
Rate, <strong>the</strong> industry median sales-based growth rate; Liquidity, <strong>the</strong> liquidity index introduced by<br />
Schlingemann, Stulz, and Walkling (2002) to capture <strong>the</strong> intensity of corporate asset<br />
transactions within an industry; Aggregate Market-to-Book, <strong>the</strong> aggregate market-to-book<br />
ratio; and C&I spread, <strong>the</strong> commercial and industrial loan rate spreads used by Harford<br />
24
(2005). 13 All <strong>the</strong>se variables are measured as of year-end when <strong>the</strong> transaction was<br />
announced. The first-step regression is <strong>the</strong>refore:<br />
25<br />
, (9)<br />
where i is <strong>the</strong> acquisition index, j is <strong>the</strong> firm index, and Ind and Year are <strong>the</strong> corresponding<br />
industry and year indices, respectively.<br />
TBDC:<br />
where<br />
The residuals of this first-step regression become our new measure of <strong>the</strong> abnormal<br />
̂ is <strong>the</strong> fitted value <strong>from</strong> Equation (9).<br />
̂ , (10)<br />
The estimation results for Equation (9), in Panel A of Table VII, refer to a sample of<br />
136,910 observations. All coefficients are highly significant except <strong>the</strong> M&A market liquidity<br />
index. The TBDC is increasing with industry concentration, industry median firm size, and<br />
industry median ROA. These three variables seem to characterize industries with fewer<br />
transaction opportunities. The median industry growth variable instead reveals a negative<br />
coefficient: growing industries offer more opportunities for acquirers. The C&I Spread has a<br />
positive and statistically significant coefficient, which indicates that, consistent with Harford<br />
(2005), tighter financing conditions slow down M&A market activity. Surprisingly, <strong>the</strong><br />
aggregate market-to-book ratio has also a positive and significant coefficient. Periods of high<br />
valuations may delay acquisition activity if targets are more expensive or if <strong>the</strong>re is more<br />
potential competition in <strong>the</strong> M&A market (see Aktas, de Bodt, and Roll (2010)).<br />
Column 4 of Table VI, provides <strong>the</strong> results obtained with <strong>the</strong> regression-adjusted<br />
abnormal TBDC. The coefficients of <strong>the</strong> DON variable and its squared term are respectively<br />
13 http://www.federalreserve.gov/releases/e2/e2chart.htm.
negative (–7.17) and positive (0.022), both highly statistically significant. The coefficient of<br />
<strong>the</strong> linear term is moreover almost two times larger (in absolute value) than <strong>the</strong> coefficient<br />
estimated with <strong>the</strong> industry median–adjusted TBDC (column 1, Panel A, Table V). We<br />
<strong>the</strong>refore consider <strong>the</strong> results in Table V cautious estimates with respect to <strong>the</strong> procedure<br />
chosen to adjust <strong>the</strong> TBDC to industry- and market-wide determinants.<br />
Ano<strong>the</strong>r concern that might be raised about <strong>the</strong> computation of <strong>the</strong> TBDC is <strong>the</strong> presence<br />
of a private part in <strong>the</strong> M&A process, as recently emphasized by Boone and Mulherin (2007).<br />
The issue is potentially serious, because private negotiations between parties make <strong>the</strong><br />
announcement date an imperfect measure of <strong>the</strong> transaction starting point. If this measurement<br />
error is correlated with our independent variable, we face an endogenous errors-in-variables<br />
problem. We check it using a sample of 1,573 transactions for which we collected <strong>the</strong> length<br />
of <strong>the</strong> private process by hand, using <strong>the</strong> SEC filings S4 and 14D for mergers and 14A for<br />
tender offers (see also Aktas, de Bodt, and Roll (2010)). This sample of M&A transactions<br />
spanned 1994–2007 among U.S. listed firms, featured a minimum deal size of $100 million,<br />
and required that <strong>the</strong> percentage held by <strong>the</strong> acquirer was less than 50% before <strong>the</strong> deal<br />
announcement and more than 50% after its completion. The private process length is <strong>the</strong> time<br />
elapsed, in days, between <strong>the</strong> initiation of <strong>the</strong> takeover process and <strong>the</strong> announcement date of<br />
<strong>the</strong> takeover agreement. For <strong>the</strong>se 1,573 transactions, we regress <strong>the</strong> private process length on<br />
<strong>the</strong> DON variable (computed using our main sample):<br />
where i is <strong>the</strong> acquisition index, and j is <strong>the</strong> firm index.<br />
26<br />
, (11)<br />
Panel B of Table VII features <strong>the</strong> estimation results for Equation (11). The DON<br />
coefficient is negative (–0.15) but not statistically significant (t-stat = –0.43). We thus
conclude that private process-generated errors in <strong>the</strong> TBD variable are mainly innocuous noise<br />
that might affect test power but do not influence our inferences. 14<br />
B. Sample Composition<br />
[Table VII About Here]<br />
The main sample includes transactions classified by SDC as acquisitions of assets,<br />
majority of interest, certain assets, remaining interests, and exchange offers, as well as those<br />
strictly classified as mergers or acquisitions. This choice is motivated by <strong>the</strong> goal of<br />
computing <strong>the</strong> DON variable as precisely as possible and to study <strong>the</strong> M&A market as a<br />
whole. However, including transactions not clearly identified as mergers or acquisitions may<br />
raise questions about <strong>the</strong> real nature of <strong>the</strong> observed phenomena. It also limits <strong>the</strong> possibility<br />
of including control variables in multivariate analyses (though <strong>the</strong> fixed-effect panel estimator<br />
controls for acquirer characteristics that are stable through time). None<strong>the</strong>less, <strong>the</strong> robustness<br />
of <strong>the</strong> results presented thus far can be checked against sampling choices by studying three<br />
subsamples: (1) transactions classified as mergers or acquisitions in <strong>the</strong> SDC database (M&A<br />
subsample); (2) transactions classified as mergers or acquisitions in <strong>the</strong> SDC database and for<br />
which <strong>the</strong> following control variables are available: horizontal transaction (acquirer and target<br />
in <strong>the</strong> same four-digit SIC code industry), private target, deal size, and U.S. target (M&A<br />
subsample with controls); and (3) acquirers that completed at least five transactions during<br />
1992–2009 (repetitive acquirers subsample).<br />
Panel A of Table VIII reports on <strong>the</strong> M&A subsample (column 1). The subsample<br />
includes 17,655 transactions and produces a negative (–14.68) and positive (0.13) coefficient<br />
estimates for <strong>the</strong> linear and <strong>the</strong> squared term, respectively. Both coefficients are statistically<br />
14 It could be argued that <strong>the</strong> private part in <strong>the</strong> M&A process generates signed errors in <strong>the</strong> TBDC computation,<br />
because <strong>the</strong> announcement date by definition is <strong>the</strong> last day of <strong>the</strong> private period. Signed errors of measurement<br />
might also be a source of an estimation bias, but this concern only holds for <strong>the</strong> TBDC variable. For <strong>the</strong> TBDA<br />
variable, <strong>the</strong> errors of measurement may be positive or negative. Column 1 of Table VI shows that <strong>the</strong> TBDC and<br />
<strong>the</strong> TBDA give similar results.<br />
27
significant. The DON coefficient is moreover four times higher (in absolute value) than <strong>the</strong><br />
estimate obtained with <strong>the</strong> main sample (–3.831, see column 1, Panel A, Table V). Adding <strong>the</strong><br />
control variables in column 2 reduces <strong>the</strong> sample to 12,769 observations (column 2) but leads<br />
to <strong>the</strong> same conclusions. For <strong>the</strong> sake of brevity, <strong>the</strong> coefficients of <strong>the</strong> control variables are<br />
not reported, because none of <strong>the</strong>m is significant. Focusing on repetitive acquirers in column<br />
3 generates a sample of 84,637 observations. Almost <strong>the</strong> same coefficient estimates are<br />
obtained for <strong>the</strong> linear and squared term as in <strong>the</strong> main sample. These results toge<strong>the</strong>r confirm<br />
that <strong>the</strong> results presented thus far do not depend on sampling choices.<br />
C. Financial Resources Committed to <strong>Acquisitions</strong><br />
A potential shortcoming of <strong>the</strong> model in Section I relates to financial resources<br />
committed to acquisitions. A key characteristic of M&A transactions is <strong>the</strong> deal size (Fuller,<br />
Netter, and Stegemoller (2002)), which <strong>the</strong> <strong>the</strong>oretical analysis presented in Section I ignores.<br />
Yet one may suspect relations among deal size, acquisition benefits, and integration costs. In<br />
particular, integration costs should increase with deal size, and undertaking small acquisitions<br />
may be a good path to mastering <strong>the</strong> acquisition process (Harding and Rovit (2004)). To<br />
check whe<strong>the</strong>r omitting <strong>the</strong> financial resources committed to acquisitions affects our results,<br />
we replace <strong>the</strong> DON variable by <strong>the</strong> cumulative deal size through <strong>the</strong> acquisition sequence:<br />
28<br />
, (12)<br />
where i is <strong>the</strong> acquisition index, j is <strong>the</strong> firm index, and Cumulative Deal Sizei,j is <strong>the</strong><br />
cumulative deal size <strong>from</strong> <strong>the</strong> first to <strong>the</strong> most recent transaction i – 1 for acquirer j. If <strong>the</strong> deal<br />
size is not reported by SDC, <strong>the</strong> transaction is skipped, such that <strong>the</strong> real amount of financial<br />
resources committed is underestimated .<br />
Column 1 in Panel B of Table VIII contains <strong>the</strong> results. The coefficient of <strong>the</strong> cumulative<br />
deal size variable is negative (–0.002) and highly significant (p-value = 0.00). Taking into
account financial resources committed to <strong>the</strong> sequence of acquisitions thus does not change<br />
<strong>the</strong> conclusions.<br />
Do integration costs increase with deal size, as intuition would suggest? To test whe<strong>the</strong>r it<br />
is <strong>the</strong> case, <strong>the</strong> deal size of <strong>the</strong> most recent transactions (when available) is used in<br />
replacement of <strong>the</strong> cumulative deal size. Panel B of Table VIII reports <strong>the</strong> result (see column<br />
2). The lagged deal size coefficient is positive (0.002) and significant (p-value = 0.03),<br />
suggesting that following a larger transaction, <strong>the</strong> acquirer takes more time before undertaking<br />
its next acquisition attempt. This result is consistent with <strong>the</strong> notion of increasing integration<br />
costs with deal size, as expected. The change of sign between <strong>the</strong> cumulative and lagged deal<br />
size coefficients is also indicative of <strong>the</strong> importance of learning during acquisitions sequences.<br />
The increase in learning is significant enough to overcome <strong>the</strong> increases in integration costs<br />
due to <strong>the</strong> accumulation of transactions.<br />
D. Correlation of Observations<br />
[Table VIII About Here]<br />
Because successive transactions by an acquirer are not independent observations, a fixed-<br />
effect panel estimator is used to generate <strong>the</strong> results reported in Tables V, VI, and VIII. To<br />
check <strong>the</strong> robustness of <strong>the</strong> results against this choice, Panel C of Table VIII reports results<br />
obtained using <strong>the</strong> standard pooled ordinary least square (OLS) estimator with asymptotic<br />
standard error (column 1) and clustered standard error (column 2), as suggested by Petersen<br />
(2009) and Thompson (2011).<br />
The classic pooled OLS estimator yields a negative estimate for <strong>the</strong> DON coefficient<br />
(–18.330) and a positive one for <strong>the</strong> squared term (0.093), confirming <strong>the</strong> results obtained<br />
with <strong>the</strong> fixed-effect panel estimator. Both coefficients are highly significant whe<strong>the</strong>r we rely<br />
on an asymptotic or clustered standard error.<br />
29
E. Short versus Long TBD Threshold<br />
Hayward (2002) argues that successive acquisitions that are too close to each o<strong>the</strong>r do not<br />
allow experience building processes to take place, but acquisitions that are too distant in time<br />
hamper organizational learning by creating memory losses (see Figure 1). Up to now, <strong>the</strong><br />
identification of experience building (memory loss) situations relies on <strong>the</strong> use of <strong>the</strong><br />
subsample of transactions with abnormal TBD below (above) <strong>the</strong> sample median. We check<br />
<strong>the</strong> robustness of our results to this choice by replicating our analysis using a subsampling<br />
procedure based on <strong>the</strong> sample first and third quartile. In Panel D of Table VIII, <strong>the</strong> short TBD<br />
subsample (column 1) includes observations with abnormal TBD below <strong>the</strong> sample first<br />
quartile, while <strong>the</strong> long TBD subsample (column 2) includes observations with abnormal TBD<br />
above <strong>the</strong> sample third quartile. The estimated coefficients reported in Panel D of Table VIII<br />
remain consistent with our main results (Table V, Panel A, columns 2 and 3). Only <strong>the</strong><br />
coefficient of <strong>the</strong> squared term for <strong>the</strong> long TBD subsample loses its significance.<br />
IV. Conclusions<br />
Acquirers that undertake sequences of acquisitions may capture acquisition benefits <strong>from</strong><br />
deal to deal, but <strong>the</strong>y also are potentially exposed to integration costs that become larger<br />
impediments with more deals. We study this trade-off. But because acquisition benefits and<br />
integration costs are not directly observable <strong>from</strong> outside <strong>the</strong> firm, we model <strong>the</strong> acquirer’s<br />
decision to undertake new transactions as a function of <strong>the</strong> time elapsed since its previous<br />
acquisition (TBD). The model’s main result is a testable empirical prediction that relates TBD<br />
in acquisitions sequences to learning gains (i.e., <strong>the</strong> relative importance of variations in<br />
acquisition benefits and integration costs due to organizational learning processes).<br />
Computing <strong>the</strong> TBD imposes minimal data requirements (i.e., only acquirer identity and<br />
announcement date). Thus, one can observe TBD for <strong>the</strong> all acquisitions in <strong>the</strong> entire M&A<br />
30
market during 1992–2009, more than 300,000 transactions. The empirical evidence uncovers<br />
a clear and significant decrease in <strong>the</strong> TBD during acquisitions sequences. This negative trend<br />
in <strong>the</strong> TBD is consistent with <strong>the</strong> learning hypo<strong>the</strong>sis.<br />
To <strong>the</strong> best of our knowledge, this paper is <strong>the</strong> first to address <strong>the</strong> importance of learning<br />
for a sample that is not potentially biased by selection criteria. Our results have potentially<br />
important managerial implications. They reveal <strong>the</strong> importance of learning-by-doing through<br />
repetitive acquisitions and emphasize <strong>the</strong> need to implement organizational structures<br />
designed to encourage and develop learning capabilities as much as possible.<br />
References<br />
Ahern, Kenneth R., 2010, Q-<strong>the</strong>ory and acquisition returns, Working Paper, Available at<br />
SSRN: http://ssrn.com/abstract=970345.<br />
Aktas, Nihat, Eric de Bodt, and Richard Roll, 2009, <strong>Learning</strong>, hubris and corporate serial<br />
acquisitions, Journal of Corporate Finance 15, 523–626.<br />
Aktas, Nihat, Eric de Bodt, and Richard Roll, 2010, Negotiations under <strong>the</strong> threat of an<br />
auction. Journal of Financial Economics 98, 241–255.<br />
Arrow, Kenneth J., 1962, The economic implications of learning by doing, Review of<br />
Economic Studies 29, 155–173.<br />
Ashkenas, Ronald N., Lawrence J. DeMonaco, and Suzanne C. Francis, 1998. Making <strong>the</strong><br />
deal real: How GE Capital integrates acquisitions, Harvard Business Review 76: 165–178.<br />
Barkema, Harry G., and Mario Schijven, 2008, How do firms learn to make acquisitions? A<br />
review of past research and an agenda for <strong>the</strong> future, Journal of Management 34, 594–634.<br />
Betton, Sandra, B. Espen Eckbo, and Karin S. Thorburn, 2008, Corporate takeovers, in B.<br />
Espen Eckbo, ed.: Handbook of Corporate Finance, Empirical Corporate Finance Volume 2<br />
(Elsevier, North Holland, Amsterdam), pp. 291–429.<br />
Billett, Mat<strong>the</strong>w T., and Yiming Qian, 2008, Are overconfident managers born or made?<br />
Management Science 54, 1037–1051.<br />
Boone, Andra L., and J. Harold Mulherin, 2007, How are firms sold? Journal of Finance 62,<br />
847–876.<br />
Chatterjee, Sayan, Michael H. Lubatkin, David M. Schweiger, and Yaakov Weber, 1992,<br />
Cultural differences and shareholder value in related mergers: Linking equity and human<br />
capital, Strategic Management Journal 13, 319–334.<br />
Datta, Deepark K., 1991, Organizational fit and acquisition performance: Effects of postacquisition<br />
integration, Strategic Management Journal 12, 281–297.<br />
31
Ellis, Jesse A., Sara B. Moeller, Frederik P. Schlingemann, and René M. Stulz, 2011,<br />
Globalization, governance, and <strong>the</strong> returns to cross-border acquisitions, Working Paper,<br />
Available at SSRN: http://ssrn.com/abstract=1734308.<br />
Erel, Isil, Rose C. Liao, and Michael S. Weisbach, forthcoming, Determinants of cross-border<br />
mergers and acquisitions, Journal of Finance.<br />
Fuller, Kathleen, Jeffry M. Netter, and Mike Stegemoller, 2002, What do returns to acquiring<br />
firms tell us? <strong>Evidence</strong> <strong>from</strong> firms that make many acquisitions, Journal of Finance 57,<br />
1763–1793.<br />
Grinstein, Yaniv, and Paul Hribar, 2004, CEO compensation and incentives: <strong>Evidence</strong> <strong>from</strong><br />
M&A bonuses, Journal of Financial Economics 71, 119–143.<br />
Harding, David, and Sam Rovit, 2004, Building deals on bedrock, Harvard Business Review<br />
82, 121–128.<br />
Harford, Jarrad, 2005, What drives merger waves? Journal of Financial Economics 77, 529–<br />
560.<br />
Hayward, Ma<strong>the</strong>w, 2002, When do firms learn <strong>from</strong> <strong>the</strong>ir acquisition experience? <strong>Evidence</strong><br />
<strong>from</strong> 1990-1995, Strategic Management Journal 23, 21–39.<br />
Hitt, Michael A., Jeffrey S. Harrison, and R. Duane Ireland, 2001. Mergers and acquisitions:<br />
A guide to creating value for stakeholders (Oxford University Press, New York).<br />
Kaplan, Steven N., Mark L. Mitchell, and Karen H. Wruck, 2000, A clinical exploration of<br />
value creation and destruction in acquisitions, organizational design, incentives, and internal<br />
capital markets, in Steven N. Kaplan, ed.: Mergers and Productivity (University of Chicago<br />
Press), pp. 179–238.<br />
Larsson, Rikard, and Sydney Finkelstein, 1999, Integrating strategic, organizational, and<br />
human resource perspectives on mergers and acquisitions: A case survey of synergy<br />
realization, Organization Science 10, 1–26.<br />
Malmendier, Ulrike, and Geoffrey Tate, 2008, Who makes acquisitions? CEO overconfidence<br />
and <strong>the</strong> market's reaction, Journal of Financial Economics 89, 20-43.<br />
Mitchell, Mark L., and J. Harold Mulherin, 1996, The impact of industry shocks on takeover<br />
and restructuring activity, Journal of Financial Economics 41, 193–229.<br />
Moeller, Sara B., Frederik P. Schlingemann, and René M. Stulz, 2005, Wealth destruction on<br />
a massive scale? A study of acquiring-firm returns in <strong>the</strong> recent merger wave, Journal of<br />
Finance 60, 757–782<br />
Netter, Jeffry M., Mike Stegemoller, and M. Babajide Wintoki, forthcoming, Implications of<br />
data screens on merger and acquisition analysis: A large sample study of mergers and<br />
acquisitions <strong>from</strong> 1992-2009, Review of Financial Studies.<br />
Petersen, Mitchell A., 2009, Estimating standard errors in finance panel data sets: Comparing<br />
approaches, Review of Financial Studies 22, 435–480.<br />
Roll, Richard, 1986, The hubris hypo<strong>the</strong>sis of corporate takeovers, Journal of Business 59,<br />
197–216.<br />
Schipper, Ka<strong>the</strong>rine, and Rex Thompson R., 1983, <strong>Evidence</strong> on <strong>the</strong> capitalized value of<br />
merger activity for acquiring firms, Journal of Financial Economics 11, 85–119.<br />
Schlingemann, Frederik P., René M. Stulz, and Ralph A. Walkling, 2002, Divestitures and <strong>the</strong><br />
liquidity of <strong>the</strong> market for corporate assets, Journal of Financial Economics 64, 117–144.<br />
32
Song, Moon H., and Ralph A. Walkling, forthcoming, Anticipation, acquisitions and bidder<br />
returns: Industry shocks and <strong>the</strong> transfer of information across rivals, Review of Financial<br />
Studies.<br />
Thompson, Samuel B., 2011, Simple formulas for standard errors that cluster by both firm<br />
and time, Journal of Financial Economics 99, 1–10.<br />
Weber, Roberto A., and Colin F. Camerer, 2003, Cultural conflict and merger failure: An<br />
experimental approach, Management Science 49, 400–415.<br />
33
Figure 1: <strong>Learning</strong> Function<br />
Following Hayward (2002), this figure depicts learning gains ( ) for a given deal attempt as a<br />
function of <strong>the</strong> time elapsed since <strong>the</strong> previous deal (TBD).<br />
𝑳 𝒅<br />
Experience<br />
building<br />
𝑇𝐵𝐷 ̅̅̅̅̅̅<br />
34<br />
Memory<br />
Loss<br />
TBD
Figure 2: <strong>Time</strong> Between Deal Computation<br />
Figure 2 provides a graphic depiction of <strong>the</strong> computation of <strong>the</strong> time between successive deals as <strong>the</strong><br />
difference between (a) <strong>the</strong> current transaction announcement date and <strong>the</strong> previous transaction<br />
completion date (TBDC) and (b) announcement dates of successive transactions (TBDA).<br />
Previous deal<br />
announcement<br />
date<br />
Previous deal<br />
completion<br />
date<br />
35<br />
Current deal<br />
private process<br />
Current deal<br />
announcement<br />
date<br />
=<br />
Current deal announcement date – previous<br />
deal completion date<br />
=<br />
Current deal announcement date – previous<br />
deal announcement date
Figure 3: <strong>Time</strong> Between Deal versus Deal Order Number Relation<br />
Figure 3 plots <strong>the</strong> relation between <strong>the</strong> abnormal time between successive deals (TBDC – vertical axis)<br />
and <strong>the</strong> number of deals already completed by <strong>the</strong> firm (DON – horizontal axis). TBDC is <strong>the</strong><br />
difference (in days) between <strong>the</strong> current deal announcement date and <strong>the</strong> most recent deal completion<br />
date. To compute <strong>the</strong> abnormal TBDC, we remove <strong>the</strong> median TBDC of <strong>the</strong> industry <strong>from</strong> <strong>the</strong> firm’s<br />
TBDC (see Section II.B for variable definitions). The All Transactions Sample (left column) is<br />
composed of 129,400 observations. The Large Transactions Sample (right column) is limited to<br />
22,453 transactions with deal size above $50 million (see Section II.A for sample description). Panel<br />
A is a scatter plot of <strong>the</strong> data cloud. Panel B presents <strong>the</strong> output of Gaussian kernel regression (255<br />
kernels for <strong>the</strong> All Transactions Sample and 157 kernels for <strong>the</strong> Large Transactions Sample). Panel C<br />
displays <strong>the</strong> corresponding fitted values <strong>from</strong> a linear and a quadratic model.<br />
Panel A. Scatter plot of <strong>the</strong> data cloud<br />
6000<br />
5000<br />
4000<br />
3000<br />
2000<br />
1000<br />
-2000<br />
-3000<br />
All Transactions Sample Large Transactions Sample<br />
0<br />
0 20 40 60 80 100 120 140 160<br />
-1000<br />
Panel B. Non-parametric estimations<br />
500<br />
400<br />
300<br />
200<br />
100<br />
0<br />
-100<br />
-200<br />
All Transactions Sample Large Transactions Sample<br />
Panel C. Parametric estimations<br />
2000<br />
1500<br />
1000<br />
500<br />
1<br />
12<br />
23<br />
34<br />
45<br />
56<br />
67<br />
78<br />
89<br />
100<br />
111<br />
122<br />
133<br />
144<br />
155<br />
166<br />
177<br />
188<br />
199<br />
210<br />
221<br />
232<br />
243<br />
254<br />
Kernel(1) Kernel(3)<br />
All Transactions Sample Large Transactions Sample<br />
0<br />
-500<br />
0 50 100 150 200 250 300<br />
-1000<br />
-1500<br />
-2000<br />
-2500<br />
Linear Quadratic<br />
36<br />
7000<br />
6000<br />
5000<br />
4000<br />
3000<br />
2000<br />
1000<br />
0<br />
-1000<br />
0 50 100 150 200 250 300<br />
-2000<br />
-3000<br />
-4000<br />
600<br />
500<br />
400<br />
300<br />
200<br />
100<br />
0<br />
-100<br />
-200<br />
2000<br />
1500<br />
1000<br />
500<br />
-1000<br />
-1500<br />
-2000<br />
-2500<br />
1<br />
8<br />
15<br />
22<br />
29<br />
36<br />
43<br />
50<br />
57<br />
64<br />
71<br />
78<br />
85<br />
92<br />
99<br />
106<br />
113<br />
120<br />
127<br />
134<br />
141<br />
148<br />
155<br />
Kernel(1) Kernel(2)<br />
0<br />
-500<br />
0 50 100 150 200 250 300<br />
Linear Quadratic
Table I<br />
Acquisition Activity by Year<br />
Table I reports <strong>the</strong> annual acquisition activity of all acquirers and U.S. acquirers <strong>from</strong> 1992 to 2009.<br />
The sample includes completed transactions denoted by SDC as mergers, acquisitions, acquisitions of<br />
majority interest, acquisitions of assets, acquisitions of certain assets, acquisitions of remaining<br />
interest, and exchange offers, in which <strong>the</strong> acquirer owned less than 50% of <strong>the</strong> target prior to <strong>the</strong><br />
purchase and <strong>the</strong>n acquired a 50% stake or more. N corresponds to <strong>the</strong> number of acquisitions in each<br />
year. The aggregate deal size is <strong>the</strong> sum of all deal values for a particular year in 2008 constant dollars.<br />
Year<br />
N<br />
All Acquirers U.S Acquirers<br />
Aggregate<br />
deal size<br />
($mil)<br />
Average<br />
deal size<br />
($mil)<br />
Median<br />
deal size<br />
($mil)<br />
37<br />
N<br />
Aggregate<br />
deal size<br />
($mil)<br />
Average<br />
deal size<br />
($mil)<br />
Median<br />
deal size<br />
($mil)<br />
1992 9,691 422,543 70.44 10.00 4,042 197,888 69.97 10.60<br />
1993 9,954 523,011 77.44 10.20 4,675 310,278 92.76 12.40<br />
1994 11,422 656,947 84.13 10.88 5,533 408,685 103.39 13.08<br />
1995 14,287 1,080,137 130.14 12.84 6,538 644,792 157.27 17.60<br />
1996 15,394 1,204,267 130.05 15.00 7,622 710,880 148.78 20.78<br />
1997 18,188 1,770,847 148.38 15.07 8,970 1,086,959 182.25 21.10<br />
1998 20,630 2,765,667 216.15 16.63 10,195 1,741,123 283.96 24.95<br />
1999 21,283 3,597,271 293.16 17.65 8,709 1,634,014 330.73 29.69<br />
2000 22,124 3,336,984 276.49 17.15 8,309 1,652,025 373.14 28.00<br />
2001 17,240 1,609,742 177.07 12.82 5,994 821,470 258.69 22.50<br />
2002 15,406 1,075,634 133.41 12.91 5,633 446,576 152.30 21.70<br />
2003 16,238 1,182,574 141.98 13.74 6,245 617,541 204.56 25.00<br />
2004 18,290 1,663,072 185.92 15.65 7,093 820,407 263.86 32.30<br />
2005 21,199 2,310,680 233.41 19.00 7,863 1,132,984 339.74 34.73<br />
2006 23,174 3,019,205 290.76 21.20 8,494 1,427,557 439.99 41.00<br />
2007 24,922 3,199,357 297.54 20.07 8,510 1,209,494 397.26 39.93<br />
2008 22,392 1,651,928 198.22 14.39 6,973 564,519 267.80 23.90<br />
2009 19,776 1,139,851 165.06 9.68 5,480 605,136 349.56 18.50<br />
Total 321,610 32,209,716 126,878 16,032,329<br />
Mean 17,867 1,789,429 7,049 890,685
Table II<br />
Sample Distribution by Deal Order Number<br />
Table II provides <strong>the</strong> sample distribution by deal order number. For each firm in <strong>the</strong> sample, we sort<br />
acquisitions by announcement date, and we assign a deal order number equal to 1 for <strong>the</strong> firm’s first<br />
deal, <strong>the</strong>n increase <strong>the</strong> deal order number by one unit for each successive transaction. N and % denote,<br />
respectively, <strong>the</strong> number of acquisitions and <strong>the</strong> percentage of <strong>the</strong> sample for each deal order number.<br />
We also report <strong>the</strong> average and median deal sizes by deal order number (in millions of dollars) and <strong>the</strong><br />
average and median acquirer size (market value in millions of dollars).<br />
Deal order<br />
number<br />
N %<br />
Average<br />
deal size<br />
Median<br />
deal size<br />
Average<br />
acquirer size<br />
Median<br />
acquirer size<br />
1 179,057 55.68% 103 12 1,311 162<br />
2 40,012 12.44% 133 14 1,541 204<br />
3 21,402 6.65% 165 17 1,982 285<br />
4 13,752 4.28% 241 21 2,350 370<br />
5 9,706 3.02% 325 24 2,863 465<br />
6 7,237 2.25% 234 28 3,250 570<br />
7 5,564 1.73% 274 30 3,659 664<br />
8 4,428 1.38% 339 34 4,302 768<br />
9 3,617 1.12% 381 33 4,969 892<br />
10 3,002 0.93% 378 35 5,766 987<br />
11 2,505 0.78% 348 45 6,119 1,107<br />
12 2,148 0.67% 496 45 6,669 1,126<br />
13 1,853 0.58% 639 41 7,373 1,265<br />
14 1,600 0.50% 371 43 7,722 1,261<br />
15 1,407 0.44% 547 43 8,099 1,382<br />
16 1,228 0.38% 324 46 8,544 1,432<br />
17 1,088 0.34% 365 52 9,662 1,644<br />
18 979 0.30% 426 52 10,689 1,820<br />
19 881 0.27% 429 63 11,835 1,887<br />
20 803 0.25% 498 75 12,807 2,042<br />
21 and higher 19,341 6.01% 498 32 29,142 3,981<br />
Total 321,610 100.00%<br />
38
Table III<br />
Summary Statistics for <strong>the</strong> <strong>Time</strong> Between Successive Deals<br />
Here are summary statistics for different definitions of <strong>the</strong> time between deals (TBD) by deal order<br />
number. TBDC is <strong>the</strong> difference (in days) between <strong>the</strong> current deal announcement date and <strong>the</strong> most<br />
recent deal completion date. TBDA is <strong>the</strong> difference (in days) between <strong>the</strong> announcement dates of two<br />
successive transactions. The abnormal TBDC is <strong>the</strong> difference between <strong>the</strong> TBDC and <strong>the</strong> median<br />
TBDC in <strong>the</strong> corresponding industry/year. Panel A reports average TBDC by deal order number for<br />
ranges of values ([2-5], [6-10], [11-20], [>20]). Panels B and C report <strong>the</strong> corresponding average<br />
TBDA and abnormal TBDC, respectively. Column 1 contains average values for <strong>the</strong> sample of all<br />
observations; columns 2 and 3 display statistics for TBDs below <strong>the</strong> sample median (short TBD) and<br />
above <strong>the</strong> sample median (long TBD), respectively.<br />
Panel A. TBDC (N = 129,400)<br />
Deal order number All Short TBD Long TBD<br />
2-5 577 75 864<br />
6-10 303 70 582<br />
11-20 205 64 484<br />
>20 61 25 413<br />
Average 420 60 782<br />
Median 174 48 493<br />
Panel B. TBDA (N = 132,277)<br />
Deal order number All Short TBD Long TBD<br />
2-5 570 94 868<br />
6-10 299 81 560<br />
11-20 202 71 462<br />
>20 60 26 385<br />
Average 418 71 779<br />
Median 171 54 501<br />
Panel C. Abnormal TBDC (N = 129,400)<br />
Deal order number All Short TBD Long TBD<br />
2-5 330 –116 584<br />
6-10 85 –110 319<br />
11-20 –5 –113 209<br />
>20 –38 –57 147<br />
Average 202 –100 505<br />
Median 0 –73 252<br />
39
Table IV<br />
Summary Statistics on Deal Characteristics<br />
Here are summary statistics for <strong>the</strong> following deal characteristics: whe<strong>the</strong>r it is horizontal (in <strong>the</strong> same<br />
four-digit SIC code), whe<strong>the</strong>r <strong>the</strong> target is a private company, whe<strong>the</strong>r <strong>the</strong> target is a U.S. firm, and <strong>the</strong><br />
deal size in millions of dollars. Panel A includes all observations. Panels B and C report, respectively,<br />
for TBD below and above <strong>the</strong> sample median (short TBD and long TBD subsamples). For dummy<br />
variables, <strong>the</strong> mean indicates <strong>the</strong> proportion of deals.<br />
Panel A. Total sample<br />
Variable Number of observations Mean Median<br />
Horizontal, dummy 321,610 33%<br />
Private target, dummy 321,610 54%<br />
U.S. target, dummy 321,610 38%<br />
Deal size ($mil) 137,626 196.70 15.00<br />
Panel B. Short TBD subsample<br />
Variable Number of observations Mean Median<br />
Horizontal, dummy 69,912 26%<br />
Private target, dummy 69,912 56%<br />
U.S. target, dummy 69,912 47%<br />
Deal size ($mil) 33,341 291.83 20.90<br />
Panel C. Long TBD subsample<br />
Variable Number of observations Mean Median<br />
Horizontal, dummy 69,716 31%<br />
Private target, dummy 69,716 55%<br />
U.S. target, dummy 69,716 42%<br />
Deal size ($mil) 34,272 255.64 23.71<br />
40
Table V<br />
<strong>Repetitive</strong> Acquirers and <strong>Learning</strong>: <strong>Evidence</strong> <strong>from</strong> <strong>the</strong> TBD<br />
This table reports <strong>the</strong> estimated coefficient of <strong>the</strong> deal order number variable (DON) using a fixedeffects<br />
panel regression in which <strong>the</strong> dependent variable is <strong>the</strong> abnormal time between successive<br />
deals (TBDC), <strong>the</strong> number of days between <strong>the</strong> announcement date of <strong>the</strong> current deal and <strong>the</strong><br />
completion date of <strong>the</strong> previous deal. To compute <strong>the</strong> abnormal TBDC, we remove <strong>the</strong> median TBDC<br />
of <strong>the</strong> industry <strong>from</strong> <strong>the</strong> firm’s TBDC. Three-digit SIC codes define industries. Panel A reports on <strong>the</strong><br />
main sample. Panel B includes transactions embedded within an acquisitions program. We assume that<br />
an acquisitions program starts if <strong>the</strong> company undertakes a transaction after a 24-month dormant<br />
period, but it ends if <strong>the</strong> company does not undertake ano<strong>the</strong>r acquisition within 6 months of <strong>the</strong><br />
announcement of a given transaction. Panel C consists of large transactions (deal size above $50<br />
million). Column 1 includes results for <strong>the</strong> entire sample; columns 2 and 3 contain results for<br />
subsamples of observations with TBD below and above <strong>the</strong> sample median (short TBD and long TBD<br />
subsamples), respectively.<br />
Panel A. Main sample<br />
Variable All Short TBD Long TBD<br />
Fixed Effects Yes Yes Yes<br />
DON –3.831 –2.374 2.423<br />
p-value 0.00 0.00 0.00<br />
DON 2<br />
0.015 0.009 –0.010<br />
p-value 0.00 0.00 0.00<br />
Fisher statistic 82.54 371.45 7.51<br />
Number of observations 129,400 59,527 69,873<br />
Number of unique acquirers 38,887 20,352 31,994<br />
Panel B. <strong>Acquisitions</strong> programs<br />
Variable Short TBD<br />
Fixed Effects Yes<br />
DON –71.311<br />
p-value 0.00<br />
DON 2<br />
1.211<br />
p-value 0.00<br />
Fisher statistic 551.61<br />
Number of observations 13,010<br />
Number of unique acquirers 1,816<br />
Panel C. Large acquisitions<br />
Variable All Short TBD Long TBD<br />
Fixed Effects Yes Yes Yes<br />
DON –4.726 –2.578 1.588<br />
p-value 0.00 0.00 0.28<br />
DON 2<br />
0.017 0.010 –0.007<br />
p-value 0.00 0.00 0.28<br />
Fisher statistic 30.05 74.74 0.63<br />
Number of observations 22,648 10,231 12,417<br />
Number of unique acquirers 9,917 4,832 7,535<br />
41
Table VI<br />
<strong>Repetitive</strong> Acquirers and <strong>Learning</strong> Gains: Robustness Checks<br />
Here are robustness checks with respect to measurement of <strong>the</strong> dependent variable. The table reports<br />
<strong>the</strong> estimated coefficient of <strong>the</strong> deal order number variable (DON) using a fixed-effect panel<br />
regression. The dependent variable changes across columns. The TBDA is <strong>the</strong> number of days between<br />
<strong>the</strong> announcement dates of <strong>the</strong> current deal and <strong>the</strong> previous deal. The TBDC is <strong>the</strong> number of days<br />
between <strong>the</strong> announcement date of <strong>the</strong> current deal and <strong>the</strong> completion date of <strong>the</strong> previous deal. “ln”<br />
is <strong>the</strong> logarithm operator. In columns 1 and 2, <strong>the</strong> abnormal TBDA and abnormal ln(TBDC) are<br />
industry adjusted using <strong>the</strong> three-digit SIC code industry median TBDA and ln(TBDC), respectively. In<br />
column 3, <strong>the</strong> abnormal TBDC is computed using <strong>the</strong> two-digit SIC code industry median TBDC. In<br />
column 4, <strong>the</strong> abnormal TBDC is computed using <strong>the</strong> regression-based approach described in Section<br />
III.A.<br />
Variable<br />
(1)<br />
Abnormal<br />
TBDA<br />
(2)<br />
Abnormal<br />
42<br />
ln(TBDC)<br />
(3)<br />
Abnormal TBDC<br />
(two-digit SIC)<br />
(4)<br />
Abnormal TBDC<br />
(regression-based)<br />
Fixed Effects Yes Yes Yes Yes<br />
DON –3.785 –0.027 –4.132 –7.177<br />
p-value 0.00 0.00 0.00 0.00<br />
0.015 0.001 0.016 0.022<br />
p-value 0.00 0.00 0.00 0.00<br />
DON 2<br />
Fisher statistic 78.36 548.40 94.68 312.32<br />
Number of observations 132,277 129,400 129,400 126,682<br />
Number of unique acquirers 39,992 38,887 38,887 38,176
Table VII<br />
Additional Results<br />
In Panel A, <strong>the</strong> time between successive deals is regressed on a set of industry- and market-wide<br />
determinants. The dependent variable is <strong>the</strong> TBDC, <strong>the</strong> number of days between <strong>the</strong> announcement<br />
date of <strong>the</strong> current deal and <strong>the</strong> completion date of <strong>the</strong> previous deal. The explanatory variables are as<br />
follows: HHI, <strong>the</strong> sales-based industry concentration computed using firm total assets; Median Firm<br />
Size, <strong>the</strong> industry median firm size (estimated using <strong>the</strong> firm market value, obtained <strong>from</strong> <strong>the</strong> CRSP<br />
database); Median ROA, or <strong>the</strong> industry median return on assets; Median Growth Rate, <strong>the</strong> industry<br />
median sales-based growth rate; Liquidity, <strong>the</strong> liquidity index introduced by Schlingemann, Stulz, and<br />
Walkling (2002) to capture <strong>the</strong> intensity of corporate asset transactions within an industry; Aggregate<br />
Market-to-Book, or <strong>the</strong> aggregate market-to-book ratio; and C&I Spread, <strong>the</strong> commercial and<br />
industrial loan rate spreads used by Harford (2005). Industry variables are computed using <strong>the</strong> threedigit<br />
SIC code. In Panel B, <strong>the</strong> private process length is <strong>the</strong> number of days between <strong>the</strong> initiation of<br />
<strong>the</strong> takeover process and <strong>the</strong> announcement of <strong>the</strong> takeover agreement; it is regressed on <strong>the</strong> deal order<br />
number (DON). The details of <strong>the</strong> private takeover process are hand collected <strong>from</strong> <strong>the</strong> merger<br />
background section of SEC filings (see Aktas, de Bodt, and Roll (2010)).<br />
Panel A. Industry determinants of TBDC<br />
Variable Coefficient p-value<br />
Intercept –314.95 0.00<br />
HHI 201.75 0.00<br />
Median firm size 0.01 0.00<br />
Median ROA 498.05 0.00<br />
Median growth rate –19.74 0.00<br />
Liquidity 0.004 0.89<br />
Aggregate market-to-book 170.58 0.00<br />
C&I spread 241.82 0.00<br />
Fisher statistic 810.65<br />
R 2 0.04<br />
Number of observations 136,910<br />
Panel B. Private process length regression<br />
Variable Coefficient p-value<br />
Intercept 212.81 0.00<br />
DON –0.15 0.66<br />
Fisher statistic 0.19<br />
R 2 0.00<br />
Number of observations 1,573<br />
43
Table VIII<br />
Additional Robustness Checks<br />
Table VIII provides additional robustness checks relative to <strong>the</strong> sampling procedure (Panel A),<br />
financial resources committed to acquisitions (Panel B), inference methods (Panel C) and <strong>the</strong> threshold<br />
used to identify short versus long TBD (Panel D). In each panel and column, <strong>the</strong> dependent variable is<br />
<strong>the</strong> industry-adjusted abnormal TBDC (see Table V). In Panel D, <strong>the</strong> short (long) TBD subsample<br />
includes observations with TBD below (above) <strong>the</strong> sample first (third) quartile.<br />
Panel A. Alternative samples of transactions<br />
44<br />
(2)<br />
M&A sample with<br />
(3)<br />
Acquirers with at least<br />
five deals<br />
Variable (1)<br />
M&A sample control variables<br />
Fixed Effects Yes Yes Yes<br />
DON –14.68 –14.28 –3.808<br />
p-value 0.00 0.00 0.00<br />
DON 2<br />
0.130 0.134 0.015<br />
p-value 0.00 0.00 0.00<br />
Fisher statistic 19.05 4.60 113.41<br />
Number of observations 17,655 12,769 84,637<br />
Number of unique acquires 8,387 6,311 9,494<br />
Panel B. Financial resources committed to acquisitions<br />
Variable (1) (2)<br />
Fixed Effect Yes Yes<br />
Cumulative deal size –0.002<br />
p-value 0.00<br />
Lagged deal size 0.002<br />
p-value 0.03<br />
Fisher statistic 29.98 441.30<br />
Number of observations 129,400 51,732<br />
Number of unique acquires 38,887 10,302<br />
Panel C. All sample, pooled estimation – asymptotic p-values versus clustered SE based p-values<br />
Variable<br />
(1)<br />
All sample<br />
Pooled estimation<br />
Intercept 340.117<br />
(2)<br />
Asymptotic<br />
p-values<br />
(3)<br />
Clustered SE based<br />
p-values<br />
DON –18.330 0.00 0.00<br />
DON 2<br />
0.093 0.00 0.01<br />
Fisher statistic 2,945.96<br />
Number of observations 129,400<br />
Panel D. Short versus long TBD threshold<br />
Variable<br />
Short TBD<br />
(first quartile)<br />
Long TBD<br />
(third quartile)<br />
Fixed Effects Yes Yes<br />
DON –2.773 10.701<br />
p-value 0.00 0.00<br />
DON 2<br />
0.018 –0.161<br />
p-value 0.00 0.21<br />
Fisher statistic 148.36 8.49<br />
Number of observations 34,893 34,870<br />
Number of unique acquirers 14,528 23,134