Dyno Graph Overview - Penske Racing Shocks
Dyno Graph Overview - Penske Racing Shocks
Dyno Graph Overview - Penske Racing Shocks

Create successful ePaper yourself
Turn your PDF publications into a flip-book with our unique Google optimized e-Paper software.
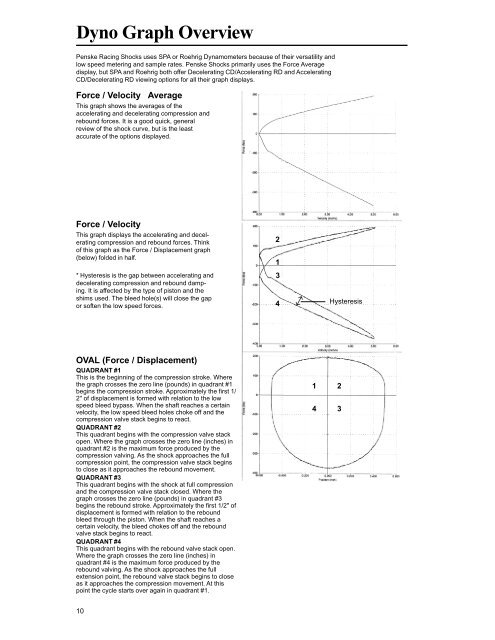
<strong>Dyno</strong> <strong>Graph</strong> <strong>Overview</strong><br />
<strong>Penske</strong> <strong>Racing</strong> <strong>Shocks</strong> uses SPA or Roehrig Dynamometers because of their versatility and<br />
low speed metering and sample rates. <strong>Penske</strong> <strong>Shocks</strong> primarily uses the Force Average<br />
display, but SPA and Roehrig both offer Decelerating CD/Accelerating RD and Accelerating<br />
CD/Decelerating RD viewing options for all their graph displays.<br />
Force / Velocity Average<br />
This graph shows the averages of the<br />
accelerating and decelerating compression and<br />
rebound forces. It is a good quick, general<br />
review of the shock curve, but is the least<br />
accurate of the options displayed.<br />
Force / Velocity<br />
This graph displays the accelerating and decelerating<br />
compression and rebound forces. Think<br />
of this graph as the Force / Displacement graph<br />
(below) folded in half.<br />
* Hysteresis is the gap between accelerating and<br />
decelerating compression and rebound damping.<br />
It is affected by the type of piston and the<br />
shims used. The bleed hole(s) will close the gap<br />
or soften the low speed forces.<br />
OVAL (Force / Displacement)<br />
QUADRANT #1<br />
This is the beginning of the compression stroke. Where<br />
the graph crosses the zero line (pounds) in quadrant #1<br />
begins the compression stroke. Approximately the first 1/<br />
2" of displacement is formed with relation to the low<br />
speed bleed bypass. When the shaft reaches a certain<br />
velocity, the low speed bleed holes choke off and the<br />
compression valve stack begins to react.<br />
QUADRANT #2<br />
This quadrant begins with the compression valve stack<br />
open. Where the graph crosses the zero line (inches) in<br />
quadrant #2 is the maximum force produced by the<br />
compression valving. As the shock approaches the full<br />
compression point, the compression valve stack begins<br />
to close as it approaches the rebound movement.<br />
QUADRANT #3<br />
This quadrant begins with the shock at full compression<br />
and the compression valve stack closed. Where the<br />
graph crosses the zero line (pounds) in quadrant #3<br />
begins the rebound stroke. Approximately the first 1/2" of<br />
displacement is formed with relation to the rebound<br />
bleed through the piston. When the shaft reaches a<br />
certain velocity, the bleed chokes off and the rebound<br />
valve stack begins to react.<br />
QUADRANT #4<br />
This quadrant begins with the rebound valve stack open.<br />
Where the graph crosses the zero line (inches) in<br />
quadrant #4 is the maximum force produced by the<br />
rebound valving. As the shock approaches the full<br />
extension point, the rebound valve stack begins to close<br />
as it approaches the compression movement. At this<br />
point the cycle starts over again in quadrant #1.<br />
10<br />
2<br />
1<br />
3<br />
4<br />
��<br />
1 2<br />
4 3<br />
Hysteresis