Predicted and Observed Groundwater Inflows into Two Rock Tunnels
Predicted and Observed Groundwater Inflows into Two Rock Tunnels
Predicted and Observed Groundwater Inflows into Two Rock Tunnels

You also want an ePaper? Increase the reach of your titles
YUMPU automatically turns print PDFs into web optimized ePapers that Google loves.
558 2003 RETC PROCEEDINGS<br />
0.45<br />
0.40<br />
0.35<br />
0.30<br />
Relative Frequency<br />
0.25<br />
0.20<br />
0.15<br />
0.10<br />
0.05<br />
0.00<br />
1.00E-06 3.00E-06 1.00E-05 3.00E-05 1.00E-04 3.00E-04 1.00E-03 3.00E-03 1.00E-02<br />
Hydraulic Conductivity (cm/sec)<br />
Log Normal Distribution<br />
Histogram of Recorded Measurements<br />
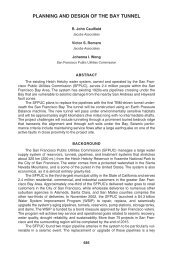
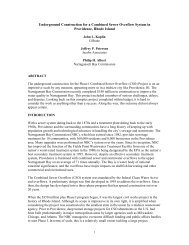
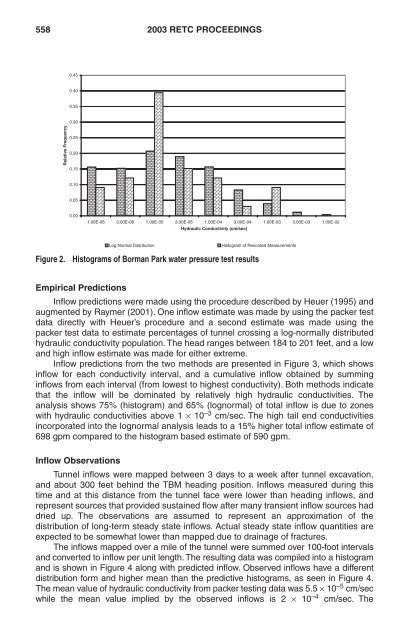
Figure 2.<br />
Histograms of Borman Park water pressure test results<br />
Empirical Predictions<br />
Inflow predictions were made using the procedure described by Heuer (1995) <strong>and</strong><br />
augmented by Raymer (2001). One inflow estimate was made by using the packer test<br />
data directly with Heuer’s procedure <strong>and</strong> a second estimate was made using the<br />
packer test data to estimate percentages of tunnel crossing a log-normally distributed<br />
hydraulic conductivity population. The head ranges between 184 to 201 feet, <strong>and</strong> a low<br />
<strong>and</strong> high inflow estimate was made for either extreme.<br />
Inflow predictions from the two methods are presented in Figure 3, which shows<br />
inflow for each conductivity interval, <strong>and</strong> a cumulative inflow obtained by summing<br />
inflows from each interval (from lowest to highest conductivity). Both methods indicate<br />
that the inflow will be dominated by relatively high hydraulic conductivities. The<br />
analysis shows 75% (histogram) <strong>and</strong> 65% (lognormal) of total inflow is due to zones<br />
with hydraulic conductivities above 1 × 10 –3 cm/sec. The high tail end conductivities<br />
incorporated <strong>into</strong> the lognormal analysis leads to a 15% higher total inflow estimate of<br />
698 gpm compared to the histogram based estimate of 590 gpm.<br />
Inflow Observations<br />
Tunnel inflows were mapped between 3 days to a week after tunnel excavation,<br />
<strong>and</strong> about 300 feet behind the TBM heading position. <strong>Inflows</strong> measured during this<br />
time <strong>and</strong> at this distance from the tunnel face were lower than heading inflows, <strong>and</strong><br />
represent sources that provided sustained flow after many transient inflow sources had<br />
dried up. The observations are assumed to represent an approximation of the<br />
distribution of long-term steady state inflows. Actual steady state inflow quantities are<br />
expected to be somewhat lower than mapped due to drainage of fractures.<br />
The inflows mapped over a mile of the tunnel were summed over 100-foot intervals<br />
<strong>and</strong> converted to inflow per unit length. The resulting data was compiled <strong>into</strong> a histogram<br />
<strong>and</strong> is shown in Figure 4 along with predicted inflow. <strong>Observed</strong> inflows have a different<br />
distribution form <strong>and</strong> higher mean than the predictive histograms, as seen in Figure 4.<br />
The mean value of hydraulic conductivity from packer testing data was 5.5 × 10 –5 cm/sec<br />
while the mean value implied by the observed inflows is 2 × 10 –4 cm/sec. The