Predicted and Observed Groundwater Inflows into Two Rock Tunnels
Predicted and Observed Groundwater Inflows into Two Rock Tunnels
Predicted and Observed Groundwater Inflows into Two Rock Tunnels

Create successful ePaper yourself
Turn your PDF publications into a flip-book with our unique Google optimized e-Paper software.
560 2003 RETC PROCEEDINGS<br />
12<br />
10<br />
Number of fractures per 100 ft<br />
8<br />
6<br />
4<br />
2<br />
0<br />
0 5 10 15 20 25<br />
Inflow Per 100 Foot of Tunnel (gpm/100ft)<br />
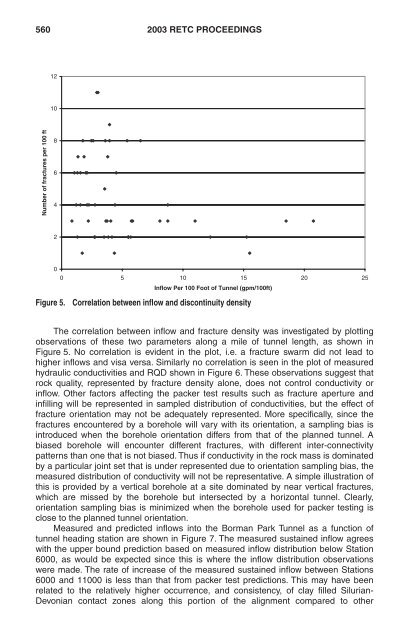
Figure 5. Correlation between inflow <strong>and</strong> discontinuity density<br />
The correlation between inflow <strong>and</strong> fracture density was investigated by plotting<br />
observations of these two parameters along a mile of tunnel length, as shown in<br />
Figure 5. No correlation is evident in the plot, i.e. a fracture swarm did not lead to<br />
higher inflows <strong>and</strong> visa versa. Similarly no correlation is seen in the plot of measured<br />
hydraulic conductivities <strong>and</strong> RQD shown in Figure 6. These observations suggest that<br />
rock quality, represented by fracture density alone, does not control conductivity or<br />
inflow. Other factors affecting the packer test results such as fracture aperture <strong>and</strong><br />
infilling will be represented in sampled distribution of conductivities, but the effect of<br />
fracture orientation may not be adequately represented. More specifically, since the<br />
fractures encountered by a borehole will vary with its orientation, a sampling bias is<br />
introduced when the borehole orientation differs from that of the planned tunnel. A<br />
biased borehole will encounter different fractures, with different inter-connectivity<br />
patterns than one that is not biased. Thus if conductivity in the rock mass is dominated<br />
by a particular joint set that is under represented due to orientation sampling bias, the<br />
measured distribution of conductivity will not be representative. A simple illustration of<br />
this is provided by a vertical borehole at a site dominated by near vertical fractures,<br />
which are missed by the borehole but intersected by a horizontal tunnel. Clearly,<br />
orientation sampling bias is minimized when the borehole used for packer testing is<br />
close to the planned tunnel orientation.<br />
Measured <strong>and</strong> predicted inflows <strong>into</strong> the Borman Park Tunnel as a function of<br />
tunnel heading station are shown in Figure 7. The measured sustained inflow agrees<br />
with the upper bound prediction based on measured inflow distribution below Station<br />
6000, as would be expected since this is where the inflow distribution observations<br />
were made. The rate of increase of the measured sustained inflow between Stations<br />
6000 <strong>and</strong> 11000 is less than that from packer test predictions. This may have been<br />
related to the relatively higher occurrence, <strong>and</strong> consistency, of clay filled Silurian-<br />
Devonian contact zones along this portion of the alignment compared to other