Theta Multistar Medium Volatility - FinFiles
Theta Multistar Medium Volatility - FinFiles
Theta Multistar Medium Volatility - FinFiles

You also want an ePaper? Increase the reach of your titles
YUMPU automatically turns print PDFs into web optimized ePapers that Google loves.
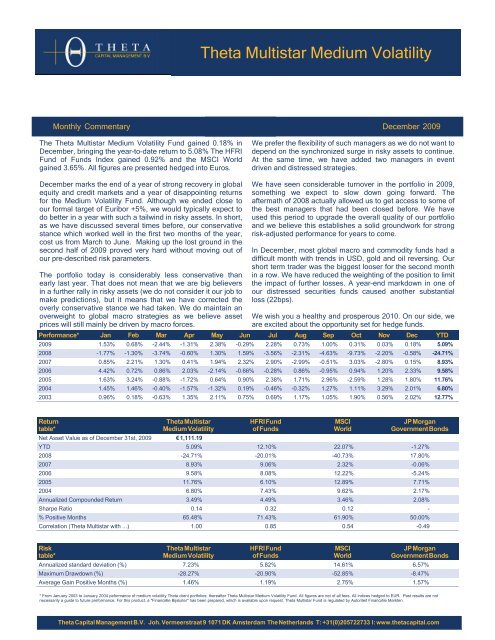
<strong>Theta</strong> <strong>Multistar</strong> <strong>Medium</strong> <strong>Volatility</strong><br />
Monthly Commentary December 2009<br />
The <strong>Theta</strong> <strong>Multistar</strong> <strong>Medium</strong> <strong>Volatility</strong> Fund gained 0.18% in<br />
December, bringing the year-to-date return to 5.08% The HFRI<br />
Fund of Funds Index gained 0.92% and the MSCI World<br />
gained 3.65%. All figures are presented hedged into Euros.<br />
We prefer the flexibility of such managers as we do not want to<br />
depend on the synchronized surge in risky assets to continue.<br />
At the same time, we have added two managers in event<br />
driven and distressed strategies.<br />
December marks the end of a year of strong recovery in global<br />
equity and credit markets and a year of disappointing returns<br />
for the <strong>Medium</strong> <strong>Volatility</strong> Fund. Although we ended close to<br />
our formal target of Euribor +5%, we would typically expect to<br />
do better in a year with such a tailwind in risky assets. In short,<br />
as we have discussed several times before, our conservative<br />
stance which worked well in the first two months of the year,<br />
cost us from March to June. Making up the lost ground in the<br />
second half of 2009 proved very hard without moving out of<br />
our pre-described risk parameters.<br />
The portfolio today is considerably less conservative than<br />
early last year. That does not mean that we are big believers<br />
in a further rally in risky assets (we do not consider it our job to<br />
make predictions), but it means that we have corrected the<br />
overly conservative stance we had taken. We do maintain an<br />
overweight to global macro strategies as we believe asset<br />
prices will still mainly be driven by macro forces.<br />
We have seen considerable turnover in the portfolio in 2009,<br />
something we expect to slow down going forward. The<br />
aftermath of 2008 actually allowed us to get access to some of<br />
the best managers that had been closed before. We have<br />
used this period to upgrade the overall quality of our portfolio<br />
and we believe this establishes a solid groundwork for strong<br />
risk-adjusted performance for years to come.<br />
In December, most global macro and commodity funds had a<br />
difficult month with trends in USD, gold and oil reversing. Our<br />
short term trader was the biggest looser for the second month<br />
in a row. We have reduced the weighting of the position to limit<br />
the impact of further losses. A year-end markdown in one of<br />
our distressed securities funds caused another substantial<br />
loss (22bps).<br />
We wish you a healthy and prosperous 2010. On our side, we<br />
are excited about the opportunity set for hedge funds.<br />
Performance* Jan Feb Mar Apr May Jun Jul Aug Sep Oct Nov Dec YTD<br />
2009 1.53% 0.68% -2.44% -1.31% 2.38% -0.29% 2.28% 0.73% 1.00% 0.31% 0.03% 0.18% 5.09%<br />
2008 -1.77% -1.30% -3.74% -0.60% 1.30% 1.59% -3.56% -2.31% -4.63% -9.73% -2.20% -0.58% -24.71%<br />
2007 0.85% 2.21% 1.30% 0.41% 1.94% 2.32% 2.90% -2.99% -0.51% 3.03% -2.80% 0.15% 8.93%<br />
2006 4.42% 0.72% 0.86% 2.03% -2.14% -0.66% -0.28% 0.86% -0.95% 0.94% 1.20% 2.33% 9.58%<br />
2005 1.63% 3.24% -0.88% -1.72% 0.64% 0.90% 2.38% 1.71% 2.96% -2.59% 1.28% 1.80% 11.76%<br />
2004 1.45% 1.46% -0.40% -1.57% -1.32% 0.19% -0.46% -0.32% 1.27% 1.11% 3.29% 2.01% 6.80%<br />
2003 0.96% 0.18% -0.63% 1.35% 2.11% 0.75% 0.69% 1.17% 1.05% 1.90% 0.56% 2.02% 12.77%<br />
Return<br />
table*<br />
<strong>Theta</strong> <strong>Multistar</strong><br />
<strong>Medium</strong> <strong>Volatility</strong><br />
Net Asset Value as of December 31st, 2009 € 1,111.19<br />
HFRI Fund<br />
of Funds<br />
MSCI<br />
World<br />
JP Morgan<br />
Government Bonds<br />
YTD 5.09% 12.10% 22.07% -1.27%<br />
2008 -24.71% -20.01% -40.73% 17.80%<br />
2007 8.93% 9.06% 2.32% -0.06%<br />
2006 9.58% 8.08% 12.22% -5.24%<br />
2005 11.76% 6.10% 12.89% 7.71%<br />
2004 6.80% 7.43% 9.62% 2.17%<br />
Annualized Compounded Return 3.49% 4.49% 3.46% 2.08%<br />
Sharpe Ratio 0.14 0.32 0.12 -<br />
% Positive Months 65.48% 71.43% 61.90% 50.00%<br />
Correlation (<strong>Theta</strong> <strong>Multistar</strong> with ...) 1.00 0.85 0.54 -0.49<br />
Risk<br />
table*<br />
<strong>Theta</strong> <strong>Multistar</strong><br />
<strong>Medium</strong> <strong>Volatility</strong><br />
HFRI Fund<br />
of Funds<br />
MSCI<br />
World<br />
JP Morgan<br />
Government Bonds<br />
Annualized standard deviation (%) 7.23% 5.82% 14.61% 6.57%<br />
Maximum Drawdown (%) -28.27% -20.90% -52.85% -8.47%<br />
Average Gain Positive Months (%) 1.46% 1.19% 2.75% 1.57%<br />
* From January 2003 to January 2004 peformance of medium volatility <strong>Theta</strong> client portfolios; thereafter <strong>Theta</strong> <strong>Multistar</strong> <strong>Medium</strong> <strong>Volatility</strong> Fund. All figures are net of all fees. All indices hedged to EUR. Past results are not<br />
necessarily a guide to future preformance. For this product, a "Financiële Bijsluiter" has been prepared, which is available upon request. <strong>Theta</strong> <strong>Multistar</strong> Fund is regulated by Autoriteit Financiële Markten.<br />
<strong>Theta</strong> Capital Management B.V. Joh. Vermeerstraat 9 1071 DK Amsterdam The Netherlands T: +31(0)205722733 I: www.thetacapital.com
<strong>Theta</strong> <strong>Multistar</strong> <strong>Medium</strong> <strong>Volatility</strong><br />
Portfolio Analysis<br />
December 2009<br />
Risk/ reward profile: Jan 2003 to Dec 2009<br />
Return<br />
6<br />
HFRI Fund of Funds<br />
<strong>Theta</strong> <strong>Multistar</strong> <strong>Medium</strong> <strong>Volatility</strong><br />
4<br />
MSCI World<br />
2<br />
JP Morgan Government Bonds<br />
0<br />
-2<br />
-4<br />
0 2 4 6 8 10 12 14 16<br />
Risk (stanadard deviation)<br />
Fund Information<br />
Subscription<br />
Monthly<br />
Redemption<br />
Monthly<br />
Redemption Notice<br />
40 days notice<br />
Management Fee 1.25%<br />
Incentive Fee 10%<br />
Hurdle Rate Euribor (1m) + 2.0%<br />
Lockup<br />
No<br />
High Water Mark<br />
Yes<br />
Custodian<br />
KDTC Trust<br />
Auditor<br />
Ernst & Young<br />
Reporting Frequency<br />
Monthly<br />
Currency<br />
Euro<br />
Inception<br />
Jan-04<br />
Bloomberg Ticker<br />
THMDVOL NA<br />
Cumulative return: Jan 2003 to Dec 2009<br />
Growth of 100EUR<br />
190<br />
180<br />
170<br />
160<br />
150<br />
140<br />
130<br />
120<br />
110<br />
100<br />
90<br />
80<br />
Dec-02 Dec-03 Dec-04 Dec-05 Dec-06 Dec-07 Dec-08 Dec-09<br />
Total<br />
<strong>Theta</strong> <strong>Multistar</strong> <strong>Medium</strong> <strong>Volatility</strong><br />
HFRI Fund of Funds<br />
MSCI World<br />
JP Morgan Government Bonds<br />
Strategy allocation Dec 2009 %<br />
Dec-09<br />
EM: Global Emerging Markets 18<br />
MA: Discretionary Thematic 21<br />
RV: Fixed Income - Asset Backed 8<br />
EH: Fundamental Value 15<br />
ED: Distressed/ Restructuring 7<br />
ED: Special Situations 5<br />
EH: Equity Market Neutral 1<br />
RV: Multistrategy 3<br />
EH: Technology/ Healthcare 5<br />
Multistrategy 1<br />
MA: Discretionary Commodity 5<br />
MA: Systematic Diversified 3<br />
ED: Activist 3<br />
RV: Fixed Income- Corporate 3<br />
Attribution gross performance by strategy Dec 2009<br />
Return Contribution, %<br />
0.34<br />
0.30<br />
0.15<br />
0.10<br />
0.06<br />
0.03<br />
0<br />
-0.01<br />
-0.01<br />
-0.22<br />
0.02<br />
-0.19 -0.23<br />
0.34<br />
0.13<br />
Fund versus indices<br />
Jan-03 - Dec-09<br />
Capture Ratio when MSCI up 34.99%<br />
Average return when MSCI up 1.02%<br />
Capture Ratio When MSCI down 26.00%<br />
Average Return when MSCI down -0.89%<br />
Capture Ratio when JPM Bond Index up -9.31%<br />
Average Return when JPM Bond Index up -0.15%<br />
Capture Ratio when JPM Bond Index down -63.11%<br />
Average Return when JPM Bond Index down 0.73%<br />
EM: Global Emerging Markets<br />
RV: Fixed Income - Asset Backed<br />
ED: Distressed/ Restructuring<br />
EH: Equity Market Neutral<br />
EH: Technology/ Healthcare<br />
MA: Discretionary Commodity<br />
ED: Activist<br />
MA: Discretionary Thematic<br />
EH: Fundamental Value<br />
ED: Special Situations<br />
RV: Multistrategy<br />
Multistrategy<br />
MA: Systematic Diversified<br />
RV: Fixed Income- Corporate<br />
Capture Ratio when HFRI Index up 94.80%<br />
Average Return when HFRI Index up 1.13%<br />
Capture Ratio when HFRI Index down 107.61%<br />
Average Return when HFRI Index down -1.80%<br />
The Capture Ratio calculates the portion of market performance that was captured by the<br />
Fund under up and down markets. A positive upmarket capture and a negative downmarket<br />
capture indicate absolute returns versus the benchmark.<br />
<strong>Theta</strong> Capital Management B.V. Joh. Vermeerstraat 9 1071 DK Amsterdam The Netherlands T: +31(0)205722733 I: www.thetacapital.com