Financial statements - International Planned Parenthood Federation
Financial statements - International Planned Parenthood Federation
Financial statements - International Planned Parenthood Federation

Create successful ePaper yourself
Turn your PDF publications into a flip-book with our unique Google optimized e-Paper software.
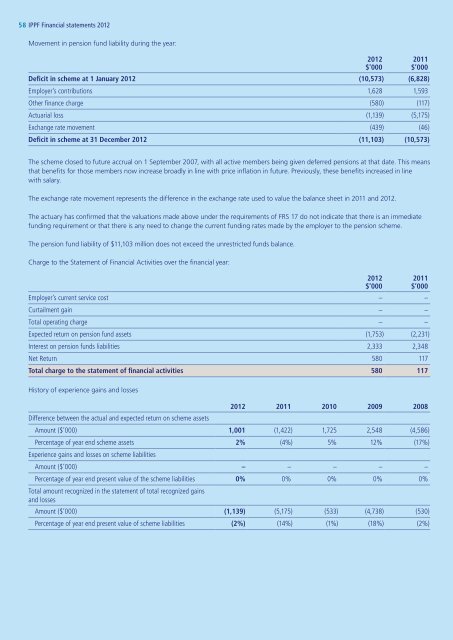
58 IPPF <strong>Financial</strong> <strong>statements</strong> 2012<br />
Movement in pension fund liability during the year:<br />
Deficit in scheme at 1 January 2012 (10,573) (6,828)<br />
Employer’s contributions 1,628 1,593<br />
Other finance charge (580) (117)<br />
Actuarial loss (1,139) (5,175)<br />
Exchange rate movement (439) (46)<br />
Deficit in scheme at 31 December 2012 (11,103) (10,573)<br />
2012<br />
$’000<br />
2011<br />
$’000<br />
The scheme closed to future accrual on 1 September 2007, with all active members being given deferred pensions at that date. This means<br />
that benefits for those members now increase broadly in line with price inflation in future. Previously, these benefits increased in line<br />
with salary.<br />
The exchange rate movement represents the difference in the exchange rate used to value the balance sheet in 2011 and 2012.<br />
The actuary has confirmed that the valuations made above under the requirements of FRS 17 do not indicate that there is an immediate<br />
funding requirement or that there is any need to change the current funding rates made by the employer to the pension scheme.<br />
The pension fund liability of $11,103 million does not exceed the unrestricted funds balance.<br />
Charge to the Statement of <strong>Financial</strong> Activities over the financial year:<br />
Employer’s current service cost – –<br />
Curtailment gain – –<br />
Total operating charge – –<br />
Expected return on pension fund assets (1,753) (2,231)<br />
Interest on pension funds liabilities 2,333 2,348<br />
Net Return 580 117<br />
Total charge to the statement of financial activities 580 117<br />
History of experience gains and losses<br />
2012 2011 2010 2009 2008<br />
Difference between the actual and expected return on scheme assets<br />
Amount ($’000) 1,001 (1,422) 1,725 2,548 (4,586)<br />
Percentage of year end scheme assets 2% (4%) 5% 12% (17%)<br />
Experience gains and losses on scheme liabilities<br />
Amount ($’000) – – – – –<br />
Percentage of year end present value of the scheme liabilities 0% 0% 0% 0% 0%<br />
Total amount recognized in the statement of total recognized gains<br />
and losses<br />
Amount ($’000) (1,139) (5,175) (533) (4,738) (530)<br />
Percentage of year end present value of scheme liabilities (2%) (14%) (1%) (18%) (2%)<br />
2012<br />
$’000<br />
2011<br />
$’000