mechanical stability of solar cells within solar panels - Solon
mechanical stability of solar cells within solar panels - Solon
mechanical stability of solar cells within solar panels - Solon

You also want an ePaper? Increase the reach of your titles
YUMPU automatically turns print PDFs into web optimized ePapers that Google loves.
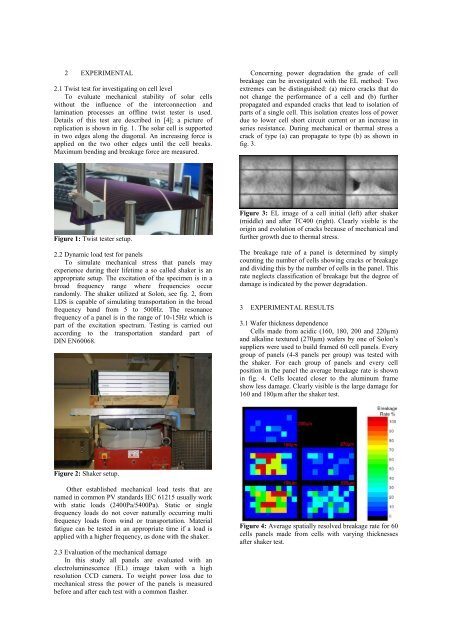
2 EXPERIMENTAL<br />
2.1 Twist test for investigating on cell level<br />
To evaluate <strong>mechanical</strong> <strong>stability</strong> <strong>of</strong> <strong>solar</strong> <strong>cells</strong><br />
without the influence <strong>of</strong> the interconnection and<br />
lamination processes an <strong>of</strong>fline twist tester is used.<br />
Details <strong>of</strong> this test are described in [4]; a picture <strong>of</strong><br />
replication is shown in fig. 1. The <strong>solar</strong> cell is supported<br />
in two edges along the diagonal. An increasing force is<br />
applied on the two other edges until the cell breaks.<br />
Maximum bending and breakage force are measured.<br />
Figure 1: Twist tester setup.<br />
2.2 Dynamic load test for <strong>panels</strong><br />
To simulate <strong>mechanical</strong> stress that <strong>panels</strong> may<br />
experience during their lifetime a so called shaker is an<br />
appropriate setup. The excitation <strong>of</strong> the specimen is in a<br />
broad frequency range where frequencies occur<br />
randomly. The shaker utilized at <strong>Solon</strong>, see fig. 2, from<br />
LDS is capable <strong>of</strong> simulating transportation in the broad<br />
frequency band from 5 to 500Hz. The resonance<br />
frequency <strong>of</strong> a panel is in the range <strong>of</strong> 10-15Hz which is<br />
part <strong>of</strong> the excitation spectrum. Testing is carried out<br />
according to the transportation standard part <strong>of</strong><br />
DIN EN60068.<br />
Figure 2: Shaker setup.<br />
Other established <strong>mechanical</strong> load tests that are<br />
named in common PV standards IEC 61215 usually work<br />
with static loads (2400Pa/5400Pa). Static or single<br />
frequency loads do not cover naturally occurring multi<br />
frequency loads from wind or transportation. Material<br />
fatigue can be tested in an appropriate time if a load is<br />
applied with a higher frequency, as done with the shaker.<br />
2.3 Evaluation <strong>of</strong> the <strong>mechanical</strong> damage<br />
In this study all <strong>panels</strong> are evaluated with an<br />
electroluminescence (EL) image taken with a high<br />
resolution CCD camera. To weight power loss due to<br />
<strong>mechanical</strong> stress the power <strong>of</strong> the <strong>panels</strong> is measured<br />
before and after each test with a common flasher.<br />
Concerning power degradation the grade <strong>of</strong> cell<br />
breakage can be investigated with the EL method: Two<br />
extremes can be distinguished: (a) micro cracks that do<br />
not change the performance <strong>of</strong> a cell and (b) further<br />
propagated and expanded cracks that lead to isolation <strong>of</strong><br />
parts <strong>of</strong> a single cell. This isolation creates loss <strong>of</strong> power<br />
due to lower cell short circuit current or an increase in<br />
series resistance. During <strong>mechanical</strong> or thermal stress a<br />
crack <strong>of</strong> type (a) can propagate to type (b) as shown in<br />
fig. 3.<br />
Figure 3: EL image <strong>of</strong> a cell initial (left) after shaker<br />
(middle) and after TC400 (right). Clearly visible is the<br />
origin and evolution <strong>of</strong> cracks because <strong>of</strong> <strong>mechanical</strong> and<br />
further growth due to thermal stress.<br />
The breakage rate <strong>of</strong> a panel is determined by simply<br />
counting the number <strong>of</strong> <strong>cells</strong> showing cracks or breakage<br />
and dividing this by the number <strong>of</strong> <strong>cells</strong> in the panel. This<br />
rate neglects classification <strong>of</strong> breakage but the degree <strong>of</strong><br />
damage is indicated by the power degradation.<br />
3 EXPERIMENTAL RESULTS<br />
3.1 Wafer thickness dependence<br />
Cells made from acidic (160, 180, 200 and 220µm)<br />
and alkaline textured (270µm) wafers by one <strong>of</strong> <strong>Solon</strong>’s<br />
suppliers were used to build framed 60 cell <strong>panels</strong>. Every<br />
group <strong>of</strong> <strong>panels</strong> (4-8 <strong>panels</strong> per group) was tested with<br />
the shaker. For each group <strong>of</strong> <strong>panels</strong> and every cell<br />
position in the panel the average breakage rate is shown<br />
in fig. 4. Cells located closer to the aluminum frame<br />
show less damage. Clearly visible is the large damage for<br />
160 and 180µm after the shaker test.<br />
Figure 4: Average spatially resolved breakage rate for 60<br />
<strong>cells</strong> <strong>panels</strong> made from <strong>cells</strong> with varying thicknesses<br />
after shaker test.