Life in the Valley Economy 2010 - Working Partnerships USA
Life in the Valley Economy 2010 - Working Partnerships USA
Life in the Valley Economy 2010 - Working Partnerships USA

You also want an ePaper? Increase the reach of your titles
YUMPU automatically turns print PDFs into web optimized ePapers that Google loves.
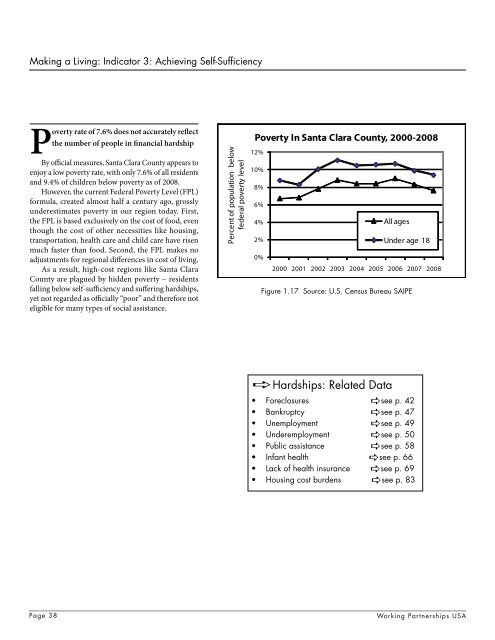
Mak<strong>in</strong>g a Liv<strong>in</strong>g: Indicator 3: Achiev<strong>in</strong>g Self-Sufficiency<br />
Poverty rate of 7.6% does not accurately reflect<br />
<strong>the</strong> number of people <strong>in</strong> f<strong>in</strong>ancial hardship<br />
By official measures, Santa Clara County appears to<br />
enjoy a low poverty rate, with only 7.6% of all residents<br />
and 9.4% of children below poverty as of 2008.<br />
However, <strong>the</strong> current Federal Poverty Level (FPL)<br />
formula, created almost half a century ago, grossly<br />
underestimates poverty <strong>in</strong> our region today. First,<br />
<strong>the</strong> FPL is based exclusively on <strong>the</strong> cost of food, even<br />
though <strong>the</strong> cost of o<strong>the</strong>r necessities like hous<strong>in</strong>g,<br />
transportation, health care and child care have risen<br />
much faster than food. Second, <strong>the</strong> FPL makes no<br />
adjustments for regional differences <strong>in</strong> cost of liv<strong>in</strong>g.<br />
As a result, high-cost regions like Santa Clara<br />
County are plagued by hidden poverty – residents<br />
fall<strong>in</strong>g below self-sufficiency and suffer<strong>in</strong>g hardships,<br />
yet not regarded as officially “poor” and <strong>the</strong>refore not<br />
eligible for many types of social assistance.<br />
Percent of population below<br />
federal poverty level<br />
Poverty In Santa Clara County, 2000-2008<br />
12%<br />
10%<br />
8%<br />
6%<br />
4%<br />
All ages<br />
2%<br />
Under age 18<br />
0%<br />
2000 2001 2002 2003 2004 2005 2006 2007 2008<br />
Figure 1.17 Source: U.S. Census Bureau SAIPE<br />
aHardships: Related Data<br />
• Foreclosures asee p. 42<br />
• Bankruptcy asee p. 47<br />
• Unemployment asee p. 49<br />
• Underemployment asee p. 50<br />
• Public assistance asee p. 58<br />
• Infant health asee p. 66<br />
• Lack of health <strong>in</strong>surance asee p. 69<br />
• Hous<strong>in</strong>g cost burdens asee p. 83<br />
Page 38<br />
Work<strong>in</strong>g <strong>Partnerships</strong> <strong>USA</strong>