1 of 5 - Carnegie Learning
1 of 5 - Carnegie Learning
1 of 5 - Carnegie Learning

Create successful ePaper yourself
Turn your PDF publications into a flip-book with our unique Google optimized e-Paper software.
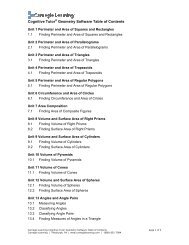
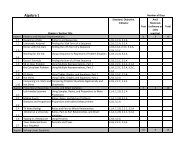
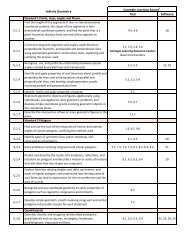
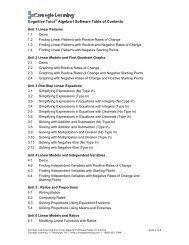
<strong>Carnegie</strong> <strong>Learning</strong> Algebra 1 Correlations to Utah's Algebra 1<br />
Textbook<br />
Chatper<br />
S<strong>of</strong>tware<br />
Unit<br />
Objective 2<br />
Compute fluently and make reasonable estimates with rational<br />
and irrational numbers.<br />
c) Compute solutions to<br />
problems, represent answers in<br />
exact form, and determine the<br />
reasonableness <strong>of</strong> answers.<br />
d) Calculate the measures <strong>of</strong> the<br />
sides <strong>of</strong> a right triangle using the<br />
Pythagorean Theorem.<br />
13 41, 42<br />
Standard 2<br />
Students will extend concepts <strong>of</strong> proportion to represent and analyze linear relations.<br />
Objective 1 Represent and analyze the slope <strong>of</strong> a line.<br />
a) Identify the slope <strong>of</strong> a line<br />
when given points, a graph, or an<br />
equation.<br />
b) Identify horizontal and vertical<br />
lines given the equations or<br />
slopes.<br />
c) Determine the effect <strong>of</strong><br />
changes in slope or y-intercept in<br />
y = mx + b.<br />
5 10, 18, 21, 22<br />
5 10, 18, 21, 22<br />
5, 8 10, 18, 21, 22<br />
d) Determine and explain the<br />
meaning <strong>of</strong> slopes and intercepts<br />
using real-world examples.<br />
a) Write algebraic expressions or<br />
equations to generalize visual<br />
patterns, numerical patterns,<br />
relations, data sets, or scatter<br />
plots.<br />
5, 8<br />
1, 6,<br />
10, 18, 21,<br />
22, 26, 27<br />
1, 3, 6, 10,<br />
15, 18, 21<br />
Objective 2<br />
Model and interpret problems having a constant rate <strong>of</strong> change<br />
using linear functions.<br />
b) Represent linear equations in<br />
slope-intercept form, y = mx + b,<br />
and standard form, Ax+ By =C.<br />
5 18, 21, 22<br />
c) Distinguish between linear and<br />
non-linear functions by examining<br />
a table, equation, or graph.<br />
1, 2, 4, 5, 8 18, 23<br />
2 <strong>of</strong> 5