Fair Chase Spring 2002 - Boone and Crockett Club
Fair Chase Spring 2002 - Boone and Crockett Club
Fair Chase Spring 2002 - Boone and Crockett Club

You also want an ePaper? Increase the reach of your titles
YUMPU automatically turns print PDFs into web optimized ePapers that Google loves.
34 ▲ <strong>Fair</strong> <strong>Chase</strong> <strong>Spring</strong> <strong>2002</strong> © DUPLAN WILDLIFE
○ ○ ○ ○ ○ ○ ○ ○ ○ ○ ○ ○ ○ ○ ○ ○ ○ ○ ○ ○ ○ ○ ○ ○ ○ ○ ○ ○ ○ ○ ○ ○ ○ ○ ○ ○ ○ ○ ○ ○ ○ ○ ○ ○ ○ ○ ○ ○ ○ ○ ○ ○ ○ ○ ○ ○ ○ ○ ○ ○ ○ ○ ○ ○ ○ ○ ○ ○ ○ ○ ○ ○ ○<br />
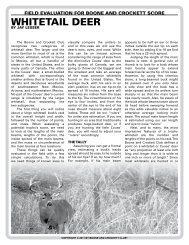
As a deer hunter, I read a lot about<br />
where to hunt big whitetail bucks.<br />
Over the years I’ve noticed that<br />
most articles on that topic are<br />
vague. Statements like, “Iowa is<br />
a great state for huge bucks” are<br />
common. I wanted to know<br />
which counties are breaking<br />
records, <strong>and</strong> why some counties<br />
produce more big deer than others.<br />
I also needed maps, since<br />
they are more useful <strong>and</strong> informative<br />
than lists. Dissatisfied<br />
with what I read, I decided to see<br />
if I could do better.<br />
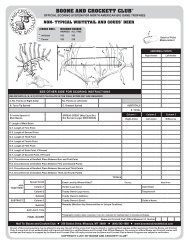
DISTRIBUTION OF WHITETAIL DEER<br />
ENTRIES BY COUNTY 1830-1979<br />
BY JOEL W. HELMER<br />
B&C Associate<br />
Dept. of Geography<br />
Oklahoma State<br />
University<br />
The first step was record book data<br />
from the <strong>Boone</strong> <strong>and</strong> <strong>Crockett</strong><br />
<strong>Club</strong>. Jack Reneau, Director of Big<br />
Game Records, provided the information<br />
I needed <strong>and</strong> explained<br />
how it was organized. I assembled<br />
5,568 whitetail entries spanning<br />
the years 1830-2001 (only two entries<br />
were included from 2001, <strong>and</strong><br />
only 120 from 2000). I successfully<br />
entered 5,439 entries into a Geographic<br />
Information System (GIS)<br />
that allowed me to produce a variety<br />
of maps <strong>and</strong> analyze the data.<br />
I did not include 129 entries lacking<br />
county-specific information on<br />
where the deer was taken. The information<br />
<strong>and</strong> maps shown here are based on the 5,439 deer<br />
entered into the GIS.<br />
I had initially planned to produce one map showing the<br />
distribution of all the entries, but I noticed that the distribution<br />
of entries had changed over time. I decided to divide the records<br />
book into two time spans, 1830-1979 <strong>and</strong> 1980-2001. The former provides<br />
a historical account of deer herds in the United States, while the<br />
latter gives hunters an up-to-date map on which areas are currently producing<br />
numerous B&C entries.<br />
0 entries<br />
1-2 entries<br />
3-5 entries<br />
6-10 entries<br />
11+ entries<br />
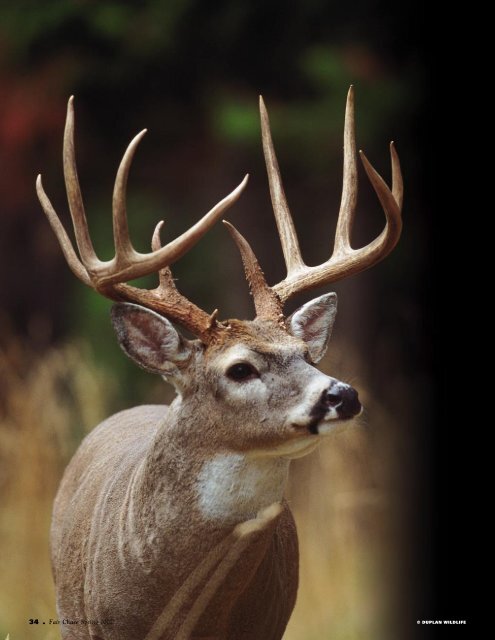
The deer shown here<br />
in the black-<strong>and</strong>-white<br />
photo was taken in<br />
1893 in Michigan. Historically,<br />
Michigan<br />
ranked fifth for the<br />
greatest number of<br />
whitetail deer entries.<br />
Since 1980, Michigan<br />
has fallen out of the<br />
top ten trophy producing<br />
states. On the<br />
other h<strong>and</strong>, Iowa<br />
ranked fourth historically,<br />
second in current times, <strong>and</strong> is now the overall<br />
number one state producing trophy whitetails in the<br />
<strong>Boone</strong> <strong>and</strong> <strong>Crockett</strong> <strong>Club</strong>’s records book. The buck pictured<br />
here was taken by Steve Philby in 1997 <strong>and</strong> scores<br />
170-6/8 points.<br />
<strong>Spring</strong> <strong>2002</strong> <strong>Fair</strong> <strong>Chase</strong> ▲ 35
○ ○ ○ ○ ○ ○ ○ ○ ○ ○ ○ ○ ○ ○ ○ ○ ○ ○ ○ ○ ○ ○ ○ ○ ○ ○ ○ ○ ○ ○ ○ ○ ○ ○ ○<br />
DISTRIBUTION<br />
OF WHITETAIL<br />
DEER ENTRIES<br />
BY COUNTY<br />
1830-2001<br />
1830-1979<br />
The 1,489 entries mapped from this<br />
early period comprise 27% of 5,439<br />
total entries. Thirty-nine states <strong>and</strong><br />
663 counties appear, the top three<br />
states — Minnesota (315), Wisconsin<br />
(194), <strong>and</strong> Texas (157) — accounting<br />
for 45% of all entries<br />
during the period. Montana, Arkansas,<br />
<strong>and</strong> South Dakota popped up in<br />
the top 10, while states currently<br />
hailed as big buck meccas, such as<br />
Ohio, Illinois, <strong>and</strong> Kansas, recorded<br />
relatively few entries.<br />
The most productive county<br />
during this period was northern<br />
Minnesota’s St. Louis (39), followed<br />
by south Texas’ Webb (27), <strong>and</strong><br />
Minnesota’s Itasca (20). The top 10<br />
counties during this period are in<br />
Wisconsin, Minnesota <strong>and</strong> Texas.<br />
The distribution of entries<br />
from 1830-1979 reflects the history<br />
of whitetail deer in the United<br />
TOP TEN WHITETAIL STATES OF ALL-TIME<br />
STATE 1830-2001 1830-1979 1980-2001<br />
1. Iowa 615 108 507<br />
2. Minnesota 608 315 293<br />
3. Wisconsin 589 194 395<br />
4. Illinois 552 43 509<br />
5. Texas 316 157 159<br />
6. Missouri 285 41 244<br />
7. Kentucky 279 37 242<br />
8. Kansas 255 20 235<br />
9. Ohio 235 36 199<br />
10. Michigan 155 55 100<br />
States. During the late 1800s <strong>and</strong><br />
early 1900s, whitetails were extremely<br />
rare in many states <strong>and</strong> had<br />
become extinct in some. Conversion<br />
of l<strong>and</strong> for agriculture, deforestation,<br />
<strong>and</strong> unrestricted market<br />
hunting are some of the reasons for<br />
this decline. During this period,<br />
whitetails in agricultural states were<br />
especially vulnerable, as much of<br />
the l<strong>and</strong> was cleared. Some deer<br />
herds did not return until recently.<br />
Ohio did not have a modern firearms<br />
season until 1943; <strong>and</strong> in<br />
Iowa’s first modern deer season, in<br />
1953, hunters took only 4,000 deer!<br />
Other states have similar histories,<br />
helping to explain the lack of entries<br />
during this time period. In<br />
contrast, whitetail deer survived in<br />
greater numbers in states with remote,<br />
forested areas. Minnesota,<br />
Wisconsin, <strong>and</strong> Maine are good<br />
examples — so too areas like south<br />
Texas, the Rocky Mountain Range,<br />
<strong>and</strong> the Mississippi Delta region.<br />
One interesting place is the<br />
Driftless Area of west-central<br />
Wisconsin <strong>and</strong> southeastern<br />
Minnesota. This region was<br />
not glaciated during the last<br />
ice age. Its l<strong>and</strong>scape of forested<br />
hills provided food <strong>and</strong><br />
cover, where deer survived<br />
<strong>and</strong> where they still grow<br />
big. Buffalo Wisconsin<br />
is in this region, <strong>and</strong><br />
st<strong>and</strong>s as the all-time<br />
most-productive<br />
county with 62 entries.<br />
1980-2001<br />
During the last two<br />
decades, the range<br />
<strong>and</strong> total population<br />
of the whitetail has<br />
exp<strong>and</strong>ed immensely,<br />
with managers now<br />
working to either stabilize<br />
deer populations or<br />
reduce them. With increasing<br />
numbers of deer<br />
came more interest in trophy-class<br />
deer. The 3,950 entries<br />
(74% of the record book total)<br />
come from 41 states <strong>and</strong> 1,254 counties.<br />
Incredibly,<br />
the years 1990-<br />
2001 account for<br />
2,811 or 52% of<br />
the record book<br />
entries during this<br />
period.<br />
Distribution<br />
has shifted to<br />
include the midwestern<br />
states,<br />
where deer herds<br />
are growing, aided<br />
by excellent habitat.<br />
The top 10 states are IL (509),<br />
IA (507), WI (395), MN (293), MO<br />
(244), KY (242), KS (235), OH<br />
(199), TX (159), <strong>and</strong> IN (138). The<br />
map shows the dominance of Midwestern<br />
states during the last 20<br />
STATE KANSAS<br />
HUNTER Mark B. Steffen<br />
LOCATION Rice County<br />
YEAR 1996<br />
SCORE 160-2/8 (typical)<br />
STATE IOWA<br />
HUNTER Ben R. Puttmann<br />
LOCATION Cherokee County<br />
YEAR 1998<br />
SCORE 170 (typical)<br />
36 ▲ <strong>Fair</strong> <strong>Chase</strong> <strong>Spring</strong> <strong>2002</strong>
STATE MINNESOTA<br />
HUNTER Thomas C. Kroening<br />
LOCATION Olmstead County<br />
YEAR 1998<br />
SCORE 180-4/8 (typical)<br />
STATE OHIO<br />
HUNTER Mickey E. Lotz<br />
LOCATION Hamilton County<br />
YEAR 1995<br />
SCORE 206-7/8 (non-typical)<br />
STATE WISCONSIN<br />
HUNTER Todd W. Davis<br />
LOCATION Shawano County<br />
YEAR 1999<br />
SCORE 161-6/8 (typical)<br />
STATE MISSOURI<br />
HUNTER William M. Hazer<br />
LOCATION Washington County<br />
YEAR 1998<br />
SCORE 170-2/8 (typical)<br />
0 entries<br />
1-2 entries<br />
3-5 entries<br />
6-10 entries<br />
11+ entries<br />
STATE TEXAS<br />
HUNTER B. Tyler Fenley<br />
LOCATION Angelina County<br />
YEAR 1999<br />
SCORE 198-6/8 (non-typical)<br />
STATE ILLINOIS<br />
HUNTER Walter L. Baker<br />
LOCATION Jersey County<br />
YEAR 1998<br />
SCORE 216-3/8 (non-typical)<br />
<strong>Spring</strong> <strong>2002</strong> <strong>Fair</strong> <strong>Chase</strong> ▲ 37
○ ○ ○ ○ ○ ○ ○ ○ ○ ○ ○ ○ ○ ○ ○ ○ ○ ○ ○ ○ ○ ○ ○ ○ ○ ○ ○ ○ ○ ○ ○ ○ ○ ○ ○<br />
DISTRIBUTION<br />
OF WHITETAIL<br />
DEER ENTRIES<br />
BY COUNTY<br />
1980-2001<br />
years, especially the last decade.<br />
States <strong>and</strong> counties that yielded<br />
many entries during the previous<br />
period have, by <strong>and</strong> large, continued<br />
to produce; but they account for<br />
a smaller percentage of entries.<br />
The top 50 counties are distributed<br />
in the following states: IA<br />
(17), IL (11), WI (6), KY (4), MN<br />
(4), TX (4), ME (2), MI (1), <strong>and</strong><br />
MT (1). Twenty-eight of the top<br />
50 counties come from Iowa <strong>and</strong> Illinois,<br />
which is why these states attract<br />
hunters. For some states, the<br />
last 20 years account for nearly all<br />
of their entries. For example, Kansas<br />
recorded 235 Awards Book entries<br />
during this period, <strong>and</strong> 255<br />
All-time entries, while Kentucky<br />
had 242 <strong>and</strong> 279, respectively.<br />
1830-2001<br />
Mapping all 5,439 entries gave me a<br />
print similar to the 1980-2001 map,<br />
since the vast majority of trophies<br />
come from that period. Forty-two<br />
states <strong>and</strong> 1,443 counties produced<br />
entries, with most coming from the<br />
top 10 states: IA (615), MN (608),<br />
WI (589), IL (552), TX (316), MO<br />
(285), KY (279), KS (255), OH<br />
(235), <strong>and</strong> MI (155). These 10 states<br />
accounted for 3,880 entries, or 72%<br />
of the record book. The all-time best<br />
counties are Buffalo, WI, <strong>and</strong> St.<br />
Louis, MN with both recording 62<br />
entries. The top 50 counties are distributed<br />
in the following states: IA<br />
(13), MN (12), WI (10), IL (8), TX<br />
(5), ME (1), <strong>and</strong> MT (1).<br />
TOP WHITETAIL COUNTIES SINCE 1980<br />
COUNTY 1980-2001 1830-2001 1830-1979<br />
1. Buffalo Co. , WI 45 62 17<br />
2. St. Louis Co., MN 23 62 39<br />
2. Dimmit Co., TX 23 41 18<br />
3. Pike Co., IL 22 24 2<br />
4. Adams Co., IL 21 25 4<br />
4. Fulton Co., IL 21 22 1<br />
4. McHenry Co., IL 21 21 0<br />
4. Allamakee Co., IA 21 25 4<br />
4. Monona Co., IA 21 23 2<br />
4. Webb Co., TX 21 48 27<br />
WHY DO SOME<br />
COUNTIES PRODUCE<br />
SO MANY ENTRIES<br />
Answering this question is difficult<br />
since so many natural <strong>and</strong> manmade<br />
factors come to bear. Still, the<br />
relationship between record book<br />
entries <strong>and</strong> river systems is plainly<br />
evident throughout the country, especially<br />
in heavily farmed states. For<br />
example, in Iowa the best deer counties<br />
are not the most heavily farmed,<br />
but tend to have a mixture of<br />
farml<strong>and</strong> <strong>and</strong> forest cover associated<br />
with river bottoms.<br />
Counties bordering the Missouri,<br />
Mississippi <strong>and</strong> Des<br />
Moines Rivers account for<br />
the majority of entries<br />
from Iowa. This pattern<br />
is evident in nearly all<br />
states, especially<br />
along the Mississippi,<br />
Ohio, <strong>and</strong> Missouri<br />
River systems.<br />
The relationship<br />
between deer<br />
densities <strong>and</strong> number<br />
of entries is also<br />
interesting. States<br />
with high deer densities<br />
<strong>and</strong> long firearms<br />
seasons with<br />
liberal bag limits produce,<br />
on balance, fewer<br />
entries. States with<br />
lower deer densities,<br />
shorter gun seasons, <strong>and</strong><br />
more restrictive buck harvests<br />
tend to produce more<br />
entries. A good comparison is between<br />
Ohio, which averages<br />
around 10 deer per square mile,<br />
<strong>and</strong> Mississippi, which averages<br />
more than 30.<br />
Perhaps the most interesting<br />
pattern is the impact state management<br />
practices can have on entries.<br />
In Kansas, modern rifle season takes<br />
place after the rut, while in Oklahoma<br />
it generally falls during the<br />
peak of the rut. Also, the black powder<br />
season in Kansas is in mid-September,<br />
when the trees still wear<br />
leaves <strong>and</strong> temperatures are high. In<br />
contrast, Oklahoma’s black powder<br />
season occurs in late October <strong>and</strong><br />
early November, when temperatures<br />
are cool, bucks are starting to rut,<br />
<strong>and</strong> the leaves are falling. Since the<br />
majority of bucks killed are taken<br />
during gun seasons, timing those sea-<br />
sons so bucks are less vulnerable<br />
gives the animals time to mature.<br />
Similar differences are apparent between<br />
seasons <strong>and</strong> the number of<br />
big-buck entries from Iowa <strong>and</strong> Missouri,<br />
Ohio <strong>and</strong> West Virginia, <strong>and</strong><br />
Nebraska <strong>and</strong> Kansas.<br />
The maps produced for this<br />
article give hunters an accurate picture<br />
of where B&C-class bucks are<br />
being taken. Though your odds are<br />
STATE ILLINOIS<br />
HUNTER James Kruczynski<br />
LOCATION Pike County (3)<br />
YEAR 1998<br />
SCORE 198-7/8 (non-typical)<br />
definitely higher in certain states<br />
<strong>and</strong> counties, the maps also show<br />
that entries come, literally, from all<br />
over. They have come from 1,443<br />
different counties, half the counties<br />
in the forty-two states that have produced<br />
entries. So no matter where<br />
you hunt, there is always a “geographical<br />
chance” of bringing home<br />
a record book buck! ▲ ▲ ▲<br />
38 ▲ <strong>Fair</strong> <strong>Chase</strong> <strong>Spring</strong> <strong>2002</strong>
STATE WISCONSIN<br />
HUNTER Ronald J. Jilot<br />
LOCATION Buffalo County (1)<br />
YEAR 1997<br />
SCORE 203-5/8 (non-typical)<br />
STATE IOWA<br />
HUNTER Craig R. Belknap<br />
LOCATION Des Moines County (12)<br />
YEAR 1998<br />
SCORE 198-5/8 (non-typical)<br />
STATE MINNESOTA<br />
HUNTER Bruce C. Norton<br />
LOCATION Houston County (11)<br />
YEAR 1995<br />
SCORE 168-3/8 (typical)<br />
0 entries<br />
1-2 entries<br />
3-5 entries<br />
6-10 entries<br />
11+ entries<br />
STATE TEXAS<br />
HUNTER Floyd Burr<br />
LOCATION Dimmit County (2)<br />
YEAR 1949<br />
SCORE 166 (typical)<br />
Historically Dimmitt County has been a top<br />
producer. It currently ranks second (tie) <strong>and</strong> 3rd<br />
overall since 1830.<br />
STATE TEXAS<br />
HUNTER Joe E. Coleman<br />
LOCATION Dimmit County (2)<br />
YEAR 1998<br />
SCORE 170-4/8 (typical)<br />
<strong>Spring</strong> <strong>2002</strong> <strong>Fair</strong> <strong>Chase</strong> ▲ 39