2011 almond almanac - Almond Board of California
2011 almond almanac - Almond Board of California
2011 almond almanac - Almond Board of California

Create successful ePaper yourself
Turn your PDF publications into a flip-book with our unique Google optimized e-Paper software.
eCeipts By County + Variety Crop year 2010/11<br />
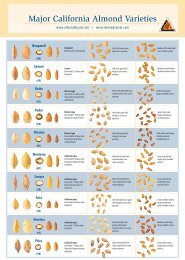
top ten aLMonD Varieties + aCreage<br />
Counties<br />
% Crop<br />
nonpareil<br />
Lbs.<br />
Monterey<br />
Lbs.<br />
Carmel<br />
Lbs.<br />
Butte/padre<br />
Lbs.<br />
Butte<br />
Lbs.<br />
fritz<br />
Lbs.<br />
all others<br />
Lbs.<br />
all Varieties<br />
Lbs.<br />
top ten aLMonD-proDuCing Varieties 2000/01 Vs. 2010/11 perCentage <strong>of</strong> tonnage<br />
coAsT coUNTies<br />
Del norte 0.02% 89,675 16,063 46,721 0 33,032 17,618 142,553 345,662<br />
Monterey 0.01% 55,399 5,985 41,046 29,544 0 7,785 44,342 184,101<br />
coAsT ToTAls 0.03% 145,074 22,048 87,767 29,544 33,032 25,403 186,895 529,763<br />
NorTH VAlleY<br />
Butte 2.90% 16,719,598 942,607 5,739,656 2,190,337 4,885,907 314,802 16,332,177 47,125,084<br />
Colusa 5.12% 30,060,306 5,688,152 11,376,191 1,097,616 14,249,209 5,462,343 15,268,419 83,202,236<br />
glenn 3.43% 23,726,558 1,898,587 7,034,024 1,348,503 7,699,374 760,315 13,332,642 55,800,003<br />
sacramento 0.00% 29,354 0 0 0 0 22,460 7,885 59,699<br />
solano 0.27% 1,948,536 122,393 344,887 265,132 891,112 10,059 793,185 4,375,304<br />
sutter 0.30% 1,103,275 92,321 505,070 781,792 551,028 59,605 1,836,753 4,929,844<br />
tehama 0.72% 4,967,202 239,021 1,612,833 527,689 1,788,772 55,778 2,469,624 11,660,919<br />
yolo 0.83% 4,795,667 657,100 1,596,599 596,957 2,354,340 362,263 3,202,135 13,565,061<br />
yuba 0.05% 302,146 60,694 70,375 35,655 38,492 32,536 293,501 833,399<br />
NorTH ToTAls 13.62% 83,652,642 9,700,875 28,279,635 6,843,681 32,458,234 7,080,161 53,536,321 221,551,549<br />
soUTH VAlleY<br />
percentage <strong>of</strong> tonnage<br />
50%<br />
40%<br />
30%<br />
20%<br />
10%<br />
0%<br />
39%<br />
34%<br />
nonpareil<br />
4%<br />
14%<br />
Monterey<br />
19%<br />
11%<br />
0%<br />
10%<br />
9%<br />
8%<br />
7%<br />
3% 3% 3%<br />
4%<br />
1% 2% 2% 2% 2%<br />
2000/01 2010/11<br />
Carmel Butte/padre Butte fritz padre aldrich sonora price other<br />
source: usDa incoming receipts from fV 193 certificates reported to <strong>almond</strong> <strong>Board</strong> <strong>of</strong> <strong>California</strong>.<br />
notes: Mission and peerless varieties dropped <strong>of</strong>f the top ten varieties during 2010/11. Butte/padre first reported as a variety in 2004.<br />
15%<br />
7%<br />
fresno 21.16% 115,757,954 60,767,648 24,578,932 40,034,101 31,611,141 17,920,391 53,574,779 344,244,946<br />
kern 24.81% 146,211,673 81,740,194 17,215,198 29,824,347 34,822,950 41,027,790 52,671,978 403,514,130<br />
kings 1.84% 11,082,825 4,379,727 1,277,070 6,294,106 781,454 2,816,781 3,235,703 29,867,666<br />
Madera 9.21% 43,850,310 23,704,920 19,201,821 23,430,875 9,786,296 7,738,633 22,029,722 149,742,577<br />
Merced 10.10% 50,650,473 18,447,877 26,108,235 17,278,007 11,276,285 8,770,106 31,716,141 164,247,124<br />
san Joaquin 4.18% 22,692,468 2,530,132 14,921,026 9,675,896 3,335,348 5,141,250 9,726,989 68,023,109<br />
stanislaus 12.45% 65,092,787 16,700,088 38,927,865 25,192,717 10,086,623 10,444,525 36,035,582 202,480,187<br />
tulare 2.60% 15,974,050 6,205,926 1,880,324 4,147,250 3,720,792 4,894,172 5,420,122 42,242,636<br />
soUTH ToTAls 86.34% 471,312,540 214,476,512 144,110,471 155,877,299 105,420,889 98,753,648 214,411,016 1,404,362,375<br />
All oTHers<br />
Mariposa 0.00% – – – – – – 67,963 67,963<br />
san Benito 0.00% – – – – – – 14,797 14,797<br />
tuolumne 0.00% 15,914 – – – – – 18,909 34,823<br />
All oTHers ToTAls 0.01% 15,914 0 0 0 0 0 101,669 117,583<br />
YTD ToTAls 100.00% 555,126,170 224,199,435 172,477,873 162,750,524 137,912,155 105,859,212 268,235,901 1,626,561,270<br />
aLMonD Bearing aCreage Crop year 2006/07–<strong>2011</strong>/12<br />
thousand acres<br />
Bearing acreage percentage change from previous year in bearing acres<br />
800,000<br />
720,000 740,000 750,000 20%<br />
680,000<br />
700,000<br />
640,000<br />
610,000<br />
600,000<br />
15%<br />
500,000<br />
400,000<br />
300,000<br />
200,000<br />
100,000<br />
0<br />
3.4%<br />
4.9%<br />
6.3% 5.9%<br />
2006/07 2007/08 2008/09 2009/10 2010/11 <strong>2011</strong>/12 forecast<br />
2.8%<br />
1.4%<br />
10%<br />
5%<br />
0%<br />
percentage change from previous year<br />
16<br />
source: usDa form fV 193, report <strong>of</strong> inedible Content <strong>of</strong> <strong>almond</strong> receipts.<br />
sources: usDa, nass/Cfo. 2010 acreage report.<br />
17