2010 Annual Report - Grange Resources
2010 Annual Report - Grange Resources
2010 Annual Report - Grange Resources
You also want an ePaper? Increase the reach of your titles
YUMPU automatically turns print PDFs into web optimized ePapers that Google loves.
56 GRANGE RESOURCES LIMITED<br />
Notes to the Financial Statements (cont.)<br />
NOTE 2.<br />
FINANCIAL RISK<br />
MANAGEMENT (cont.)<br />
Going forward, the Group may consider using financial<br />
instruments to manage commodity price risk given exposures to<br />
market prices arising from recent changes to pricing<br />
mechanisms.<br />
(iii) Cash flow and fair value interest rate risk<br />
The Group’s main interest rate risk arises from long term<br />
borrowings. Borrowings are issued at variable rates exposing the<br />
Group to cash flow interest rate risk. Borrowings issued at fixed<br />
rates expose the Group to fair value interest rate risk if the<br />
borrowings are carried at fair value.<br />
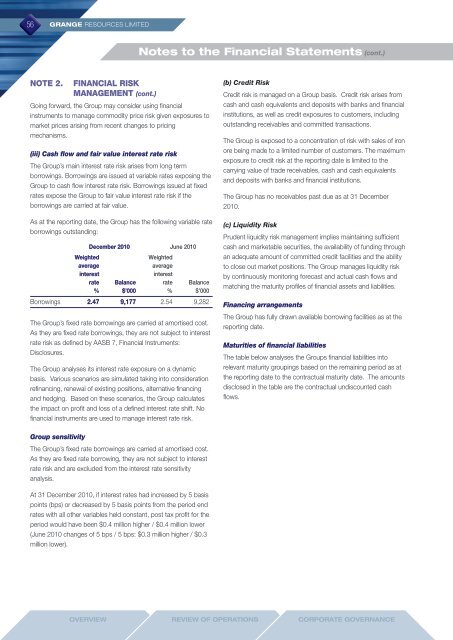
As at the reporting date, the Group has the following variable rate<br />
borrowings outstanding:<br />
December <strong>2010</strong> June <strong>2010</strong><br />
Weighted<br />
Weighted<br />
average<br />
average<br />
interest<br />
interest<br />
rate Balance rate Balance<br />
% $’000 % $’000<br />
Borrowings 2.47 9,177 2.54 9,282<br />
The Group’s fixed rate borrowings are carried at amortised cost.<br />
As they are fixed rate borrowings, they are not subject to interest<br />
rate risk as defined by AASB 7, Financial Instruments:<br />
Disclosures.<br />
The Group analyses its interest rate exposure on a dynamic<br />
basis. Various scenarios are simulated taking into consideration<br />
refinancing, renewal of existing positions, alternative financing<br />
and hedging. Based on these scenarios, the Group calculates<br />
the impact on profit and loss of a defined interest rate shift. No<br />
financial instruments are used to manage interest rate risk.<br />
(b) Credit Risk<br />
Credit risk is managed on a Group basis. Credit risk arises from<br />
cash and cash equivalents and deposits with banks and financial<br />
institutions, as well as credit exposures to customers, including<br />
outstanding receivables and committed transactions.<br />
The Group is exposed to a concentration of risk with sales of iron<br />
ore being made to a limited number of customers. The maximum<br />
exposure to credit risk at the reporting date is limited to the<br />
carrying value of trade receivables, cash and cash equivalents<br />
and deposits with banks and financial institutions.<br />
The Group has no receivables past due as at 31 December<br />
<strong>2010</strong>.<br />
(c) Liquidity Risk<br />
Prudent liquidity risk management implies maintaining sufficient<br />
cash and marketable securities, the availability of funding through<br />
an adequate amount of committed credit facilities and the ability<br />
to close out market positions. The Group manages liquidity risk<br />
by continuously monitoring forecast and actual cash flows and<br />
matching the maturity profiles of financial assets and liabilities.<br />
Financing arrangements<br />
The Group has fully drawn available borrowing facilities as at the<br />
reporting date.<br />
Maturities of financial liabilities<br />
The table below analyses the Groups financial liabilities into<br />
relevant maturity groupings based on the remaining period as at<br />
the reporting date to the contractual maturity date. The amounts<br />
disclosed in the table are the contractual undiscounted cash<br />
flows.<br />
Group sensitivity<br />
The Group’s fixed rate borrowings are carried at amortised cost.<br />
As they are fixed rate borrowing, they are not subject to interest<br />
rate risk and are excluded from the interest rate sensitivity<br />
analysis.<br />
At 31 December <strong>2010</strong>, if interest rates had increased by 5 basis<br />
points (bps) or decreased by 5 basis points from the period end<br />
rates with all other variables held constant, post tax profit for the<br />
period would have been $0.4 million higher / $0.4 million lower<br />
(June <strong>2010</strong> changes of 5 bps / 5 bps: $0.3 million higher / $0.3<br />
million lower).<br />
Overview<br />
Review Of Operations<br />
Corporate Governance


