Advanced Windows 2000 Rootkit Detection (Execution Path Analysis)
Advanced Windows 2000 Rootkit Detection (Execution Path Analysis)
Advanced Windows 2000 Rootkit Detection (Execution Path Analysis)

You also want an ePaper? Increase the reach of your titles
YUMPU automatically turns print PDFs into web optimized ePapers that Google loves.
<strong>Advanced</strong> <strong>Windows</strong> <strong>2000</strong> <strong>Rootkit</strong> <strong>Detection</strong><br />
(<strong>Execution</strong> <strong>Path</strong> <strong>Analysis</strong>)<br />
Jan Krzysztof Rutkowski<br />
jkrutkowski@elka.pw.edu.pl<br />
July 2003<br />
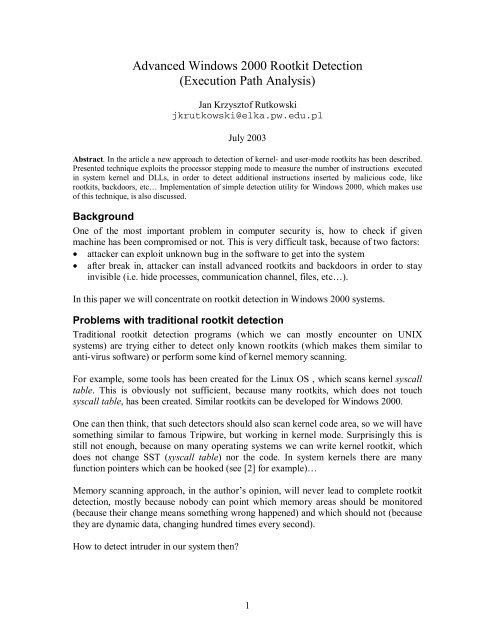
Abstract. In the article a new approach to detection of kernel- and user-mode rootkits has been described.<br />
Presented technique exploits the processor stepping mode to measure the number of instructions executed<br />
in system kernel and DLLs, in order to detect additional instructions inserted by malicious code, like<br />
rootkits, backdoors, etc… Implementation of simple detection utility for <strong>Windows</strong> <strong>2000</strong>, which makes use<br />
of this technique, is also discussed.<br />
Background<br />
One of the most important problem in computer security is, how to check if given<br />
machine has been compromised or not. This is very difficult task, because of two factors:<br />
• attacker can exploit unknown bug in the software to get into the system<br />
• after break in, attacker can install advanced rootkits and backdoors in order to stay<br />
invisible (i.e. hide processes, communication channel, files, etc…).<br />
In this paper we will concentrate on rootkit detection in <strong>Windows</strong> <strong>2000</strong> systems.<br />
Problems with traditional rootkit detection<br />
Traditional rootkit detection programs (which we can mostly encounter on UNIX<br />
systems) are trying either to detect only known rootkits (which makes them similar to<br />
anti-virus software) or perform some kind of kernel memory scanning.<br />
For example, some tools has been created for the Linux OS , which scans kernel syscall<br />
table. This is obviously not sufficient, because many rootkits, which does not touch<br />
syscall table, has been created. Similar rootkits can be developed for <strong>Windows</strong> <strong>2000</strong>.<br />
One can then think, that such detectors should also scan kernel code area, so we will have<br />
something similar to famous Tripwire, but working in kernel mode. Surprisingly this is<br />
still not enough, because on many operating systems we can write kernel rootkit, which<br />
does not change SST (syscall table) nor the code. In system kernels there are many<br />
function pointers which can be hooked (see [2] for example)…<br />
Memory scanning approach, in the author’s opinion, will never lead to complete rootkit<br />
detection, mostly because nobody can point which memory areas should be monitored<br />
(because their change means something wrong happened) and which should not (because<br />
they are dynamic data, changing hundred times every second).<br />
How to detect intruder in our system then<br />
1
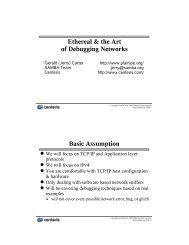
<strong>Rootkit</strong> classification<br />
rootkits<br />
DLL<br />
hooking<br />
Modify execution<br />
path<br />
Other function<br />
pointers hooking<br />
Change only data<br />
structures<br />
(e.g. process linked<br />
lists)<br />
Service/syscall<br />
hooking<br />
Direct code<br />
change<br />
Figure 1. <strong>Rootkit</strong> classification.<br />
First we should divide techniques exploited by rootkits into two categories (see figure 1):<br />
these which only modify some kernel data structures in order to hide something (like<br />
active processes) and these which achieve the same result by modifying some kernel<br />
execution paths (for e.g. hooks some kernel functions responsible for enumerating active<br />
processes).<br />
<strong>Rootkit</strong>s which change kernel data structures<br />
There are not many rootkits which makes use of this technique. Interesting example<br />
within this category is fu rootkit (see [3]), which hides processes by just unlinking<br />
process objects from the PsActiveProcessList linked list in the kernel. Hidden process is<br />
invisible to ZwQuerySystemInformation function (for e.g.) which is used by tools like<br />
Task Manager to get list of processes running in the system.<br />
On the other hand, hidden process is able to execute (i.e. it gets CPU time) since different<br />
lists are used by the dispatcher (windows scheduler). Actually <strong>Windows</strong> dispatcher is<br />
using three 1 important data structures to manage thread scheduling, they are:<br />
• pKiDispatcherReadyListHead, which is actually a table of 32 linked list heads<br />
(one list for each priority) grouping threads in ‘ready’ state.<br />
• pKiWaitInListHead<br />
• pKiWaitOutListHead<br />
The last two are heads of two different lists which holds threads being in state ‘wait’ (like<br />
sleeping on some object). There is subtle difference between them, but this is not<br />
important for us.<br />
1 Author believes that this three lists cover all threads in the system. Some experiments has proved this<br />
assumption, however this should be better researched.<br />
2
From the above we can see the easy way to detect hidden processes. We should just use<br />
the utility (kernel module) which will read the internal dispatcher thread lists, instead of<br />
the PsActiveProcessList. Such utility has been developed and proved to detect all hidden,<br />
by fu rootkit, processes.<br />
We should see now that detection of similar kind of rootkits is relatively easy: we should<br />
just reach the most internal kernel data structures, read them (of course we need own<br />
kernel module to get to the kernel data space), and then compare the results with ones<br />
returned by some “official” API functions.<br />
Please note, that it is rather impossible to remove threads of the hidden process from the<br />
just mentioned dispatcher internal lists, because then, our hidden process, will not get any<br />
CPU time for execution.<br />
<strong>Rootkit</strong>s which change <strong>Execution</strong> <strong>Path</strong><br />
These are the most common rootkits. They achieve their goals by altering or adding some<br />
extra instructions to the kernel or system DLLs. The problem is, that we do not know<br />
where or what rootkit will change. It can hook some DLL functions or System Service<br />
Table, change body of some kernel functions or just change strange function pointers in<br />
the kernel…<br />
The problem is that kernel is so big structure, that we do not actually know what areas of<br />
its memory should be checked in order to detect intruders. We cannot check too much,<br />
since there are lots of fast changing data in kernel (processes are running, packets from<br />
the network are coming, etc…) and we do not want to get false positives every second!<br />
<strong>Execution</strong> path analysis<br />
The main idea in EPA is to notice the simple fact: if the attacker has compromised the<br />
system, and she is trying to hide something by changing some execution path, then<br />
system will be executing extra instructions, during some typical system and library calls.<br />
For example, if she patched ZwQueryDirectoryFile() and ZwQuerySystemInformation(),<br />
in order to hide files and processes then, the number of instructions which are executed<br />
during these system services will be greater, comparing to the clear system. It does not<br />
matter if attacker has hooked some entries in System Service Table (SST) or put some<br />
jmp’s into code, or do whatever else. More instructions are executed because rootkit must<br />
perform its task (remove some elements form the returned lists of files or processes in<br />
this example).<br />
The <strong>Windows</strong> <strong>2000</strong> kernel is a complex program however. We suspect, that even in the<br />
clear system, the number of instructions executed during some system calls will not be<br />
the same. However, as we will see later, we can deal with this situation using simple<br />
statistics. But first, we need a mechanism for instruction counting…<br />
3
inc counter;<br />
iret;<br />
NewKiSystemService:<br />
if (current_pid == trace_pid)<br />
setTFbit();<br />
jmp KiSystemService;<br />
IDT<br />
...<br />
0h<br />
1h (#DB)<br />
2h<br />
2Eh (Win<strong>2000</strong>)<br />
KiSystemService:<br />
...<br />
call [ebx]; // call System Service<br />
...<br />
iret;<br />
...<br />
FFh<br />
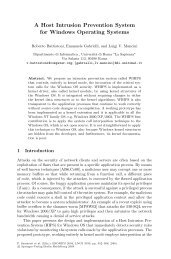
Figure 2. Simplified diagram of what is hooked by instruction counter.<br />
Implementation of instruction counter<br />
To implement instruction counting, we can use a nice feature of Intel processors, the so<br />
called single stepping mode. When the processor is working in this mode, it will generate<br />
debug exception (#DB) after every instruction which was executed. To put processor into<br />
this mode, we have to set TF bit in the EFLAGS register (see [6] for details).<br />
Processor clears TF bit when executing int instruction and this instruction is causing<br />
privilege change. It means that if we want to count the instructions executed in kernel<br />
mode, we have to set TF bit at the beginning of interrupt handler. Because we would like<br />
to measure the number of instructions executed during some system services, it is<br />
convenient to hook interrupt vector 0x2e, which is <strong>Windows</strong> <strong>2000</strong> system service gate.<br />
However, because some rootkits are user-mode based (see [4]), we should also be able to<br />
count the instructions executed in ring3 before, and after, kernel service. This is simple,<br />
we just have to set TF bit in user mode and we do not have to bother to set it again after<br />
return form kernel-mode, because processor will restore this bit automatically.<br />
The counting mechanism has been implemented as a kernel driver. After loading, it<br />
hooks IDT 0x1 and 0x2e entries as showed on figure 2. Of course the module must<br />
communicate with userland to allow testing process getting the results. In current<br />
implementation kernel driver hooks one system call which will be used as a interface to<br />
the driver. User mode process can then start and stop the counting process by calling this<br />
specific system call.<br />
4
0x0<br />
0x1<br />
xx<br />
SST<br />
…<br />
…<br />
pfService (arg0, arg1) {<br />
if (arg0 == PF_MAGIC)<br />
switch (arg1) {<br />
case PF_START:<br />
counter = 0;<br />
trace_pid = curren_pid;<br />
return 0;<br />
case PF_STOP:<br />
trace_pid = -1;<br />
return counter;<br />
}<br />
jmp origService;<br />
}<br />
origService (arg0, arg1, ....) {<br />
…<br />
}<br />
Figure 3. Kernel module communicate with user mode testing process through one of the<br />
system service.<br />
The tests<br />
We can use the mechanism described in the previous paragraph to measure the number of<br />
instructions executed during arbitrary system services.<br />
For example, to detect that someone is trying to hide some files or directories, we can<br />
issue a simple test:<br />
pfStart();<br />
FindFirstFile("C:\\WINNT\\system32\\drivers",<br />
&FindFileData);<br />
int res = pfStop();<br />
We expect that if attacker has installed rootkit which hides arbitrary files, then we will<br />
count more instructions compared to the uninfected system.<br />
If we repeat the tests few hundred times and calculate the average value, we can see that<br />
tests are very non deterministic. It should not be surprise, considering such complex<br />
system as <strong>Windows</strong> <strong>2000</strong>. Unfortunately such behavior is unacceptable for our detection<br />
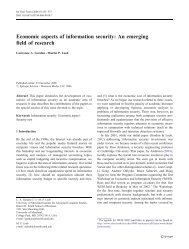
purposes. However, if we collect our test samples and create histogram we can observe<br />
that all tests are characterized by a histogram with one big peak. This peak, as it can be<br />
seen on the pictures 4 and 5, remains at the same position, even though the system can be<br />
heavy loaded. In this case, the histogram has been created for the FindFirstFile()<br />
function.<br />
5
This surprising behavior of system functions is hard to explain formally. Intuitively we<br />
expect that, because one system service is called few hundred times in a loop, so that all<br />
system buffers, caches etc., connected with serving this special service, will be finally<br />
filled with some fixed values.<br />
500<br />
450<br />
400<br />
350<br />
300<br />
250<br />
200<br />
150<br />
100<br />
50<br />
0<br />
23400<br />
23410<br />
23420<br />
23430<br />
23440<br />
23450<br />
23460<br />
23470<br />
23480<br />
23490<br />
23500<br />
23510<br />
23520<br />
23530<br />
23540<br />
23550<br />
23560<br />
23570<br />
23580<br />
23590<br />
23600<br />
23610<br />
23620<br />
23630<br />
23640<br />
23650<br />
23660<br />
23670<br />
23680<br />
23690<br />
23700<br />
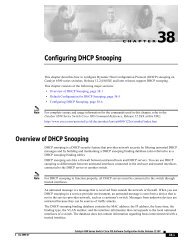
Figure 4. Histogram for the FindFirstFile test, system under light load. The number of instructions<br />
executed both in kernel and user mode has been counted, while testing process was asking system to<br />
return the first file form \WINNT\System32\drivers directory. This directory has been chosen<br />
because its contents shouldn’t change.<br />
250<br />
200<br />
150<br />
100<br />
50<br />
0<br />
23400<br />
23410<br />
23420<br />
23430<br />
23440<br />
23450<br />
23460<br />
23470<br />
23480<br />
23490<br />
23500<br />
23510<br />
23520<br />
23530<br />
23540<br />
23550<br />
23560<br />
23570<br />
23580<br />
23590<br />
23600<br />
23610<br />
23620<br />
23630<br />
23640<br />
23650<br />
23660<br />
23670<br />
23680<br />
23690<br />
23700<br />
Figure 5. Histogram for the FindFirstFile test, system under high load. Notice that main peak<br />
remains at the same position.<br />
Imagine now, that somebody has installed a rootkit which hides files. Then if we repeat<br />
the tests and draw a corresponding histogram we will notice that peak has been moved<br />
6
towards right side. This is because rootkit must perform additional operations, in this<br />
case, remove the hidden files from the returned list.<br />
In current implementation only a few tests has been used. They check such typical<br />
services like reading directory contents, enumerating processes, enumerating registry<br />
keys and reading from the network socket.<br />
These tests are sufficient to detect such rootkits like famous NT<strong>Rootkit</strong> (see [1]), or<br />
recently very popular Hacker Defender (see [4]) including its clever network backdoor<br />
and of course many more. However some new tests should be added to catch other smart<br />
network backdoors.<br />
False positives and execution path tracing<br />
Although peek detection technique allows us to deal with no deterministic nature of tests<br />
quite well, sometimes we can observe small differences in peak position. The deviation is<br />
about few instructions (generally not more then twenty).<br />
Sometimes this can be a serious problem, since we must decide weather these few<br />
additional instructions means system compromise or just a noise.<br />
To solve this dilemma, <strong>Execution</strong> <strong>Path</strong> Recording should be used. In contrast to pure<br />
EPA, this time, debug handler records the whole path which was executed (addresses and<br />
instructions at this addresses). Then we find the most common path (with the biggest<br />
peak) and make a diff of these two most common paths (the current one and the saved<br />
one).<br />
We should analyze this extra instructions with a good disassembler and decide weather<br />
they are suspicious or not. Example diff between two tests one is shown of figure 6.<br />
In current implementation only the addresses are dumped to the trace files. In future<br />
release the traces will probably be saved as PE files, which will enable the use of some<br />
3 rd party disassemblers (like IDA) .<br />
7
*** RegEnumKey-clear.trace<br />
--- RegEnumKey-current.trace<br />
***************<br />
*** 273,278 ****<br />
--- 273,281 ----<br />
0x80416f60<br />
0x80416f63<br />
0x80416f65<br />
+ 0x80416f67<br />
+ 0x80416f6a<br />
+ 0x80416f6d<br />
0x80416f74<br />
0x80416f76<br />
0x80416f77<br />
***************<br />
*** 1002,1007 ****<br />
--- 1005,1013 ----<br />
0x80416f60<br />
0x80416f63<br />
0x80416f65<br />
+ 0x80416f67<br />
+ 0x80416f6a<br />
+ 0x80416f6d<br />
0x80416f74<br />
0x80416f76<br />
0x80416f77<br />
Figure 6. Differences between two trace dumps (only addresses). We see that 3 additional instruction<br />
has been executed two times (after 275th and 1007th instruction).<br />
<strong>Detection</strong> of ‘offset-in-the-code’ changes<br />
Imagine a rootkit which works similarly to fu rootkit ([3]) mentioned above, but instead<br />
of removing objects from PsActiveProcessList its removes the thread objects from the<br />
internal dispatcher data structures. We said that its not possible, since our hidden<br />
process will not get any CPU time for execution...<br />
However we can imagine that rootkit will also change to scheduler code in the fashion it<br />
will use different offsets (within thread objects) to maintain a list. In other words we<br />
change scheduler code to use different (“shadow”) list. But only the scheduler will be<br />
changed to use this “new” list, everybody else (including IDS tools, like those mentioned<br />
above which can read internal kernel structures) will be using the old list… See figure 7.<br />
8
_KTHREAD<br />
This “shadow” list will<br />
be actually used by the<br />
dispatcher code...<br />
Hidden process<br />
Figure 7. Example of „shadow” threads list (dispatcher code modification is needed, actually<br />
only offsets should be changed).<br />
Although this technique won’t change the number of executed instrcution, we should be<br />
able to detect it, provided we will have Excution <strong>Path</strong> Recording fully implemented (i.e.<br />
we will detect that two traces differ, at positions where the offsets has been „patched”).<br />
This has not been implemneted yet, but should be relatively easy to do.<br />
EPA bypassing and defense<br />
We can think of few ways of cheating presented detector. Lets divide these attacks into<br />
two groups:<br />
• cheating specific tool (attacker know exactly the binary of kernel driver and tester<br />
program)<br />
• more general attacks against the EPA technique.<br />
First, we will consider general ways of cheating detector and how to defend against them.<br />
Then we will discuss vulnerabilities of specific tool and how to avoid them by using<br />
polymorphism.<br />
General attacks and defense<br />
First of all malicious software can hook IDT entry no 1, which contains the address of<br />
debug handler. Then instructions won’t be counted. After rootkit finished its job, it<br />
should unhook IDT debug entry. As a result testing process won’t count the extra rootkit<br />
instructions.<br />
9
inc counter;<br />
iret;<br />
iret;<br />
IDT<br />
...<br />
0h<br />
1h (#DB)<br />
2h<br />
FFh<br />
Figure 8. Simple attack against EPA.<br />
To defend against such attack, we can make use of Intel debug registers. We can use DR0<br />
and DR1 registers to protect whole IDT 1 entry (which is 8 bytes long) against writing<br />
access. In addition we would like to protect this entry against reading, to not allow<br />
hooking debug handler by just inserting jmp instructions somewhere at the beginning of<br />
the debug handler. In other words, we do not want the rootkit to be able to find the<br />
address of debug handler.<br />
However we can not simply protect IDT #1 from reading (by setting appropriate flags in<br />
DR7) because the system will bluescreen, as experience has showed. But there is a simple<br />
solution, which involves adding an extra layer. The solution is depicted on figure 9.<br />
read & write<br />
protection<br />
handler1:<br />
jmp handler2<br />
IDT<br />
0h<br />
write<br />
protection<br />
1h (#DB)<br />
handler2:<br />
inc counter<br />
iret<br />
...<br />
2h<br />
FFh<br />
Figure 9. Hardware protection against #DB hooking.<br />
10
Another attack involves writing such rootkit, that clears TF bit at the beginning of its<br />
body, then does whatever it wants (like removing some processes from the list), and set<br />
TF bit again. Tester process again will report only few more instructions executed, which<br />
would look like a clear system.<br />
Alternatively rootkit can check TF bit in EFLAGS and, when it finds out that it is being<br />
traced, do not execute its malicious instructions. Such behavior does not betray rootkit,<br />
because rootkit detects TF bit only when its instructions are executed in the context of<br />
testing process.<br />
We can defend against such attacks. It should be noted that our debug handler is called<br />
before any instruction to be executed.<br />
Simple defense can be as follow. If debug handler detects that previous executed<br />
instruction was pushf (which stores EFLAFS register onto the stack) then it should<br />
perform the following operation:<br />
and [esp], 0xfffffeff;<br />
which will simulate that TF bit is not set in the EFLAGS. Similarly debug handler should<br />
check if the next instruction to be executed is popf (which loads EFLAGS with the<br />
word found at the top of the stack). And if it is, debug handler should execute the<br />
following code:<br />
or [esp], 0x100;<br />
which sets TF bit, so that if rootkit had tried to clear it would not succeed.<br />
This line of defense seems reasonable, but is not sufficient. <strong>Rootkit</strong> can do the following<br />
in order to detect that somebody is tracing it:<br />
setTFbit();<br />
if (checkTFbit() != 1) {<br />
// we are traced!<br />
}<br />
We see that we should modify our anti-detection mechanism, so that it will remember<br />
weather TF bit has been set by the traced process or not (by adding an extra variable<br />
called TFbitset for example).<br />
11
It should also be noted, that popf/pushf are not the only instructions which are used to<br />
access EFLAGS register. Similar functionality we can also observe in the iret/int<br />
and few others instructions 2 , so that similar steps should be taken.<br />
EFLAGS protection has not been implemented yet, partly because we should be able to<br />
detect such tricks with pushf/popf instructions, by analyzing diffs of execution traces.<br />
However, this should be implemented in future releases.<br />
Attacks against specific tool<br />
If the attacker knows everything about the tool, which implements presented technique,<br />
she can cheat it in many ways. For example, she knows (or can find it very easily, using<br />
pattern searching for example) where, in kernel area, is stored counter variable, which is<br />
incremented by debug handler.<br />
Such attacks are expected to be implemented by rootkit authors, only when a specific tool<br />
will became quite popular. If we had got many tools implementing EPA (or many<br />
versions of one tool), such attack won’t be profitable for the attacker.<br />
However, we would like to be also resistant for such implementation based attacks.<br />
Probably the only way of doing it, is strong polymorphic code generator. After<br />
administrator has downloaded such tool into his system, during installation phase, a<br />
unique kernel driver and testing program should be generated.<br />
Polymorphic generator has not yet been implemented.<br />
Related Work<br />
As it has been said at the beginning, author is not aware of any other general approach to<br />
rootkit detection, which is not based only on memory scanning.<br />
It should be noted that presented technique is not very OS specific, and author has also<br />
implemented a similar detection utility on Linux system. See [5] for more details and<br />
very simple proof of concept code for Linux 2.4.<br />
References<br />
[1] Greg Hoglund, et al, ROOTKIT home, telnet://rootkit.com,<br />
[2] palmers, Sub proc_root Quando Sumus, Phrack Magazine, issue 58, 2001.<br />
[3] fuzen_op, fu rootkit, telnet://rootkit.com,<br />
[4] Holy Father, Hacker Defender Home, http://rootkit.host.sk,<br />
[5] Jan Rutkowski, <strong>Execution</strong> path analysis, Phrack Magazine, issue 59, 2002.<br />
[6] IA-32 Intel Architecture Software Developer’s Manual, vol1-3.<br />
2 The list of all instructions which interact with EFLAGS register can be obtained from [6].<br />
12