Fall - Department of Biostatistics and Epidemiology
Fall - Department of Biostatistics and Epidemiology
Fall - Department of Biostatistics and Epidemiology

You also want an ePaper? Increase the reach of your titles
YUMPU automatically turns print PDFs into web optimized ePapers that Google loves.
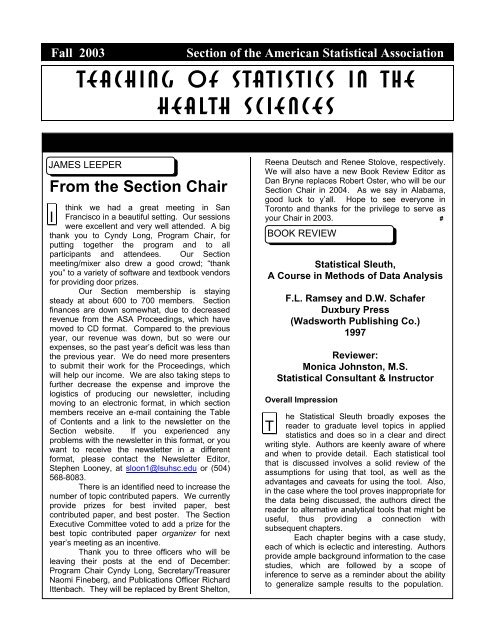
<strong>Fall</strong> 2003<br />
Section <strong>of</strong> the American Statistical Association<br />
TEACHING <strong>of</strong> STATISTICS in the<br />
HEALTH SCIENCES<br />
JAMES LEEPER<br />
From the Section Chair<br />
think we had a great meeting in San<br />
I Francisco in a beautiful setting. Our sessions<br />
were excellent <strong>and</strong> very well attended. A big<br />
thank you to Cyndy Long, Program Chair, for<br />
putting together the program <strong>and</strong> to all<br />
participants <strong>and</strong> attendees. Our Section<br />
meeting/mixer also drew a good crowd; “thank<br />
you” to a variety <strong>of</strong> s<strong>of</strong>tware <strong>and</strong> textbook vendors<br />
for providing door prizes.<br />
Our Section membership is staying<br />
steady at about 600 to 700 members. Section<br />
finances are down somewhat, due to decreased<br />
revenue from the ASA Proceedings, which have<br />
moved to CD format. Compared to the previous<br />
year, our revenue was down, but so were our<br />
expenses, so the past year’s deficit was less than<br />
the previous year. We do need more presenters<br />
to submit their work for the Proceedings, which<br />
will help our income. We are also taking steps to<br />
further decrease the expense <strong>and</strong> improve the<br />
logistics <strong>of</strong> producing our newsletter, including<br />
moving to an electronic format, in which section<br />
members receive an e-mail containing the Table<br />
<strong>of</strong> Contents <strong>and</strong> a link to the newsletter on the<br />
Section website. If you experienced any<br />
problems with the newsletter in this format, or you<br />
want to receive the newsletter in a different<br />
format, please contact the Newsletter Editor,<br />
Stephen Looney, at sloon1@lsuhsc.edu or (504)<br />
568-8083.<br />
There is an identified need to increase the<br />
number <strong>of</strong> topic contributed papers. We currently<br />
provide prizes for best invited paper, best<br />
contributed paper, <strong>and</strong> best poster. The Section<br />
Executive Committee voted to add a prize for the<br />
best topic contributed paper organizer for next<br />
year’s meeting as an incentive.<br />
Thank you to three <strong>of</strong>ficers who will be<br />
leaving their posts at the end <strong>of</strong> December:<br />
Program Chair Cyndy Long, Secretary/Treasurer<br />
Naomi Fineberg, <strong>and</strong> Publications Officer Richard<br />
Ittenbach. They will be replaced by Brent Shelton,<br />
Reena Deutsch <strong>and</strong> Renee Stolove, respectively.<br />
We will also have a new Book Review Editor as<br />
Dan Bryne replaces Robert Oster, who will be our<br />
Section Chair in 2004. As we say in Alabama,<br />
good luck to y’all. Hope to see everyone in<br />
Toronto <strong>and</strong> thanks for the privilege to serve as<br />
your Chair in 2003. #<br />
BOOK REVIEW<br />
Statistical Sleuth,<br />
A Course in Methods <strong>of</strong> Data Analysis<br />
F.L. Ramsey <strong>and</strong> D.W. Schafer<br />
Duxbury Press<br />
(Wadsworth Publishing Co.)<br />
1997<br />
Reviewer:<br />
Monica Johnston, M.S.<br />
Statistical Consultant & Instructor<br />
Overall Impression<br />
he Statistical Sleuth broadly exposes the<br />
T reader to graduate level topics in applied<br />
statistics <strong>and</strong> does so in a clear <strong>and</strong> direct<br />
writing style. Authors are keenly aware <strong>of</strong> where<br />
<strong>and</strong> when to provide detail. Each statistical tool<br />
that is discussed involves a solid review <strong>of</strong> the<br />
assumptions for using that tool, as well as the<br />
advantages <strong>and</strong> caveats for using the tool. Also,<br />
in the case where the tool proves inappropriate for<br />
the data being discussed, the authors direct the<br />
reader to alternative analytical tools that might be<br />
useful, thus providing a connection with<br />
subsequent chapters.<br />
Each chapter begins with a case study,<br />
each <strong>of</strong> which is eclectic <strong>and</strong> interesting. Authors<br />
provide ample background information to the case<br />
studies, which are followed by a scope <strong>of</strong><br />
inference to serve as a reminder about the ability<br />
to generalize sample results to the population.
2 TSHS<br />
Throughout the book, illustrations are poignant<br />
<strong>and</strong> commendable.<br />
Each chapter contains a Related Issues<br />
section, which <strong>of</strong>fers the curious reader<br />
alternatives or extensions to the tools presented<br />
in that chapter <strong>and</strong> references for additional<br />
reading. This section especially adds to the<br />
breadth <strong>of</strong> this book.<br />
Because <strong>of</strong> the fascinating nature <strong>of</strong> the<br />
case studies <strong>and</strong> its emphasis on assumptions <strong>of</strong><br />
analytical tools, choosing appropriate tools, <strong>and</strong><br />
making appropriate inferences, the book serves<br />
as an excellent tool for teaching graduate level<br />
statistics. Due to the diverse nature <strong>of</strong> the case<br />
studies, a consultant or teacher will find that the<br />
case studies, in particular, are not relevant to<br />
clinical studies or health sciences audience,<br />
except where noted.<br />
In general, the book may not serve as a<br />
quick reference for a consultant who is looking for<br />
more information on a particular technique.<br />
Although the case studies are well written, they<br />
are <strong>of</strong>ten cited throughout the book to<br />
demonstrate the use <strong>of</strong> various statistical tools.<br />
Thus, underst<strong>and</strong>ing the use <strong>of</strong> a tool that is<br />
demonstrated on case study data in a later<br />
chapter requires a review <strong>of</strong> the case study in the<br />
chapter in which the case was originally<br />
presented.<br />
Poor formatting for section titles, subtitles,<br />
etc. as well as overuse <strong>of</strong> formatting styles make<br />
the book difficult or uninviting to read. Fluidity<br />
within the chapters is lacking; transitions between<br />
sections are not always evident <strong>and</strong> subsections<br />
sometimes seem unrelated to each other or<br />
perhaps poorly organized within the section.<br />
However, if a vigilant reader can get past the<br />
maze <strong>of</strong> formatting <strong>and</strong> focus on the primary<br />
message <strong>of</strong> choosing appropriate statistical<br />
methods, then he or she will find that the book is a<br />
useful tool for learning.<br />
Description <strong>of</strong> Chapters Relevant to the<br />
Teacher<br />
The emphasis <strong>of</strong> the text is on models <strong>and</strong><br />
methods for analyzing data <strong>and</strong> not on the<br />
mathematical techniques underlying these<br />
methods. The book consists <strong>of</strong> 24 chapters <strong>and</strong><br />
is suitable for a sequence <strong>of</strong> three academic<br />
quarters or two semesters. A CD-ROM<br />
containing data found in the book is included in<br />
the purchase <strong>of</strong> the book. The focus for chapters<br />
is as follows:<br />
Chapters<br />
Focus<br />
1-4 Conclusions <strong>and</strong> interpretations<br />
5-6 Several sample problems<br />
7-8 Regression<br />
9-12 Multiple regression<br />
13-14 Two-way ANOVA<br />
15 Adjustments for Serial Correlation<br />
16 Repeated measures<br />
17 Exploratory Tools for Mulitvariate<br />
Response<br />
18 Comparing Proportions or Odds<br />
19 Tools for Tables <strong>of</strong> Counts<br />
20-21 Logistic Regression (Binary)<br />
22 Log-Linear Regression (Poisson)<br />
23-24 Experimental Design.<br />
Synopsis <strong>of</strong> Chapters<br />
Chapter 1 focuses on interpreting<br />
statistical results. Various sampling methods are<br />
briefly introduced, as are measures <strong>of</strong> central<br />
tendency <strong>and</strong> graphical methods for displaying<br />
data. Case studies are discussed, results<br />
summarized, <strong>and</strong> the scope <strong>of</strong> inference is<br />
provided.<br />
Chapter 2 provides a discussion on<br />
inferences using the t-distribution. One-sample,<br />
paired sample, <strong>and</strong> two-sample examples are<br />
given. Hypothesis testing <strong>and</strong> p-values are<br />
discussed.<br />
Chapter 3 provides a solid discussion on<br />
the assumptions <strong>of</strong> the t-test. Robustness <strong>of</strong> the<br />
t-test against departures from normality,<br />
departures from independence, <strong>and</strong> unequal<br />
st<strong>and</strong>ard deviations, as well as resistance to<br />
outliers, are described especially well.<br />
Alternatives to the t-test are described. An<br />
informative section on data transformation is<br />
given, including interpreting the results. This is<br />
one <strong>of</strong> the strongest chapters <strong>of</strong> the book.<br />
Consultants may find that they frequently return to<br />
this section to review the theory for this widely<br />
used tool.<br />
Chapter 4 focuses on alternatives to the t-<br />
test: rank-sum, permutation, <strong>and</strong> Welch t-tests as<br />
alternatives to the independent samples t-test;<br />
<strong>and</strong> the sign <strong>and</strong> Wilcoxon signed-rank tests as<br />
alternatives to the paired t-test. Related issues<br />
about equality <strong>of</strong> variances, complex sampling<br />
design <strong>and</strong> its affect on st<strong>and</strong>ard errors, <strong>and</strong><br />
nonresponse are briefly presented.<br />
Chapter 5 focuses on the comparison <strong>of</strong><br />
several means. The one-way analysis <strong>of</strong> variance
3 TSHS<br />
F-test is described, including robustness <strong>of</strong> the<br />
test. The residuals plot is introduced as a<br />
diagnostic tool. In the Related Issues section, the<br />
nonparametric alternative to the one-way ANOVA,<br />
the Kruskal-Wallis test, is described.<br />
Chapter 6 extends the discussion in<br />
Chapter 5 to focus on linear combinations <strong>of</strong><br />
means. A variety <strong>of</strong> adjustments for multiple<br />
comparisons <strong>of</strong> means are mentioned: Tukey-<br />
Kramer, Scheffé, least significant difference<br />
(LSD), protected LSD, Bonferroni, Newman-<br />
Keuls, Duncan's multiple range, <strong>and</strong> Dunnett.<br />
Chapter 7 focuses on simple linear<br />
regression using the least squares method for<br />
parameter estimation. The chapter devotes one<br />
section to regression terminology, thus laying a<br />
solid foundation for pending discussions. Model<br />
assumptions, scope <strong>of</strong> inference, <strong>and</strong> prediction<br />
b<strong>and</strong>s are described. This chapter is especially<br />
well illustrated.<br />
Chapter 8 continues the material<br />
discussed in Chapter 7 by focusing on the<br />
assumptions for simple linear regression.<br />
Graphical tools for model assessment are clearly<br />
illustrated <strong>and</strong> described. Interpretation after log<br />
transformation is provided as well as an example<br />
<strong>of</strong> using the F-test for assessing the fit <strong>of</strong> a linear<br />
model.<br />
Chapter 9 extends the concepts in<br />
Chapters 7 <strong>and</strong> 8 to multiple regression. The<br />
authors do an excellent job at discussing the<br />
interpretation <strong>of</strong> regression coefficients by<br />
blending a geometrical explanation with a nongeometrical<br />
explanation. Teachers <strong>and</strong><br />
consultants may find that the flowchart for a<br />
strategy for data analysis is a useful tool in<br />
teaching <strong>and</strong> in practice. This chapter is similarly<br />
well illustrated.<br />
Chapter 10 focuses on inferential tools for<br />
multiple regression. The t-test <strong>and</strong> F-test are<br />
discussed. Interesting topics in the Related<br />
Issues sections include quadratic regression,<br />
polynomial regression, the history <strong>of</strong> parsimonious<br />
modeling, <strong>and</strong> informal tests in model fitting.<br />
Chapter 11 focuses on using graphical<br />
methods to initially assess outliers <strong>and</strong> the need<br />
for a transformation. The importance <strong>of</strong> graphical<br />
displays is continued in the second half <strong>of</strong> this<br />
chapter in looking at partial residual plots in order<br />
to refine regression models. In the Related<br />
Issues section, measurement error in explanatory<br />
variables <strong>and</strong> weighted regression as an<br />
alternative remedy for nonconstant variance are<br />
presented.<br />
Chapter 12 provides a discussion on<br />
strategies for variable selection. Variable<br />
selection techniques such as forward selection,<br />
backward elimination, <strong>and</strong> step-wise regression<br />
are briefly discussed. Multicollinearity is defined<br />
<strong>and</strong> the consequences <strong>of</strong> it are described.<br />
Methods for addressing bias in models are<br />
presented.<br />
Chapter 13 focuses on the analysis <strong>of</strong><br />
variance for two-way classifications. This chapter<br />
contains poignant case studies, especially for<br />
r<strong>and</strong>omized block experiments. However,<br />
terminology specific to the discussion <strong>of</strong> ANOVA<br />
is not explained well. Also, the discussion <strong>of</strong><br />
material relating to the case studies is not<br />
particularly well organized; this is important given<br />
the more complex nature <strong>of</strong> this technique in<br />
comparison to previously described techniques.<br />
Additive <strong>and</strong> non-additive models, along with<br />
parameterization, treatment effects, <strong>and</strong> contrasts<br />
are presented.<br />
Chapter 14 discusses multifactor studies<br />
without replication. Two cases studies, one<br />
agricultural-environmental <strong>and</strong> one involving<br />
cognitive learning in chimpanzees, are described.<br />
Data are analyzed <strong>and</strong> results are presented.<br />
Chapter 15 extends the discussion <strong>of</strong><br />
regression when there are departures from<br />
independence by focusing on adjustments for<br />
serial correlation. Two methods are presented,<br />
one involving adjustments to st<strong>and</strong>ard errors <strong>and</strong><br />
the other involving transformation <strong>of</strong> explanatory<br />
<strong>and</strong> response variables. The chapter ends with a<br />
discussion on techniques for determining if serial<br />
correlation is present to the degree that<br />
adjustment is necessary. Teachers may prefer to<br />
start a discussion on serial correlation using the<br />
later sections <strong>of</strong> the chapter <strong>and</strong> then proceed into<br />
a discussion on performing adjustments.<br />
Chapter 16 is devoted to repeated<br />
measures data. This chapter gives a more than<br />
cursory discussion <strong>of</strong> recognizing mulitivariate<br />
response data <strong>and</strong> strategies for analyzing them,<br />
which is beneficial, especially to students.<br />
Mulitvariate <strong>and</strong> univariate analyses are<br />
compared, which is beneficial to the consultant<br />
analyzing the data. The Related Issues section<br />
contains a host <strong>of</strong> variations on this topic such as<br />
extending the Hotelling's T 2 tools, one-sample<br />
analysis with more than two responses,<br />
MANOVA, <strong>and</strong> the benefits <strong>of</strong> a repeated<br />
measurements experiment.<br />
Chapter 17 discusses exploratory tools<br />
for summarizing multivariate responses. Linear<br />
combinations, principal components analysis, <strong>and</strong><br />
canonical correlation are described. Correspondence<br />
analysis for ordinating categorical<br />
attributes is presented.
4 TSHS<br />
Chapter 18 provides a discussion on the<br />
comparisons <strong>of</strong> proportions or odds. This<br />
chapter, compared to others, is more<br />
mathematical <strong>and</strong> includes step-by-step<br />
calculations. Examples from medicine <strong>and</strong><br />
epidemiology predominate.<br />
Chapter 19 describes analyses for tables<br />
<strong>of</strong> counts. Sampling schemes that lead to 2 X 2<br />
tables are discussed in detail. The Chi-Square<br />
tests for goodness-<strong>of</strong>-fit, homogeneity, <strong>and</strong><br />
independence are well differentiated. Fisher's<br />
Exact Test is described <strong>and</strong> compared with other<br />
tests. The Mantel-Haenszel Test is described in<br />
detail.<br />
Chapter 20 focuses on binary responses<br />
<strong>and</strong> logistic regression analysis. Case studies<br />
include survival in the Donner Party <strong>and</strong> lung<br />
cancer in birdkeeping. Again, fascinating case<br />
studies, but the information is not well organized.<br />
There appears to be an effort to separate the two<br />
cases into separate discussion, but then<br />
throughout the chapter, there is a mixture, a back<strong>and</strong>-forth<br />
motion, <strong>of</strong> discussing both studies.<br />
Also, near the end <strong>of</strong> the chapter, a section<br />
entitled Strategies for Data Analysis Using<br />
Logistic Regression is presented – beneficial, but<br />
perhaps better placed near the beginning <strong>of</strong> the<br />
chapter. As in other chapters, the Related Issues<br />
section leads the curious student or consultant to<br />
the following extensions or alternatives to logistic<br />
regression: probit analysis <strong>and</strong> discriminant<br />
analysis.<br />
Chapter 21 focuses on logistic regression<br />
for binomial counts. The concepts from Chapter<br />
20 are extended to analysis <strong>of</strong> responses that are<br />
proportions.<br />
Chapter 22 focuses on log-linear<br />
regression for Poisson counts. The techniques<br />
that are used in this chapter are similar to those<br />
found in Chapter 20. Tools that extend to data<br />
where responses are Poisson-like but have<br />
excess variation are presented.<br />
Chapter 23 describes the elements <strong>of</strong><br />
research design. This section is important to any<br />
curriculum <strong>and</strong> serves as a vital review for the<br />
consultant who design studies. Brief discussions<br />
<strong>of</strong> control, placebos, blinding, blocking,<br />
stratification, covariates, r<strong>and</strong>omization <strong>and</strong><br />
r<strong>and</strong>om sampling, replication, <strong>and</strong> balancing are<br />
provided. Design choices that affect accuracy<br />
<strong>and</strong> precision (i.e., confidence intervals) are<br />
addressed. Estimating sample size is discussed.<br />
A step-by-step visual for designing studies is<br />
provided.<br />
Chapter 24 describes factorial <strong>and</strong> block<br />
designs <strong>and</strong> complements Chapter 23, thereby<br />
serving as an important review for consultants.<br />
Fractional replication, r<strong>and</strong>omized complete block<br />
designs, balanced incomplete block designs, <strong>and</strong><br />
the Latin Square blocking pattern are discussed. #<br />
BOOK REVIEW<br />
Statistical Modeling for Biomedical<br />
Researchers: A Simple Introduction to<br />
the Analysis <strong>of</strong> Complex Data<br />
William D. Dupont<br />
Cambridge University Press<br />
2003<br />
Reviewer:<br />
Robert A. Oster, Ph.D.<br />
University <strong>of</strong> Alabama at Birmingham<br />
he goal <strong>of</strong> this book is to enable biomedical<br />
T investigators to effectively use several<br />
advanced statistical methods that have been<br />
shown to be valuable in medical research, without<br />
requiring an underst<strong>and</strong>ing <strong>of</strong> mathematics<br />
beyond the high school level. Another goal <strong>of</strong> this<br />
text is to teach biostatistics through the use <strong>of</strong><br />
Stata, which this reviewer has recommended as<br />
an excellent general-purpose statistical s<strong>of</strong>tware<br />
package (Oster 1998, 2002, 2003). As such, the<br />
book should be <strong>of</strong> interest to TSHS members who<br />
teach students in the health sciences (including<br />
public health), <strong>and</strong>/or clinical researchers. The<br />
text may also be <strong>of</strong> interest to members who<br />
consult with medical investigators who have had<br />
some statistical <strong>and</strong> epidemiological training.<br />
The text is intended for people who have<br />
had an introductory course in biostatistics at the<br />
level <strong>of</strong> Pagano <strong>and</strong> Gauvreau (2000), Armitage<br />
<strong>and</strong> Berry (1994), or Daniel (1999), <strong>and</strong> an<br />
introductory course in epidemiology at the level <strong>of</strong><br />
Hennekens <strong>and</strong> Buring (1987) or Rothman <strong>and</strong><br />
Greenl<strong>and</strong> (1998). The text grew out <strong>of</strong> the<br />
author’s second semester course in biostatistics<br />
that is taught in the Master <strong>of</strong> Public Health<br />
program at the V<strong>and</strong>erbilt University Medical<br />
School.<br />
The book contains 11 chapters, one<br />
appendix, a list <strong>of</strong> references, <strong>and</strong> an index.<br />
Chapter 1 (“Introduction”) covers descriptive<br />
statistics, the basics <strong>of</strong> the statistical s<strong>of</strong>tware<br />
package Stata, <strong>and</strong> a refresher on inferential
5 TSHS<br />
statistics (including the normal, t, <strong>and</strong> chi-square<br />
distributions, the two-group t-test with pooled or<br />
unpooled variances, <strong>and</strong> the paired t-test).<br />
Chapter 2 (“Simple Linear Regression”) begins<br />
with a discussion <strong>of</strong> the sample <strong>and</strong> population<br />
covariance <strong>and</strong> correlation coefficients, <strong>and</strong><br />
continues with a description <strong>of</strong> the simple linear<br />
regression model, fitting this model to data,<br />
estimating the precision <strong>of</strong> linear regression<br />
estimates, 95% confidence <strong>and</strong> prediction<br />
intervals, Lowess regression, residual analyses,<br />
data transformations, <strong>and</strong> testing the equality <strong>of</strong><br />
regression slopes. Chapter 3 (“Multiple Linear<br />
Regression”) describes the multiple linear<br />
regression model <strong>and</strong> discusses confounding<br />
variables, estimating parameters for a multiple<br />
linear regression model <strong>and</strong> estimating the<br />
precision <strong>of</strong> these parameter estimates, leverage,<br />
95% confidence <strong>and</strong> prediction intervals,<br />
scatterplot matrix graphs, modeling interaction<br />
terms, automatic methods <strong>of</strong> model selection<br />
(forward, backward, forward stepwise, <strong>and</strong><br />
backward stepwise), collinearity, residual<br />
analyses, <strong>and</strong> influence statistics.<br />
Chapter 4 (“Simple Logistic Regression”)<br />
presents the simple logistic regression model after<br />
describing the sigmoidal family <strong>of</strong> logistic<br />
regression curves, the log odds <strong>of</strong> death given a<br />
logistic probability function, <strong>and</strong> the binomial<br />
distribution. This model is then placed into the<br />
context <strong>of</strong> a generalized linear model. This<br />
chapter continues with a discussion <strong>of</strong> maximum<br />
likelihood estimation, statistical tests <strong>and</strong><br />
confidence intervals used in logistic regression<br />
analysis (including likelihood ratio, score, <strong>and</strong><br />
Wald tests), log odds ratios <strong>and</strong> their associated<br />
95% confidence intervals, logistic regression with<br />
grouped response data, 95% confidence intervals<br />
for proportions, case-control studies, <strong>and</strong> logistic<br />
regression models for 2 x 2 contingency tables.<br />
Chapter 5 (“Multiple Logistic Regression”)<br />
presents the multiple logistic regression model<br />
after describing the Mantel-Haenszel estimate <strong>of</strong><br />
an age-adjusted odds ratio, the Mantel-Haenszel<br />
chi-square statistic for multiple 2 x 2 tables, the<br />
95% confidence interval for the age-adjusted odds<br />
ratio, <strong>and</strong> the Breslow-Day test for homogeneity.<br />
This chapter continues with discussion <strong>of</strong> logistic<br />
regression for multiple 2 x 2 contingency tables,<br />
deriving odds ratios from multiple parameters, the<br />
st<strong>and</strong>ard error <strong>of</strong> <strong>and</strong> confidence intervals <strong>and</strong><br />
hypothesis tests for a weighted sum <strong>of</strong> regression<br />
coefficients, multiplicative models for two risk<br />
factors (with <strong>and</strong> without interaction terms),<br />
nested models, effect modifiers <strong>and</strong> confounding<br />
variables, goodness-<strong>of</strong>-fit tests (the Pearson chisquare<br />
<strong>and</strong> the Hosmer-Lemeshow test), residual<br />
<strong>and</strong> influence analysis, conditional logistic<br />
regression, <strong>and</strong> analyzing data with missing<br />
values.<br />
Chapter 6 (“Introduction to Survival<br />
Analysis”) describes survival <strong>and</strong> cumulative<br />
mortality functions, right censored data, Kaplan-<br />
Meier survival curves, 95% confidence intervals<br />
for survival functions, the cumulative mortality<br />
function, censoring <strong>and</strong> bias, the logrank test,<br />
hazard functions, proportional hazards, relative<br />
risks <strong>and</strong> hazard ratios, <strong>and</strong> simple proportional<br />
hazards regression analysis. Chapter 7 (“Hazard<br />
Regression Analysis”) essentially covers multiple<br />
proportional hazards regression analysis.<br />
Discussed here are proportional hazard models<br />
with covariates, relative risks <strong>and</strong> hazard ratios<br />
when covariates are present, 95% confidence<br />
intervals, hypothesis tests, nested models, Cox-<br />
Snell generalized residuals, stratified proportional<br />
hazards models, survival analysis with staggered<br />
study entry, <strong>and</strong> proportional hazards regression<br />
models with time-dependent covariates.<br />
Chapter 8 (“Introduction to Poisson<br />
Regression: Inferences on Morbidity <strong>and</strong> Mortality<br />
Rates”) presents simple Poisson regression<br />
analysis for 2 x 2 tables after preliminary<br />
discussion <strong>of</strong> incidence, observed incidence,<br />
relative risk, <strong>and</strong> the binomial <strong>and</strong> Poisson<br />
distributions. This chapter continues with<br />
discussion <strong>of</strong> how Poisson regression is a form <strong>of</strong><br />
a generalized linear model; contrasts between<br />
Poisson, logistic, <strong>and</strong> linear regression; a<br />
comparison <strong>of</strong> Poisson regression <strong>and</strong> survival<br />
analysis; <strong>and</strong> Poisson regression with a<br />
classification variable. Chapter 9 (“Multiple<br />
Poisson Regression”) begins with a detailed<br />
presentation <strong>of</strong> the multiple Poisson regression<br />
model, <strong>and</strong> concludes with residual analysis for<br />
this model.<br />
Chapter 10 (“Fixed Effects Analysis <strong>of</strong><br />
Variance”) begins with a general discussion <strong>of</strong><br />
fixed-effects analysis <strong>of</strong> variance, <strong>and</strong> then<br />
progresses to one-way analysis <strong>of</strong> variance,<br />
multiple comparisons, reformulating analysis <strong>of</strong><br />
variance as a linear regression model, nonparametric<br />
methods, <strong>and</strong> other models such as<br />
two-way analysis <strong>of</strong> variance <strong>and</strong> analysis <strong>of</strong><br />
covariance. Chapter 11 (“Repeated-Measures<br />
Analysis <strong>of</strong> Variance”) covers repeated measures<br />
ANOVA. Also covered in this chapter are<br />
response feature analyses, the area-under-thecurve<br />
response feature, generalized estimating<br />
equations (GEE), common correlation structures,<br />
GEE analysis <strong>and</strong> the Huber-White s<strong>and</strong>wich<br />
estimator, <strong>and</strong> GEE analysis with logistic or
6 TSHS<br />
Poisson models. The appendix contains a<br />
detailed summary <strong>of</strong> Stata comm<strong>and</strong>s used in the<br />
text. Finally, the list <strong>of</strong> references contains nearly<br />
80 citations to texts <strong>and</strong> published articles.<br />
I believe that the book is user-friendly. It<br />
gives mathematical <strong>and</strong> statistical explanations<br />
when appropriate, but does not lose the reader in<br />
too many equations <strong>and</strong> in too much statistical<br />
theory. I also like the book’s approach <strong>of</strong> using<br />
problem-based learning, accompanied by<br />
explanatory text. This approach should help the<br />
reader learn the statistical concepts <strong>and</strong> methods<br />
quickly.<br />
The organization <strong>of</strong> this volume is helpful<br />
for learning about statistical modeling. The text<br />
essentially progresses from introductory statistical<br />
material to linear regression (simple <strong>and</strong> multiple),<br />
to logistic regression (simple <strong>and</strong> multiple), to<br />
survival analysis, to Poisson regression (simple<br />
<strong>and</strong> multiple), <strong>and</strong> finally, to analysis <strong>of</strong> variance<br />
(fixed effects <strong>and</strong> repeated measures). This is a<br />
very logical approach to adopt when learning<br />
<strong>and</strong>/or teaching this material. Dupont does a<br />
good job <strong>of</strong> taking the reader from one type <strong>of</strong><br />
modeling to the next.<br />
One <strong>of</strong> the most helpful features <strong>of</strong> this<br />
text is the collection <strong>of</strong> excellent examples<br />
included in each chapter. These examples<br />
illustrate specific statistical concepts, <strong>and</strong> are all<br />
drawn from articles published in the medical <strong>and</strong><br />
public health literature. Results from these<br />
examples are presented in a format that will be<br />
readily accessible to biomedical researchers.<br />
Another one <strong>of</strong> the most useful features <strong>of</strong><br />
this book is a description <strong>of</strong> how to perform the<br />
individual statistical analyses using Stata. These<br />
descriptions include the Stata comm<strong>and</strong>s that<br />
were used, the relevant Stata output, <strong>and</strong><br />
interpretation <strong>of</strong> the output (which appears under<br />
the sub-heading <strong>of</strong> “comments”). A substantial<br />
part <strong>of</strong> the text is devoted to these descriptions<br />
(Stata comm<strong>and</strong>s, Stata output, comments). The<br />
tips provided for the Stata features are critical to<br />
learning the practical aspects <strong>of</strong> performing<br />
statistical analyses using Stata.<br />
I have only minor criticisms <strong>of</strong> Dupont’s<br />
text. First, I believe that the discussion <strong>of</strong> nonparametric<br />
methods in the analysis <strong>of</strong> variance<br />
chapters should have been more complete. The<br />
only non-parametric methods discussed are the<br />
Kruskal-Wallis test <strong>and</strong> the Wilcoxon rank-sum<br />
test. Clearly, these methods are not the focus <strong>of</strong><br />
Dupont’s text. However, I believe that the<br />
Wilcoxon signed-rank test <strong>and</strong> the Friedman test<br />
should have been discussed in these chapters<br />
since these two non-parametric techniques are<br />
relevant to repeated measures analyses.<br />
Second, I was unable to find any<br />
substantive discussion <strong>of</strong> exact statistical tests.<br />
Even though a text <strong>of</strong> this type would not be<br />
expected to emphasize this topic, it would still be<br />
helpful to the reader if these tests were<br />
mentioned, <strong>and</strong> if the criteria under which these<br />
tests should be applied were discussed. I believe<br />
that this could be done in a heuristic manner<br />
without the use <strong>of</strong> mathematical equations.<br />
The version <strong>of</strong> Stata referenced in the text<br />
(version 7) is already out <strong>of</strong> date. Version 8 was<br />
released in early 2003. However, version 7 was<br />
the most current version <strong>of</strong> Stata when the text<br />
was written. Stata comm<strong>and</strong>s from version 7<br />
work fine with version 8. Any book illustrating<br />
statistical concepts with statistical s<strong>of</strong>tware will<br />
have this problem sooner or later.<br />
In conclusion, I highly recommend<br />
“Statistical Modeling for Biomedical Researchers:<br />
A Simple Introduction to the Analysis <strong>of</strong> Complex<br />
Data”. I believe that it will be much appreciated<br />
by biomedical researchers who are eager to learn<br />
more about statistical modeling. I also believe<br />
that biostatisticians will enjoy using this book for<br />
teaching <strong>and</strong> consulting purposes.<br />
REFERENCES<br />
1. Armitage, P., <strong>and</strong> Berry, G. (1994), Statistical<br />
Methods in Medical Research, Oxford: Blackwell<br />
Science.<br />
2. Daniel, W. (1999), <strong>Biostatistics</strong>: A Foundation<br />
for Analysis in the Health Sciences (7 th ed.), New<br />
York: Wiley.<br />
3. Hennekens, C.H., <strong>and</strong> Buring, J.E. (1987),<br />
<strong>Epidemiology</strong> in Medicine, Boston, MA: Little,<br />
Brown, <strong>and</strong> Company, 1987.<br />
4. Oster, R.A. (1998), “An Examination <strong>of</strong> Five<br />
Statistical S<strong>of</strong>tware Packages for <strong>Epidemiology</strong>,”<br />
The American Statistician, 52, 267-280.<br />
5. Oster, R.A. (2002), “An Examination <strong>of</strong><br />
Statistical S<strong>of</strong>tware Packages for Categorical<br />
Data Analysis Using Exact Methods,” The<br />
American Statistician, 56, 235-246.<br />
6. Oster, R.A. (2003), “An Examination <strong>of</strong><br />
Statistical S<strong>of</strong>tware Packages for Categorical<br />
Data Analysis Using Exact Methods – Part II,” The<br />
American Statistician, 57, 201-213.<br />
7. Pagano, M., <strong>and</strong> Gauvreau, K. (2000),<br />
Principles <strong>of</strong> <strong>Biostatistics</strong> (2 nd ed.), Belmont, CA:<br />
Duxbury Thompson Learning.<br />
8. Rothman, K.J., <strong>and</strong> Greenl<strong>and</strong>, S. (1998),<br />
Modern <strong>Epidemiology</strong>, Philadelphia: Lippincott-<br />
Raven. #
7 TSHS<br />
From the Book Review<br />
Column Editor<br />
Robert Oster, PhD<br />
University <strong>of</strong> Alabama at Birmingham<br />
<strong>Fall</strong> 2003 Update <strong>and</strong> Highlight <strong>of</strong> Book<br />
Reviews from Recent Issues <strong>of</strong><br />
The American Statistician<br />
Update on Book Reviews<br />
his will be my final column as the book<br />
T review editor <strong>of</strong> the TSHS newsletter. I am<br />
resigning from this position so that I can<br />
focus on my responsibilities as TSHS Chair during<br />
2004. I also believe that it is time to give another<br />
section member the opportunity to serve as your<br />
book review editor. I have enjoyed serving as the<br />
book review editor for the last three years (2001-<br />
2003). Thank you for all <strong>of</strong> your helpful<br />
suggestions <strong>and</strong> words <strong>of</strong> encouragement.<br />
The new book review editor is Dan Byrne.<br />
Dan is located at the V<strong>and</strong>erbilt University<br />
Medical School. From now on, please send all<br />
book reviews, suggestions for books to review,<br />
<strong>and</strong> suggestions for book reviewers to Dan. I still<br />
encourage your participation in writing book<br />
reviews. Guidelines for book reviews appeared in<br />
the Spring 2001 <strong>and</strong> <strong>Fall</strong> 2001 issues <strong>of</strong> the TSHS<br />
newsletter. Dan’s contact information is as<br />
follows: telephone (615) 322-4228; fax (615) 322-<br />
1754; e-mail, Daniel.Byrne@V<strong>and</strong>erbilt.edu.<br />
Please welcome Dan as the new book review<br />
editor!<br />
Two book reviews appear in this issue <strong>of</strong><br />
the newsletter. First, Monica Johnston reviews<br />
the book The Statistical Sleuth. Monica, who is a<br />
new TSHS member, used The Statistical Sleuth<br />
as a text in one her graduate courses, <strong>and</strong> was<br />
enthusiastic about writing the review. I encourage<br />
you to read Monica’s detailed <strong>and</strong> well-written<br />
book review.<br />
Second, I review the book Statistical<br />
Modeling for Biomedical Researchers: A Simple<br />
Introduction to the Analysis <strong>of</strong> Complex Data,<br />
authored by William D. Dupont. Dr. Dupont, who<br />
is also a TSHS member, specifically asked that<br />
his book be reviewed in this newsletter; he was<br />
also kind enough to ask the book publisher<br />
(Cambridge University Press) to provide me with<br />
a copy <strong>of</strong> the text. I encourage you to read this<br />
book review. You may even want to examine the<br />
book yourself!<br />
Highlight <strong>of</strong> Book Reviews from Recent Issues<br />
<strong>of</strong> The American Statistician<br />
In this issue, I highlight 7 detailed book<br />
reviews (<strong>and</strong> therefore, 7 books) that appeared in<br />
issues <strong>of</strong> The American Statistician beginning with<br />
the February 2002 issue <strong>and</strong> concluding with the<br />
August 2003 issue. In the Spring 2003 issue <strong>of</strong><br />
this newsletter, I highlighted book reviews<br />
appearing in the 2000 <strong>and</strong> 2001 issues <strong>of</strong> The<br />
American Statistician (up through December<br />
2001).<br />
The book reviews I highlight in this<br />
column examine books that could be used for<br />
teaching, consulting, <strong>and</strong>/or training purposes. I<br />
am not necessarily recommending that section<br />
members adopt these books for classroom or<br />
personal use; the decision on book adoption is left<br />
up to individual members. I have added some <strong>of</strong><br />
my own comments after listing the specific book<br />
reviews.<br />
1. Applied Multivariate Data Analysis (2 nd ed.), by<br />
B.S. Everitt <strong>and</strong> G. Dunn, Arnold / Oxford<br />
University Press, 2001, reviewed by C. Williams,<br />
August 2002, pp. 248-249.<br />
2. Statistical Consulting, by J. Cabrera <strong>and</strong> A.<br />
McDougall, Springer-Verlag, 2002, reviewed by<br />
C.M. Anderson-Cook, November 2002, p. 329.<br />
3. Statistics at Square Two: Underst<strong>and</strong>ing<br />
Modern Statistical Applications in Medicine, by<br />
M.J. Campbell, BMJ Books, 2001, reviewed by<br />
R.D. Abbott, November 2002, p. 331.<br />
4. Statistics with Confidence (2 nd ed.), by D.<br />
Altman, D. Machin, T. Bryant, <strong>and</strong> M. Gardner<br />
(eds.), BMJ Publishing Group, 2000, reviewed by<br />
R.J. Cleary, February 2003, p. 66.<br />
5. A First Course in Design <strong>and</strong> Analysis <strong>of</strong><br />
Experiments, by G.W. Oehlert, Kluwer Academic<br />
Publishers, 2000, reviewed by S.S. Wulff,<br />
February 2003, pp. 66-67.<br />
6. Statistical Rules <strong>of</strong> Thumb, by G. van Belle,<br />
Wiley, 2002, reviewed by R.J. Cleary, May 2003,<br />
p. 142.<br />
7. The Statistical Sleuth (2 nd ed.), by F.L. Ramsey<br />
<strong>and</strong> D.W. Schafer, Duxbury, 2002, reviewed by J.
8 TSHS<br />
Ledolter, May 2003, pp. 145-146.<br />
I believe that each <strong>of</strong> these books is<br />
oriented toward those whom TSHS members<br />
teach, train, or consult with. In the table below, I<br />
have stated what the intended audience is for<br />
each book <strong>and</strong> my perception <strong>of</strong> the tone <strong>of</strong> the<br />
corresponding book review.<br />
Book<br />
Intended Audience & Tone <strong>of</strong> Review<br />
# 1 Applied science researchers <strong>and</strong> science<br />
students with a significant amount <strong>of</strong><br />
knowledge in statistics; Somewhat<br />
Positive<br />
# 2 Statistical consultants, statistics students<br />
(senior undergraduate or junior graduate);<br />
Positive<br />
# 3 Physicians, health care providers, medical<br />
investigators; Somewhat Positive<br />
# 4 Medical researchers; Positive<br />
# 5 Non-statisticians <strong>and</strong> students<br />
(undergraduate <strong>and</strong> graduate) who have<br />
had an introductory statistical methods<br />
course, statisticians; Positive<br />
# 6 Applied researchers, graduate students,<br />
statisticians; Positive<br />
# 7 Applied researchers <strong>and</strong> non-statistics<br />
graduate students with a prior introductory<br />
statistics course, graduate statistics<br />
students; Mostly Positive<br />
I hope that this table is helpful to you.<br />
The new book review editor will be<br />
interested in hearing any experiences, positive or<br />
negative, that you have had with any <strong>of</strong> the above<br />
books or with any books that have been<br />
highlighted in prior issues <strong>of</strong> this newsletter. #<br />
2004 JSM IN TORONTO<br />
From the 2004 Program<br />
Chair: Brent J. Shelton<br />
UPDATE ON TSHS PROGRAM FOR<br />
JSM 2004<br />
he 2004 Joint Statistical Meetings will be<br />
T held August 8-12, 2004 in Toronto, Ontario,<br />
Canada. In preparation for this meeting, I<br />
wanted to update the members <strong>of</strong> our section on<br />
the plans we have in place thus far for our one<br />
invited session. I also want to take the<br />
opportunity to thank Ms. Martha Aliaga who has<br />
recently moved from the University <strong>of</strong> Michigan to<br />
the ASA program <strong>of</strong>fice in Alex<strong>and</strong>ria, Virginia.<br />
She will serve as the 2004 TSHS invited session<br />
organizer <strong>and</strong> has managed to identify 4 good<br />
speakers for our invited session. The invited<br />
session will be devoted entirely to "Ways to<br />
Increase the Number <strong>of</strong> U.S. Resident Students<br />
Who Obtain Ph.D.'s in Statistics <strong>and</strong> <strong>Biostatistics</strong>".<br />
Mary Gray from American University will speak on<br />
the topic <strong>of</strong> “Attracting Minorities to the Fields <strong>of</strong><br />
Statistics <strong>and</strong> <strong>Biostatistics</strong>," George Cobb <strong>of</strong><br />
Mount Holyoke College will speak on the topic <strong>of</strong><br />
"Creating Interest in the Subject Matter," <strong>and</strong><br />
Louise Ryan from Harvard University <strong>and</strong> Ed<br />
Rothman from the University <strong>of</strong> Michigan (former<br />
chair <strong>of</strong> statistics there) will be speaking on<br />
“Retention <strong>of</strong> Students <strong>and</strong> Changing the<br />
<strong>Department</strong>’s Environment.” We may also have<br />
a speaker to discuss “The Role <strong>of</strong> the ASA Center<br />
for Statistics Education,” but this has not been<br />
confirmed as yet.<br />
PLEASE HELP! Please consider getting<br />
involved in JSM 2004 by making a contributed<br />
presentation <strong>of</strong> some form. As has been done<br />
previously, TSHS will be giving awards for Best<br />
Invited Paper, Best Contributed Paper, <strong>and</strong> Best<br />
Poster. Abstracts for contributed presentations<br />
are due February 1, 2004. Information <strong>and</strong> forms<br />
will be available in the November 2003 issue <strong>of</strong><br />
Amstat News, <strong>and</strong> an online version will be<br />
available by December 1, 2003 at<br />
http://www.amstat.org/meetings/jsm/2004/.<br />
In addition to contributed papers <strong>and</strong> posters,<br />
I am also soliciting organizers for Topic<br />
Contributed Sessions. I have spoken to at least<br />
three folks who are interested in organizing a<br />
Topic Contributed Paper session, but have not<br />
heard anything definitive from them yet. There is<br />
no limit to the number <strong>of</strong> Topic Contributed<br />
Sessions that our Section can sponsor. If you<br />
have an idea for a topic <strong>and</strong>/or speakers you<br />
would like to bring together in a session, please<br />
contact me. A new award, for Best Topic<br />
Contributed Paper Organizer, will be presented by<br />
the Section for the first time in 2004.<br />
Your participation in TSHS sessions at JSM<br />
2004 will be greatly appreciated. Feel free to<br />
contact me (bshelton@kcp.uky.edu or 859-219-<br />
0771 x301) if you have any questions or would
9 TSHS<br />
like to get involved with the 2004 TSHS program.<br />
I look forward to seeing you good folks in Toronto<br />
in August <strong>of</strong> 2004. #<br />
2003 JSM IN SAN FRANCISCO<br />
From the 2003 Program<br />
Chair: Cynthia R. Long<br />
JSM 2003 RECAP<br />
ur JSM 2003 program was a success. The<br />
invited session “Including Modern<br />
O<br />
Statistical Methods in Teaching<br />
<strong>Biostatistics</strong> to Health Care Pr<strong>of</strong>essionals,”<br />
drew an audience <strong>of</strong> more than 50 individuals<br />
(st<strong>and</strong>ing room only!). The following links will give<br />
you a taste <strong>of</strong> the session<br />
http://www.public.iastate.edu/~wrstephe/JSM2003<br />
/Bootstrap.proc.pdf,<br />
http://www.epibiostat.ucsf.edu/epidem/personnel/<br />
cemJSMTalk_TICRBiostat.pdf).<br />
The two contributed paper sessions,<br />
“Issues <strong>and</strong> Opportunities in the Teaching <strong>of</strong><br />
Statistics in the Health <strong>and</strong> Behavioral<br />
Sciences” <strong>and</strong> “Innovative Uses <strong>of</strong> Statistical<br />
Designs <strong>and</strong> Methods in the Health Sciences”<br />
each had audiences <strong>of</strong> 20-30 individuals. There<br />
were 2 Best Contributed Paper award winners:<br />
Rossi Alim Hassad for “Teaching Introductory<br />
Statistics in the Behavioral Sciences—Approach<br />
<strong>and</strong> Rationale” <strong>and</strong> Patrick M. Tarwater for<br />
“Censored Observations: Teaching Self-<br />
Consistency Equations.” Both received a check<br />
for $100 <strong>and</strong> a plaque. Congratulations to both <strong>of</strong><br />
you! We also had two contributed posters <strong>and</strong> the<br />
CE course “Sample Size Analysis in Study<br />
Planning” given by Ralph O’Brien <strong>and</strong> John<br />
Castelloe was another big hit. Thanks again to all<br />
<strong>of</strong> the presenters <strong>and</strong> to the session chairs. #<br />
NEW COLUMN<br />
INTERACTIONS<br />
Vision Statement<br />
Renee Stolove, PT, MA, MPH<br />
Director <strong>of</strong> Clinical Education<br />
Assistant Pr<strong>of</strong>essor <strong>of</strong> Practice in<br />
Health Sciences<br />
New York Medical College Program in<br />
Physical Therapy<br />
he primary purpose <strong>of</strong> this column will be to<br />
T facilitate communication between statistical<br />
educators <strong>and</strong> the health care practitioners<br />
they teach. Presentations at JSM <strong>and</strong> other<br />
statistics meetings tend to focus on the<br />
challenges faced by statisticians when teaching<br />
this audience. I would like to present the<br />
viewpoints <strong>of</strong> the learners as well.<br />
Most JSM presentations in this area have<br />
been case studies. This is a good start <strong>and</strong> can<br />
serve as the basis for quantitative efforts. This<br />
column can serve to promote networking among<br />
members for both qualitative <strong>and</strong> quantitative<br />
research.<br />
I am calling for contributions from both<br />
section members <strong>and</strong> their clinical colleagues.<br />
Some specific questions are presented for your<br />
consideration.<br />
● How does the healthcare community perceive<br />
the role <strong>of</strong> statisticians Does this vary between<br />
pr<strong>of</strong>essions Has this changed with the advent <strong>of</strong><br />
evidence-based practice<br />
● When teaching statistics to healthcare<br />
practitioners, what should be emphasized What<br />
do clinicians need to know<br />
● In particular, what does work For example, I<br />
would welcome collaboration through a Book<br />
Review column on textbooks that are useful for<br />
this audience.<br />
● How do we measure outcomes (And what<br />
outcomes should we be measuring)<br />
I hope that I have given you some food for<br />
thought Personally, I would welcome a<br />
‘quantitative compadre’ with whom I could<br />
collaborate. #
10 TSHS<br />
2003 Section Officers for TSHS<br />
Chair James Leeper (205) 348-1355 jleeper@cchs.ua.edu<br />
Past Chair Todd Nick (601) 984-6313 tnick@shrp.umsmed.edu<br />
Chair-Elect Robert Oster (205) 934-5165 oster@uab.edu<br />
Program Chair Cynthia Long (319) 884-5157 long_c@palmer.edu<br />
Program Chair-Elect Brent Shelton (205) 934-4920 bshelton@uab.edu<br />
Publications Officer Richard Ittenbach (215) 590-5943 ittenbach@email.chop.edu<br />
Newsletter Editor Stephen Looney (504) 568-8083 sloone@lsuhsc.edu<br />
Secretary-Treas. Naomi Fineberg (317) 274-4334 nfineber@iupui.edu<br />
Council <strong>of</strong> Sections Rep. Ralph O’Brien (216) 445-9451 robrien@bio.ri.ccf.org<br />
ASA Staff Liaison Madge Haven (703) 684-1221 madge@amstat.org<br />
William B. Smith (703) 684-1221 williambsmith@amstat.org<br />
A BIG pat on the back for these deserving statisticians . . .<br />
TSHS Presentation Award winners at the 2003 JSM in San Francisco:<br />
Best Regular Contributed Paper: Rossi Alim Hassad, Mercy College<br />
Patrick M. Tarwater, University <strong>of</strong> Texas<br />
American Statistical Association<br />
TSHS Newsletter<br />
Stephen W. Looney, Ph.D., Editor<br />
<strong>Biostatistics</strong> Program<br />
LSU Health Sciences Center<br />
School <strong>of</strong> Public Health<br />
1600 Canal St., Suite 800<br />
New Orleans, LA 70125<br />
USA