8 Unified Power Analysis for t-Tests through Multivariate Hypotheses
8 Unified Power Analysis for t-Tests through Multivariate Hypotheses
8 Unified Power Analysis for t-Tests through Multivariate Hypotheses

Create successful ePaper yourself
Turn your PDF publications into a flip-book with our unique Google optimized e-Paper software.
Manuscript <strong>for</strong> Chapter 8 (pp. 297-344) of book edited by Edwards LK (1993), Applied <strong>Analysis</strong> of Variancein the Behavioral Sciences, New York: Marcel Dekker. Translated to pdf <strong>for</strong>mat: 4 July 1998.8<strong>Unified</strong> <strong>Power</strong> <strong>Analysis</strong> <strong>for</strong>t-<strong>Tests</strong> <strong>through</strong> <strong>Multivariate</strong> <strong>Hypotheses</strong>Ralph G. O'Brien 1 Keith E. Muller 2Cleveland Clinic Foundation University of North CarolinaCleveland, OHChapel Hill, NC8.1 INTRODUCTIONDetermining adequate and efficient sample sizes is often critical in designing worthystudies. Yet too many studies have sample sizes that are too small to ensure enoughstatistical power to confirm meaningful effects. Freiman, Chalmers, Smith, and Kuebler(1979) concluded this about clinical trials in medicine. Sedlmeier and Gigerenzer (1989)reached a similar judgment about studies in psychology. The message in both articles iscogent to all fields that rely on statistical inference. Perhaps such articles are havingpositive effects, <strong>for</strong> we see signs that researchers are now paying more attention to power.For example, reviewers of research proposals now often require that sound power analysesbe done be<strong>for</strong>e they will recommend funding or access to facilities and subject populations.Going <strong>through</strong> the process of determining and justifying the sample size also has animportant ancillary effect: it catalyzes the synergism between science and statistics at thestudy's conception. The statistician who per<strong>for</strong>ms a thorough power analysis is more likelyto scrutinize the proposed design, assess issues regarding data management, and develop asound plan <strong>for</strong> the data analysis. Such involvement can improve the proposal in a numberof ways, thus increasing its chance <strong>for</strong> approval, funding, scientific success, andpublication.In this chapter, we present a strategy <strong>for</strong> per<strong>for</strong>ming power analyses that is applicableto the broad range of methods subsumed by the classical normal-theory univariate ormultivariate general linear models. First, we introduce the requisite concepts of statisticalpower using concepts from the familiar t-test to compare two independent group means.Second, we proceed to the comparison of two correlated means (matched-pairs problem)and on to the one-way analysis of variance (ANOVA) with contrasts <strong>for</strong> a completelyrandomized design. Third, we develop power analysis <strong>for</strong> the univariate general linearmodel, thus providing a broad range of applications. We illustrate this with an analysis ofcovariance (ANCOVA) problem that has unequal distributions of the covariate's values1 Supported in part by grants from the US National Institutes of Health (GCRC: RR00082) and theUniversity of Florida Division of Sponsored Research, which funded Zhanying Bai and Yonghwan Umin their wriitng of one portion of the OneWyPow.sas freeware module. Dan Bowling helped in manyways. E-mail: robrien@bio.ri.ccf.org.2 Supported in part by grants from the US National Institutes of Health (NICHD: P30-HD03110-22,NCI: P01 CA47982-04, GCRC: RR00046). E-mail: muller@bios.unc.edu
2 <strong>Unified</strong> <strong>Power</strong> <strong>Analysis</strong>among the groups as well as heterogeneous slopes. Fourth, we broaden the range stillfurther by outlining an approximation <strong>for</strong> determining power under the multivariate generallinear model. This is illustrated with a repeated-measures problem solved by using themultivariate analysis of variance (MANOVA) approach. Fifth and finally, we outlinepower analysis strategies developed <strong>for</strong> other types of methods, especially <strong>for</strong> tests tocompare two independent proportions.With writings on sample-size choice and power analysis <strong>for</strong> many methods now soplentiful, why do we offer yet another one? Like Kraemer and Thiemann (1987), wepresent an approach that unifies many seemingly diverse methods. We think our methodis intuitive, because we develop the strong parallels between ordinary data analysis andpower analysis. To make the methods easier to use, we distribute modules of statementsto direct the popular SAS ® System (1990) to per<strong>for</strong>m and table (or graph) sets of powercomputations. Our ultimate goal is to show how a single approach covers a broad class oftests.Rather than restricting attention to the power of the traditional tests (e.g., overall maineffects and interactions), our methods allow one to easily examine statistical hypothesesthat are more tailored to specific research questions. Departing from most writings onstatistical power, we take unbalanced designs to be the norm rather than the exception.Many effective research designs use unequal sample sizes, as when certain types ofsubjects are easier than others to recruit or when certain treatments are more expensive persubject to apply. Thus, researchers and statisticians must decide how the total sample sizewill be allocated among the different groups of cases, with a balanced allocation being aspecial case.We avoid oversimplifying the concept of effect size, as researchers often do when theyemploy rules of thumb, such as Cohen's (1988, 1992) “small,” medium,” and “large”categorizations. A tiny effect size <strong>for</strong> one research question and study could be a hugeeffect size in another. Researchers often claim that their studies promise “medium” effectsizes, but they have no objective grounds to justify such a claim. Our scheme <strong>for</strong>cesresearchers to give specific conjectures or estimates <strong>for</strong> the relevant statistical parameters,such as the population means and standard deviations <strong>for</strong> an ANOVA problem. Theconjectures are then used directly to calculate effect sizes, which determine statistical power<strong>for</strong> a proposed sample size. Our detailed examples illustrate how straight<strong>for</strong>ward it is to dothese things. Sample-size analysis is not harder to do than data analysis; as we shall see,the two problems are very similar.The best hypothesis-driven research proposals include quite definite plans <strong>for</strong> dataanalyses, plans that merge the scientific hypotheses with the research design and the data.A good sample-size analysis must be congruent with a good plan <strong>for</strong> the data analysis.There are hundreds of other common statistical procedures besides normal-theory linearmodels, and there are thousands of uncommon methods and an unlimited number of“customized” ones that are developed <strong>for</strong> unique applications. While we can cover power<strong>for</strong> many of the common methods <strong>for</strong> statistical inference, one chapter cannot beexhaustive of all known or possible sample-size methods.One final general point is in order. Many treatments on statistical power choose to
8.2 t-<strong>Tests</strong> and One-way ANOVA 3address questions like “If I per<strong>for</strong>m this particular hypothesis test and my conjectures aretrue about the expected data, what sample size do I need to achieve a power of .90?” Butmost studies have multiple hypotheses to test, and thus this kind of sample-size analysisdetermines separate sample sizes <strong>for</strong> the different hypothesis tests within a single study.This is confusing. Instead, our approach addresses questions like “If I study a total of Nsubjects, what are the powers <strong>for</strong> the different hypothesis tests I plan to per<strong>for</strong>m?” This isthe way of most studies—one total sample size, several hypotheses to be examined. Inthose limited cases where there really is but one key hypothesis, one is still limited byresources on how large the sample size can be. The question here becomes: “I can study,at most, N subjects. Will this give me sufficient power?” If that value <strong>for</strong> N gives “toomuch” power, one can spend a few minutes investigating lower values to find somethingmore efficient.At the end of each major section, we explore the art of power analysis by presentingrealistic, detailed examples inspired by actual studies conducted within the interface ofbehavioral and medical research. All of these case studies are fictionalized to some degreeto make them more useful in this chapter. We use bogus names <strong>for</strong> the researchers anddrugs, as well as <strong>for</strong> many of the scientific terms and measurements.8.2 UNIVARIATE t-TESTS AND THE ONE-WAY ANOVA8.2.1 Comparing Two Independent MeansCommon t-tests probably are used more frequently than any other statistical method. Incomparing the population means (µ) from two independent groups, we are <strong>for</strong>mallycomparing a null hypothesis, H 0 : µ 1 = µ 2 , with a research (“alternative”) hypothesis that iseither nondirectional, H A : µ 1 ≠ µ 2 , or directional, H A : µ 1 > µ 2 or H A : µ 1 < µ 2 . We “assessthe improbability of H 0 ” by measuring the observed statistical difference between thesample means withµt = 1 – µ 2σn 1 + 1 1/21 n 2, (8.1)where µ j is the sample mean <strong>for</strong> group j, n j is the sample size <strong>for</strong> group j, and σ is thepooled sample standard deviation. Using N = n 1 + n 2 , we can reexpress the t statistic ast = N 1/2 (w 1 w 2 ) 1/2 (µ 1 – µ 2 )/σ , (8.2)where w j = n j /N is the proportion of cases in group j. Obviously, w 2 = 1 – w 1 . We havegrouped the terms to show the distinct components of this t statistic. We call the term(µ 1– µ 2)/σ = ψ the estimate of nature's effect size. ψ is used often in meta analysis tomeasure the relative difference between the sample means. The structure of the designdefines the term (w 1 w 2 ) 1/2 ; thus (w 1 w 2 ) 1/2 ψ is an estimate of the effect size specific to thatstructure. Factoring in N 1/2 gives us t. We will soon see how the t and its componentstranslate directly into their counterparts in power analysis.If H 0 is true, and the observations are independent, and they are distributed as Normal
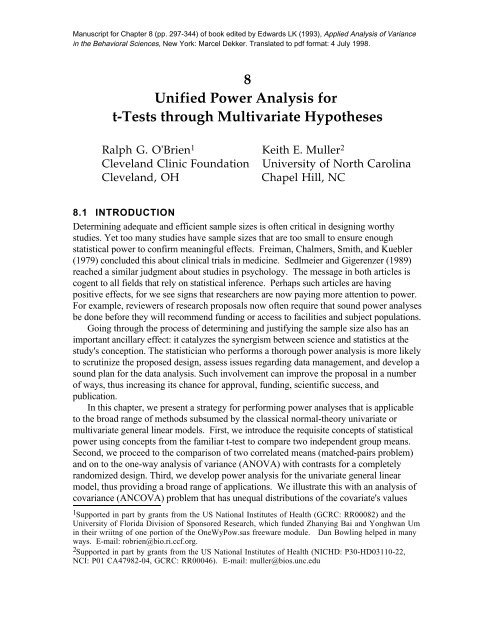
4 <strong>Unified</strong> <strong>Power</strong> <strong>Analysis</strong>random variables having the same variance in both groups, then t is a central t randomvariable with N – 2 degrees of freedom <strong>for</strong> error (df E ), denoted here as t(df E ). Let t α be theupper-tail critical value, satisfying: α = Pr[ t(df E ) ≥ t α ]. Thus, α is the Type I error rate.Directional tests are based on t α (or –t α , depending on how H A is defined). Nondirectionaltests can use t α/2 and –t α/2 . This is identical to using F = t 2 2and F α = t α/2 , which is a <strong>for</strong>mthat better unifies our discussion <strong>through</strong>out. While strict Normality usually does not hold,the practical consequences of the Central Limit Theorem allow us to suppose that t is stilldistributed as t(df E ) <strong>for</strong> many non-Normal situations.8.2.1.1 Directional Research HypothesisFirst we discuss the power of the directional test, and we define it using H A : µ 1 > µ 2 . Thepower is simply the rejection rate, Pr[t ≥ t α ], when H 0 is false. (When H 0 is true, therejection rate is simply α.) <strong>Power</strong> is dependent on the noncentrality value,δ = N 1/2 (w 1 w 2 ) 1/2 (µ 1 – µ 2 )/σ , (8.3)which is positive <strong>for</strong> H A : µ 1 > µ 2 . Note that δ is merely the t value that would result if onehad “exemplary” data, that is, data in which µ 1 ≡ µ 1 , µ 2 ≡ µ 2 , and σ ≡ σ. Thus δ measuresthe statistical difference between two population means as realized with n 1 and n 2observations.It is helpful to see δ constructed as diagrammed in Figure 8.1. Begin with nature'seffect sizeψ = (µ 1 – µ 2 )/σ, (8.4)which depends on parameters related only to what is being studied, not how it is goingto be studied. Because µ 1 , µ 2 , and σ are almost always unknown in practice, makingconjectures or estimates <strong>for</strong> these values comes after considering the coordinating theory ofthe problem, reviewing the literature, and, sometimes, collecting pilot data. The primarynoncentrality isδ ∗ = (w 1 w 2 ) 1/2 ψ. (8.5)This (w 1 w 2 ) 1/2 factor depends only on the structure of design. Note that δ ∗ is maximizedat w 1 = w 2 = .5. Factoring in the total sample size gives the noncentrality,δ = N 1/2 δ ∗ . (8.6)This description shows how noncentrality, which determines power, is a function of threedistinct components: what nature hides from us (ψ), the structure of the design (w 1 andw 2 ), and the size of the sample (N).Under the same distributional assumptions outlined above, t is distributed as anoncentral t random variable with df E = N – 2 and noncentrality δ, which is denoted ast(df E , δ). The central t is simply t(df E , 0). The power isΩ = Pr[ t(df E , δ) ≥ t α ]. (8.7)
8.2 t-<strong>Tests</strong> and One-way ANOVA 5Nature: µ 1 , µ 2 , σWhat are the population values<strong>for</strong> the means and the commonwithin-group standard deviation?Nature's Effect Sizeψ = (µ 1 − µ 2 )/σStructure of Design: w 1 , w 2What are the weights (proportions)<strong>for</strong> the groups' sample sizes?Primary Noncentralityδ ∗ = (w 1 w 2 ) 1/2 ψSize of Design: NWhat is the total sample size?Noncentralityδ = (N) 1/2 δ ∗Type I Error Rate: αWhat α-level will be used?Central and Noncentral t Distribution FunctionsStatistical<strong>Power</strong>Figure 8.1. Building the noncentrality <strong>for</strong> the two-group t statistic.
6 <strong>Unified</strong> <strong>Power</strong> <strong>Analysis</strong><strong>Power</strong> values can be found using a suitable computing routine, table, or graph. Forexample, one can use the SAS statements:t_alpha = TINV(1 - alpha, dfE, 0);power = 1 - PROBT( t_alpha, dfE, delta);Note that TINV and PROBT are defined with respect to the cumulative distributionfunction, hence the need <strong>for</strong> “1 - alpha” and “1 - PROBT()” to get values with respect tothe upper tail.The mean of a noncentral t random variable is approximated well byE [t(df E , δ)] ≈ N 1/2 δ ∗ {(4df E – 1)/(4df E – 4)}, <strong>for</strong> df E > 1, (8.8)a result immediately deducible from the work on meta analysis by Hedges (1981). Notethat the mean increases as either N or δ ∗ increase. This always increases the power of thetest.8.2.1.2 Nondirectional Research HypothesisWhen the research hypothesis is H A : µ 1 ≠ µ 2 , it is more straight<strong>for</strong>ward to use the statisticF = t 2 , so that the split rejection region of the central t distribution is unified into the uppertail of the central F. In general, F statistics in ANOVA and linear models can be denotedas being central (if H 0 is true) or noncentral F random variables with noncentrality λ (withdf H and df E degrees of freedom in the numerator and denominator, respectively). Wedenote this as F(df H , df E , λ); λ = 0 defines the familiar central F. For the two-groupproblem, we test H 0 by taking F = t 2 to be F(1, N – 2, 0). In general, we define F α to bethe upper-tail critical value, satisfying: α = Pr[ F(df H , df E , 0) ≥ F α ].For F = t 2 the noncentrality and primary noncentrality areλ = δ 2 and λ ∗ = λ/N = (δ ∗ ) 2 . (8.9)The power <strong>for</strong> the nondirectional (“2-tailed”) t-test is thenΩ = Pr[ F(df H , df E , λ) ≥ F α ], (8.10)with df H = 1 and df E = N – 2. We can compute this using the SAS functions FINV andPROBF, as in:F_alpha = FINV(1-alpha, dfH, dfE, 0);power = 1 - PROBF( F_alpha, dfH, dfE, lambda);It helps in understanding the noncentral F to know that the expected value of any Frandom variable isE [F] = (1 + λ/df H )[df E /(df E – 2)]. (8.11)As df E /(df E – 2) is usually close to 1.0, we have
8.2 t-<strong>Tests</strong> and One-way ANOVA 7E [F] ≈ 1 + λ/df H . (8.12)Thus with increasing λ, the distribution of F is shifted to the right, making it more likelythat F will exceed F α , thus increasing the power of the test.Example 1: Two-Group t-testDr. Seth Alalgia is planning a study as to whether yet another <strong>for</strong>m of biofeedback therapycan reduce, at least in the short term, the frequency and severity of vascular headaches (cf.Blanchard et al., 1990). Specifically, he plans to conduct a double-blind, randomized trial inwhich patients will receive either an enhanced thermal (ET) biofeedback therapy or a shamplacebo (SP) that simply gives non-contingent feedback to the patient. Each patient will bestudied from a Monday to a Friday. On Monday morning, patients will be admitted to theuniversity's General Clinical Research Center (GCRC) to begin identical, standard medicaltherapy consisting of 5µg/kg/day of litosamine. On Monday and Tuesday evenings,patients will complete an extensive questionnaire that produces the pretreatment score onthe Vascular Headache Index (PreVHI). On Wednesday morning, patients will berandomized to ET or SP groups, using the minimization scheme of Pocock and Simon(1975) to minimize group differences on PreVHI, gender, and age strata. The mainbehavioral therapy session will be done on the Wednesday afternoon, with a followupsession early Thursday morning. Questionnaire data from Thursday and Friday willproduce the PostVHI measure.The main outcome measure is to be the relative change in the VHI values,RC = (PreVHI – PostVHI)/PreVHI.PreVHI will serve as a covariate <strong>for</strong> RC, but this action is expected only to reduce errorvariance; the dynamic blocking minimizes group differences on the PreVHI, and noPreVHI × Group interaction is expected. Thus <strong>for</strong> our purposes here, we do not need toconsider that PreVHI is to be a covariate, except when specifying σ 2 . The costs <strong>for</strong>recruiting and studying ET and SP subjects are the same, so that a balanced design (w 1 =w 2 = .50) is optimal.Dr. Alalgia has no pilot data. Based on his knowledge and experience, he conjecturesthat the ET group's true mean on RC is µ ET = –.30, while the SP group's is µ SP = –.15 (dueto placebo effects). He postulates that the common within-group standard deviation isabout σ = .125, because if the data are Normally distributed, about 95% of the patients' RCscores should lie within .25 = 2σ of the group mean. (This logic helps researchersconjecture values <strong>for</strong> the standard deviation, a task difficult to do.) In continuingdiscussions with his statistician, Dr. Alalgia agrees that σ could possibly be
8 <strong>Unified</strong> <strong>Power</strong> <strong>Analysis</strong>Relative Change inVascular Headache Index0.200.00-0.20-0.40-0.60(better) (worse)µ SP = –.15µ ET = –.30Enhanced ThermalBiofeedbackSham PlaceboBiofeedback±σ:68% ±2σ:95%Figure 8.2.Dr. Alalgia's scenario <strong>for</strong> the two-group design.50% higher, at σ = .1875. The σ = .125 scenario is depicted in Figure 8.2.Dr. Alalgia estimates that he has enough resources to study N = 20 patients. TheGCRC's Scientific Review Committee hopes that a valid study can be conducted by usingfewer than the 100 hospital bed-days requested (20 patients × 5 days/patient). This study isan early clinical trial of this new “enhanced” behavioral treatment, and research inbiofeedback therapy has a history of conflicting findings. Thus Dr. Alalgia and hisstatistician feel that a directional test is unwarranted at this time; only the nondirectional testwill be considered. Finally, he will concentrate on the powers <strong>for</strong> α = .05 but is stillcurious to see the powers under α = .01. Under these conditions, will N = 20 provideacceptable power? Would fewer suffice?Listing 8.1 gives input and output related to executing OneWyPow, a module ofstandard SAS ® data step statements. (See Appendix.) Here we use OneWyPow to getpowers <strong>for</strong> Dr. Alalgia's scenario by all combinations of N ∈ {14, 20, 26, 32} with σ ∈{.1250, .1875}. The α = .05 results <strong>for</strong> the nondirectional test (labeled “2-tailed t”)indicate that
8.2 t-<strong>Tests</strong> and One-way ANOVA 9Listing 8.1. Computations <strong>for</strong> Dr. Alalgia's Two-Group DesignInputoptions ls=72 nosource2;title1 "Dr. Alalgia: Enhanced Thermal vs Sham-Placebo Biofeedback";%include OneWyPow;cards;mu -.30 -.15 .weight .50 .50 .sigma .125 .1875 .alpha .05 .01 .Ntotal 14 20 26 32 .end%include FPowTab1;Selected OutputEffect: Two-Group Test,DF Hypothesis: 1,AND Primary SSHe: 0.005625-----------------------------------------------------------------| | Std Dev || |---------------------------------------|| | 0.125 | 0.1875 || |-------------------+-------------------|| | Total N | Total N || |-------------------+-------------------|| | 14 | 20 | 26 | 32 | 14 | 20 | 26 | 32 || |----+----+----+----+----+----+----+----|| |Pow-|Pow-|Pow-|Pow-|Pow-|Pow-|Pow-|Pow-|| | er | er | er | er | er | er | er | er ||-----------------------+----+----+----+----+----+----+----+----||Test Type |Alpha | | | | | | | | ||-----------+-----------| | | | | | | | ||2-tailed t |0.05 |.541|.718|.835|.907|.281|.395|.499|.591|| |-----------+----+----+----+----+----+----+----+----|| |0.01 |.264|.445|.607|.735|.101|.172|.250|.331||-----------+-----------+----+----+----+----+----+----+----+----||1-tailed t |0.05 |.681|.825|.908|.953|.408|.530|.632|.714|| |-----------+----+----+----+----+----+----+----+----|| |0.01 |.370|.561|.712|.819|.160|.251|.344|.434|-----------------------------------------------------------------N = 20 may be too few subjects to run: Ω = .72 <strong>for</strong> σ = .125, and Ω = .40 <strong>for</strong> σ = .1875.Even N = 26 gives powers of only .84 and .50 under the same conjectures. Dr. Alalgia isdiscouraged about these results and understands that the GCRC cannot af<strong>for</strong>d to providemore than 100 bed-days <strong>for</strong> his project. He decides to restructure the design. SeeExample 2.
10 <strong>Unified</strong> <strong>Power</strong> <strong>Analysis</strong>Even researchers with limited experience in statistical planning readily understand therationale and implications of a power analysis like that just presented. The results in Listing8.1 show concretely how power is increased by (1) increasing the α level, (2) decreasingthe variance, (3) increasing the total sample size, and (4) using a directional test.8.2.1.3 Using Data To Specify ∂ ∗ , λ ∗ , ¥, and ¥ 2[Note: This section is somewhat difficult. Readers may elect to skip to Section 8.2.2.]General Comments and Directional TestThe population group means, µ 1 and µ 2 , are the focus of this t-test. The populationstandard deviation of the observations within the groups, σ, is usually a nuisanceparameter—in both a mathematical and an everyday sense. In practice, one may be<strong>for</strong>ced to make a best guess or, preferably, a range of plausible guesses <strong>for</strong> them. Often itis prudent to set (µ 1 – µ 2 ) or ψ at some level that represents the lowest effect that would beof scientific or practical (clinical) interest. Although some researchers are areuncom<strong>for</strong>table with the subjectivity of making such choices, a well-done sample-sizeanalysis usually convinces them that statistical planning is valuable.Often, just one part of ψ is unable to be fixed by a solid scientific conjecture or otherargument. This unfixed part may be µ 1 , µ 2 , (µ 1 – µ 2 ), or σ. If one has good preliminary(pilot) data, one can get a point estimate or confidence interval <strong>for</strong> the unfixed part, then usethe other, fixed parts to get an estimate or interval <strong>for</strong> δ ∗ . The standard methods can beused to get confidence intervals <strong>for</strong> µ 1 , µ 2 , or (µ 1 – µ 2 ). The problem comes when theunfixed part is σ 2 . For example, µ 1 may be a control-group mean that is “well known” andthus fixed; µ 2 may be set by a “minimum practical (clinical) effect” argument at, say,.80µ 1 ; and σ may be the lone unfixed parameter. If pilot data are available, an estimate <strong>for</strong>σ can be obtained using the usual pooled estimate, σ. If those data are Normal, thetraditional confidence limits <strong>for</strong> σ 2 can be obtained and used to define a range of σ 2 values<strong>for</strong> specifying ψ. This interval would be based on taking (N – 2)σ 2 /σ 2 to have a chi-squaredistribution with N – 2 degrees of freedom.Unless the data are strictly Normal, the traditional χ 2 -based confidence intervals <strong>for</strong> σ 2cannot be trusted to have their nominal confidence levels, even <strong>for</strong> infinitely large samplesizes. Somewhat better confidence intervals <strong>for</strong> σ 2 may be obtained by adapting thetrans<strong>for</strong>m developed by O'Brien (1979, 1981) <strong>for</strong> testing variances. Simply convert theraw observations, y ij , tor ij = (n j – 1.5)n j (y ij – µ j ) 2 2– .5σ j (nj – 1), (8.13)(n j – 1)(n j – 2)and use them to construct a one-mean confidence interval based on r. This can be done inmost statistics packages. The method works because r j = σ j 2 , so the interval based on r isreally an interval <strong>for</strong> σ 2 . The method gives proper intervals when the sample size is large.By conducting Monte Carlo studies, Melton (1986) showed that while it is considerablymore robust than the Normal-theory method, it cannot be recommended <strong>for</strong> small N. Weare not aware of acceptably robust methods <strong>for</strong> <strong>for</strong>ming confidence limits on σ 2 when the
8.2 t-<strong>Tests</strong> and One-way ANOVA 11sample size is small.We can see from (8.8) that given an observed t value based on suitable pilot data, anearly unbiased estimate of the primary noncentrality isδ ∗ = (t/N 1/2 )[(4df E – 4)/(4df E – 1)]. (8.14)Thus <strong>for</strong> the two-group problem, we have the nearly unbiased estimator,ψ = δ ∗ /(w 1 w 2 ) 1/2 = [(µ 1 – µ 2 )/σ] [(4df E – 4)/(4df E – 1)]. (8.15)Confidence limits <strong>for</strong> ψ can also be <strong>for</strong>med. It may be particularly worthwhile to findthe lower limit, ψ γ , of a one-tailed, 1 – γ interval (no upper limit) by finding thenoncentrality, δ γ , that solvesPr[ t(df E , δ γ ) ≥ t ] = γ, (8.16)where t is the value observed with pilot data. This can be done using the SAS statement:delhatgm = TNONCT(t, dfE, 1 - gamma);δ γ may then be converted to the two <strong>for</strong>ms of effect size,andδ ∗ γ = δ γ /N1/2 (8.17)ψ γ = δ ∗ γ /(w 1 w 2 )1/2 . (8.18)Using this logic allows one to say with 1 - γ confidence that the nature's effect size is atleast ψ γ . Setting γ = .50 gives a median estimator that competes with the mean estimator,ψ.Either ψ, ψ .50 , or ψ γ can be combined with particular N and (w 1 w 2 ) 1/2 values to <strong>for</strong>mnoncentralities and corresponding estimates of power. Suppose that a pilot study with n 1 =6 and n 2 = 4 produces t = 1.50 (p = .086). The above <strong>for</strong>mulas yield estimates <strong>for</strong> nature'seffect size of ψ = .875, ψ .50 = .937, and ψ .20 = .359. For a full study having N = 50 and abalanced design, the corresponding powers are Ω = .920, Ω .50 = .948, and Ω .20 = .347 <strong>for</strong>the .05-level, directional test. Thus, the researcher would see that although the mean-typeand median-type estimates of ψ give powers greater than .90, there is a .20 chance that thepower may be less than .35. This is hardly reassuring. If it seems erroneously low,realize that γ = .20 is close to p = .086, and ψ .086 = 0.00, which corresponds to a “power”of .05. If γ < p is used, then ψ γ < 0, and Ω < α, a result that would perplex most people.Most power analyses are prospective in that they assess power <strong>for</strong> a study yet to bedone, as we just discussed. Retrospective power analyses assess the power of a studyalready completed. It is often requested after a nonsignificant outcome: “What was mypower in this (nonsignificant) study?” “How large should my N have been to haveensured acceptable power?” “What if I had had a more balanced design?” The estimationmethods discussed here can help address these questions also.Suppose that a study was completed with n 1 = 17, n 2 = 15, µ 1 – µ 2 = 4.30, and σ =9.25, which give t = 1.31 (p = .10). The researcher asks what the power was <strong>for</strong> a value of
12 <strong>Unified</strong> <strong>Power</strong> <strong>Analysis</strong>µ 1 – µ 2 = 8.00, which would have been the minimum difference worth seeing. Fixing µ 1 –µ 2 at 8.00 and using σ = 9.25, the mean estimate of nature's effect size is ψ = 8/9.25 =.865, which translates to a power of .771 using α = .05 and the above sample sizes. Amore conservative assessment begins by finding the lower .10 critical value <strong>for</strong> the χ 2 (17 +15 – 2 = 30) distribution, which is 20.6. Under Normal-theory, Pr[σ < 9.25(30/20.6) 1/2 =11.2] = .90 This gives a lower 90% one-sided confidence limit of ψ .10 = 8/11.16 = .717,which translates to a power of .630. Technically, these are powers <strong>for</strong> an exact replicationof the study. If the study were to be replicated with twice the total sample size, these twovalues of ψ translate to powers of Ω = .958 and Ω .10 = .875.If faced with the power results we have just seen, some researchers would decide thatthe “ongoing” study does not have enough subjects yet, so they will double the totalsample size by adding another 32 subjects. This strategy will inflate the Type I error rateunless the whole sequence of interim analyses is planned at the outset using specialstatistical methods (cf. Fleming, Harrington, and O'Brien, 1984).As the first example (with n 1 = 6 and n 2 = 4) shows, confidence intervals <strong>for</strong> ψ can bequite wide when based on small pilot studies, providing values that researchers findunreasonable when planning a new study. It is useful to use something like ψ .33 toestimate a lower limit <strong>for</strong> the effect size, understanding, of course, that these offer lowerlevels of confidence than do more standard values, such as ψ .05 , ψ .10 , and ψ .20 . From thefrequentist's perspective, using ψ .05 is more likely to lead to choosing an N that providesadequate power. But researchers' knowledge of the subject matter should not bediscounted entirely in favor of pilot results. Bayesian strategies may one day be commonlyavailable to mix one's subjective beliefs about ψ with estimates of it from pilot data.Nondirectional TestBased on (8.11), it can be shown thatλ ∗ = {[(df E – 2)/df E ]df H F – df H }/N (8.19)is an unbiased estimate of λ ∗ . Un<strong>for</strong>tunately, if F < df E /(df E – 2), then λ ∗ < 0. Theadjusted estimator,λ ∗ adj = Max[ 0, λ∗ ] (8.20)can still be positively biased <strong>for</strong> small λ.Adapting a method introduced by Venables (1975), the lower limit of a one-tailed 1 – γinterval <strong>for</strong> λ ∗ can be taken to be λ ∗ γ = λ γ /N, where λ γ solvesPr[ F(df H , df E , λ γ ) ≥ F ] = γ. (8.21)The SAS statement that will do this is:lamhatgm = FNONCT(F, dfH, dfE, 1 - gamma);A solution <strong>for</strong> λ γ is possible only if γ exceeds the p-value <strong>for</strong> F, i.e., F > F α=γ . As above,we may set γ = .50 <strong>for</strong> a median-type estimator or use γ = .20 or .33 to get some other
8.2 t-<strong>Tests</strong> and One-way ANOVA 13useful lower bound on λ. We remark once again that with small N, setting γ too low oftenresults in a lower bound <strong>for</strong> λ ∗ that is of little practical use.When applied to the two-group problem, any of the estimators <strong>for</strong> λ ∗ can be convertedto estimators <strong>for</strong> nature's effect size squared, ψ 2 = (µ 1 – µ 2 ) 2 /σ 2 , usingψ 2 = λ ∗ /(w 1 w 2 ). (8.22)This can then be the basis <strong>for</strong> estimating noncentralities <strong>for</strong> different w 1 w 2 values than wereused in the pilot or previous study.While these methods <strong>for</strong> estimating λ <strong>for</strong> a nondirectional test share the practicalweaknesses of their counterparts <strong>for</strong> estimating δ <strong>for</strong> a directional test, they still may haveutility when ample pilot or previous data are available. Un<strong>for</strong>tunately, there are no excellentmethods <strong>for</strong> using small pilot studies to provide firm, objective estimates <strong>for</strong> effect sizesand noncentralities. Because there is usually little or no pilot data available <strong>for</strong> prospectivepower analyses, the methods suggested in this section rarely play a leading role indeveloping and justifying specific estimates. In practice, most good estimates <strong>for</strong> effectsizes are conjectures <strong>for</strong>med in the mind of thoughtful researchers, experienced in theirscience, and careful in their use of pilot data or related results found in the literature.8.2.2 Comparing Two Correlated Means (Matched-Pairs)The common matched-pairs t-test applies to studies that have only one group of cases, buteach case provides two measurements, y 1 and y 2 , whose means will be compared to eachother. The analysis focuses on the difference, y d = y 1 – y 2 , which we will take to have amean of µ d and a standard deviation of σ d . Now we work with a null hypothesis, H 0 : µ d =0 (no difference), and a research (“alternative”) hypothesis that is either nondirectional (H A :µ d ≠ 0) or directional (say, H A : µ d > 0). The statistic ist = N 1/2 (µ d /σ d ), (8.23)where N is the number of pairs. We take t to be distributed as a t(df E , δ) random variablewith df E = N – 1 andδ = N 1/2 (µ d /σ d ) and δ ∗ = ψ = (µ d /σ d ). (8.24)Here again, t and δ have the same <strong>for</strong>m. There is no way to vary the sample-size structureof a one-group design, thus the primary noncentrality and nature's effect size are identical,involving only µ d and σ d .If it is difficult to specify σ d directly, it may be specified indirectly by conjecturingvalues <strong>for</strong> σ 1 and σ 2 , the standard deviations of y 1 and y 2 , as well as ρ, the ordinaryproduct-moment correlation between y 1 and y 2 . Then,σ d = (σ 1 2 + σ 2 2 – 2ρσ 1 σ 2 ) 1/2 . (8.25)Once δ ∗ is determined, power is computed in the same manner as given in the previoussection, except that we have df E = N – 1 pairs, instead of df E = N – 2 individual subjects.
14 <strong>Unified</strong> <strong>Power</strong> <strong>Analysis</strong>Listing 8.2.Computations <strong>for</strong> Dr. Alalgia's Matched-Pairs DesignInputoptions ls=72 nosource2;%include OneWyPow;title1 "Dr. Alalgia: Yoked-Pairs Design <strong>for</strong> Biofeedback Study";title2 "mu_diff = .15";cards;mu .15 .sigma .137 .205 .alpha .05 .01 .Ntotal 10 14 17 20 .end%include FPowTab1;%include OneWyPow;title2 'mu_diff = .10';cards;mu .10 .sigma .137 .205 .alpha .05 .01 .Ntotal 10 14 17 20 .end%include FPowTab1;Selected Outputmu_diff = .15Effect: One-Group Test,DF Hypothesis: 1,AND Primary SSHe: 0.0225-----------------------------------------------------------------| | Std Dev || |---------------------------------------|| | 0.137 | 0.205 || |-------------------+-------------------|| | Total N | Total N || |-------------------+-------------------|| | 10 | 14 | 17 | 20 | 10 | 14 | 17 | 20 || |----+----+----+----+----+----+----+----|| |Pow-|Pow-|Pow-|Pow-|Pow-|Pow-|Pow-|Pow-|| | er | er | er | er | er | er | er | er ||-----------------------+----+----+----+----+----+----+----+----||Test Type |Alpha | | | | | | | | ||-----------+-----------| | | | | | | | ||2-tailed t |0.05 |.868|.966|.988|.996|.542|.716|.808|.873|| |-----------+----+----+----+----+----+----+----+----|| |0.01 |.598|.838|.927|.970|.251|.427|.551|.659||-----------+-----------+----+----+----+----+----+----+----+----||1-tailed t |0.05 |.938|.987|.996|.999|.688|.828|.893|.934|| |-----------+----+----+----+----+----+----+----+----|| |0.01 |.727|.908|.963|.986|.362|.550|.667|.761|-----------------------------------------------------------------
8.2 t-<strong>Tests</strong> and One-way ANOVA 15Example 2: Matched-Pairs t-testDr. Seth Alalgia now considers a new design to study the efficacy of the enhanced thermal(ET) biofeedback therapy relative to the sham-placebo (SP) therapy in the relief of vascularheadache. (See Example 1.) Patients will be run in pairs that are matched on severalfactors, including a screening version of the Vascular Headache Index (VHI). They will nolonger be admitted to the hospital's research unit during their pretreatment phase, but willbe seen as outpatients on Monday and Tuesday to complete the PreVHI measure and begintheir standardized medical treatment with litosamine. The pair will be admitted onWednesday, already randomly split into the two treatment groups. The ET subject will betreated first, getting legitimate biofeedback. Then the SP subject will be treated as a “yokedcontrol,” getting the ET subject's session as non-contingent biofeedback. The same relativechange score, RC, will serve the outcome measure, so that our paired differences are d =RC SP – RC ET . The paired difference on the PreVHI may serve as a covariate to lower theerror variance in d. But as in Example 1, covariates need not concern us here other than toinfluence our specification of σ d . It is hoped that by matching and yoking pairs of patients,the error variance can be markedly reduced. Note also that now only three GCRC bed-daysper subject will be used, rather than five, as be<strong>for</strong>e.Dr. Alalgia believes that this study carries with it the same general treatment effects andvariability as <strong>for</strong> the two-group study. Thus, he takes µ d = .15. As some of the reviewersconsider this to be overly optimistic, he decides to look at µ d = .10 as well. Dr. Alalgiabelieves that the correlation between RC SP and RC ET is at least .40; thus it is decided tobase the power analysis on both σ d = .125[2 – 2(.40)] 1/2 ≈ .137 and σ d = .1875[2 –2(.40)] 1/2 ≈ .205. He is prepared to study up to 17 pairs of patients, which will require 17 ×6 = 102 bed-days. Is this enough? Too many?Listing 8.2 gives the input to OneWyPow and some of its output. Under Dr. Alalgia'sscenario (µ d = .15), the α = .05, nondirectional test with N = 17 has power of .99 and .81<strong>for</strong> the two standard deviations used. The corresponding powers under µ d = .10 (notshown) are .81 and .47. Dr. Alalgia decides to go <strong>for</strong>ward with N = 17 and feels he cannow easily defend this choice be<strong>for</strong>e the Scientific Review Committee.8.2.3 One-Way Design: Overall Test and Planned ContrastsThe one-way analysis of variance is an extension of the two-group t-test. To compare themeans of J independent groups, we work with two types of hypothesis tests, overall(“between-groups”) tests and planned contrasts. The overall hypothesis is H 0 : µ 1 = µ 2 = ...= µ J (all populations means are equal), and the research (“alternative”) hypothesis, H A : µ j ≠µ j' , <strong>for</strong> some j ≠ j' (at least two means are different). But note that the overall researchhypothesis is a nonspecific one. Often the researcher is more interested in one or moreplanned contrasts, which can be specified using H 0 : c 1 µ 1 + c 2 µ 2 + ... + c J µ J = θ 0 = 0. Theresearch hypothesis is either nondirectional, H A : θ 0 ≠ 0, or it is directional, which we taketo be H A : θ 0 > 0. The contrast weights, c j , are usually defined such that c 1 + c 2 + ... + c J =0. Contrasts are <strong>for</strong>med to represent the specific hypotheses of interest. For example in afour-group design, the contrast H 0 : (.5)µ 1 + (.5)µ 2 + (-1)µ 3 + (0)µ 4 = 0 compares the
16 <strong>Unified</strong> <strong>Power</strong> <strong>Analysis</strong>average of the first two means to the third mean. Example 3 illustrates several others.Planned contrasts are useful because they provide a more sharply focused analysis than dooverall tests. This usually makes tests of planned contrasts easier to interpret and morepowerful. In those rare cases in which the overall test captures the scientific question understudy, the power of that test should naturally be of concern. On the other hand, if the mainpurpose is to test specific planned contrasts, one should choose a sample size based onthose contrasts and pay little, if any, attention to the power of the overall test. For more onthis, see Rosenthal and Rosnow (1985).OneWyPow computes power <strong>for</strong> both overall tests and contrasts in the one-way design.8.2.3.1 Overall Test in the One-Way ANOVAThe overall test of the equality of J independent means is per<strong>for</strong>med usingF = NJ∑ w j (µ j – µj = 1σ 2 (J – 1)) 2, (8.26)where w j = n j /N is the proportion of cases in group j,µ = (w 1 µ 1 + w 2 µ 2 + ... + w J µ J ) (8.27)is the weighted average of the sample means, and σ 2 is the weighted (pooled) average ofthe sample variances. Under the classic Normal-theory assumptions, the observed overallF statistic is an F random variable with df H = J – 1 degrees of freedom <strong>for</strong> the hypothesis(numerator) and df E = N – J degrees of freedom <strong>for</strong> error (denominator). Its noncentralityis λ = Nλ ∗ , whereJ∑ w j (µ j – µ ) 2λ * j = 1=, (8.28)σ 2with µ = w 1 µ + w 2 µ 2 + ... + w J µ J . Note that λ/(J – 1) is isomorphic to the overall F.8.2.3.2 ANOVA ContrastsIt will simplify matters at times if we express H 0 : c 1 µ 1 + c 2 µ 2 + ... + c J µ J = 0 by onlywriting out the contrast coefficients in a matrix with one row, C = [ c 1 c 2 ... c J ]. Becausedf H = 1, the choice must be made between a nondirectional or directional test. For thedirectional test, we <strong>for</strong>m the statistic
8.2 t-<strong>Tests</strong> and One-way ANOVA 17t = N 1/2σJ∑j = 1∑j = 1c j µ jJ 1/2, (8.29)c j2wjand use it as we used the two-group t-test described in Section 8.2.1.1 except that we nowhave df E = N – J. The primary noncentrality isδ ∗ =σJ∑ c j µj = 1J∑c 2 j wj1/2j = 1,(8.30)and the noncentrality is δ = N 1/2 δ ∗ . ψ cannot be defined, as the w j are linked to the c j andcannot be factored out of δ ∗ .The material in Section 8.2.1.1 covers some methods to use pilot data to help estimateδ, and these extend to the t-tests <strong>for</strong> contrasts.For the nondirectional case, the test involves F = t 2 , which is taken to be F(1, N – J, λ),where λ = δ 2 . Methods <strong>for</strong> using pilot data to help estimate λ follow from the material inSection 8.2.1.2.Example 3: One-Way ANOVA with ContrastsDr. Mindy Bowdy studies relationships between personality characteristics and immunefunctioning (cf. Jemmott, et al., 1990). For her next study, up to 100 (but preferably 60)male college students will give a sample of blood and complete a set of psychologicalinstruments that are used to partition the sample into four types of people (D, O, L, and F):Dominator: one who has a strong need to impact others; argumentative, assertive,overly competitive.Ordinary:Loner:Friendly:one who is not a Dominator, a Loner, or a Friendly.one who has a minimal need <strong>for</strong> friendships; no desire to impact others.one who has a very strong need to create and nurture friendships; acceptsthis as an ideal and an end in its own right.Other studies have found Friendlies to have better immune functioning than Ordinaries,who have better functioning than Dominators. Dr. Bowdy believes that the immunefunctioning of Loners may only be slightly better than that of Ordinaries. The specificquestion now is: “How do the DOLF groups differ with respect to Q-type killer cellactivity (QKCA), as measured by the percentage of Q843 human leukemia cells lysed at a
18 <strong>Unified</strong> <strong>Power</strong> <strong>Analysis</strong>50:1 effector-to-target ratio?”Dr. Bowdy conjectures that the mean lysis rates are µ D = .35 (worst), µ O = .50, µ L =.52, µ F = .60 (best). Data from previous studies working with QKCA and Q843 suggestthat the within-group standard deviation (σ) in this population is between .16 and .19.Furthermore, Dr. Bowdy expects that subjects will be partitioned according to thefollowing proportions: w D = .20, w O = .50, w L = .10, w F = .20.There are many strategies available to compare the groups' means in this study; goodscientists and statisticians might disagree on what is best. Dr. Bowdy recognizes that theoverall test of whether the four groups have equal lysis rates is weakened by the smalldifference between Ordinaries and Loners. She will assess it anyway, as peer reviewersand editors will expect to see it. Several contrasts are meaningful to Dr. Bowdy. Thelargest nature's effect size, ψ, <strong>for</strong> any two-group comparison is “Dominators vs.Friendlies,” H A : µ F – µ D > 0, i.e., the directional test of C = [ -1 0 0 1]. She also wantsdirectional contrasts of “Friendlies vs. Ordinaries and Loners,” C = [ 0 -5/6 -1/6 1],where the 5/6 and 1/6 are used because Ordinaries are expected to outnumber Loners by5:1. Similarly, we have “Dominators vs. Ordinaries and Loners,” C = [ -1 5/6 1/6 0],directional. This family of three contrasts will be protected using a Bonferroni-adjustedlevel of α = .05/3 <strong>for</strong> each. Though “Loners vs. Ordinaries” probably will have littlepower, Dr. Bowdy will test it with a nondirectional test of C = [ 0 1 -1 0] at α = .05.Listing 8.3.1 gives the input and Listing 8.3.2 gives some of the key output related tousing OneWyPow. These results demonstrate the benefits of looking at more than justoverall tests when selecting a sample size. Here the overall test <strong>for</strong> the four-group design isfairly powerful; even if σ is large (.19), N = 80 gives a .05-based power of .89. It can beshown that the noncentrality <strong>for</strong> the “Friendlies vs. Dominators” comparison captures over95% of noncentrality <strong>for</strong> the overall test. Examining the powers <strong>for</strong> “Dominators vs.Ordinaries and Loners", we find that most of the power in this design is due to theconjectured immune inferiority of the Dominators. The immune superiority of theFriendlies is not likely to be supported by a significant “Friendlies vs. Ordinaries andLoners” test. Reasonably assurance that this will be significant seems to require far morethan a total of 100 subjects, especially when we use Bonferroni protection.Finally, we see almost no power <strong>for</strong> the .05-level comparison of the Ordinaries vs.Loners. It might be that we could create a more powerful overall test, call it “AlmostOverall,” by pooling the means over the Ordinaries and Loners. This is can be done byaggregating the between-groups variance defined by C = [ 1 -5/6 -1/6 0] and C =[ 0 -5/6 -1/6 1] giving a two degree of-freedom contrast. The theory <strong>for</strong> this is reviewedin Section 8.3, but the programming of OneWyPow is straight<strong>for</strong>ward, as shown in Listing8.3.1. Because there is so little difference between the conjectured means <strong>for</strong> theOrdinaries and Loners, pooling them creates a test that is a little more powerful than theordinary overall test.
8.2 t-<strong>Tests</strong> and One-way ANOVA 19Listing 8.3. Computations <strong>for</strong> Dr. Bowdy's Four-Group DesignListing 8.3.1.Inputoptions ls=72 nosource2;%include OneWyPow;title1 "Mindy Bowdy : Four-Group Design";*Order of groups: D O L F;cards;mu .35 .50 .52 .60 .weight .20 .50 .10 .20 .sigma .16 .19 .alpha .05 .0167 .Ntotal 60 80 100 .contrasts"Friendlies vs Ordin & Loners" 0 -.83 -.17 1 ."Dominators vs Ordin & Loners" -1 .83 .17 0 ."Friendlies vs Dominators" -1 0 0 1 ."Ordinaries vs Loners" 0 1 -1 0 ."Almost Overall (2 DF)" 1 -.83 -.17 0 .> 0 -.83 -.17 1 .end%include FPowTab2;run;
20 <strong>Unified</strong> <strong>Power</strong> <strong>Analysis</strong>Listing 8.3.2.Selected OutputALPHA 0.05----------------------------------------------------------| | Std Dev || |-----------------------------|| | 0.16 | 0.19 || |--------------+--------------|| | Total N | Total N || |--------------+--------------|| | 60 | 80 |100 | 60 | 80 |100 || |----+----+----+----+----+----|| |Pow-|Pow-|Pow-|Pow-|Pow-|Pow-|| | er | er | er | er | er | er ||--------------------------+----+----+----+----+----+----||Overall test|Regular F |.899|.970|.992|.763|.887|.951||------------+-------------+----+----+----+----+----+----||------------+-------------+----+----+----+----+----+----||Ordinaries |2-tailed t |.059|.062|.065|.056|.058|.060||vs Loners |-------------+----+----+----+----+----+----|| |1-tailed t |.086|.093|.099|.079|.084|.090||------------+-------------+----+----+----+----+----+----||Almost |Regular F | | | | | | ||Overall (2 | | | | | | | ||DF) | |.933|.982|.996|.821|.923|.969|----------------------------------------------------------ALPHA 0.0167----------------------------------------------------------| | Std Dev || |-----------------------------|| | 0.16 | 0.19 || |--------------+--------------|| | Total N | Total N || |--------------+--------------|| | 60 | 80 |100 | 60 | 80 |100 || |----+----+----+----+----+----|| |Pow-|Pow-|Pow-|Pow-|Pow-|Pow-|| | er | er | er | er | er | er ||--------------------------+----+----+----+----+----+----||Friendlies |2-tailed t |.265|.366|.464|.182|.253|.325||vs Ordin & |-------------+----+----+----+----+----+----||Loners |1-tailed t |.362|.473|.573|.263|.347|.428||------------+-------------+----+----+----+----+----+----||Dominators |2-tailed t |.659|.806|.897|.487|.637|.754||vs Ordin & |-------------+----+----+----+----+----+----||Loners |1-tailed t |.755|.874|.938|.597|.735|.832||------------+-------------+----+----+----+----+----+----||Friendlies |2-tailed t |.909|.974|.993|.772|.896|.956||vs |-------------+----+----+----+----+----+----||Dominators |1-tailed t |.948|.987|.997|.849|.938|.976||------------+-------------+----+----+----+----+----+----|
8.3 Univariate Linear Model 218.3 UNIVARIATE GENERAL LINEAR (FIXED-EFFECTS) MODELAll of the tests we have thus far considered, as well as many others we have notconsidered, are special cases of tests within univariate general linear modeling (GLM).Understanding noncentrality in GLM testing, and knowing how to easily per<strong>for</strong>m thecomputations, creates a wonderfully broad spectrum of power analyses.Consider the standard modely = X∫ + ‰, (8.31)where y is the N × 1 vector of the dependent variable, X is the N × r model matrix ofnonrandom, known predictor values, ∫ is the r × 1 vector of the fixed, unknowncoefficients, and ‰ is the N × 1 vector of true residuals. Without loss of generality, werequire the columns of X to be linearly independent, i.e., rank(X) = r. For tests on ∫, wetake the elements of ‰ to be independent N(0, σ 2 ) random variables. The usual estimatesareand∫ = (X T X) -1 X T y (8.32)σ 2 = (y – X∫) T (y – X∫)/(N – r) . (8.33)We focus here on the general linear hypothesis,H 0 : C∫ = œ 0 , (8.34)where C is df H × r with rank(C) = df H ≤ r. œ 0 is a vector of constants appropriate to theresearch question. It is usually chosen to be 0. For df H > 1, H A : C∫ ≠ œ 0 is the onlyalternative we consider. For df H = 1, the directional alternative might be appropriate, whichis defined here to be H A : C∫ > œ 0 . The test statistic is F = SSH/(df H σ 2 ), whereSSH = (C∫ – œ 0 ) T [C(X T X) -1 C T ] -1 (C∫ – œ 0 ) (8.35)is the sums of squares <strong>for</strong> the hypothesis. F is distributed F(df H , df E , λ), where df E = (N –r) andλ = (C∫ – œ 0 ) T [C(X T X) -1 C T ] -1 (C∫ – œ 0 )/σ 2 . (8.36)This general structure encompasses t-tests, fixed-effects ANOVA and ANCOVA, andordinary multiple regression.λ may be expressed in a way that displays its distinct components. Let X be the q × ressence model matrix <strong>for</strong>med by assembling the q unique rows of X. in other words, X isthe collection of the unique design points (e.g. groups) <strong>for</strong> the proposed study. Let W bethe q × q diagonal matrix having elements w j , the proportion of the total sample sizeassociated with the j th row of X. Thus, NW holds the q sample sizes. It can be shown thatλ = N{(C∫ – œ 0 ) T [C(X T WX) -1 C T ] -1 (C∫ – œ 0 )/σ 2 }. (8.37)We see that the primary noncentrality, λ ∗ = λ/Ν, is based on the design points to be used
22 <strong>Unified</strong> <strong>Power</strong> <strong>Analysis</strong>(X), the sample size weightings <strong>for</strong> those points (W), the conjectured estimates <strong>for</strong> theunknown effects (∫) and the variance (σ 2 ), and the specification of the hypothesis (C, œ 0 ).One particularly straight<strong>for</strong>ward and useful application of the GLM involves the use ofthe cell means model, y ij = µ j + e ij , <strong>for</strong> the J-group ANOVA. Here X = I, the J × Jidentity matrix, and ∫ = µ, the vector of population means. Taking œ 0 = 0, we haveλ = N(Cµ) T [CW -1 C T ] -1 (Cµ)/σ 2 . (8.38)For the two-group t-test, I is 2 × 2, µ T = [µ 1 µ 2 ], W = diag[w 1 w 2 ], and C = [1 –1].One can use (8.38) to match the square of (8.3). For the three-group problem, I is 3 × 3,µ T = [µ 1 µ 2 µ 3 ], and W = diag[w 1 w 2 w 3 ]. The overall test can then useC =1 –1 01 0 –1This can be extended easily to J groups. To derive the λ <strong>for</strong> contrasts in a J-groupANOVA [see (8.30)], use C = [c 1 c 2 ... c J ]. It can also be used to specify the effects <strong>for</strong>factorial designs. For example, a 2 × 3 factorial design can usually be handled by taking Ito be 6 × 6, µ T = [µ 11 µ 12 µ 13 µ 21 µ 22 µ 23 ], and W = diag[w 11 w 12 w 13 w 21 w 22w 23 ]. The interaction test requires1 –1 0 –1 1 0C =1 0 –1 –1 0 1 ,and the main effects can be defined as is appropriate <strong>for</strong> the research design and question.Other constructions <strong>for</strong> X will handle designs with missing cells, nested factors, fixedblocking factors, and multiple covariates. There<strong>for</strong>e, power analysis can be done <strong>for</strong> anyhypothesis that can be handled by the fixed-effects features of any linear models program.Thus, there is rarely a justification <strong>for</strong> limiting the power analysis to a minor part of a largedesign, such as the comparison of just two of the groups contained within a 2 × 3 × 3factorial.Exemplary Data: SSH e , SSH∗eNote that if we use an exemplary data set of N e cases con<strong>for</strong>ming to y ≡ X∫, we obtain ∫≡ ∫. This makes SSH ≡ λσ 2 , which is called the exemplary sums of squares hypothesis,or SSH e . Defining SSH∗ e = SSH e /N e to be the primary SSH e , we have.λ = N⋅SSH e ∗ /σ 2 . (8.39)In comparing means using t-tests or the ANOVA, the exemplary data must be designed toproduce sample means that are identical to the conjectured population means: µ j ≡ µ j . Forthe two-group case this yieldsSSH e = N e w 1 w 2 (µ 1 – µ 2 ) 2 = N e σ 2 λ ∗ . (8.40)SSH e∗ subsumes the complex parts of computing the noncentrality parameter. By firstcomputing SSH e using standard software <strong>for</strong> data analysis, an array of λ values can be<strong>for</strong>med by combining SSH e∗ with various values of N and σ 2 . SSH e∗ is a common conceptthat unifies the notion of λ across all cases of the general linear model. As a computing
8.3 Univariate Linear Model 23scheme, it is very helpful in handling complex linear models, such as in the unbalancedANCOVA design illustrated below. The module PowSetUp has been designed to createtables of power probabilities based on SSH e , N e , N, σ, and α values.Random X VariablesAs noted well by Gatsonis and Sampson (1989), if X involves random variables (thecorrelational model), then the noncentral F results given here do not hold strictly, unlessone is willing to take the conditional viewpoint, that is, “given this X.” Fortunately, theconditional results discussed in this chapter do provide reasonable approximations tomethods developed under the assumption that the columns of X are multivariate normal.The practical discrepancy between the two approaches disappears as the sample sizeincreases. Because the values <strong>for</strong> the population parameters are conjectures or estimates,strict numerical accuracy of the power computations is usually not critical. Those who findthis view too cavalier may use the excellent tables or software provided by Gatsonis andSampson, which have their own limitation due to their dependence on multivariatenormality.Example 4: Univariate GLM <strong>for</strong> ANCOVADr. Mindy Bowdy completed the four-group study (Example 3). She now wants to extendthe work to focus on whether greater psychological stress is associated with poorerimmune function, as Cohen, Tyrrell, and Smith (1991) reported by correlating higherstress with an increased risk of catching a cold. Dr. Bowdy's proposed design is similar toher D-O-L-F four-group design, except that the Ordinaries and Loners are now combinedinto a single group called Regulars. Thus we now have three groups, and we still expectthe Dominators to have lower QKCA-Q843 lysis rates than the Regulars, who will havelower rates than the Friendlies. This study, however, will focus on the Life Events StressIndex (LESI), which takes on values:–2: low stress–1: below average stress0: average stress+1: above average stress+2: high stressRegulars and Friendlies are conjectured to have uni<strong>for</strong>m distributions <strong>for</strong> the LESI,whereas the Dominators are conjectured to have LESI values higher than normal. Themain research questions involve the relationships between stress and immunity, asmeasured by the LESI and the lysis rates. Dr. Bowdy conjectures that the Friendlies haveno relationship between the LESI and lysis rates, the Regulars have a weak negativerelationship, and the Dominators have a stronger negative relationship. She understandsthat addressing this question probably requires several hundred subjects.
24 <strong>Unified</strong> <strong>Power</strong> <strong>Analysis</strong>Listing 8.4.Listing 8.4.1.Computations <strong>for</strong> Dr. Bowdy's ANCOVA DesignSAS statements to compute SSH evalues using regular dataanalysis on exemplary data.options ls =72;title "Mindy Bowdy: ANCOVA design";data;/*Three groups, one covariate, unequal slopes;* Order of exemplary data:D = DominatorR = Ordinary or LonerF = Friendly*/input lysis0 DRF $ LESI n;*create exemplary data;if DRF = 'D' then beta = -.03;if DRF = 'R' then beta = -.01;if DRF = 'F' then beta = .00;lysis = lysis0 + beta*LESI;* lysis at ;* LESI=0 DRF LESI n ; cards;.3350 D -2 02.3350 D -1 03.3350 D 0 04.3350 D 1 05.3350 D 2 06.5033 R -2 12.5033 R -1 12.5033 R 0 12.5033 R 1 12.5033 R 2 12.6000 F -2 04.6000 F -1 04.6000 F 0 04.6000 F 1 04.6000 F 2 04* analyze exemplary data to get SSHe values;proc glm order=data; class DRF; freq n;model lysis = DRF DRF*LESI/noint solution;contrast 'DRF main|LESI=0' DRF 1 -1 0, DRF 0 1 -1;contrast 'Means:DvsR|LESI=0' DRF 1 -1 0;contrast 'Means:FvsR|LESI=0' DRF 0 1 -1;contrast 'LESI main | DRF' DRF*LESI 1 1 1;contrast 'DFR*LESI' DRF*LESI 1 -1 0, DRF*LESI 0 1 -1;contrast 'Slopes: D vs R' DRF*LESI 1 -1 0;contrast 'Slopes: F vs R' DRF*LESI 0 1 -1;
8.3 Univariate Linear Model 25Listing 8.4.2.Selected portions from SAS output giving SSH evalues.Dependent Variable: LYSISFrequency:NSourceDFUncorrected Total 100 This shows N e value.Contrast DF Contrast SSSSH e valuesDRF main|LESI=0 2 0.6722149Means:DvsR|LESI=0 1 0.3837566Means:FvsR|LESI=0 1 0.1402634LESI main | DRF 1 0.0258462DRF*LESI 2 0.0175385Slopes: D vs R 1 0.0108387Slopes: F vs R 1 0.0030000Copy this section intoPowSetUp.
26 <strong>Unified</strong> <strong>Power</strong> <strong>Analysis</strong>Listing 8.4.3.SAS statements to obtain power tables.options ls=72 nosource2;title1 "Mindy Bowdy: DRF groups and LESI stress measure";%include PowSetUp;cards;Ne 100alpha .05 .01 .sigma .12 .15 .Ntotal 200 300 500 .numparms 6effectsDRF main | LESI = 0 2 0.6722149Means: D vs R | LESI = 0 1 0.3837566Means: F vs R | LESI = 0 1 0.1402634LESI main | DRF 1 0.0258462DFR*LESI 2 0.0175385LESI slopes: D vs R 1 0.0108387LESI slopes: F vs R 1 0.0030000end*;%include FPowTab2;This sectionwas copiedfrom SAS GLMoutput, then theeffects' titles weremodified slightly.
8.3 Univariate Linear Model 27Listing 8.4.4.Output from PowSetUp and FPowTab2 SAS modules.ALPHA 0.05----------------------------------------------------------| | Std Dev || |-----------------------------|| | 0.12 | 0.15 || |--------------+--------------|| | Total N | Total N || |--------------+--------------|| |200 |300 |500 |200 |300 |500 || |----+----+----+----+----+----|| |Pow-|Pow-|Pow-|Pow-|Pow-|Pow-|| | er | er | er | er | er | er ||--------------------------+----+----+----+----+----+----||DRF main | |Regular F | | | | | | ||LESI = 0 | |.999|.999|.999|.999|.999|.999||------------+-------------+----+----+----+----+----+----||Means: D vs |2-tailed t |.999|.999|.999|.999|.999|.999||R | LESI = 0|-------------+----+----+----+----+----+----|| |1-tailed t |.999|.999|.999|.999|.999|.999||------------+-------------+----+----+----+----+----+----||Means: F vs |2-tailed t |.992|.999|.999|.940|.991|.999||R | LESI = 0|-------------+----+----+----+----+----+----|| |1-tailed t |.997|.999|.999|.970|.996|.999||------------+-------------+----+----+----+----+----+----||LESI main | |2-tailed t |.470|.638|.848|.326|.456|.667||DRF |-------------+----+----+----+----+----+----|| |1-tailed t |.596|.749|.911|.447|.582|.773||------------+-------------+----+----+----+----+----+----||DRF*LESI |2-tailed t |.264|.380|.588|.182|.256|.404||------------+-------------+----+----+----+----+----+----||LESI slopes:|2-tailed t |.231|.322|.491|.164|.224|.341||D vs R |-------------+----+----+----+----+----+----|| |1-tailed t |.336|.442|.615|.252|.328|.462||------------+-------------+----+----+----+----+----+----||LESI slopes:|2-tailed t |.098|.124|.175|.081|.097|.129||F vs R |-------------+----+----+----+----+----+----|| |1-tailed t |.158|.196|.266|.129|.155|.203|----------------------------------------------------------
28 <strong>Unified</strong> <strong>Power</strong> <strong>Analysis</strong>An essence matrix <strong>for</strong> this design is1-2 0 0 0 01-1 0 0 0 01 0 0 0 0 01 1 0 0 0 01 2 0 0 0 0("D" LESI = –2)("D" LESI = –1)("D" LESI = 0)("D" LESI = +1)("D" LESI = +2)X =0 0 1 -2 0 00 0 1 -1 0 00 0 1 0 0 00 0 1 1 0 00 0 1 2 0 0,("R" LESI = –2)("R" LESI = –1)("R" LESI = 0)("R" LESI = +1)("R" LESI = +2)0 0 0 0 1 -20 0 0 0 1 -10 0 0 0 1 00 0 0 0 1 10 0 0 0 1 2("F" LESI = –2)("F" LESI = –1)("F" LESI = 0)("F" LESI = +1)("F" LESI = +2)which has corresponding regression coefficients∫ T = [µ D β D µ R β R µ F β F ].This defines three distinct simple regression models of the <strong>for</strong>mE [lysis ij ] = µ j + β j LESI, where j ∈ {“D” “R” “F”}.Dr. Bowdy specifies the regression coefficients to be∫ T = [.3350 –.0300 .5033 –.010 .6000 .000].(8.41)She takes σ to be .12 or .15. Dr. Bowdy cannot control how the total sample size willdisperse among the 15 combinations of DRF and LESI values, but this is conjectured tofollow the weightsw T = diag(W) = [.02 .03 .04 .05 .06 .12 .12 .12 .12 .12 .04 .04 .04 .04 .04].Listing 8.4.1 gives basic SAS statements showing how an exemplary data set can beconstructed and then analyzed with a standard linear models routine, PROC GLM. Notehow the 'n' variable and the FREQ statement define the weights, which are 100*w. Thus,the first data line effectively creates 2 observations, the second creates 3, etc. Thus N e =100 cases are produced, all with lysis values equal to their respective expected values. Wecould have used PROC GLM's WEIGHT statement to take the non-integer weights givenby w (here, .02 .03 ...), thus giving N e = 1.00, but not all routines will handle this. If, as insome routines, PROC GLM had been unable to handle data giving a sum of squaresresiduals of 0.0, we could have simply replaced the last data line, which is
8.4 <strong>Multivariate</strong> Linear Model 29with the two lines.6000 F 2 04.5000 F 2 02.7000 F 2 02This <strong>for</strong>ces two residuals to be +0.10 and two to be –0.10.The MODEL statement defines a model matrix corresponding to X, with the first threecolumns defining the three intercepts and labeled DRF, and the last three defining the threeslopes and labeled DRF*LESI. Knowing this, the CONTRAST statements shown hereare quickly discernible, especially after reading the effect titles. The main point here is thatpower computations are practical <strong>for</strong> any test within a fixed-effects general linear modelsframework. Just begin by defining an exemplary data set and analyzing it as if it were thereal data.Listing 8.4.2 gives the key parts of output produced by PROC GLM's analysis of thisexemplary data. The uncorrected total degrees of freedom simply gives the value <strong>for</strong> N e ;the Contrast SS “statistics” give the SSH e values. Listing 8.4.3 shows how another SASmodule, PowSetUp (see Appendix), turns these SSH values into power probabilities. Mostinput lines are self-explanatory; NUMPARMS gives the rank of X and the lines followingEFFECTS are those copied verbatim from PROC GLM's output. Running the statementsin Listing 8.4.3 produces the power tables, one of which is Listing 8.4.4.These results show that to address whether stress is related to (QKCA) immunefunction will require at least 500 subjects, and even this number is likely to fail to show thatthe DRF groups have different LESI slopes (DRF*LESI effect). It is unclear at this pointwhether Dr. Bowdy should go ahead with the study at N = 500, seek to increase that totalsample size, or redesign the study to create something with more powerful tests ofhypotheses.8.4 THE MULTIVARIATE GENERAL LINEAR MODELMany of the common methods in multivariate analysis can be developed within theframework of the multivariate general linear model, including Hotelling's T 2 Test,multivariate analysis of variance and covariance (MANOVA and MANCOVA) , lineardiscriminant analysis, profile analysis, and univariate and MANOVA-based repeatedmeasures analyses. To our knowledge, a general and practical method <strong>for</strong> computing thepower <strong>for</strong> such tests was not available until Muller and Peterson (1984) showed that thescheme just described <strong>for</strong> the univariate GLM extends to a sound method <strong>for</strong> themultivariate GLM. We briefly summarize the theory here and present a straight<strong>for</strong>wardexample. Note how our development here parallels that of the last section. In fact, all ofunivariate results given hereto<strong>for</strong>e in this chapter can be shown to be special cases of themultivariate results given in this section. While the conceptual jump from the univariate tothe multivariate power problem is not a particularly difficult one, actually conducting amultivariate power analysis can be a most complex exercise due to the need to makeconjectures about many parameters. For more on this, see Muller, LaVange, Ramey, and
30 <strong>Unified</strong> <strong>Power</strong> <strong>Analysis</strong>Ramey (1992).Consider the standard modelY = XB + ε, (8.42)in which Y is the N × p matrix of the dependent variables, X is the N × r model matrix(full column rank, as in the univariate case), B is an r × p matrix of the fixed, unknowncoefficients, and ε is the N × p matrix with independent row vectors of true residualshaving covariance matrix Í. The usual estimates areandB = (X T X) -1 X T Y, (8.43)Í = (Y – XB) T (Y – XB)/(N – r). (8.44)We focus here on the general linear hypothesis,H 0 : CBU = Œ 0 , (8.45)where C is df C × r with full rank(C) = df C ≤ r, identical in <strong>for</strong>m and function to that of theunivariate case. The U matrix is p × df U with full rank(U) = df U ≤ p. The degrees offreedom <strong>for</strong> H 0 is df H = df C df U . Œ 0 is almost always chosen to be 0. Just as C controlscontrasts on the rows of B, U controls contrasts on its columns. The net effect of U is tocreate a set of df U “contrast variables,” Y = YU, giving the modelY = XBU + εU = XB + ε, (8.46)This now involves the covariance matrix U T ÍU = Í and the hypothesis H 0 : CB = Œ 0 .Thus if df U = 1, the problem becomes a univariate GLM on y = YU and the methods ofthe last section apply directly. Such a reduction in dimensionality is often done in dataanalysis. The matched-pairs t-test discussed in Section 8.2.2 is a basic example of this,using p = 2, U T = [1 -1]. Ordinary MANOVAs require U = I, along with the same X andC matrices used <strong>for</strong> their univariate counterparts. The cell means model, <strong>for</strong> example,becomes the cell mean-vectors model. For a three-group case, C = [1 –.5 –.5] tests thefirst mean vector versus the average of the other two mean vectors. For a full treatment onhow <strong>for</strong>ming contrast variables can handle repeated measures, see O'Brien and Kaiser(1985).All of the common test statistics <strong>for</strong> H 0 are based on the assumption that the rows ofεU are independent, multivariate Normal vectors. SSH from the univariate model nowgeneralizes toH = (CBU – Œ 0 ) T [C(X T X) -1 C T ] -1 (CBU – Œ 0 )= N(CBU – Œ 0 ) T [C(X T WX) -1 C T ] -1 (CBU – Œ 0 ) (8.47)= NH ∗ ,the df U × df U sums of squares and cross products matrix <strong>for</strong> the hypothesis. X and W
8.4 <strong>Multivariate</strong> Linear Model 31were defined and discussed in Section 8.3. σ 2 generalizes to U T ÍU = E/(N – r), whereE = U T (Y – XB) T (Y – XB)U. (8.48)The s = min(df C , df U ) eigenvalues of H(H + E) -1 , ρ 2 k , are the (generalized) squaredcanonical correlations. Many authors choose to work with the roots of HE -1 , ρ 2 k /(1 – ρ 2 k );mathematically, the choice is arbitrary. Many multivariate texts, including Seber's (1984),describe the Wilks, Hotelling-Lawley, Pillai-Bartlett, and Roy methods <strong>for</strong> <strong>for</strong>ming teststatistics from these eigenvalues and the trans<strong>for</strong>ms that convert the first three toapproximate F statistics. Wilks' likelihood ratio statistic is the determinant of E(H + E) -1 ,or equivalently,s2(8.49)W = (1 – ρ k ).∏k = 1Rao's trans<strong>for</strong>mation converts this to an F(df H , df E ) statistic,whereandg =F W = (1 - W1/g )/df H(W 1/g )/df E, (8.50)1 df H ≤ 3[(df H2– 4)/(df C2+ df U2– 5)] 1/2 df H ≥ 4(8.51)df E = g[N – r – (df U – df C + 1)/2] – (df H – 2)/2. (8.52)Muller and Peterson outlined a good approximation (exact if df U = 1) <strong>for</strong> thenoncentrality of F W . Replacing B with B in (8.47) gives us H e = NH e ∗ , the multivariateversion of SSH e = N⋅SSH e ∗ , the exemplary data <strong>for</strong>m used in Section 8.3. Compute theeigenvalues of H e ∗ {H e∗ + [(N – r)/N]U T ÍU} -1 , which are denoted ρ ek 2 . Use ρ ek 2 in place ofρ k2in computing F W to get F W e . Then F W is distributed approximately as F(df H , df E , λ),whereλ = df H F W e . (8.53)Due to the (N – r)/N term in the eigenproblem leading to λ, λ/N is not invariant to N, as itis in the univariate case. Thus the primary noncentrality cannot be defined. O’Brien andShieh (under review) have proposed a modification to this method that does define aprimary noncentrality and that may give more accurate power probabilities.Muller and Peterson applied this idea to get power approximations <strong>for</strong> the F statisticsassociated with the Hotelling-Lawley and Pillai-Bartlett statistics as well. They summarizedarguments supporting the method's numerical accuracy. Barton and Cramer (1989)reported Monte Carlo results that also supported the accuracy of the approximation. Ageneral, practical power approximation <strong>for</strong> Roy's Greatest Root statistic does not exist, <strong>for</strong>here even its null distribution is difficult to characterize.
32 <strong>Unified</strong> <strong>Power</strong> <strong>Analysis</strong>Example 5: <strong>Multivariate</strong> GLM <strong>for</strong> a Cross-Over DesignDr. Katie Kohlimein is planning an experiment to assess how mental stress and anadrenaline-like hormone affect the metabolism of cholesterol in people age 30-45 withnormal cholesterol levels. Gender differences are of key interest here, because of the muchgreater incidence of coronary heart disease in men (cf. Stoney, Matthews, McDonald, andJohnson, 1988). The study will compare the following conditions:Control Day (C):Subject will have an eight-hour admission to the GeneralClinical Research Center (GCRC), having blood and urinesampled every hour.Mental Stress Day (S): Same as C, but in addition per<strong>for</strong>ms a series of stressfulmental tasks <strong>for</strong> two hours.Dosophrine Day (D): Same as C, but in addition is infused with 30 mg/kg/hourdosophrine continuously <strong>for</strong> two hours. Dosophrine issimilar to adrenaline (epinephrine).Subjects will go <strong>through</strong> each condition, one per month in a randomly determinedorder, thus <strong>for</strong>ming a three-period cross-over design. Each admission will be preceded bytwo weeks on a low-fat, low-cholesterol diet. At Hour 0 the subject will be given a “meal”very high in cholesterol. Baseline measurements will be taken at Hours 1 and 2 andaveraged. Experimental manipulations will occur during Hours 3 and 4. Measurements atHours 5 and 6 will be averaged to give short-term, post-treatment values. The outcomemeasure of interest <strong>for</strong> this power analysis will ∆LDL56, the change in low-densitylipoprotein cholesterol (LDL-C) blood levels from Hours 1-2 to Hours 5-6. Equalnumbers of men and women will be studied and equal numbers of subjects will get the sixorders of of treatment (CSD, CDS, ..., DSC). Thus, the total sample size will be a factorof 12. Due to the expensive labwork, a tight budget calls <strong>for</strong> N = 36 (18 of each gender),but it may be possible to run N = 48. Cross-over effects will be checked, but areconsidered unlikely. The main analysis will employ a MANOVA-based repeatedmeasures structure, with one two-level between-subjects factor, Gender, and one threelevelwithin-subjects (cross-over) factor, Treatment.Dr. Kohlimein makes conjectures <strong>for</strong> the mean ∆LDL56 values, which can be arrangedto <strong>for</strong>m the matrix,C S D3 12 8B =male1 5 7.femaleShe further specifies that the within-group variances are 25, 64, and 36 across the C, S, andD conditions. She also believes that the C/S and C/D correlations are .400 and the S/Dcorrelation is .625 (5/8), thus <strong>for</strong>ming the covariance matrix,
8.4 <strong>Multivariate</strong> Linear Model 33Listing 8.5. Computations <strong>for</strong> Dr. Kohlimein's Cross-Over Study.Listing 8.5.1.SAS PROC IML statements to use MVpower module.options nosource2;title "Katie Kohlimein: <strong>Power</strong> <strong>for</strong> 2 (between) x 3 (within)";proc iml;%include MVpower;Opt_off = {UNIGG};*Define matrices *;******************************** BETA ROW1: Males ** ROW2: Females ********************************;* COLUMNS: Control Psych Stress Dosophrine;beta = { 3 12 8 ,1 5 7 };sigma = { 25 16 12 ,16 64 30 ,12 30 36 };essenceX=I(2); *creates 2 x 2 identity matrix;repN={12 18 24}; *creates N sizes of 24, 36, and 48;round=3;Utreat = { 1 0,-1 1,0 -1};title2 "Gender main effect";C = {1 -1};U = {1,1,1}/3;run power;title2 "Treatment main effect";U = Utreat;C = {.5 .5};run power;title2 "Gender*Treatment interaction";C = {1 -1};U = Utreat;run power;
34 <strong>Unified</strong> <strong>Power</strong> <strong>Analysis</strong>Listing 8.5.2.Selected OutputKatie Kohlimein: <strong>Power</strong> <strong>for</strong> 2 (between) x 3 (within)Gender main effectCASE ALPHA TOTAL_N WLK_PWR1 0.05 24 0.3262 0.05 36 0.4673 0.05 48 0.589Treatment main effectCASE ALPHA TOTAL_N WLK_PWR1 0.05 24 0.9832 0.05 36 0.9993 0.05 48 0.999Gender*Treatment interactionCASE ALPHA TOTAL_N WLK_PWR1 0.05 24 0.4612 0.05 36 0.6713 0.05 48 0.814
8.5 Other Methods 35Define C A = [ .5 .5 ], C G = [ 1 -1 ],C S D25 16 12 CÍ = 16 64 30 S .12 30 36 DU A =1/31/31/3, and U T =1 0-1 1 ,0 -1where A = “average", G = “Gender,” and T = “Treatment.” Then the null hypotheses thatspecify the Gender main, Treatment main, and Gender × Treatment interaction effects areH G : C G BU A = 0, H T : C A BU T = 0, and H G×T : C G BU T = 0.We compute the approximate λ and associated power using MVpower, a module ofSAS IML statements (see Appendix). The input and selected output are given in Listing8.5. In MVpower, X can be <strong>for</strong>med by repeating the “essenceX” matrix, X, “RepN” times.For example, if RepN is 3, thenXX = X .XBecause this is just a balanced two-group design (between-subjects), we set X to be a 2 × 2identity matrix. With RepN set at 12, 18, or 24, we create an X matrix <strong>for</strong> a cell-meansmodel having N of 24, 36, or 48. The rest of the input should be easy to follow. MVpowerhas far more generality and complexity than we deal with here.With Ω > .99, the test of the Treatment main effect has superb power at N = 36. Butthe Gender main and Gender*Treatment interaction effects are the key components of Dr.Kohlimein's research question, and thus she is troubled that N = 36 yields powers of only0.47 and 0.67 under this scenario. Even with N = 48, the powers of the two tests are only.59 and .81. The latter sounds powerful, but represents a Type II error rate of .19. Ofcourse, this is a rather limited power analysis at this point. Other reasonable scenarios <strong>for</strong> Band Í should be studied as well. This might include the specification of tighter, plannedcontrasts having df U = 1.8.5 OTHER METHODSThis chapter focuses almost exclusively on per<strong>for</strong>ming sample-size analyses <strong>for</strong> situationsin which the research questions call <strong>for</strong> studies designed to reject null hypotheses to betested under fixed-effects linear models, both univariate and multivariate. What aboutanalyzing sample size in other situations? In this section, we summarize some methodsand cite key references that are helpful in other common situations. This includes methodsappropriate <strong>for</strong> handling tests <strong>for</strong> simple random effects models and univariate repeated
36 <strong>Unified</strong> <strong>Power</strong> <strong>Analysis</strong>measures analysis. One large class of interest is the analysis of categorical variables, fromcomparing two independent proportions, to more complex situations, such as comparingor modeling many proportions (logit analysis) or modeling contingency tables (log-linearmodels). Survival analyses are useful when the outcome measure is “time to event A” andthe observations will be right censored because the subject is lost to followup or the studywill end be<strong>for</strong>e the some subjects have experienced “event A.” Finally, we note thatsample size considerations should sometimes focus on the widths of key confidenceintervals, as when studies are being designed to show that treatments are indeed verysimilar rather than different.8.5.1 Univariate Repeated MeasuresMost texts on univariate experimental design discuss the so-called traditional univariaterepeated measures analysis, also known as within-subjects designs and split-plot designs.Maxwell and Delaney (1990) were particularly thorough in comparing the univariateapproach with the multivariate approach, which is outlined above in Example 5. Theunivariate method makes Subjects a random-effects blocking factor and thus becomes amixed-model ANOVA. Its key assumption is that the vectors of repeated residuals fromeach subject are distributed according to a covariance matrix that has a structure calledsphericity. Because sphericity is commonly violated, the Geisser-Greenhouse (1958) andHuynh-Feldt (1970) corrections to the mixed-model solution are often used. Muller andBarton (1989, 1991) and Muller, LaVange, Ramey, and Ramey (1992) presented a schemeto compute approximate powers <strong>for</strong> these methods, but this work is beyond the scope ofthis chapter. The MVpower module contains special features to handle the univariaterepeated measures problem.8.5.2 Random-Effects ANOVAsFor ordinary random-effects designs, the non-null distributions of the common F-statisticsare entirely different from their counterparts <strong>for</strong> fixed-effects designs—even when the nulldistributions are identical. Consider a one-way, random-effects design with J levels in afactor “A,” in which we test the variance component, H 0 : σ2 Α = 0 versus H 0 : σ2 Α > 0.Most texts note that the appropriate F-test (Normal-theory) is identical to that <strong>for</strong> the fixedeffectscase, given here as (8.26). Scheffé (1959, p. 226) shows that if there are n cases ineach level, F is distributed as {1 + nσ 2 Α /σ 2 }F(J – 1, nJ – J, λ = 0). The term{1 + nσ 2 Α /σ 2 } is the ratio of the numerator and denominator expected means squares(EMS). When H 0 : σ2 Α = 0 is true, {1 + nσ 2 Α /σ 2 } = 1.0, making the null case identical tothat <strong>for</strong> fixed effects. When σ2 Α > 0, the non-null sampling distribution is just{1 + nσ 2 Α /σ 2 } times a central F distribution. Thus, the power isΩ = Pr[ F(J – 1, nJ – J, λ = 0) ≥ F α /{1 + nσ Α 2 /σ 2 }]. (8.54)The SAS code to do this is simplyEMSratio = 1 + n*VarCompA/(sigma**2);F_alpha = FINV(1-alpha, J – 1, n*J – J, 0);
8.5 Other Methods 37power = 1 – PROBF( F_alpha/EMSratio, J – 1, J*n – J, 0);Prihoda (1983) generalized this idea somewhat and offered FORTRAN shareware.8.5.3 Comparing Two Independent ProportionsMany studies require comparing two independent proportions, i.e., testing H 0 : π 1 = π 2 ,using sample proportions, p 1 and p 2 , estimated from n 1 = w 1 N and n 2 = w 2 N casesrandomly drawn from (or assigned to) two groups. This is sometimes called the “2 × 2comparative trial,” because it can be put into the context of a 2 × 2 contingency table inwhich one tests the independence of Group (control vs. experimental) and Outcome(success vs. failure). Just getting good p-values is such a complex problem that overtwenty-five different methods have been suggested <strong>for</strong> the generic 2 × 2 problem. Someof these have several possible sample-size/power solutions. Here we give two powerapproximations based on the common t statistic and another <strong>for</strong> Fisher's exact test. TheOneWyPow module per<strong>for</strong>ms the computations <strong>for</strong> all three.Fisher's exact test is a conditional test in that it supposes that both margins of the 2 ×2 table are fixed. The methods based on the t statistic give unconditional tests. Debate onthe merits of unconditional versus conditional tests has continued <strong>for</strong> decades with eminentstatisticians taking both points of view. For the 2 × 2 comparative trial, however, we agreewith Upton (1982) that the exact conditional test is “inappropriate,” with its widepopularity coming largely from its designation of “exact.” Suissa and Shuster (1985)stressed that unconditional tests are easier to interpret and explain to most nonstatisticians,who often do not understand the implications of making conditional inferences.Accordingly, Suissa and Shuster presented an exact unconditional test, which thoughcomputationally intensive, should one day become a common tool. For now, however,Fisher's exact conditional test is still very popular.Unconditional testsThe standard error of (p 1 – p 2 ) iss.e.[( p 1 – p 2 )] = w 2 π 1 (1 – π 1 ) + w 1 π 2 (1 – π 2 )Nw 1 w 21/2. (8.55)This naturally leads to the unpooled t statistic,t u = N 1/2w 1 w 2 1/2 (p 1 – p 2 )Nw 2 p 1 (1 – p 1 ) + w 1 p 2 (1 – p 2 ) /(N – 2) 1/2 . (8.56)Suissa and Shuster presented exact critical values <strong>for</strong> Z u ≡ [N/(N – 2)] 1/2 t u . Whentrans<strong>for</strong>med to t u , they agree well with those from the t(N – 2) distribution. Accordingly,we take t u be a t(N – 2) variate with noncentrality parameter
38 <strong>Unified</strong> <strong>Power</strong> <strong>Analysis</strong>δ u = N 1/2w 1 w 2 1/2 (π 1 – π 2 )w 2 π 1 (1 – π 1 ) + w 1 π 2 (1 – π 2 ) 1/2 . (8.57)After studying this problem with respect to the robustness of the Type I error rates <strong>for</strong>balanced and unbalanced designs, D'Agostino, Chase, and Belanger (1988) recommendedthat the ordinary two-group t statistic be applied to data coded Y = 0 or 1, thus making µ j =p j . This is the pooled t statistic,t p = N 1/2w 1 w 2 1/2 (p 1 – p 2 )Nw 1 p 1 (1 – p 1 ) + w 2 p 2 (1 – p 2 ) /(N – 2) 1/2 . (8.58)As per Dozier and Muller (1993), t p is taken to be a t(N – 2) random variable withnoncentralityδ p = N 1/2w 1 w 2 1/2 (π 1 – π 2 )w 1 π 1 (1 – π 1 ) + w 2 π 2 (1 – π 2 ) 1/2 , (8.59)which produced acceptable power estimates in their simulations.Both noncentralities keep the <strong>for</strong>m δ = N 1/2 δ ∗ , where δ ∗ , the primary noncentrality, isnot dependent on N. For balanced designs, t u = t p and and δ u = δ p . LettingA = w 1 π 1 (1 – π 1 ) + w 2 π 2 (1 – π 2 )w 2 π 1 (1 – π 1 ) + w 1 π 2 (1 – π 2 ) , (8.60)we see that δ u = A 1/2 δ p . t u will have greater (less) approximate noncentrality than t p if andonly if A > 1 (A < 1). By taking the first and second derivatives of δ u and δ p with respectto w 1 , one can show that the optimal w 1 values <strong>for</strong> t u and t p arew 1u = 1 + π 2 (1 – π 2 ) 1/2 -1π 1 (1 – π 1 )and w 1p = 1 + π 1 (1 – π 1 ) 1/2 -1, (8.61)π 2 (1 – π 2 )respectively. These results show that the unpooled test increases in power when the lowerw j weights correspond to the groups with π j closer to 0 or 1, whereas the pooled testworks in the opposite manner.The Conditional TestThe Fisher (or Fisher-Irwin) exact test computes each p-value by defining a specifichypergeometric distribution based on fixing both margins of the table. The powerapproximation presented here stems from the sequence of work by Casagrande, Pike, andSmith (1978), Fleiss, Tytun, and Ury (1980), and Diegert and Diegert (1981). It is basedaround Yates' (1934) statistic, which can be written
8.5 Other Methods 39Z y = N 1/2w 1 w 2 1/2 (p 1 – p 2 ) – (2Nw 1 w 2 ) -1p (1 – p) 1/2 , (8.62)where p = w 1 p 1 + w 2 p 2 . Z y is taken to be a standard Normal variate, Z. For the directionaltest, which by our convention is H A : π 1 > π 2 , Z y is significant at level α if Z y > Z α . Thenondirectional test simply uses Z α/2 . Upton (1982) concluded that Z y gives “extremelyconservative” Type I error rates when considered as an unconditional test, but that it is“practically identical” to Fisher's exact conditional test. Suissa and Shuster (1985) gaveexact results showing that Fisher's test requires larger sample sizes than does their exactversion of t u .To compute approximate power <strong>for</strong> the directional test, let r = w 2 /w 1 ; π = w 1 π 1 + w 2 π 2 ;h = (r + 1)/(r |π 1 – π 2 | ); m = (r + 1) 2 h 2 /N 2 – h + N/(r + 1). ComputeZ Ω = – (π 1 – π 2 )(m r) 1/2 + Z α (r + 1)π (1 – π) 1/2r π 1 (1 – π 1 ) + π 2 (1 – π 2 ) 1/2 , (8.63)then find the power, Ω 1 = Pr[ Z ≥ Z Ω ]. For the nondirectional test, use Z α/2 instead ofZ α . This method undergirds the sample-size tables in Fleiss (1981), which are very handybut are limited to balanced designs. Thomas and Conlon (1992) presented an efficientalgorithm to compute powers directly from the hypergeometric distribution. In particular,it should be used in cases involving a small expected frequency in one of the cells of the 2× 2 table.Example 6: Comparing Two Independent ProportionsOne hundred <strong>for</strong>ty early-Alzheimer's patients are to be recruited <strong>for</strong> a randomized, placebocontrolled, double-blinded clinical trial to test whether DS110891, a synthetic <strong>for</strong>m ofglutamate, improves their memory and learning, at least temporarily. All patients willcontinue to receive their standard care. Based on several cognitive measurements, eachpatient will be scored “improved” or “not improved” after three months on study. It isconjectured that 40% of the DS110891 patients versus 20% of the placebo patients willimprove. To optimize the power of the t u statistic, w 1 = 55% will be randomized to receiveDS110891. Because A = 1.04, t u will be slightly more powerful than t p .Listing 8.6 gives input and output related to the use of OneWyPow. With N = 140, thepower <strong>for</strong> the .05-based, directional test is .842 <strong>for</strong> t u and .829 <strong>for</strong> t p . Z y , whichcorresponds to Fisher's exact conditional test, has an approximate power of .780. For abalanced design, the power is .838 <strong>for</strong> both t u and t p and .786 <strong>for</strong> Z y . Suissa and Shusterreported that with N = 136 and α = .048, the power of their exact unconditional test isexactly .804 <strong>for</strong> this case. OneWyPow returns a value <strong>for</strong> t u of .824 <strong>for</strong> these specifications.
40 <strong>Unified</strong> <strong>Power</strong> <strong>Analysis</strong>Listing 8.6. Computations <strong>for</strong> Comparing Two Independent ProportionsSAS Inputoptions ls=72 nosource2;%include OneWyPow;title1 "DS110891 trial with Alzheimer's Patients";cards;pi .40 .20 .weight .55 .45 .alpha .01 .05 .Ntotal 100 140 200 .end%include PowTab2;SAS Output----------------------------------------------------------| | ALPHA || |-----------------------------|| | 0.01 | 0.05 || |--------------+--------------|| | Total N | Total N || |--------------+--------------|| |100 |140 |200 |100 |140 |200 || |----+----+----+----+----+----|| |Pow-|Pow-|Pow-|Pow-|Pow-|Pow-|| | er | er | er | er | er | er ||--------------------------+----+----+----+----+----+----||Unpooled |2-tailed t |.357|.521|.718|.605|.752|.886||Approx. |-------------+----+----+----+----+----+----||Uncond. Test|1-tailed t |.456|.620|.797|.721|.842|.936||------------+-------------+----+----+----+----+----+----||Pooled |2-tailed t |.341|.500|.696|.588|.735|.873||Approx. |-------------+----+----+----+----+----+----||Uncond. Test|1-tailed t |.439|.600|.779|.706|.829|.928||------------+-------------+----+----+----+----+----+----||Approx. |2-tailed Z |.264|.420|.633|.504|.671|.837||Conditional |-------------+----+----+----+----+----+----||Test |1-tailed Z |.355|.524|.726|.633|.780|.905|----------------------------------------------------------Other <strong>Tests</strong> on Proportions: Log-Linear ModelsComparing two proportions is only one of the myriad of ways to analyze categorical data.The large class of methods known as log-linear models (which include logit models)
8.6 Conclusion 41provides the familiarity and flexibility of a linear models framework. These methodscommonly employ log-likelihood-ratio χ 2 test statistics, and O'Brien (1986) discussed howthe strategy of using exemplary data extends well to these important methods. Thisstrategy was summarized in Agresti's (1990) extensive text on categorical data analysis.The PowSetUp module is designed to create power tables using results obtained from anordinary log-linear analysis of exemplary data.8.5.4 Survival <strong>Analysis</strong>There is a growing literature on methods <strong>for</strong> estimating power and determining samplesize<strong>for</strong> studies involving survival analysis, where the dependent measure is time until“death.” Commonly, subjects are lost to followup after a known time on study or are still“living” at the time of data analysis. Such data are not missing, they are censored. Weknow that a given subject “lived” at least Y days, and we should use that in<strong>for</strong>mation asfully as possible. Per<strong>for</strong>ming power analyses <strong>for</strong> such studies is a most complex problem.Analytical approximations have been developed <strong>for</strong> straight<strong>for</strong>ward situations; see thesummaries by Lachin (1981) and Donner (1984). Shuster (1990) developed an extensiveset of tables useful <strong>for</strong> planning clinical trials. Goldman and Hillman (1992) presented ascheme that uses the “analysis” of exemplary data. Computer simulations are sometimesused to assess complex situations (Halpern and Brown, 1987). Simulation is an optionthat is always available when the situation is too complex or unique to warrant the ef<strong>for</strong>trequired to develop “nice” analytical solutions.8.5.5 “Accepting the Null” Using Appropriate Confidence IntervalsFinally, we mention that many studies are designed to show either that two or moretreatments or groups are similar or that no relationship exists between or among variables.In medical research, bioequivalence studies are designed to test whether a new therapy hasnearly the same average efficacy as existing standard therapies, albeit the new one offersfewer side effects, lower costs, or more reliability across patients. Thus, the researcher isexpecting to “accept” null hypotheses about efficacy but reject null hypotheses about sideeffects, costs, and reliability. Because appropriate confidence intervals or regions oftenplay the central role in such analyses, the sample size analysis should ensure that thoseintervals or regions will be sufficiently small. Beal (1989) has developed a method andprovided tables to handle situations involving the one-group and two-group t-test.8.6 CONCLUSIONIt is important and practical to per<strong>for</strong>m sound, in-depth power analyses <strong>for</strong> proposedstudies. <strong>Power</strong> analysis has many parallels with data analysis. Our common test statisticshave non-null distributions that can be easily characterized using terms and <strong>for</strong>mulas thatare familiar to the data analyst. Any general method <strong>for</strong> data analysis should have a parallelgeneral method <strong>for</strong> power analysis. This chapter shows how this holds <strong>for</strong> tests fallingunder the univariate and multivariate fixed-effects linear models, with Normal errors. Wepresented realistic examples <strong>for</strong> the two-group t-test, a matched-pairs t-test, the one-way
42 <strong>Unified</strong> <strong>Power</strong> <strong>Analysis</strong>ANOVA with contrasts, an analysis of covariance, and a repeated-measures analysis. Theconcepts developed here apply to all of the special cases of the univariate and multivariategeneral linear models with fixed effects, and to many other methods. In particular, wetreated the comparison of two proportions in some depth. We briefly discussed how it ispossible to use existing data to get more objective estimates <strong>for</strong> the effect sizes. Usually,however, the number of subjects in most pilot studies is too small to make this ef<strong>for</strong>t“safe” and worthwhile.Computing systems need to be developed so that researchers can conduct fullsensitivity analyses of the power over a range of reasonable conjectures <strong>for</strong> the criticalpopulation parameters. Whenever possible, power analysis and data analysis should sharethe same software systems. Wright and O'Brien (1988) discussed how options in SASPROC GLM could be developed to make it per<strong>for</strong>m both steps of the two-step processused in Example 4. Some of these notions have now been implemented in JMP ® , aMacintosh application from the The SAS Institute (1991).ReferencesAgresti, A. (1990). Categorical Data <strong>Analysis</strong>. John Wiley, New York.Barton, C. N. and Cramer, E. C. (1989). Hypothesis Testing in <strong>Multivariate</strong> Linear Models withRandomly Missing Data. Comm. Stat.—Simul. and Comp., 18: 875-895.Beal, S. L. (1989). Sample Size Determination <strong>for</strong> Confidence Intervals on the Population Meansand on the Difference Between Two Population Means. Biometrics, 45: 969-977.Blanchard, E. B., Appelbaum, K. A., Radnitz, C. L., Morrill, B., Michultka, D., Kirsch, C.,Guarnieri, P., Hillhouse, J., Evans, D. D., Jaccard, J., and Barron, K. D. (1990). A ControlledEvaluation of Thermal Biofeedback and Thermal Biofeedback Combined with Cognitive Therapyin the Treatment of Vascular Headache. J. Cons. Clin. Psych., 2: 216-224.Casagrande, J. T., Pike, M. C., and Smith, P. G. (1978). An Improved Approximate Formula <strong>for</strong>Calculating Sample Sizes <strong>for</strong> Comparing Two Binomial Distributions. Biometrics, 34: 483-486.Cohen, J. (1988). Statistical <strong>Power</strong> <strong>Analysis</strong> <strong>for</strong> the Behavioral Sciences (2nd ed.). LawrenceErlbaum, Hillsdale, New Jersey.Cohen, J. (1992). A <strong>Power</strong> Primer. Psych. Bull., 112: 155-159.Cohen, S., Tyrrell, D. A. J., and Smith, A. P. (1991). Psychological Stress and Susceptibility to theCommon Cold. N. Engl. J. Med., 325: 606-612.D'Agostino, R. B., Chase, W., and Belanger, A. (1988). The Appropriateness of Some CommonProcedures <strong>for</strong> Testing the Equality of Two Independent Binomial Populations. Amer. Statist., 42:198-202.Diegert, C. and Diegert, K. V. (1981). Note on Inversion of Casagrande-Pike-Smith ApproximateSample-Size Formula <strong>for</strong> Fisher-Irwin Test on 2x2 Tables. Biometrics, 37: 595.Donner, A. (1984). Approaches to Sample Size Estimation in the Design of Clinical Trials-AReview. Statis. Med., 3: 199-214.Dozier, W. G., and Muller, K. E. (1993). Small-Sample <strong>Power</strong> of Uncorrected and SatterthwaiteCorrected t <strong>Tests</strong> <strong>for</strong> Comparing Two Proportions. Comm. Stat.—Simul. and Comp., 22: xxx-xxx.Fleiss, J. L. (1981). Statistical Methods <strong>for</strong> Rates and Proportions (2nd ed). John Wiley, New York.
References 43Fleiss, J. L., Tytun, A., and Ury, H. K. (1980). A Simple Approximation <strong>for</strong> Calculating SampleSizes <strong>for</strong> Comparing Independent Proportions. Biometrics, 36: 343-346.Fleming, T. R., Harrington, D. P., and O'Brien, P. C. (1984). Designs <strong>for</strong> Group Sequential <strong>Tests</strong>.Controlled Clinical Trials, 5: 348-361.Freiman, J. A., Chalmers, T. C., Smith, H., and Kuebler, R. R. (1979). The Importance of Beta, theType II Error, and Sample Size in the Design and Interpretation of the Randomized Clinical Trial.N. Engl. J. Med., 299: 690-694. [Updated and reprinted as Chapter 19 in Bailar, J. C. III andMosteller, F. (1992). Medical Uses of Statistics. NEJM Books, Boston.Gatsonis, C. and Sampson, A. R. (1989). Multiple Correlation: Exact <strong>Power</strong> and Sample SizeCalculations. Psych. Bull., 106: 516-524.Geisser, S. and Greenhouse, S. W. (1958). An Extension of Box's Results on the Use of the FDistribution in <strong>Multivariate</strong> <strong>Analysis</strong>. Ann. Math. Statist., 29: 885-891.Goldman, A. I., and Hillman, D. W. (1992). Exemplary Data: Sample Size and <strong>Power</strong> in the Designof Event-Time Clinical Trials. Controlled Clinical Trials, 13: 256-271.Goldstein, R. (1989). <strong>Power</strong> and Sample Size via MS/PC-DOS Computers. Amer. Statist., 43: 253-260.Halpern, J. and Brown, B. W. (1987). Designing Clinical Trials with Arbitrary Specification ofSurvival Functions and <strong>for</strong> the Log Rank and Generalized Wilcoxon Test. Controlled ClinicalTrials, 8: 177-189.Hedges, L. V. (1981). Distribution Theory <strong>for</strong> Glass's Estimator of Effect Size and RelatedEstimators. J. Educ. Statist., 6: 107-128.Huynh, H. and Feldt, L. S. (1970). Conditions Under Which Mean Square Ratios in RepeatedMeasurements Have Exact F-Distribution. J. Amer. Statist. Assoc., 65: 1582-1589.Jemmott III, J. B., Hellman, C., McClelland, D. C., Locke, S. E., Kraus, L., Williams, R. M., andValeri, C. R. (1990). Motivational Syndromes Associated with Natural Killer Cell Activity. J.Behav. Med., 13: 53-73.Kraemer, H., and Thiemann, S. (1987), How Many Subjects? Sage, Beverly Hills, Cali<strong>for</strong>nia.Lachin, J. M. (1981). Introduction to Sample Size Determination and <strong>Power</strong> <strong>Analysis</strong> <strong>for</strong> ClinicalTrials. Controlled Clinical Trials, 2: 93-113.Maxwell, S. E. and Delaney, H. D. (1990). Designing Experiments and Analyzing Data: A ModelComparison Perspective. Wadsworth, Belmont, Cali<strong>for</strong>nia.Melton, K. (1986). A Procedure <strong>for</strong> Initiating Process Control. Unpublished Ph.D. dissertation,University of Tennessee, Knoxville.Muller, K. E. and Barton, C. N. (1989). Approximate <strong>Power</strong> <strong>for</strong> Repeated Measures ANOVA LackingSphericity. J. Amer. Statist. Assoc., 84: 549-555.Muller, K. E. and Barton, C. N. (1991). Correction to ‘Approximate <strong>Power</strong> <strong>for</strong> Repeated MeasuresANOVA Lacking Sphericity.’ J. Amer. Statist. Assoc., 86: 255-256.Muller, K. E., LaVange, L. M., Ramey, S. L., and Ramey, C. T. (1992). <strong>Power</strong> Calculations <strong>for</strong>General Linear <strong>Multivariate</strong> Models including Repeated Measures Applications. J. of the Amer.Statist. Assoc., 87: 1209-1226.Muller, K. E., and Peterson, B. L. (1984). Practical Methods <strong>for</strong> Computing <strong>Power</strong> in Testing the<strong>Multivariate</strong> General Linear Hypothesis. Comp. Statist. Data Analy., 2: 143-158.
44 <strong>Unified</strong> <strong>Power</strong> <strong>Analysis</strong>O'Brien, R. G. (1979). A General ANOVA Method <strong>for</strong> Robust <strong>Tests</strong> of Additive Models <strong>for</strong>Variances. J. Amer. Statist. Assoc., 74: 877-881.O'Brien, R. G. (1981). A Simple Test <strong>for</strong> Variance Effects in Experimental Designs. Psych. Bull.,89: 570-574.O'Brien, R. G. (1986). Using the SAS System to Per<strong>for</strong>m <strong>Power</strong> Analyses <strong>for</strong> Log-Linear Models.Proceedings of the Eleventh SAS Users Group International Conference, SAS Institute, Cary,North Carolina, pp. 778-784.O'Brien, R. G. (1988). Review of <strong>Power</strong>Pack 2.22. Amer. Statist., 42: 266-270.O'Brien, R.G. and Kaiser, M. K. (1985). MANOVA Method <strong>for</strong> Analyzing Repeated MeasuresDesigns: An Extensive Primer. Psych. Bull., 97: 316-333.O'Brien, R. G. and Shieh, G. (under review). Pragmatic, Unifying Algorithm Gives <strong>Power</strong>Probabilities <strong>for</strong> Common F <strong>Tests</strong> of the <strong>Multivariate</strong> General Linear Hypothesis.Pocock, S.J. and Simon, R. (1975). Sequential Treatment Assignment with Balancing <strong>for</strong> PrognosticFactors in the Controlled Clinical Trial. Biometrics, 31: 103-115.Prihoda, T. J. (1983). Convenient <strong>Power</strong> Analyses <strong>for</strong> Complex <strong>Analysis</strong> of Variance Models.Proceedings of the ASA Statistical Computing Section, pp. 267-271.Rosenthal, R. and Rosnow, R. L. (1985). Contrast <strong>Analysis</strong>: Focused Comparisons in the <strong>Analysis</strong> ofVariance. Cambridge University Press, Cambridge, U. K.SAS Institute, Inc. (1990). SAS ® Language Reference, V. 6. SAS Institute, Cary, North Carolina.SAS Institute, Inc. (1991). JMP ® Users Guide, V. 2.0. SAS Institute, Cary, North Carolina.Scheffé, H. (1959). The <strong>Analysis</strong> of Variance. John Wiley, New York.Seber, G. A. F. (1984). <strong>Multivariate</strong> Observations. John Wiley, New York.Sedlmeier, P., and Gigerenzer, G. (1989). Do Studies of Statistical <strong>Power</strong> Have an Effect on the<strong>Power</strong> of Studies? Psych. Bull., 105: 309-316.Shuster, J. J. (1990). Handbook of Sample Size Guidelines <strong>for</strong> Clinical Trials. CRC Press, BocaRaton, FL.Stoney, C. M., Matthews, K. A., McDonald, R. H., and Johnson, C. A. (1988). Sex Differences inLipid, Lipoprotein, Cardiovascular, and Neuroendocrine Responses to Acute Stress. Psychophys,25: 645-656.Suissa, S. and Shuster, J. J. (1985). Exact Unconditional Sample Sizes <strong>for</strong> the 2 × 2 ComparativeTrial. J. Roy. Statist. Soc. A,148: 317-327.Thomas, R. G. and Conlon, M. (1992). Sample Size Determination Based on Fisher's Exact Test <strong>for</strong>Use in 2 x 2 Comparative Trials with Small Event Rates. Controlled Clinical Trials, 13: 134-147.Upton, G. J. G. (1982). A Comparison of Alternative <strong>Tests</strong> <strong>for</strong> the 2 × 2 Comparative Trial. J. Roy.Statist. Soc. A, 145: 86-105.Venables, W. (1975). Calculation of Confidence Intervals <strong>for</strong> Noncentrality Parameters. J. Roy.Statist. Soc. B, 37: 406-412.Wright, S. P. and O'Brien, R. G. (1988). <strong>Power</strong> <strong>Analysis</strong> in an Enhanced GLM Procedure: What ItMight Look Like. Proceedings of the Thirteenth SAS Users Group International Conference, SASInstitute, Cary, North Carolina, pp. 1097-1102.Yates, F. (1934). Contingency Tables Involving Small Numbers and the χ 2 Test. J. Roy. Stat. Soc.Supplement, 1: 217-235.
Appendix: Getting Software 45Appendix: Getting the Freeware(updated July 1998)All computations in this chapter where per<strong>for</strong>med within The SAS ® System usingfreeware modules (files containing SAS statements) that are processed via %INCLUDEstatements in SAS input.The OneWyPow, PowSetUp, and several PowTab modules handled all univariatemethods (Examples 1-4 and 6). Their use and output is displayed in Listings 8.1-8.4 and8.6. The modules run within the “base” SAS environment. All of this functionality, andfar more, has been incorporated into UnifyPow (O'Brien, 1998), a freeware SASmodule/macro that is easier to use than the older programs described above. The UnifyPowproject continues.The MVpower module per<strong>for</strong>med the computations <strong>for</strong> Example 5. See Listing 8.5.MVpower is a module of PROC IML statements. PROC IML is not part of “base” SAS.UnifyPowDeveloper: Ralph G. O'BrienDepartment of Biostatistics and Epidemiology/ P88Cleveland Clinic FoundationCleveland, OH 44195Voice: 216-445-9451; email: robrien@bio.ri.ccf.orgHomepage: http://www.bio.ri.ccf.org/Resume/Pages/robrien.htmlDistribution site: http://www.bio.ri.ccf.org/power.htmlUnifyPow is freeware. It runs within the “base” SAS environment and thus should run onany plat<strong>for</strong>m that runs the SAS System, including MS Windows, UNIX, Macintosh, IBMmainframes, and others. The files distributed contain all source statements and instructionson installation and use.UnifyPow HAS NO WARRANTY WHATSOEVER. The developer wouldappreciate hearing about problems and suggestions <strong>for</strong> improvements regarding thesoftware. He would also like to hear when they worked well <strong>for</strong> you. Please correspondvia electronic mail (preferred) or telephone. Time rarely allows him to respond to“consulting” questions.
46 <strong>Unified</strong> <strong>Power</strong> <strong>Analysis</strong>MVpowerCo-developers: Lynette L. KeyesKeith E. MullerDepartment of BiostatisticsCB #7400, School of Public Health3105C McGavran-Greenberg HallThe University of North CarolinaChapel Hill, North Carolina 27599Email: muller@bios.unc.eduWebsite: http://www.bios.unc.edu/~mullerMVpower.sas is a module of SAS PROC IML statements that per<strong>for</strong>m power analyses <strong>for</strong>the General Linear <strong>Multivariate</strong> Model and <strong>for</strong> the univariate approach to repeatedmeasures, including the Geisser-Greenhouse and Huynh-Feldt solutions. The powerapproximation methods of Muller and Peterson (1984) are used <strong>for</strong> the general multivariatecase. Also, at the time of this printing, Muller was planning to soon include the algorithmdescribed in O’Brien and Shieh (under review). Exact results are provided <strong>for</strong> allunivariate models and <strong>for</strong> some multivariate models. The methods of Muller and Barton(1989, 1991) undergird the multivariate and univariate approaches to the powerapproximations <strong>for</strong> repeated measures. Key restrictions include the assumptions ofGaussian (Normal) errors, fixed predictor values, a common design <strong>for</strong> all responses, andno missing data.MVpower handles a very broad class of univariate and multivariate ANOVA andregression problems, because users specify directly the X, B, Í, C, and U matrices that<strong>for</strong>m the models and hypotheses outlined in Section 8.4. All matrices must be full rank.Little or no experience with PROC IML is required to use MVpower. PROC IML is asupplement to the “basic” distribution of SAS. If it is not yet available to you, you mayorder it from the SAS Institute.As of July 1998, this freeware was available at Dr. Muller's website given above.ReferenceO’Brien RG (1998), “A Tour of UnifyPow: A SAS Module/Macro <strong>for</strong> Sample-Size<strong>Analysis</strong>,” Proceedings of the 23nd SAS Users Group International Conference, Cary,NC, SAS Institute, 1346-1355. [This too is available from the UnifyPow website.]