<strong>2013</strong>-<strong>14</strong> <strong>2013</strong>-<strong>14</strong> 2012-13 Function Detail Functions Tentative Budget Final Budget Variance Final Budget Regular Programs 19,335,854 19,358,488 22,634 19,849,041 Special Education Programs 5,260,633 5,627,248 366,615 3,463,432 Special Education Early Childhood Program 425,466 425,878 412 370,405 Payments for Special Education Programs 1,687,320 1,687,320 - 1,572,302 Pre-K At Risk Program 323,180 323,180 - 370,405 INSTRUCTION INSTRUCTION TAKES TOP PRIORITY <strong>Hawthorn</strong> <strong>School</strong> <strong>District</strong> <strong>73</strong> <strong>2013</strong>-20<strong>14</strong> Total Expenditure Budget Reading Specialists 183,087 335,307 152,220 110,005 Interscholastic Programs 356,419 356,419 - 306,374 Summer <strong>School</strong> Programs 226,868 226,868 - 292,964 Bilingual Programs 1,308,677 1,299,711 (8,966) 1,008,490 Office of the Principal Services 2,458,090 2,451,554 (6,536) 2,344,369 31,565,594 32,091,9<strong>73</strong> 526,379 29,687,787 INSTRUCTIONAL SUPPORT OPERATIONS LEADERSHIP OTHER Attendance & Social Work Services 1,019,879 1,002,529 (17,350) 860,969 Health Services 340,164 340,164 - 356,966 Psychological Services 381,129 381,129 - 330,761 Speech Pathology & Audiology Services 1,175,523 1,175,523 - 1,128,457 Special Education Direction 616,528 575,021 (41,507) 1,022,007 Support Services Personnel - SSP - - - 608,810 <strong>School</strong> Resource Officer 65,000 65,000 - 63,860 Improvement of Instructional Services and Staff Development 630,055 627,455 (2,600) 566,258 Educational Media Services 539,559 544,932 5,3<strong>73</strong> 630,541 Assessment & Testing Services <strong>14</strong>1,000 164,000 23,000 157,400 Information Services - Technology and Public 1,223,949 1,222,808 (1,<strong>14</strong>1) 1,160,425 Human Resources Services 366,708 366,708 - 370,717 Special Area / Technology Administration Services 45,405 45,405 0 55,331 6,544,899 6,510,674 (34,225) 7,312,502 Risk Management 408,7<strong>73</strong> 408,7<strong>73</strong> 0 375,447 Business Services <strong>73</strong>6,416 <strong>73</strong>6,416 0 662,451 Operation & Maintenance of Plant Service 6,<strong>14</strong>4,432 6,224,432 80,000 5,676,703 Transportation 3,174,771 3,174,771 0 2,981,993 Food Services 1,0<strong>14</strong>,125 1,107,125 93,000 1,011,179 11,478,517 11,651,517 1<strong>73</strong>,000 10,707,7<strong>73</strong> General Administration Services 252,561 252,561 0 343,550 Executive Administration Services 336,<strong>73</strong>9 336,<strong>73</strong>9 0 345,064 589,300 589,300 0 688,6<strong>14</strong> Debt Service 5,330,130 5,221,584 (108,546) 5,151,299 Community Services 37,656 37,656 0 44,198 5,367,786 5,259,240 (108,546) 5,195,497 Total 55,546,096 56,102,704 556,608 53,592,1<strong>73</strong> Budget <strong>2013</strong>-<strong>14</strong> Final.xls - Instruction
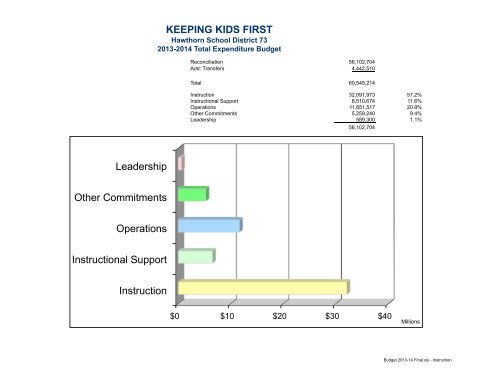
KEEPING KIDS FIRST <strong>Hawthorn</strong> <strong>School</strong> <strong>District</strong> <strong>73</strong> <strong>2013</strong>-20<strong>14</strong> Total Expenditure Budget Reconciliation 56,102,704 Add: Transfers 4,442,510 Total 60,545,2<strong>14</strong> Instruction 32,091,9<strong>73</strong> 57.2% Instructional Support 6,510,674 11.6% Operations 11,651,517 20.8% Other Commitments 5,259,240 9.4% Leadership 589,300 1.1% 56,102,704 Leadership Other Commitments Operations Instructional Support Instruction $0 $10 $20 $30 $40 Millions Budget <strong>2013</strong>-<strong>14</strong> Final.xls - Instruction