Taxable Municipal Guide - Piper Jaffray
Taxable Municipal Guide - Piper Jaffray
Taxable Municipal Guide - Piper Jaffray

You also want an ePaper? Increase the reach of your titles
YUMPU automatically turns print PDFs into web optimized ePapers that Google loves.
September 2010<br />
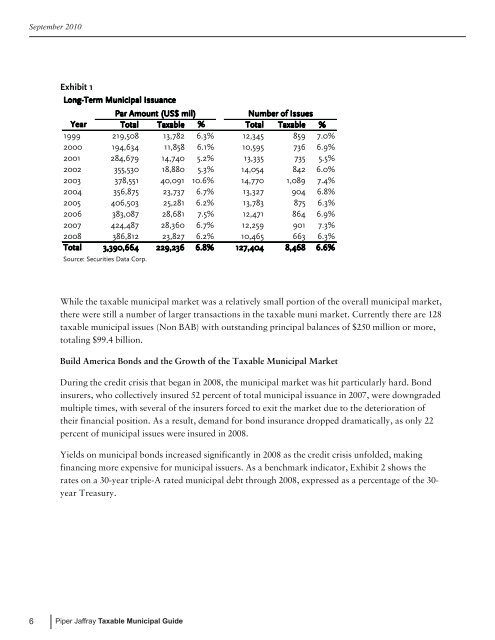
Exhibit 1<br />
Long-Term <strong>Municipal</strong> Issuance<br />
Par Amount (US$ mil)<br />
Number of Issues<br />
Year Total <strong>Taxable</strong> % Total <strong>Taxable</strong> %<br />
1999 219,508 13,782 6.3% 12,345 859 7.0%<br />
2000 194,634 11,858 6.1% 10,595 736 6.9%<br />
2001 284,679 14,740 5.2% 13,335 735 5.5%<br />
2002 355,530 18,880 5.3% 14,054 842 6.0%<br />
2003 378,551 40,091 10.6% 14,770 1,089 7.4%<br />
2004 356,875 23,737 6.7% 13,327 904 6.8%<br />
2005 406,503 25,281 6.2% 13,783 875 6.3%<br />
2006 383,087 28,681 7.5% 12,471 864 6.9%<br />
2007 424,487 28,360 6.7% 12,259 901 7.3%<br />
2008 386,812 23,827 6.2% 10,465 663 6.3%<br />
Total 3,390,664 229,236 6.8% 127,404 8,468 6.6%<br />
Source: Securities Data Corp.<br />
While the taxable municipal market was a relatively small portion of the overall municipal market,<br />
there were still a number of larger transactions in the taxable muni market. Currently there are 128<br />
taxable municipal issues (Non BAB) with outstanding principal balances of $250 million or more,<br />
totaling $99.4 billion.<br />
Build America Bonds and the Growth of the <strong>Taxable</strong> <strong>Municipal</strong> Market<br />
During the credit crisis that began in 2008, the municipal market was hit particularly hard. Bond<br />
insurers, who collectively insured 52 percent of total municipal issuance in 2007, were downgraded<br />
multiple times, with several of the insurers forced to exit the market due to the deterioration of<br />
their financial position. As a result, demand for bond insurance dropped dramatically, as only 22<br />
percent of municipal issues were insured in 2008.<br />
Yields on municipal bonds increased significantly in 2008 as the credit crisis unfolded, making<br />
financing more expensive for municipal issuers. As a benchmark indicator, Exhibit 2 shows the<br />
rates on a 30-year triple-A rated municipal debt through 2008, expressed as a percentage of the 30-<br />
year Treasury.<br />
6<br />
<strong>Piper</strong> <strong>Jaffray</strong> <strong>Taxable</strong> <strong>Municipal</strong> <strong>Guide</strong>