The Information Content of Accounting Numbers as Earnings ...
The Information Content of Accounting Numbers as Earnings ...
The Information Content of Accounting Numbers as Earnings ...

Create successful ePaper yourself
Turn your PDF publications into a flip-book with our unique Google optimized e-Paper software.
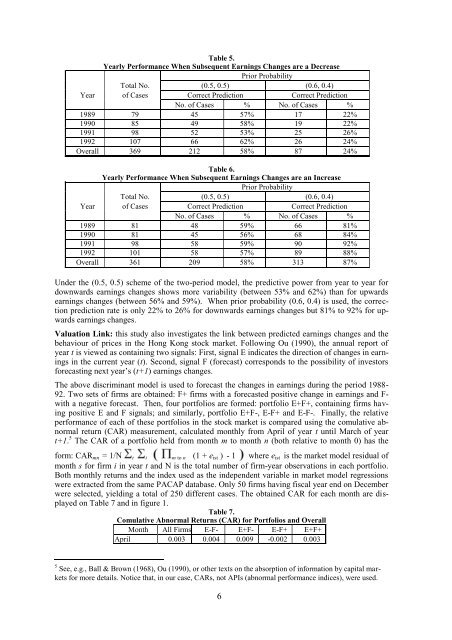
Table 5.<br />
Yearly Performance When Subsequent <strong>Earnings</strong> Changes are a Decre<strong>as</strong>e<br />
Prior Probability<br />
Total No. (0.5, 0.5) (0.6, 0.4)<br />
Year <strong>of</strong> C<strong>as</strong>es Correct Prediction Correct Prediction<br />
No. <strong>of</strong> C<strong>as</strong>es % No. <strong>of</strong> C<strong>as</strong>es %<br />
1989 79 45 57% 17 22%<br />
1990 85 49 58% 19 22%<br />
1991 98 52 53% 25 26%<br />
1992 107 66 62% 26 24%<br />
Overall 369 212 58% 87 24%<br />
Table 6.<br />
Yearly Performance When Subsequent <strong>Earnings</strong> Changes are an Incre<strong>as</strong>e<br />
Prior Probability<br />
Total No. (0.5, 0.5) (0.6, 0.4)<br />
Year <strong>of</strong> C<strong>as</strong>es Correct Prediction Correct Prediction<br />
No. <strong>of</strong> C<strong>as</strong>es % No. <strong>of</strong> C<strong>as</strong>es %<br />
1989 81 48 59% 66 81%<br />
1990 81 45 56% 68 84%<br />
1991 98 58 59% 90 92%<br />
1992 101 58 57% 89 88%<br />
Overall 361 209 58% 313 87%<br />
Under the (0.5, 0.5) scheme <strong>of</strong> the two-period model, the predictive power from year to year for<br />
downwards earnings changes shows more variability (between 53% and 62%) than for upwards<br />
earnings changes (between 56% and 59%). When prior probability (0.6, 0.4) is used, the correction<br />
prediction rate is only 22% to 26% for downwards earnings changes but 81% to 92% for upwards<br />
earnings changes.<br />
Valuation Link: this study also investigates the link between predicted earnings changes and the<br />
behaviour <strong>of</strong> prices in the Hong Kong stock market. Following Ou (1990), the annual report <strong>of</strong><br />
year t is viewed <strong>as</strong> containing two signals: First, signal E indicates the direction <strong>of</strong> changes in earnings<br />
in the current year (t). Second, signal F (forec<strong>as</strong>t) corresponds to the possibility <strong>of</strong> investors<br />
forec<strong>as</strong>ting next year’s (t+1) earnings changes.<br />
<strong>The</strong> above discriminant model is used to forec<strong>as</strong>t the changes in earnings during the period 1988-<br />
92. Two sets <strong>of</strong> firms are obtained: F+ firms with a forec<strong>as</strong>ted positive change in earnings and F-<br />
with a negative forec<strong>as</strong>t. <strong>The</strong>n, four portfolios are formed: portfolio E+F+, containing firms having<br />
positive E and F signals; and similarly, portfolio E+F-, E-F+ and E-F-. Finally, the relative<br />
performance <strong>of</strong> each <strong>of</strong> these portfolios in the stock market is compared using the comulative abnormal<br />
return (CAR) me<strong>as</strong>urement, calculated monthly from April <strong>of</strong> year t until March <strong>of</strong> year<br />
t+1. 5 <strong>The</strong> CAR <strong>of</strong> a portfolio held from month m to month n (both relative to month 0) h<strong>as</strong> the<br />
form: CAR mn = 1/N t i m to n (1 + e ist ) - 1 where e ist is the market model residual <strong>of</strong><br />
month s for firm i in year t and N is the total number <strong>of</strong> firm-year observations in each portfolio.<br />
Both monthly returns and the index used <strong>as</strong> the independent variable in market model regressions<br />
were extracted from the same PACAP datab<strong>as</strong>e. Only 50 firms having fiscal year end on December<br />
were selected, yielding a total <strong>of</strong> 250 different c<strong>as</strong>es. <strong>The</strong> obtained CAR for each month are displayed<br />
on Table 7 and in figure 1.<br />
Table 7.<br />
Comulative Abnormal Returns (CAR) for Portfolios and Overall<br />
Month All Firms E-F- E+F- E-F+ E+F+<br />
April 0.003 0.004 0.009 -0.002 0.003<br />
5 See, e.g., Ball & Brown (1968), Ou (1990), or other texts on the absorption <strong>of</strong> information by capital markets<br />
for more details. Notice that, in our c<strong>as</strong>e, CARs, not APIs (abnormal performance indices), were used.<br />
6