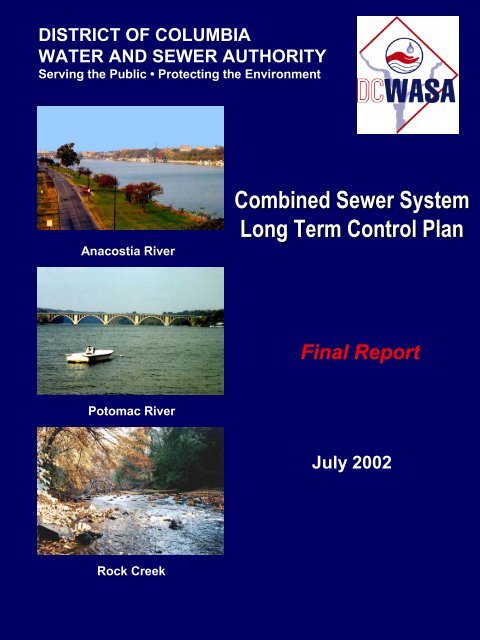
Combined Sewer System Long Term Control Plan - DC Water
Combined Sewer System Long Term Control Plan - DC Water
Combined Sewer System Long Term Control Plan - DC Water

Create successful ePaper yourself
Turn your PDF publications into a flip-book with our unique Google optimized e-Paper software.
DISTRICT OF COLUMBIA<br />
WATER AND SEWER AUTHORITY<br />
Serving the Public • Protecting the Environment<br />
Anacostia River<br />
<strong>Combined</strong> <strong>Sewer</strong> <strong>System</strong><br />
<strong>Long</strong> <strong>Term</strong> <strong>Control</strong> <strong>Plan</strong><br />
Final Report<br />
Potomac River<br />
July 2002<br />
Rock Creek
DISTRICT OF COLUMBIA<br />
WATER AND SEWER AUTHORITY<br />
<strong>Combined</strong> <strong>Sewer</strong> <strong>System</strong><br />
<strong>Long</strong> <strong>Term</strong> <strong>Control</strong> <strong>Plan</strong><br />
Submitted by:<br />
District of Columbia<br />
<strong>Water</strong> and <strong>Sewer</strong> Authority<br />
Prepared by:<br />
Greeley and Hansen LLC<br />
July 2002
Acknowledgments<br />
The following District of Columbia <strong>Water</strong> and <strong>Sewer</strong> Authority (WASA) Board Members and staff had<br />
key roles in the completion of this project:<br />
<br />
<br />
<br />
<br />
<br />
<br />
<br />
<br />
<br />
<br />
<br />
<br />
<br />
Glenn S. Gerstell, Chairman of the Board<br />
Charles C. Johnson, Jr., Chairman, Operations Committee<br />
David J. Bardin, Chairman, CSO/Stormwater Subcommittee<br />
Jerry N. Johnson, General Manager<br />
Michael S. Marcotte, Deputy General Manager and Chief Engineer<br />
Paul S. Bender, Deputy General Manager/Chief Financial Officer and his staff<br />
Henderson Brown, General Counsel and his staff<br />
Leonard R. Benson, Director of Engineering & Technical Services and his staff<br />
Walter M. Bailey, Director of Wastewater Treatment and his staff<br />
Cuthbert Braveboy, Director of <strong>Sewer</strong> Services and his staff<br />
Libby Lawson, Director of Public Affairs<br />
Martin B. Sultan, Manager of Program Management, and<br />
Mohsin R. Siddique, CSO <strong>Control</strong> Program Manager<br />
This report was prepared for WASA by Engineering Program Management Consultant-III (EPMC-III),<br />
with assistance from the Metropolitan Washington Council of Governments. Participating EPMC-III<br />
firms are as follows:<br />
Greeley and Hansen LLC – Program Manager<br />
Advanced Engineering, P. C.<br />
Delon Hampton and Associates<br />
Equals Three Communications<br />
J-DOS Internationale, Inc.<br />
Limno-Tech, Inc.<br />
O’Brien & Gere Engineers, Inc.<br />
Principal Greeley and Hansen staff for the project are: Ronald E. Bizzari, Lawrence P. Jaworski and<br />
John F. Cassidy.<br />
Partial financial support was provided to WASA by a U. S. Environmental Protection Agency grant to<br />
carry out the <strong>Combined</strong> <strong>Sewer</strong> <strong>System</strong> <strong>Long</strong> <strong>Term</strong> <strong>Control</strong> <strong>Plan</strong> (CSS LTCP) development effort under<br />
Grant No. C-110030-01.<br />
J:\1160\LTCP\LTCP FINAL\REPORT\ACKN.DOC FINAL - July 2002
DISTRICT OF COLUMBIA<br />
WATER AND SEWER AUTHORITY<br />
Washington, D.C.<br />
<strong>Combined</strong> <strong>Sewer</strong> <strong>System</strong><br />
<strong>Long</strong> <strong>Term</strong> <strong>Control</strong> <strong>Plan</strong><br />
Table of Contents<br />
Engineering Program Management Consultant - III<br />
Program Manager - Greeley and Hansen LLC<br />
July 2002<br />
EXECUTIVE SUMMARY<br />
SECTION 1 - INTRODUCTION ....................................................................................................1-1<br />
1.1 OVERVIEW AND PURPOSE ..................................................................................1-1<br />
1.2 HISTORICAL BACKGROUND...............................................................................1-4<br />
1.2.1 Late 1800’s to 1950.......................................................................................1-4<br />
1.2.2 1950’s to 1980’s ............................................................................................1-4<br />
1.2.3 1980’s to Present ...........................................................................................1-5<br />
1.3 NATIONAL PERSPECTIVE....................................................................................1-6<br />
1.4 EPA SPECIAL PANEL.............................................................................................1-8<br />
1.5 LTCP – PLANNING APPROACH ...........................................................................1-8<br />
SECTION 2 - EXISTING CONDITIONS .....................................................................................2-1<br />
2.1 INTRODUCTION .....................................................................................................2-1<br />
2.2 WATERSHEDS.........................................................................................................2-1<br />
2.3 RAINFALL CONDITIONS ......................................................................................2-2<br />
2.4 REGULATORY REQUIREMENTS.........................................................................2-4<br />
2.4.1 <strong>DC</strong> <strong>Water</strong> Quality Standards.........................................................................2-4<br />
2.4.2 EPA <strong>Combined</strong> <strong>Sewer</strong> Overflow <strong>Control</strong> Policy ..........................................2-6<br />
2.4.3 Use Attainability Analysis...........................................................................2-11<br />
2.4.4 Total Maximum Daily Loads ......................................................................2-11<br />
2.4.5 WASA’s National Pollutant Discharge Elimination <strong>System</strong> Permit...........2-12<br />
2.4.6 District’s Storm <strong>Water</strong> MS4 Permit ............................................................2-12<br />
2.4.7 Chesapeake Bay Agreement........................................................................2-13<br />
2.5 SENSITIVE AREAS ...............................................................................................2-13<br />
2.5.1 CSO Policy Requirements...........................................................................2-13<br />
2.5.2 General Assessment.....................................................................................2-14<br />
2.5.3 <strong>Water</strong>s With Threatened or Endangered Species and Their Habitat...........2-15<br />
2.5.4 <strong>Water</strong>s With Primary Contact Recreation ...................................................2-16<br />
2.5.5 Findings .......................................................................................................2-20<br />
SECTION 3 – EXISTING SYSTEMS ............................................................................................3-1<br />
3.1 INTRODUCTION .....................................................................................................3-1<br />
3.2 COMBINED SEWER SYSTEM...............................................................................3-1
Table of Contents<br />
3.2.1 Collection <strong>System</strong>..........................................................................................3-5<br />
3.2.2 Blue Plains Wastewater Treatment <strong>Plan</strong>t ....................................................3-12<br />
3.2.3 Existing CSO <strong>Control</strong>s and Programs .........................................................3-12<br />
3.3 SEPARATE SANITARY SEWER SYSTEM.........................................................3-16<br />
3.4 SEPARATE STORM WATER SYSTEM...............................................................3-16<br />
3.4.1 Collection <strong>System</strong>........................................................................................3-16<br />
3.4.2 Existing <strong>Control</strong>s and Programs..................................................................3-18<br />
SECTION 4 – SEWER SYSTEMS CHARACTERIZATION .....................................................4-1<br />
4.1 INTRODUCTION .....................................................................................................4-1<br />
4.2 BASIC SEWER SYSTEM DATA ............................................................................4-1<br />
4.3 MONITORING PROGRAM .....................................................................................4-3<br />
4.4 EVENT MEAN CONCENTRATIONS.....................................................................4-7<br />
4.5 TOXICS MONITORING AND ANALYSIS............................................................4-9<br />
4.5.1 Priority Pollutants..........................................................................................4-9<br />
4.5.2 Metals ..........................................................................................................4-11<br />
4.6 MODELING PROGRAM .......................................................................................4-14<br />
4.6.1 <strong>Combined</strong> <strong>Sewer</strong> <strong>System</strong>.............................................................................4-14<br />
4.6.2 Separate Storm <strong>Water</strong> <strong>System</strong>.....................................................................4-20<br />
SECTION 5 – RECEIVING WATERS CHARACTERIZATION ..............................................5-1<br />
5.1 INTRODUCTION .....................................................................................................5-1<br />
5.2 MONITORING PROGRAM .....................................................................................5-1<br />
5.2.1 Baseline Bacteriological Monitoring.............................................................5-1<br />
5.2.2 Anacostia Wet Weather Surveys...................................................................5-1<br />
5.2.3 Continuous Monitoring Program – Anacostia River.....................................5-4<br />
5.2.4 Boundary Condition Monitoring ...................................................................5-4<br />
5.2.5 Sediment Oxygen Demand Study .................................................................5-5<br />
5.2.6 Quality Assurance Project <strong>Plan</strong>.....................................................................5-5<br />
5.3 EVENT MEAN CONCENTRATIONS.....................................................................5-5<br />
5.4 MODELING PROGRAM .........................................................................................5-8<br />
5.4.1 Anacostia River .............................................................................................5-8<br />
5.4.2 Potomac River .............................................................................................5-11<br />
5.4.3 Rock Creek..................................................................................................5-12<br />
SECTION 6 – POLLUTANT LOADS AND PREDICTED WATER QUALITY ......................6-1<br />
6.1 INTRODUCTION .....................................................................................................6-1<br />
6.2 CSO OVERFLOW PREDICTIONS..........................................................................6-1<br />
6.3 ANACOSTIA RIVER ...............................................................................................6-3<br />
6.3.1 Pollutant Loads to Anacostia River...............................................................6-3<br />
6.3.2 Predicted <strong>Water</strong> Quality for the Anacostia River..........................................6-4<br />
6.4 ROCK CREEK ..........................................................................................................6-6<br />
6.4.1 Pollutant Loads to Rock Creek......................................................................6-6<br />
6.4.2 Predicted <strong>Water</strong> Quality in Rock Creek ........................................................6-7<br />
6.5 POTOMAC RIVER...................................................................................................6-7<br />
6.5.1 Pollutant Loads to the Potomac River...........................................................6-7<br />
6.5.2 Predicted <strong>Water</strong> Quality ................................................................................6-9<br />
6.6 NEED FOR WATERSHED APPROACH ................................................................6-9<br />
J:\1160\LTCP\LTCP Final\toc.doc ii FINAL - July 2002
Table of Contents<br />
SECTION 7– SCREENING OF CSO CONTROL TECHNOLOGIES ......................................7-1<br />
7.1 INTRODUCTION .....................................................................................................7-1<br />
7.2 SOURCE CONTROL................................................................................................7-1<br />
7.3 INFLOW CONTROL ................................................................................................7-7<br />
7.4 SEWER SYSTEM OPTIMIZATION......................................................................7-10<br />
7.5 SEWER SEPARATION ..........................................................................................7-11<br />
7.6 STORAGE ...............................................................................................................7-13<br />
7.7 TREATMENT .........................................................................................................7-15<br />
7.8 RECEIVING WATER IMPROVEMENT...............................................................7-23<br />
7.9 SOLIDS AND FLOATABLES ...............................................................................7-24<br />
7.10 SCREENING OF CONTROL TECHNOLOGIES..................................................7-27<br />
SECTION 8 – PRELIMINARY OF CONTROL PROGRAM ALTERNATIVES ....................8-1<br />
8.1 INTRODUCTION .....................................................................................................8-1<br />
8.2 ALTERNATIVE ELEMENTS..................................................................................8-1<br />
8.2.1 <strong>System</strong> Wide Elements..................................................................................8-1<br />
8.2.2 Anacostia River Elements .............................................................................8-2<br />
8.2.3 Rock Creek Elements ....................................................................................8-7<br />
8.2.4 Potomac River Elements ...............................................................................8-8<br />
8.3 PRELIMINARY CONTROL PROGRAM ALTERNATIVES............................... 8-8<br />
8.3.1 Pump Stations Rehabilitation ........................................................................8-8<br />
8.3.2 Real Time <strong>Control</strong>..................................................................................... 8-8<br />
8.3.3 Inflow <strong>Control</strong> ............................................................................................8-11<br />
8.3.4 Low Impact Development-Retrofit ............................................................8-15<br />
8.3.5 Rooftop Greening .......................................................................................8-16<br />
8.3.6 Satellite Storage ..........................................................................................8-17<br />
8.3.7 Pump to Blue Plains and Store ....................................................................8-19<br />
8.3.8 Pump to Blue Plains and Treat ....................................................................8-21<br />
8.3.9 Local Tunnels ............................................................................................8-21<br />
8.3.10 <strong>Sewer</strong> Separation .......................................................................................8-23<br />
8.4 EVALUATION OF PRELIMINARY CONTROL PLANS....................................8-25<br />
8.4.1 Evaluation Factors.......................................................................................8-25<br />
8.4.2 Regulatory Compliance .............................................................................8-27<br />
8.4.3 Selection of Preliminary Alternatives.......................................................8-30<br />
SECTION 9 – SELECTION OF DRAFT LTCP ...........................................................................9-1<br />
9.1 INTRODUCTION .....................................................................................................9-1<br />
9.2 EVALUATION APPROACH ...................................................................................9-1<br />
9.3 LOW IMPACT REDEVELOPMENT.......................................................................9-4<br />
9.4 REAL TIME CONTROL ..........................................................................................9-6<br />
9.5 ANACOSTIA RIVER ALTERNATIVES ................................................................9-7<br />
9.5.1 Description ....................................................................................................9-7<br />
9.5.2 Remaining Overflows..................................................................................9-16<br />
9.5.3 Ability to Meet <strong>Water</strong> Quality Standards....................................................9-17<br />
9.5.4 Non-Monetary Factors.................................................................................9-24<br />
9.5.5 Cost Opinions..............................................................................................9-26<br />
9.5.6 Selection of Recommended Anacostia <strong>Control</strong> <strong>Plan</strong>...................................9-28<br />
9.6 ROCK CREEK ALTERNATIVES ........................................................................9-31<br />
J:\1160\LTCP\LTCP Final\toc.doc iii FINAL - July 2002
Table of Contents<br />
9.6.1 Sensitive Areas............................................................................................9-31<br />
9.6.2 Description ..................................................................................................9-34<br />
9.6.3 Remaining Overflows..................................................................................9-37<br />
9.6.4 Ability to Meet <strong>Water</strong> Quality Standards....................................................9-38<br />
9.6.5 Non-Monetary Factors.................................................................................9-42<br />
9.6.6 Cost Opinions..............................................................................................9-43<br />
9.6.7 Selection of Recommended Rock Creek <strong>Control</strong> <strong>Plan</strong>................................9-44<br />
9.7 POTOMAC RIVER ALTERNATIVES .................................................................9-46<br />
9.7.1 Description ..................................................................................................9-46<br />
9.7.2 Remaining Overflows..................................................................................9-48<br />
9.7.3 Ability to Meet <strong>Water</strong> Quality Standards....................................................9-49<br />
9.7.4 Non-Monetary Factors.................................................................................9-54<br />
9.7.5 Cost Opinions..............................................................................................9-55<br />
9.7.6 Selection of Recommended Potomac River <strong>Control</strong> <strong>Plan</strong>...........................9-56<br />
9.8 DESCRIPTION OF DRAFT LTCP.........................................................................9-58<br />
SECTION 10 – PUBLIC PARTICIPATION ...............................................................................10-1<br />
10.1 INTRODUCTION ...................................................................................................10-1<br />
10.2 PUBLIC INVOLVEMENT DURING DEVELOPMENT OF DRAFT LTCP .......10-1<br />
10.2.1 Public Meetings...........................................................................................10-1<br />
10.2.2 Stakeholder Advisory Panel ........................................................................10-4<br />
10.2.3 <strong>DC</strong> DOH/WASA Model Workshops ..........................................................10-7<br />
10.2.4 Public Information.......................................................................................10-8<br />
10.2.5 Publicity Received From Media..................................................................10-9<br />
10.3 RELEASE OF DRAFT LTCP...............................................................................10-10<br />
10.3.1 Distribution of Information .......................................................................10-10<br />
10.3.2 Media Publicity .........................................................................................10-11<br />
10.4 OPPORTUNITIES FOR PUBLIC COMMENT ON DRAFT LTCP....................10-12<br />
10.5 PUBLIC COMMENTS ON DRAFT LTCP ..........................................................10-14<br />
10.5.1 Number and Types of Comments..............................................................10-14<br />
10.5.2 Approach to Addressing Comments..........................................................10-15<br />
10.6 FUTURE PUBLIC PARTICIPATION..................................................................10-16<br />
SECTION 11 – SELECTION OF FINAL LTCP.........................................................................11-1<br />
11.1 INTRODUCTION ...................................................................................................11-1<br />
11.2 BASES FOR ADDITIONAL EVALUATIONS .....................................................11-1<br />
11.2.1 Design Storms .............................................................................................11-1<br />
11.2.2 Targeted Separation.....................................................................................11-5<br />
11.2.3 Outfall Consolidation ..................................................................................11-7<br />
11.2.4 Low Impact Development-Retrofit ...........................................................11-10<br />
11.2.5 Limits on Blue Plains ................................................................................11-14<br />
11.2.6 Excess Flow Treatment at Blue Plains ......................................................11-15<br />
11.2.7 Effect of B Street/New Jersey Avenue <strong>Sewer</strong>...........................................11-17<br />
11.3 DESCRIPTION OF ALTERNATIVES.................................................................11-18<br />
11.3.1 General ......................................................................................................11-18<br />
11.3.2 Based on Draft LTCP ................................................................................11-19<br />
11.3.3 Based on 1-Year 24-Hour Storm...............................................................11-21<br />
11.3.4 Based on D.C. Department of Health Proposal.........................................11-21<br />
11.3.5 Expanded <strong>Plan</strong>...........................................................................................11-21<br />
J:\1160\LTCP\LTCP Final\toc.doc iv FINAL - July 2002
Table of Contents<br />
11.3.6 Alternatives Based on Zero Overflows in the Period 1988-1990..............11-22<br />
11.3.7 Alternatives Sized for 5-Year 24-Hour Storm...........................................11-22<br />
11.4 EVALUATION OF ALTERNATIVES.................................................................11-27<br />
11.5 ABILITY TO MEET NUMERIC WATER QUALITY STANDARDS ...............11-32<br />
11.6 SELECTION OF FINAL LTCP ............................................................................11-33<br />
SECTION 12 – FINANCIAL CAPABILITY...............................................................................12-1<br />
12.1 INTRODUCTION ...................................................................................................12-1<br />
12.2 METHODOLOGY ..................................................................................................12-1<br />
12.3 RESIDENTIAL INDICATOR.................................................................................12-2<br />
12.3.1 Median Incomes ..........................................................................................12-2<br />
12.3.2 Lower Incomes ............................................................................................12-4<br />
12.4 FINANCIAL CAPABILITY INDICATORS ..........................................................12-6<br />
12.4.1 General ........................................................................................................12-6<br />
12.4.2 Bond Ratings ...............................................................................................12-6<br />
12.4.3 Summary of Financial Capability Indicators...............................................12-6<br />
12.5 COMBINED RESIDENTIAL AND FINANCIAL INDICATORS........................12-7<br />
12.6 OTHER FACTORS ...............................................................................................12-10<br />
12.6.1 Baseline Rate Impacts Facing WASA’s Rate Payers................................12-10<br />
12.6.2 Substantial Rate Increases Required to Fund LTCP .................................12-12<br />
12.6.3 True Affordability Measure – Impact on Annual Household Budgets .....12-12<br />
12.6.4 High Degree of Uncertainty in Rate Impacts Should be Considered........12-16<br />
12.6.5 Effect of Federal Funding on Rate Increases ............................................12-18<br />
SECTION 13 – RECOMMENDED CONTROL PROGRAM ...................................................13-1<br />
13.1 INTRODUCTION ...................................................................................................13-1<br />
13.2 RECOMMENDED CONTROL PROGRAM..........................................................13-1<br />
13.2.1 <strong>System</strong> Wide <strong>Control</strong>s: Low Impact Development-Retrofit .......................13-4<br />
13.2.2 Anacostia River Components......................................................................13-9<br />
13.2.3 Rock Creek Components...........................................................................13-10<br />
13.2.4 Potomac River Components......................................................................13-10<br />
13.2.5 Blue Plains Wastewater Treatment <strong>Plan</strong>t Components .............................13-11<br />
13.2.6 Permit and Land Requirements .................................................................13-12<br />
13.2.7 Expandability ............................................................................................13-13<br />
13.2.8 Other Activities Benefiting CSO <strong>Control</strong>..................................................13-14<br />
13.3 BENEFITS OF RECOMMENDED CONTROL PROGRAM..............................13-16<br />
13.3.1 CSO Overflow Reduction..........................................................................13-16<br />
13.3.2 Outfall Elimination....................................................................................13-17<br />
13.3.3 <strong>Water</strong> Quality ............................................................................................13-18<br />
13.3.4 Solids and Floatables <strong>Control</strong>....................................................................13-22<br />
13.4 COMPARISON OF FINAL LTCP TO DRAFT LTCP.........................................13-23<br />
13.5 FINANCIAL IMPACTS........................................................................................13-24<br />
13.6 SCHEDULE...........................................................................................................13-28<br />
13.7 BASES FOR LTCP DEVELOPMENT AND<br />
IMPLEMENTATION SCHEDULE .........................................................13-29<br />
13.8 CSO REDUCTION VERSUS TIME.....................................................................13-35<br />
J:\1160\LTCP\LTCP Final\toc.doc v FINAL - July 2002
Table of Contents<br />
SECTION 14 – WATER QUALITY STANDARDS REVIEW..................................................14-1<br />
14.1 INTRODUCTION ...................................................................................................14-1<br />
14.2 NATIONAL REGULATORY BACKGROUND....................................................14-1<br />
14.3 DISTRICT OF COLUMBIA WATER QUALITY STANDARDS ........................14-1<br />
14.4 SELECTED WATER QUALITY CONDITIONS ..................................................14-5<br />
14.5 CSO CONTROL- GENERAL.................................................................................14-5<br />
14.6 LTCP WET WEATHER WATER QUALITY CONDITIONS ..............................14-6<br />
14.7 WET WEATHER DISCHARGE CONDITIONS .................................................14-11<br />
SECTION 15– POST CONSTRUCTION MONITORING........................................................15-1<br />
15.1 INTRODUCTION ...................................................................................................15-1<br />
15.2 OVERVIEW OF APPROACH................................................................................15-1<br />
15.3 EXISTING DATA SOURCES................................................................................15-2<br />
15.4 PHASE I MONITORING........................................................................................15-4<br />
15.5 PHASE 2 MONITORING .......................................................................................15-5<br />
15.6 PHASE 3 MONITORING .......................................................................................15-6<br />
15.7 NPDES PERMIT CONDITIONS............................................................................15-7<br />
15.8 PUBLIC NOTIFICATION ....................................................................................15-10<br />
REFERENCES<br />
GLOSSARY<br />
LIST OF APPENDICES<br />
A List of Program Documents<br />
B Effect of CSO <strong>Control</strong>s on <strong>Water</strong> Quality- Anacostia River<br />
C Effect of CSO <strong>Control</strong>s on <strong>Water</strong> Quality- Potomac River<br />
D Effect of CSO <strong>Control</strong>s on <strong>Water</strong> Quality- Rock Creek<br />
E Bases For Cost Opinions<br />
F Responses to Comments<br />
G General Manager’s Letter to WASA Board<br />
LIST OF TABLES<br />
Table No. Title of Table Page No.<br />
2-1 District <strong>Water</strong>shed Characteristics................................................................... 2-1<br />
2-2 Annual Average Rainfall Conditions in the District........................................ 2-4<br />
2-3 Receiving <strong>Water</strong> Use Classifications ............................................................... 2-5<br />
2-4 D.C. <strong>Water</strong> Quality Standards.......................................................................... 2-5<br />
2-5 Impaired District <strong>Water</strong>s Impacted by CSOs................................................... 2-11<br />
2-6 Anacostia TMDL Load Summary.................................................................... 2-12<br />
2-7 Comparison of District <strong>Water</strong>s to Sensitive Areas Classifications.................. 2-15<br />
2-8 Sensitive Areas Assessment............................................................................. 2-20<br />
3-1 Summary of Permitted Outfalls........................................................................ 3-2<br />
3-2 Pumping Station Design Capacities................................................................. 3-12<br />
3-3 Inflatable Dam Locations................................................................................. 3-15<br />
J:\1160\LTCP\LTCP Final\Report\toc.doc vi FINAL - July 2002
Table of Contents<br />
LIST OF TABLES<br />
Table No. Title of Table Page No.<br />
4-2 CSS and SSWS Monitoring Sites..................................................................... 4-6<br />
4-3 Summary of CSS and SSWS Sampling ........................................................... 4-7<br />
4-4 Event Mean Concentrations ............................................................................. 4-9<br />
4-5 Detected Priority Pollutant Parameters............................................................ 4-10<br />
4-6 Summary of Metals Sampling.......................................................................... 4-11<br />
4-7 Summary of 97 th Percentile Daily Values for Metals at Monitored CSO and<br />
Storm <strong>Water</strong> Outfalls ....................................................................................... 4-12<br />
4-8 Results of Mixing Zone Analysis for CSO 021/ Potomac River as<br />
Compared To DOH WQS ................................................................................ 4-12<br />
4-9 BLM Calculated CMCs for Dissolved Copper ................................................ 4-13<br />
4-10 Average Annual Flows..................................................................................... 4-17<br />
4-11 Diurnal Dry Weather Flow Factors.................................................................. 4-18<br />
4-12 Wet Weather Peaking Factors for Dry Weather Flow...................................... 4-19<br />
4-13 Calibration Results........................................................................................... 4-20<br />
5-1 Parameters for Receiving <strong>Water</strong> Monitoring ................................................... 5-3<br />
5-2 Receiving <strong>Water</strong> Boundary Conditions – Event Mean Concentrations........... 5-6<br />
5-3 Event Mean Concentrations for Streams and Other Permitted Discharges ..... 5-7<br />
5-4 Monthly Dissolved Oxygen Event Mean Concentrations at Boundaries......... 5-7<br />
5-5 Flow Varying Event Mean Concentrations for the Potomac River Boundary. 5-8<br />
6-1 Annual CSO Overflow Predictions for Average Year ..................................... 6-2<br />
6-2 Annual CSO Overflow Prediction for Average Year....................................... 6-2<br />
6-3 Source of Pollutant Loads to Anacostia River Within District ........................ 6-4<br />
6-4 Source of Pollutant Loads to Rock Creek Within District............................... 6-6<br />
6-5 Source of Pollutant Loads to Potomac River Within District .......................... 6-7<br />
7-1 Assessment of CSO <strong>Control</strong> Technologies ...................................................... 7-2<br />
7-2 Comparison of Solids and Floatables <strong>Control</strong> Technologies........................... 7-27<br />
7-3 Screening of CSO <strong>Control</strong> Technologies......................................................... 7-28<br />
8-1 Existing Inflatable Dams.................................................................................. 5-9<br />
8-2 Groundwater Diversion Projects...................................................................... 8-13<br />
8-3 Orphan Storm <strong>Sewer</strong> Separation Project Summary......................................... 8-14<br />
8-4 U.S. Soldier’s and Airman’s Home Project Summary..................................... 8-15<br />
8-5 Areas Treated by LID-R................................................................................... 8-16<br />
8-6 Application Rates used for Low Impact Development – Retrofit.................... 8-16<br />
8-7 Anacostia River Tunnel Alternatives............................................................... 8-21<br />
8-8 Load Comparison: Separation vs. CSO <strong>Control</strong> .............................................. 8-25<br />
8-9 Performance of Preliminary CSO <strong>Control</strong> Alternatives................................... 8-29<br />
8-10 Comparison of Preliminary <strong>Control</strong> <strong>Plan</strong> Alternatives .................................... 8-31<br />
9-1 Anacostia River Final Alternatives .................................................................. 9-7<br />
9-2 Facility Sizing: Anacostia River Final Alternatives......................................... 9-13<br />
J:\1160\LTCP\LTCP Final\toc.doc vii FINAL - July 2002
Table of Contents<br />
LIST OF TABLES<br />
Table No. Title of Table Page No.<br />
9-3 Remaining CSO Overflows- Anacostia River (Average of 1988-1990).......... 9-16<br />
9-4 Effect of CSO <strong>Control</strong> on Fecal Coliforms in Anacostia River....................... 9-18<br />
9-5 Effect of CSO <strong>Control</strong> on E. Coli in Anacostia River ..................................... 9-20<br />
9-6 Effect of CSO <strong>Control</strong> on Dissolved Oxygen in the Anacostia River ............. 9-22<br />
9-7 CSO <strong>Control</strong> vs. Draft TMDL for Dissolved Oxygen...................................... 9-23<br />
9-8 Non-Monetary Evaluation Factors: Anacostia River Final Alternatives ......... 9-24<br />
9-9 Cost Opinion: Anacostia River Final Alternatives........................................... 9-27<br />
9-10 Predicted CSO Overflow Volume and Frequency For CSO Upstream of<br />
Amphipod at Zoo ............................................................................................. 9-33<br />
9-11 Rock Creek CSO Outfalls with Predicted Discharge During Average Year ... 9-34<br />
9-12 Facility Sizing: Rock Creek Final Alternatives................................................ 9-37<br />
9-13 Remaining CSO Overflows – Rock Creek (Average Year 1988-1990) .......... 9-38<br />
9-14 Effect of CSO <strong>Control</strong> on Fecal Coliforms in Rock Creek.............................. 9-39<br />
9-15 Effect of CSO <strong>Control</strong> on E.Coli in Rock Creek ............................................. 9-41<br />
9-16 Non-Monetary Evaluation Factors: Rock Creek River Final Alternatives ...... 9-42<br />
9-17 Cost Opinion: Rock Creek Final Alternatives ................................................. 9-43<br />
9-18 Facility Sizing: Potomac River Final Alternatives........................................... 9-48<br />
9-19 Remaining CSO Overflows – Potomac River (Average Year 1988-1990) ..... 9-48<br />
9-20 Effect of CSO <strong>Control</strong> on Fecal Coliforms in Potomac River......................... 9-50<br />
9-21 Effect of CSO <strong>Control</strong> on E.Coli in Potomac River ........................................ 9-52<br />
9-22 Effect of CSO <strong>Control</strong> on Dissolved Oxygen in the Potomac River ............... 9-53<br />
9-23 Non-Monetary Evaluation Factors: Potomac River Final Alternatives ........... 9-54<br />
9-24 Cost Opinion: Potomac River Final Alternatives............................................. 9-55<br />
9-25 CSO Overflow Reduction of Draft LTCP........................................................ 9-59<br />
9-26 Draft LTCP Elements and Estimated Costs..................................................... 9-60<br />
10-1 Summary of Public Meetings........................................................................... 10-3<br />
10-2 Stakeholder Advisory Panel Members............................................................. 10-4<br />
10-3 Summary of Stakeholder Advisory Panel Meetings ........................................ 10-5<br />
10-4 Neighborhood Meeting Summaries ................................................................. 10-12<br />
10-5 Number of Commenters................................................................................... 10-14<br />
11-1 Summary of Design Storms............................................................................ 11-2<br />
11-2 Predicted CSO Overflow Volumes for 24-Hour Design Storms ................. 11-4<br />
11-3 Evaluation of Targeted Separation Options ................................................. 11-5<br />
11-4 Outfalls Feasible for Consolidation ............................................................. 11-10<br />
11-5 Unit Costs for LID Application.................................................................... 11-12<br />
11-6 Effect of LID-R on CSO Overflow Volumes - Summary............................ 11-12<br />
11-7 Effect of LID-R on CSO Overflow Volumes - By Outfall .......................... 11-13<br />
11-8 Comparison of Alternatives to Excess Flow................................................ 11-16<br />
11-9 <strong>Water</strong> Quality Benefits of Alternatives to Excess Flow .............................. 11-17<br />
J:\1160\LTCP\LTCP Final\toc.doc viii FINAL - July 2002
Table of Contents<br />
LIST OF TABLES<br />
Table No. Title of Table Page No.<br />
11-10 Effect of Shutting off Inter-basin Transfer at B St/New Jersey Ave<br />
<strong>Combined</strong> <strong>Sewer</strong> .......................................................................................... 11-18<br />
11-11 Range of CSO Storage Volumes Required for Alternatives........................ 11-29<br />
11-12 Description of Alternatives ......................................................................... 11-26<br />
11-13 Final Alternatives Comparison (ENR=6383)............................................... 11-28<br />
11-14 Reduction in Other Loads Required to Meet Fecal Coliform Geometric<br />
Mean Standard ............................................................................................. 11-33<br />
11-15 Remaining Overflows after Implementation of Recommended Final<br />
LTCP............................................................................................................ 11-36<br />
12-1 EPA’s Financial Capability Matrix.................................................................. 12-2<br />
12-2 Projected Cost Per Household and Residential Indicator Median ................... 12-4<br />
12-3 Projected Cost Per Household and Residential Indicators Lower 24%of<br />
Household Incomes.......................................................................................... 12-5<br />
12-4 Financial Capability Indicators ........................................................................ 12-7<br />
12-5 Financial Capability Matrix Overall Score ...................................................... 12-8<br />
12-6 Summary of CSO <strong>Control</strong> Cost Impacts on Residential Consumers............... 12-9<br />
12-7 Summary of Rate Impacts of the CSO LTCP on 100 CCF Residential<br />
Customer ......................................................................................................... 12-12<br />
13-1 Recommended <strong>Control</strong> Program Elements and Estimated Costs.................... 13-1<br />
13-2 LID-R Measures in LTCP – By WASA........................................................... 13-7<br />
13-3 Recommendations for Institutional Change to Foster LID-R .......................... 13-7<br />
13-4 Preliminary Assessment of Significant Land and Permitting Requirements ... 13-12<br />
13-5 CSO Overflow Reduction of Recommended CSO <strong>Plan</strong> .................................. 13-17<br />
13-6 Outfall Elimination by Consolidation and Separation ..................................... 13-18<br />
13-7 CCOs Will Meet Bacteria Geometric Mean Standard .................................... 13-19<br />
13-8 LTCP Meets Anacostia River TMDLs............................................................. 13-22<br />
13-9 Comparison of Final and Draft LTCPs ........................................................... 13-23<br />
13-10 Rate Impacts of the CSO LTCP on 100 CCF Residential Customer............... 13-25<br />
13-11 Cost Impacts on Residential Customers (Year 2001 Dollars) ......................... 13-27<br />
14-1 Evaluation Criteria for CSO Discharges.......................................................... 14-5<br />
14-2 Predicted Conditions for Average Year in Receiving <strong>Water</strong>s.......................... 14-6<br />
14-3 LTCP Wet Weather <strong>Water</strong> Quality Conditions................................................ 14-6<br />
14-4 Predicted Average Year LTCP Performance ................................................... 14-8<br />
14-5 Predictions for 51-Year Period of Record (1948-1998)................................... 14-9<br />
15-1 Phase 1 Monitoring .......................................................................................... 15-4<br />
15-2 Phase 2 Monitoring .......................................................................................... 15-5<br />
15-3 Phase 3 Monitoring .......................................................................................... 15-7<br />
15-4 Minimum Diversion Capacities to Storage for Recommended LTCP............. 15-8<br />
J:\1160\LTCP\LTCP Final\toc.doc ix FINAL - July 2002
Table of Contents<br />
LIST OF FIGURES<br />
Figure No. Title of Figure Page No.<br />
1-1 <strong>Combined</strong> <strong>Sewer</strong> Area................................................................................... 1-2<br />
1-2 <strong>Combined</strong> <strong>Sewer</strong> <strong>System</strong>/Separate <strong>Sewer</strong> <strong>System</strong> ........................................ 1-3<br />
1-3 <strong>Combined</strong> <strong>Sewer</strong> <strong>System</strong> Milestones ............................................................ 1-7<br />
2-1 Potomac, Anacostia and Rock Creek <strong>Water</strong>sheds......................................... 2-3<br />
2-2 Locations of Hay’s Spring Amphipod ........................................................... 2-22<br />
3-1 CSO Outfalls and CSS Drainage Areas......................................................... 3-6<br />
3-2 Anacostia CSO Outfalls and CSS Drainage Areas........................................ 3-7<br />
3-3 Potomac and Rock Creek CSO Outfalls and CSS Drainage Areas............... 3-8<br />
3-4 <strong>Sewer</strong> <strong>System</strong> Schematic............................................................................... 3-9<br />
3-5 Federal Properties .......................................................................................... 3-10<br />
3-6 Process Schematic Blue Plain Wastewater Treatment <strong>Plan</strong>.......................... 3-13<br />
3-7 District’s Separate Stormwater Area ............................................................ 3-17<br />
4-1 CSS and SSWS Monitoring Locations .......................................................... 4-4<br />
4-2 Total Monitored CSO Overflow Volume...................................................... 4-5<br />
5-1 Receiving <strong>Water</strong> Monitoring Locations ........................................................ 5-2<br />
5-2 Receiving <strong>Water</strong>s Model Segmentation ........................................................ 5-10<br />
6-1 Sources of CBOD5 to Anacostia River ......................................................... 6-4<br />
6-2 Sources of Fecal Coliform to Anacostia River.............................................. 6-4<br />
6-3 Anacostia River Predicted <strong>Water</strong> Quality...................................................... 6-5<br />
6-4 Sources of Fecal Coliform to Rock Creek..................................................... 6-6<br />
6-5 Rock Creek Predicted <strong>Water</strong> Quality ............................................................ 6-8<br />
6-6 Sources of CBOD5 to Potomac River ........................................................... 6-9<br />
6-7 Sources of Fecal Coliform to Potomac River................................................ 6-9<br />
6-8 Potomac River Predicted <strong>Water</strong> Quality........................................................ 6-10<br />
7-1 Typical Inflatable Dam.................................................................................. 7-11<br />
7-2 <strong>Sewer</strong> Separation Alternatives....................................................................... 7-12<br />
7-3 Storage Tunnel Schematic............................................................................. 7-15<br />
7-4 IDI DensaDeg HRPCT .................................................................................. 7-19<br />
7-5 U.S. Filter Actiflo HRPCT ............................................................................ 7-20<br />
7-6 Sidestream Aeration Facility ......................................................................... 7-23<br />
8-1 <strong>Sewer</strong> Profile-Existing Capitol Hill Relief <strong>Sewer</strong>......................................... 8-3<br />
8-2 <strong>Sewer</strong> Profile-Existing Anacostia River Force Main and Gravity <strong>Sewer</strong> ..... 8-5<br />
8-3 Preliminary Alternative: Real Time <strong>Control</strong> (D4)......................................... 8-10<br />
8-4 Preliminary Alternative: Inflow <strong>Control</strong> (D10)............................................. 8-12<br />
8-5 Preliminary Alternative: Satellite Storage (D7) ............................................ 8-18<br />
8-6 Preliminary Alternative: Pump and Store (D8) ............................................. 8-20<br />
8-7 Preliminary Alternative: Pump and Treat (D9) ............................................. 8-22<br />
8-8 Number of Events and Overflow Volumes Per Year .................................... 8-28<br />
9-1 Anacostia Final <strong>Control</strong> Alternatives: Tunnel From Popular Point to 9-8<br />
J:\1160\LTCP\LTCP Final\toc.doc x FINAL - July 2002
Table of Contents<br />
LIST OF FIGURES<br />
Figure No. Title of Figure Page No.<br />
Northeast Boundary.......................................................................................<br />
9-2 Anacostia Final <strong>Control</strong> Alternatives: Tunnel From Blue Plains WWTP<br />
to Northeast Boundary................................................................................... 9-11<br />
9-3 Anacostia River: Cost Benefit Analysis ........................................................ 9-30<br />
9-4 Locations of Hay’s Spring Amphipod ........................................................... 9-33<br />
9-5 Rock Creek Final <strong>Control</strong> Alternatives A-1 and B-1 .................................... 9-36<br />
9-6 Rock Creek: Cost Benefit Analysis ............................................................... 9-45<br />
9-7 Potomac River Final <strong>Control</strong> Alternative: Storage Tunnel ........................... 9-47<br />
9-8 Potomac River: Cost Benefit Analysis .......................................................... 9-57<br />
9-9 Draft <strong>Long</strong> <strong>Term</strong> <strong>Control</strong> <strong>Plan</strong> ...................................................................... 9-62<br />
10-1 Origins of Form Letter Comments................................................................. 10-14<br />
11-1 Rain Volume for 24 Hour Storms.................................................................. 11-3<br />
11-2 Maximum Hourly Intensity for 24 Hour Storms ........................................... 11-3<br />
11-3 Targeted Separation CSO Areas.................................................................... 11-8<br />
11-4 Outfalls for Consolidation ............................................................................. 11-9<br />
11-5 Alternatives Based on Draft LTCP, 1-Year 24-Hour Storm and DOH<br />
<strong>Plan</strong> ................................................................................................................ 11-23<br />
11-6 Alternatives Based on Expanded <strong>Plan</strong>........................................................... 11-24<br />
11-7 Alternatives Based on Zero Overflows in 3 Years and 5-Year 24-Hour<br />
Storm.............................................................................................................. 11-25<br />
11-8 Cost Effectiveness of Alternatives Based on CSO Volume Reduction......... 11-34<br />
11-9 Cost Effectiveness of Alternatives Based on Bacteria Reduction................. 11-35<br />
12-1 EPA’s Residential and Financial Capability Indicators ................................ 12-2<br />
12-2 District of Columbia Income Distribution – 2000......................................... 12-5<br />
12-3 Impact of CSO <strong>Control</strong>s on Cost Per Household .......................................... 12-9<br />
12-4 Annual Rate Increases Required for 15 and 20-Year LTCP <strong>Plan</strong>s................ 12-14<br />
12-5 Annual Increase in Revenue Requirement for 15-Year LTCP and<br />
Baseline Needs .............................................................................................. 12-15<br />
12-6 Annual Rate Increases Required for 30 and 40-Year LTCP <strong>Plan</strong>s................ 12-15<br />
12-7 Annual Increases in Revenue Requirements for 40-Year Program............... 12-16<br />
12-8 Rate Increases for 15-Year LTCP <strong>Plan</strong> with External Assistance Targeted<br />
at Reducing Peak Impacts.............................................................................. 12-18<br />
13-1 Recommended <strong>Control</strong> Program ................................................................... 13-3<br />
13-2 Number of Days Fecal Coliforms Exceeding 200/100ml.............................. 13-19<br />
Number of Days Per Year Dissolved Oxygen is Less Than Indicated<br />
13-3 Value at South Capitol Street in Anacostia River ......................................... 13-21<br />
13-4 Annual Rate increases Required for 15 and 20-Year LTCP <strong>Plan</strong>s................ 13-26<br />
13-5 Annual Rate increases Required for 30 and 40-Year LTCP <strong>Plan</strong>s................ 13-26<br />
13-6 Implementation Schedule for Projects in Capital Improvement Program..... 13-30<br />
J:\1160\LTCP\LTCP Final\toc.doc xi FINAL - July 2002
Table of Contents<br />
LIST OF FIGURES<br />
Figure No. Title of Figure Page No.<br />
13-7 40-Year Implementation Schedule for Projects Not in Capital<br />
Improvement Program .................................................................................. 13-31<br />
13-8 15-Year Implementation Schedule for Projects Not in Capital<br />
Improvement Program ................................................................................... 13-33<br />
13-9 CSO Reduction Versus Time ........................................................................ 13-36<br />
15-1 LTCP Monitoring Approach.......................................................................... 15-10<br />
J:\1160\LTCP\LTCP Final\toc.doc xii FINAL - July 2002
Executive Summary<br />
Executive Summary<br />
1. PURPOSE<br />
The District of Columbia <strong>Water</strong> and <strong>Sewer</strong> Authority (WASA or Authority) has prepared this report<br />
to describe the development and selection of the plan for controlling combined sewer overflows<br />
(CSOs) in the District of Columbia. The plan for controlling CSOs is called a <strong>Long</strong> <strong>Term</strong> <strong>Control</strong><br />
<strong>Plan</strong> or LTCP.<br />
In June 2001, WASA submitted a Draft LTCP to regulatory agencies and the public for review and<br />
comment. An extensive public outreach and comment period followed in the summer and autumn<br />
of 2001. This report presents the proposed Final LTCP. It has been developed taking into<br />
consideration regulatory agency comments, public comments, and additional water quality standard<br />
and total maximum daily load (TMDL) requirements.<br />
2. BACKGROUND<br />
Like many older cities in the United States, the sewer system in the District is comprised of both<br />
combined sewers and separate sanitary sewers. A combined sewer carries both sewage and runoff<br />
from storms. Modern practice is to build separate sewers for sewage and storm water, and no new<br />
combined sewers have been built in the District since the early 1900's. Approximately one-third of<br />
the District (12,478 acres) is served by combined sewers. The majority of the area served by<br />
combined sewers is in the older developed sections of the District. The combined sewer area is<br />
shown on Figure ES-1.<br />
In the combined sewer system, sewage from homes and businesses during dry weather conditions is<br />
conveyed to the District of Columbia Wastewater Treatment <strong>Plan</strong>t at Blue Plains, which is located in<br />
the southwestern part of the District on the east bank of the Potomac River. There, the wastewater is<br />
treated to remove pollutants before being discharged to the Potomac River. When the capacity of a<br />
combined sewer is exceeded during storms, the excess flow, which is a mixture of sewage and storm<br />
water runoff, is discharged to the Anacostia and Potomac Rivers, Rock Creek and tributary waters.<br />
The excess flow is called <strong>Combined</strong> <strong>Sewer</strong> Overflow (CSO). There are a total of 60 CSO outfalls in<br />
the combined sewer system listed in the National Pollutant Discharge Elimination <strong>System</strong> (NPDES)<br />
Permit issued by the Environmental Protection Agency (EPA) to WASA.<br />
Discharges of CSOs can adversely impact the quality of the receiving waters. The primary purpose<br />
of the LTCP is to control CSOs such that water quality standards are met. In the District of<br />
Columbia water quality standards, the designated use of the Anacostia River, Potomac River and<br />
Rock Creek is Class A or suitable for primary contact recreation. Because the water quality in the<br />
receiving waters currently does not meet these standards much of the time, the actual use of the water<br />
body is Class B or suitable for secondary contact recreation and aquatic enjoyment. In recognition of<br />
\\Gh-wash\ENG 1160\LTCP\LTCP Final\exec sum.doc ES-1 FINAL - July 2002
Executive Summary<br />
this condition, District law prohibits primary contact recreation such as swimming in each of the<br />
receiving waters.<br />
Information collected to develop the LTCP demonstrates that water quality is affected by many<br />
sources other than CSOs, including storm water, upstream sources outside of the District, and in the<br />
Anacostia River by the sediments in the bottom of the river. While the LTCP is only required to<br />
address CSOs, WASA has considered these other sources to identify the impact of CSOs as<br />
compared to other sources of pollution. This will assist in developing a watershed-based approach to<br />
improving water quality beyond the CSO control described in the LTCP.<br />
3. EXISTING CONDITIONS<br />
In order to assess the impact of CSO control on receiving water quality, computer models of the<br />
combined sewer system, separate storm water system and of Rock Creek were developed. In<br />
addition, existing computer models of the Anacostia River and the Potomac River were adapted for<br />
use in the study. The computer models were calibrated based on historical data and on 9 to 12<br />
months of monitoring data collected in the receiving waters, the combined sewer system, CSOs and<br />
in the separate storm water system.<br />
In accordance with EPA guidelines, CSO planning was based on “average year” conditions. The<br />
rainfall in the period 1988-1990 was selected as representative of average conditions based on review<br />
of 50 years of rainfall data at Ronald Reagan National Airport. The representative three-year period<br />
contains a relatively wet year, a dry year and an average year. Average year conditions are defined<br />
as the arithmetic average of the predictions for years 1988, 1989 and 1990. In the process of<br />
developing the Final LTCP, other rainfall conditions such as the 1-year and 5-year design storms<br />
were also investigated.<br />
Using the combined sewer system model, CSO overflow volumes and frequencies were predicted for<br />
existing conditions in the average year. The predicted CSO overflow volumes for the average year<br />
conditions are shown on Table ES-1.<br />
Table ES-1<br />
Existing Conditions: Annual CSO Overflow Predictions for Average Year<br />
Item<br />
CSO Overflow Volume (million gallons/yr)<br />
No Phase I <strong>Control</strong>s (prior to 1991)<br />
With Phase I <strong>Control</strong>s (after 1991)<br />
Number of Overflows/yr<br />
No Phase I <strong>Control</strong>s (prior to 1991)<br />
With Phase I <strong>Control</strong>s (after 1991)<br />
Anacostia<br />
River<br />
2,142<br />
1,485<br />
82<br />
75<br />
Potomac<br />
River<br />
1,063<br />
953<br />
74<br />
74<br />
Rock<br />
Creek<br />
49<br />
52<br />
30<br />
30<br />
Total <strong>System</strong><br />
3,254<br />
2,490<br />
-<br />
-<br />
\\Gh-wash\ENG 1160\LTCP\LTCP Final\exec sum.doc ES-3 FINAL - July 2002
Executive Summary<br />
The Phase I CSO controls consist of in-system storage devices called inflatable dams and a CSO<br />
treatment system called the Northeast Boundary Swirl Facility. These controls were completed in<br />
1991. As of the writing of this report, certain inflatable dams are not functional and are in the<br />
process of being replaced.<br />
Using the predicted pollutant loads from the combined sewer system, separate storm water system<br />
and the upstream boundary, the water quality in each receiving water was predicted for average year<br />
conditions. The following summarizes the characteristics of each receiving water:<br />
Anacostia River - The Anacostia River is a relatively stagnant water body with a long residence time<br />
that is significantly affected by the tide. Both dissolved oxygen and bacteria concentrations are<br />
problems. Low dissolved oxygen levels typically occur in the summer months of June to August<br />
and typically follow a significant local or upstream wet weather event. The low dissolved oxygen is<br />
driven by the naturally low saturation level of oxygen in the water due to the high water temperature<br />
and the influx of pollutant loads from wet weather events. The sluggish nature of the river does not<br />
allow effective re-aeration, contributing to the low dissolved oxygen. In addition to direct loads of<br />
oxygen consuming pollutants from CSO, storm water, and the upstream boundary, the sediments in<br />
the Anacostia River are known to exert a substantial oxygen demand. Dissolved oxygen levels<br />
below 2.0 mg/L can occur several times per summer month, with each episode lasting 1 to 2 days.<br />
Fish kills have been observed in the past under these conditions. Bacteria concentrations (fecal<br />
coliform) are relatively high and are predicted to exceed the Class A monthly standard for the<br />
majority of the average year. In addition to CSO, bacterial pollution from storm water and the<br />
upstream boundary are significant.<br />
Rock Creek - Rock Creek is a free-flowing stream that is unaffected by the tide for the majority of its<br />
length. The stream is naturally aerated by turbulence as it flows over the irregular bottom of the<br />
creek bed. There is no evidence of low dissolved oxygen problems in Rock Creek and<br />
bacteriological concentrations are the primary concern. Bacteria (fecal coliform) concentrations in<br />
Rock Creek are predicted to be above the Class A monthly standard every month in the average year<br />
under existing conditions. The majority of the load comes from storm water and upstream sources.<br />
The volume of water in Rock Creek in any particular reach is relatively small. As a result, it is not<br />
able to absorb significant wet weather loads without causing relatively high bacteria concentrations<br />
in the creek. The free-flowing nature of the creek causes relatively short residence time of wet<br />
weather pollution.<br />
Potomac River - The water quality of the Potomac River is much better than that in the Anacostia<br />
River or Rock Creek. This is due both to the low pollutant loads and the size and assimilative<br />
capacity of the river. In the upstream reaches of the river from the Memorial Bridge to Georgetown,<br />
the Class A bacteria standard is only predicted to be exceeded one month out of the year by a<br />
\\Gh-wash\ENG 1160\LTCP\LTCP Final\exec sum.doc ES-4 FINAL - July 2002
Executive Summary<br />
relatively small amount. Downstream of the Memorial Bridge, no exceedances are predicted on a<br />
monthly basis. Low oxygen is not a significant problem in the Potomac River.<br />
4. ALTERNATIVES EVALUATION<br />
A wide range of technologies was considered to control CSOs. The technologies are grouped into<br />
the following general categories:<br />
<br />
<br />
<br />
<br />
<br />
<br />
<br />
Source <strong>Control</strong>s– such as public education, a higher level of street sweeping, additional<br />
construction site controls, more frequent catch basin cleaning, garbage disposal bans and<br />
combined sewer flushing;<br />
Inflow <strong>Control</strong>s – such as Low Impact Development-Retrofit, rooftop greening, storm water<br />
treatment, street storage of storm water, rain leader disconnections, extending storm sewers<br />
to receiving waters;<br />
<strong>Sewer</strong> <strong>System</strong> Optimization - such as real time control, storing combined sewage in existing<br />
sewers, revision to facility operations;<br />
<strong>Sewer</strong> Separation – such as partial or complete separation;<br />
Storage Technologies – such as retention basins and tunnels;<br />
Treatment Technologies - such as screening, sedimentation, high rate physical chemical<br />
treatment, swirl concentrators and disinfection;<br />
Receiving <strong>Water</strong> Improvement – such as aeration and flow augmentation<br />
Each technology was evaluated for its ability to reduce CSO volume and the pollutants in CSO.<br />
After the initial screening, groups of technologies were assembled into control plans for each<br />
receiving water. The alternatives were evaluated against the following criteria:<br />
<br />
<br />
<br />
<br />
<br />
Regulatory Compliance – Ability to meet the EPA CSO Policy which is now part of the<br />
Clean <strong>Water</strong> Act, D.C. <strong>Water</strong> Quality Standards, WASA’s National Pollutant Discharge<br />
Elimination <strong>System</strong> (NPDES) Permit and the total maximum daily load (TMDL) allocations<br />
for the Anacostia River for dissolved oxygen (biochemical oxygen demand or BOD) and<br />
water clarity (total suspended solids or TSS).<br />
Cost effectiveness – Ability to achieve the greatest benefit at the lowest reasonable cost.<br />
Northeast Boundary Flooding – Ability to relieve street flooding and basement sewer backups<br />
from the combined sewer system in the Northeast Boundary area.<br />
Non-monetary factors – Implementability, operational complexity, ability to upgrade and<br />
other non-monetary factors.<br />
Public Acceptance – Responsiveness to public comments.<br />
\\Gh-wash\ENG 1160\LTCP\LTCP Final\exec sum.doc ES-5 FINAL - July 2002
Executive Summary<br />
In accordance with EPA guidelines, each alternative was configured and evaluated to reduce CSO<br />
overflows to between zero and 12 events per average year. Note that control plans which achieve<br />
zero overflows for all storms in the 1988-1990 analysis period would not eliminate overflows under<br />
all conditions. Rainfall conditions more severe than those represented in the three-year analysis<br />
period will occur and can cause CSO events. For that reason, complete sewer separation that would<br />
achieve zero CSO overflows under all conditions was also evaluated. In response to public<br />
comments, control plans were also developed for various return frequency design storms such as the<br />
1-year, 2-year and 5-year storms. Costs, CSO overflow volume reductions, and benefits to receiving<br />
waters were evaluated for each level of CSO control.<br />
5. PUBLIC PARTICIPATION<br />
WASA conducted an extensive public participation program designed to educate the affected public<br />
and to obtain their input and consultation in selecting the long term CSO controls. The public<br />
participation process included public meetings, establishment of a Stakeholder Advisory Panel, and<br />
an elaborate public information process. Four public meetings have been held to educate the public<br />
and to obtain feedback about CSO issues. At the request of the public during the first public<br />
meeting, a Stakeholder Advisory Panel was formed. The panel consisted of representatives from<br />
government agencies, regulatory agencies, citizens’ groups, and environmental advocacy groups that<br />
are concerned about water quality issues within the District. Twelve Panel meetings were held<br />
during development of the LTCP.<br />
In addition, the public outreach program included educational mailers in water and sewer bills,<br />
establishment of a CSO website, creation of a CSO mailing list, informational CSO newsletters, and<br />
establishment of public information depositories.<br />
After release of the Draft LTCP, nine neighborhood meeting were held throughout the District to<br />
explain the program and obtain public comments. The D.C. Council and WASA held public<br />
hearings on the plan. Informational mailers, WASA’s website and presentations to interested groups<br />
were also used to obtain input on plan. The Draft LTCP was well publicized and members of the<br />
public provided thoughtful comments. Over 2,300 comments were received on the Draft LTCP.<br />
6. RECOMMENDED PLAN<br />
WASA is committed to improving the quality of the Anacostia River, Rock Creek, and the Potomac<br />
River. The recommended LTCP has been selected to provide a significant improvement in the<br />
quality of each receiving water while balancing the affordability to ratepayers. The recommended<br />
LTCP consists of many elements and program components. Table ES-2 lists the components by<br />
receiving water. Figure ES-2 shows the location of the principal elements.<br />
\\Gh-wash\ENG 1160\LTCP\LTCP Final\exec sum.doc ES-6 FINAL - July 2002
Executive Summary<br />
Table ES-2<br />
Recommended <strong>Control</strong> Program Elements and Estimated Costs<br />
<strong>System</strong> Wide<br />
Component<br />
Low Impact Development – Retrofit (LID-R)– Advocate implementation of LID-R<br />
throughout entire District. Provide technical and regulatory assistance to District<br />
Government. Implement LID-R projects on WASA facilities where feasible.<br />
Anacostia River<br />
Rehabilitate Pumping Stations – Rehabilitate existing pumping stations as follows:<br />
Interim improvements at Main and ‘O’ Street Pumping Stations necessary<br />
for reliable operation until rehabilitation of stations is performed.<br />
Rehabilitate Main Pumping Station to 240 mgd firm sanitary capacity.<br />
Screening facilities for firm sanitary pumping capacity only.<br />
Rehabilitate Eastside and ‘O’ Street Pumping stations to 45 mgd firm<br />
sanitary capacity<br />
Interim improvements at existing Poplar Point Pumping Station necessary<br />
for reliable operation until replacement pumping station is constructed as<br />
part of storage tunnel<br />
Storage Tunnel from Poplar Point to Northeast Boundary Outfall – 49 million gallon<br />
storage tunnel between Poplar Point and Northeast Boundary. Tunnel will intercept<br />
CSOs 009 through 019 on the west side of the Anacostia. Project includes new tunnel<br />
dewatering pump station and low lift pumping station at Poplar Point.<br />
Storage/Conveyance Tunnel Parallel to Northeast Boundary <strong>Sewer</strong> – 77 million gallon<br />
storage/conveyance tunnel parallel to the Northeast Boundary <strong>Sewer</strong>. Also includes<br />
side tunnels from main tunnel along West Virginia and Mt. Olivet Avenues, NE and<br />
Rhode Island and 4 th St NE to relieve flooding. Abandon Northeast Boundary Swirl<br />
Facility upon completion of main tunnel.<br />
Outfall Consolidation – Consolidate the following CSOs in the Anacostia Marina area:<br />
CSO 016, 017 and 018<br />
Capital Cost<br />
Opinion<br />
(Millions,<br />
ENR=6383)<br />
Annual Operation<br />
and Maintenance<br />
(Millions,<br />
ENR=6383)<br />
$3 $0.11<br />
$115 $0 1<br />
$332<br />
$452<br />
$7.98<br />
$27 $0 1<br />
Separate CSO 006 – Separate this CSO in the Fort Stanton Drainage Area $3 $0.01<br />
Ft Stanton Interceptor – Pipeline from Fort Stanton to Poplar Point to convey CSO<br />
005, 006 and 007 on the east side of the Anacostia to the storage tunnel.<br />
Rock Creek<br />
$11 $0.04<br />
Anacostia Subtotal $940 $8.03<br />
Separate Luzon Valley – Completed in 2002. Completed $0<br />
Separation – Separate CSOs 031, 037, 053, and 058. $5 $0.02<br />
Monitoring at CSO 033, 036, 047 and 057 – Conduct monitoring to confirm prediction<br />
of overflows. If overflows confirmed, then perform the following:<br />
<br />
<br />
Regulator Improvements: Improve regulators for CSO 033, 036, 047 and<br />
057<br />
Connection to Potomac Storage Tunnel: Relieve Rock Creek Main<br />
Interceptor to proposed Potomac Storage Tunnel when it is constructed<br />
$3 $0.01<br />
\\Gh-wash\ENG 1160\LTCP\LTCP Final\exec sum.doc ES-7 FINAL - July 2002
Executive Summary<br />
Component<br />
Capital Cost<br />
Opinion<br />
(Millions,<br />
ENR=6383)<br />
Annual Operation<br />
and Maintenance<br />
(Millions,<br />
ENR=6383)<br />
Storage Tunnel for Piney Branch (CSO 049) – 9.5 million gallon storage tunnel $42 $0.60<br />
Potomac River<br />
Rehabilitate Potomac Pumping Station – Rehabilitate station to firm 460 mgd pumping<br />
capacity<br />
Outfall Consolidation – Consolidate CSOs 023 through 028 in the Georgetown<br />
<strong>Water</strong>front Area.<br />
Potomac Storage Tunnel – 58 million gallon storage tunnel from Georgetown to<br />
Potomac Pumping Station. Includes tunnel dewatering pumping station.<br />
Blue Plains Wastewater Treatment <strong>Plan</strong>t<br />
Excess Flow Treatment Improvements – Four new primary clarifiers, improvements to<br />
excess flow treatment control and operations<br />
Notes:<br />
1. No significant change from existing.<br />
Rock Creek Subtotal $50 $0.63<br />
$12 $0 1<br />
$20 $0 1<br />
$218 $2.78<br />
Potomac River Subtotal $250 $2.78<br />
$22 $1.81<br />
Grand Total $1,265 $13.36<br />
The principal components of the control program are described below, while detailed<br />
recommendations are included in Section 13 of this report.<br />
<strong>System</strong> Wide <strong>Control</strong>s - WASA recommends the implementation of Low Impact Development<br />
Retrofit (LID-R) in the District. In addition to reducing CSOs, LID-R also has ancillary benefits<br />
such as reducing storm water volume and pollutant concentrations, reducing cooling costs and<br />
increasing aesthetic value. Reduction of storm water pollution is a part of the District’s storm water<br />
management efforts as part of its Municipal Separate Storm <strong>Sewer</strong> (MS4) Permit. Since WASA does<br />
not control development or redevelopment in the District, WASA cannot mandate application of<br />
LID-R. WASA will, however, incorporate LID-R techniques into new construction or reconstruction<br />
on WASA facilities where applicable, and will act as an advocate for LID-R in the District. In<br />
addition, WASA recommends that the District Government develop and adopt the necessary laws<br />
and regulations to enable implementation of LID-R. Detailed recommendations are included in<br />
Section 13 of this report.<br />
In addition to these, WASA looks forward to participating in a partnership with others to investigate<br />
the feasibility of apply LID-R in an urban setting. Possible goals of the partnership would be to<br />
demonstrate and evaluate LID-R effectiveness on a sewershed basis, establish design, construction<br />
and performance standards, assess costs, and determine practicality. Given the Federal<br />
Government’s role in the District and its interest is identifying techniques that could be applied<br />
elsewhere, a significant Federal participation in such a partnership would be appropriate.<br />
\\Gh-wash\ENG 1160\LTCP\LTCP Final\exec sum.doc ES-8 FINAL - July 2002
Executive Summary<br />
WASA would also be willing to participate in a watershed forum or planning group, with a Federal<br />
presence, to address pollution in the watershed. The LTCP has identified that storm water is one of<br />
the major pollution sources for all of the urban watersheds. Storm water pollution is a common<br />
concern of the District, Virginia and Maryland. This could serve as a catalyst to create the forum and<br />
to strive for solutions.<br />
Anacostia River Components - The control measures selected for the Anacostia River are predicted<br />
to limit overflows to two events per average year. During the three year analysis period (1988-1990),<br />
the frequency of overflow ranged from one per year to three per year for dry and wet years,<br />
respectively. The controls were selected to make maximum use of existing facilities and to provide<br />
supplemental storage via a tunnel to control overflows. Major elements of the controls include the<br />
rehabilitation of Main, ‘O’ Street, and Eastside pumping stations, separation of a CSO on the east<br />
side of the Anacostia River, construction of a storage/conveyance tunnel from Poplar Point to<br />
Northeast Boundary and construction of a pipeline from Fort Stanton to Poplar Point to address the<br />
remaining CSOs on the east side of the Anacostia. An additional leg of the tunnel will be constructed<br />
parallel to the Northeast Boundary <strong>Sewer</strong> and to several low lying areas to provide additional storage<br />
for CSO and to relieve street and basement flooding in the Northeast Boundary area. The existing<br />
Poplar Point Pumping Station will be replaced by a new facility located at the end of the tunnel that<br />
both dewaters the tunnel and replaces the function of the existing pumping station. In addition three<br />
CSOs on the west side of the River near the marinas will be consolidated to eliminate their impacts to<br />
this area of the River. One CSO on the east side of the river will be eliminated by separation. Once<br />
the tunnel is operational, the Northeast Boundary Swirl Facility will be abandoned.<br />
Rock Creek Components - The control measures selected for Rock Creek are predicted to limit<br />
Piney Branch overflows to one per average year. At Piney Branch, the frequency of overflow ranged<br />
from zero per year to two per year for dry and wet years, respectively, during the three-year analysis<br />
period. The remaining overflows in Rock Creek will be controlled to 4 events per average year. For<br />
these overflows, the frequency of overflow ranged from one per year to six per year for dry and wet<br />
years, respectively, during the three year analysis period. The principal control measures include<br />
separation of four CSOs, construction of a storage tunnel at Piney Branch, and monitoring and<br />
regulator improvements to four CSOs south of Piney Branch.<br />
Potomac River Components - The control measures selected for the Potomac River are predicted to<br />
limit overflows to four events per average year. During the three year analysis period, the frequency<br />
of overflow ranged from zero per year to five per year for dry and wet years, respectively. The<br />
principal control measures include rehabilitation of the Potomac Pumping Station and construction of<br />
a storage tunnel from west of the Key Bridge, along the Potomac River waterfront parallel to<br />
Georgetown, and terminating at Potomac Pumping Station. The tunnel will intercept the Georgetown<br />
CSOs and the large CSOs downstream of Rock Creek. A new pumping station would be constructed<br />
\\Gh-wash\ENG 1160\LTCP\LTCP Final\exec sum.doc ES-10 FINAL - July 2002
Executive Summary<br />
at Potomac Pump Station to dewater the tunnel. In addition, the LTCP will consolidate and close all<br />
CSOs between the Key Bridge and Rock Creek to remove the impact of these CSOs from the<br />
Georgetown waterfront area.<br />
Blue Plains Wastewater Treatment <strong>Plan</strong>t (BPWWTP) Components – BPWWTP has an existing<br />
excess flow treatment system designed to provide screening, grit removal, primary treatment, and<br />
disinfection to storm flows up to 336 mgd. Improvements to the excess flow treatment train are<br />
recommended to improve performance and reliability. These improvements consist of the addition<br />
of four new clarifiers and appurtenant weir and control system improvements. In addition, the<br />
BPWWTP conducts voluntary denitrification in accordance with the Chesapeake Bay Agreement.<br />
The plant uses the existing nitrification reactors to conduct both nitrification and denitrification.<br />
Nitrification capacity was reduced to the first four stages of the reactor, to accommodate<br />
denitrification in the last stage. This approach to denitrification utilizes one facility for two<br />
processes. There are difficulties in conducting denitrification under all conditions of flow, load and<br />
temperature. This was shown to be the case when implementation of nitrogen removal was<br />
negotiated with regulatory agencies. Experience with the full scale facility has shown that the<br />
denitrification process produces poorly settling solids which contribute to solids washouts and<br />
blinding of the effluent filters at high flow rates. This is due to attempting to treat high flows during<br />
storm events simultaneously with nitrification-denitrification using the same tankage, particularly<br />
during cold weather. Based on this experience, it appears that BPWWTP will not be able to reliably<br />
denitrify under high flow conditions. Because the Chesapeake Bay Program is considering revised<br />
nitrogen limits for the Bay, future NPDES permits may require nitrogen removal at Blue Plains to an<br />
effluent concentration as low as 3 mg/L. Chesapeake Bay Program Goals may thus dictate nitrogen<br />
removal requirements at the plant, and further measures should be based on the final outcome of the<br />
Bay Program. No costs for additional nitrogen removal are included in the LTCP.<br />
The selected CSO control program is expected to greatly reduce the frequency and volume of CSO<br />
overflows. Table ES-3 illustrates the reduction in overflows.<br />
\\Gh-wash\ENG 1160\LTCP\LTCP Final\exec sum.doc ES-11 FINAL - July 2002
Executive Summary<br />
Table ES-3<br />
CSO Overflow Reduction of Recommended CSO <strong>Plan</strong> (Average Year)<br />
Item<br />
Anacostia<br />
River<br />
Potomac<br />
River<br />
CSO Overflow Volume (mg/yr)<br />
No Phase I <strong>Control</strong>s<br />
2,142 1,063<br />
With Phase I <strong>Control</strong>s<br />
1,485 953<br />
Recommended <strong>Plan</strong><br />
54 79<br />
% Reduction from No Phase I <strong>Control</strong>s 97.5% 92.5%<br />
Number of Overflows/yr<br />
No Phase I <strong>Control</strong>s<br />
82 74<br />
With Phase I <strong>Control</strong>s<br />
75 74<br />
Recommended <strong>Plan</strong><br />
2 4<br />
Notes: 1. One at Piney Branch, four at the other Rock Creek CSOs.<br />
Rock<br />
Creek<br />
49<br />
52<br />
5<br />
89.8%<br />
Total<br />
<strong>System</strong><br />
3,254<br />
2,490<br />
138<br />
95.8%<br />
-<br />
30<br />
1 / 4 1 -<br />
30 -<br />
% Capture of<br />
<strong>Combined</strong> Sewage<br />
per CSO Policy<br />
76%<br />
82%<br />
99%<br />
-<br />
-<br />
-<br />
-<br />
In addition to demonstrating reductions in overflows from current levels, EPA’s CSO Policy calls for<br />
calculating the percentage of combined sewage that is captured for treatment in the combined sewer<br />
system. The percentage of capture without the Phase I CSO controls is already very high at 76%,<br />
primarily due to the ability of BPWWTP to treat high flows during wet weather events. With<br />
implementation of the recommended LTCP, the CSO capture rate is predicted to be 99% on a system<br />
wide, annual average basis. This is extremely high when compared to EPA’s guideline of 85%<br />
capture under the presumptive approach as described in Section 2 of this report.<br />
The following are findings regarding the impact of the recommended LTCP on water quality:<br />
<br />
Bacteria conditions are a problem in all three receiving waters. CSO control will<br />
significantly reduce the concentrations of bacteria, but will not result in conditions in the<br />
river that meet water quality standards all the time because of pollution from storm water and<br />
upstream sources. <strong>Control</strong> of other sources coupled with CSO control is required to meet<br />
current water quality standards<br />
<br />
Elimination (by separation) of combined sewer discharges to the receiving waters is not<br />
economically feasible for the District and has numerous drawbacks, including the disruption<br />
associated with constructing essentially a new sewer system for one-third of the District. The<br />
recommended plan is predicted to provide better water quality than separation. This is due to<br />
the large amount of storm water that is collected in the combined sewer system and treated<br />
prior to discharge. Note that CSO control alternatives which allow zero overflows in the<br />
three year analysis period (1988-1990) were also analyzed. These alternatives still allow<br />
overflows under more extreme climate conditions not represented in the three year analysis<br />
period. These items are discussed in more detail in Sections 8 and 9.<br />
\\Gh-wash\ENG 1160\LTCP\LTCP Final\exec sum.doc ES-12 FINAL - July 2002
Executive Summary<br />
<br />
Significant sources of bacteria are found in storm water runoff and in water entering the<br />
District from upstream sources. Cost-effective and reliable technical programs to reduce<br />
these pollution sources to the degree required to meet current water quality standards may not<br />
be available for the foreseeable future.<br />
<br />
The recommended plan for CSO control will meet the geometric mean bacteria standard in<br />
all receiving waters. Initial discussions with the D.C. Department of Health indicate it will<br />
also meet the fecal coliform TMDL which is expected to be promulgated for all receiving<br />
waters.<br />
<br />
CSO control will improve the dissolved oxygen levels in the Anacostia River. However,<br />
CSO control alone will not allow the dissolved oxygen standard to be met and will not<br />
prevent the dissolved oxygen from dropping below the level where fish kills are possible.<br />
<strong>Control</strong> of storm water and upstream sources are required to achieve this standard.<br />
<br />
The recommended control plan will virtually eliminate solids and floatables from the<br />
combined sewer system because the majority of CSOs will be captured and treated. For<br />
storms which are beyond the capacity of the proposed control system, the first flush of CSO<br />
which contains the vast majority of solids and floatables will be captured and treated.<br />
Overflows from the proposed control system will typically occur near the end of extreme<br />
storm events after most of the solids and floatables have been washed from the streets and<br />
captured by the control facilities. After implementation of the recommended plan, a large<br />
amount of trash may still be present due to sources other than CSO. <strong>Control</strong> of these other<br />
sources in a watershed-based approach is recommended.<br />
7. COMPARISON OF FINAL LTCP TO DRAFT LTCP<br />
The Final LTCP described in this report represents a major increase in CSO control over the Draft<br />
LTCP that was released in June 2001. In developing the Final LTCP, consideration was given to<br />
public and regulatory agency comments, the CSO Policy, the need to meet D.C. water quality<br />
standards, and existing and prospective TMDLs for the receiving waters. Particular attention was<br />
paid to separation, outfall elimination, low impact development and increasing the level of CSO<br />
control. Major advances in each of these categories have been made. The Final LTCP is compared<br />
to the Draft in Table ES-4.<br />
\\Gh-wash\ENG 1160\LTCP\LTCP Final\exec sum.doc ES-13 FINAL - July 2002
Executive Summary<br />
Table ES-4<br />
Comparison of Final and Draft LTCPs<br />
Item Draft LTCP Final LTCP<br />
No. CSO Overflows/Avg. Year<br />
Anacostia 4 2<br />
Potomac 12 4<br />
Rock Creek at Piney Branch 4 1<br />
Rock Creek – other outfalls 4 4<br />
CSO Overflow Volume (mg/avg yr)<br />
Anacostia 93 54<br />
Potomac 153 79<br />
Rock Creek 13 5<br />
Total 259 138<br />
% Reduction From Existing 92% 96%<br />
% Reduction on Anacostia 96% 98%<br />
<strong>System</strong> Characteristics<br />
CSO Storage Volume (mg) 147 193<br />
No of CSO Outfalls 60 46<br />
<strong>Water</strong> Quality Criteria<br />
Meets Oxygen and Bacteria <strong>Water</strong> Quality<br />
Standard for Design Condition Yes Yes<br />
BOD - Yes<br />
TSS - Yes<br />
Meets Anacostia BOD and TSS TMDLs<br />
Yes<br />
Cost<br />
Capital Cost (Year 2001) $1.05 Billion $1.265 Billion<br />
Cost Increase over Draft LTCP - 20%<br />
8. FINANCIAL IMPACTS<br />
Financing CSO programs in an equitable manner without placing an unreasonable burden on<br />
ratepayers is one of the most challenging aspects facing CSO communities. WASA has used the<br />
following two methods to document the burden on the District of the proposed LTCP:<br />
<br />
<br />
<strong>Long</strong>-term rate impact analyses using the Authority’s financial planning and rates model, and<br />
Affordability analysis using procedures developed by EPA.<br />
A key indicator of the affordability of the proposed LTCP is the impact on the annual household<br />
budgets for District ratepayers as measured by the timing and extent of the required annual rate<br />
increases. To document the actual impact on household budgets and to supplement the EPA<br />
approach, WASA conducted an analysis of the impacts of the CSO program on wastewater rates.<br />
To finance its current $1.6 billion capital program, annual increases in retail rates of approximately<br />
6.5% to 7.0% through FY 2008 followed by 6% annual increases from FY 2009 through FY 2012<br />
will be required. Over the long-term, WASA is projecting that future necessary infrastructure reinvestment<br />
will continue to require steady rate increases of about 5% per year. This longer-term<br />
\\Gh-wash\ENG 1160\LTCP\LTCP Final\exec sum.doc ES-14 FINAL - July 2002
Executive Summary<br />
outlook is consistent with national infrastructure studies that document the need for doubling of rates<br />
over 20 years for infrastructure investment. Under this “baseline” scenario, the annual cost for water<br />
and wastewater for a typical residential customer with metered consumption of 100 CCF per year<br />
will increase 113% (from $290 to $617) in fifteen years.<br />
Implementation of the LTCP will result in additional rate increases and higher costs to the<br />
Authority’s customers over and above the increases needed to fund the baseline capital program.<br />
Through analysis of a range of LTCP implementation schedules WASA has determined that the only<br />
rates impacts that are feasible are those associated with the longest implementation schedules. Table<br />
ES-5 displays the impacts for a 100 CCF customer over 15 years for the baseline and for several<br />
LTCP implementation schedules.<br />
Table ES -5<br />
Rate Impacts of the CSO LTCP on 100 CCF Residential Customer<br />
FY 2003<br />
Annual<br />
Bill<br />
Annual Bill<br />
in<br />
15 Years<br />
Annual<br />
Rate Increases<br />
Over 15 Years<br />
Baseline – No LTCP $290 $617 6.0%<br />
Baseline Plus LTCP – 40 Years $290 $722 7.2%<br />
Baseline Plus LTCP – 30 Years $290 $795 8.0%<br />
Baseline Plus LTCP – 20 Years $290 $942 9.4%<br />
Baseline Plus LTCP – 15 Years $290 $1,002 9.9%<br />
If WASA implemented the proposed LTCP over a 40-year period, a typical residential customer with<br />
annual metered water consumption of 100 CCF will see their annual wastewater costs rise from $290<br />
to $722 in 15-years; a 150% increase.<br />
Shorter LTCP implementation schedules create too high a burden on the Authority’s rate payers in<br />
terms of rapid escalation of the cost of wastewater services. The 15 and 20-year LTCP<br />
implementation schedules would require a large number of consecutive “double-digit” rate increases<br />
when the costs of those programs are added to the demands imposed by the baseline investment in<br />
water and wastewater infrastructure. As shown in Figure ES-3, the 15-year program is projected to<br />
require 8 consecutive increases over 10% per year. Such rate increases would outpace expected<br />
growth in household incomes by two to three times, thereby eroding household resources for other<br />
items. As shown in Figure ES-4, longer implementation schedules require lower peak rate increases<br />
and reduce the number of increases over 10% from 8 consecutive increases to fund the 15-year<br />
schedule to a single increase exceeding 10% in the case of the 40-year schedule.<br />
\\Gh-wash\ENG 1160\LTCP\LTCP Final\exec sum.doc ES-15 FINAL - July 2002
Executive Summary<br />
18%<br />
Figure ES -3<br />
Annual Rate Increases Required for 15 and 20-year LTCP <strong>Plan</strong>s<br />
16%<br />
15-Year LTCP<br />
14%<br />
20-Year LTCP<br />
Annual Wastewater Rate Increase<br />
12%<br />
10%<br />
8%<br />
6%<br />
Baseline<br />
4%<br />
2%<br />
0%<br />
2 3 4 5 6 7 8 9 10 11 12 13 14 15 16 17 18 19 20 21 22 23 24 25 26 27 28 29 30 31 32 33 34 35 36 37 38 39 40<br />
Project Year<br />
18%<br />
Figure ES- 4<br />
Annual Rate Increases Required for 30 and 40-year LTCP <strong>Plan</strong>s<br />
16%<br />
30-Year LTCP<br />
14%<br />
40-Year LTCP<br />
Annual Wastewater Rate Increase<br />
12%<br />
10%<br />
8%<br />
6%<br />
Baseline<br />
4%<br />
2%<br />
0%<br />
2 3 4 5 6 7 8 9 10 11 12 13 14 15 16 17 18 19 20 21 22 23 24 25 26 27 28 29 30 31 32 33 34 35 36 37 38 39 40<br />
Project Year<br />
\\Gh-wash\ENG 1160\LTCP\LTCP Final\exec sum.doc ES-16 FINAL - July 2002
Executive Summary<br />
There are two ways to reduce the rate impacts of a shorter LTCP implementation schedule, external<br />
funding assistance and deferral of other water and wastewater capital expenditures. External<br />
assistance targeted at limiting peak rate increases can reduce the severe impacts of high annual rate<br />
increases associated with the shorter programs. External assistance of approximately 62% of the<br />
capital cost of the program can keep rate increases to 8% per year as shown in the following chart.<br />
Total external capital assistance under this scenario would be $960 million. It is important for any<br />
external assistance to reflect year-of-expenditure values or the actual “cost to complete” the project.<br />
If external assistance is determined on current dollars or on an amount per year, the cost to complete<br />
and inflation risks are shifted to ratepayers.<br />
The EPA’s approach involves calculating the cost per household (CPH) for residential customers for<br />
current and proposed wastewater treatment and CSO control costs. The CPH is used in conjunction<br />
with the median household income (MHI), estimated at $39,760 per year in 2001, to estimate<br />
residential impacts. Residential impacts are considered by EPA to be ‘low’ if the CPH is less than<br />
1% of the MHI, ‘medium’ if the CPH is between 1% and 2% of the MHI, and ‘high’ if the CPH is<br />
greater than 2% of the MHI. The CPH is combined with other factors such as unemployment rate,<br />
property tax collection rates and other factors to develop an overall assessment of financial burden.<br />
In the District, there is a distinct clustering of household incomes at the lower and upper extremes of<br />
the income spectrum. Because of the disproportionate number of low-income households in the<br />
District, the impact of wastewater treatment and CSO control costs on the lowest 20% of income<br />
distribution in the District was calculated. The analysis was performed for the maximum income in<br />
this category, which is $18,000 per year.<br />
Table ES-6 summarizes the results of the analysis. For median incomes, wastewater treatment costs<br />
including the proposed CSO controls are projected to impose a medium burden according to EPA<br />
guidelines. Current wastewater treatment costs alone impose a medium burden on lower income<br />
households. Addition of CSO controls to low income households increases the burden level to<br />
EPA’s highest level, reaching nearly 3.5% of household income alone for wastewater costs. Various<br />
levels of Federal assistance are also listed showing the degree to which they reduce the CPH as a<br />
percent of median income.<br />
\\Gh-wash\ENG 1160\LTCP\LTCP Final\exec sum.doc ES-17 FINAL - July 2002
Executive Summary<br />
Table ES-6<br />
Cost Impacts on Residential Customers (Year 2001 Dollars)<br />
Scenario<br />
Cost Per<br />
Household for<br />
Wastewater<br />
Treatment ($/yr)<br />
Median<br />
Incomes<br />
Cost Per Household as % of Income<br />
Upper end of Lower 24% of Incomes<br />
($18,000/yr Income)<br />
Current Residential Bill (April 2001) $271 0.8% 1.5 %<br />
After Completion of Current Capital<br />
Improvement Program, but no additional CSO<br />
controls 1 $329 0.83% 1.83%<br />
Current Capital Improvement Program Plus<br />
Additional Recommended CSO <strong>Control</strong>s:<br />
0% Assistance $602 1.51% 3.35%<br />
25% Assistance $539 1.36% 3.00%<br />
75% Assistance $413 1.04% 2.30%<br />
Notes: 1. Includes cost of rehabilitation of Main, ‘O’ Street, Eastside and Poplar Point Pumping Stations.<br />
9. SCHEDULE<br />
In accordance with public comments, the schedule for implementing the recommended control plan<br />
was developed by giving priority to projects that benefit the Anacostia River. The projects in the<br />
LTCP can be divided into two categories: those in the existing Capital Improvement Program (CIP)<br />
and those not currently in the CIP. Projects in the CIP have been budgeted and scheduled and these<br />
projects will move forward without approval of the LTCP. For projects not currently in the CIP, an<br />
implementation schedule has been developed based on years after approval of the LTCP. Based on<br />
the financial capability assessment and in order to mitigate the annual rate increases that would be<br />
required to fund the full LTCP, a 40-year implementation time is proposed for the entire<br />
recommended plan if no outside financial assistance is received. If significant outside financial<br />
assistance is obtained, it is technically feasible to accelerate the schedule to a 15-year implementation<br />
time frame. Significant outside assistance on the order of 62% would be required to achieve this<br />
schedule.<br />
10. WATER QUALITY STANDARDS REVIEW<br />
The current water quality standards for the District of Columbia do not address the transient nature of<br />
wet weather events. The standards also include a narrative component, which, among other items,<br />
require that discharges be free of untreated sewage. Given the current standards, no alternative short<br />
of complete separation can completely eliminate overflows (and thereby comply with current<br />
standards) during all conditions. The analyses conducted as part of the LTCP have shown that<br />
complete separation is not economically feasible, has numerous technical drawbacks, and is less<br />
beneficial in terms of water quality than the recommended control program. As a result, WASA has<br />
selected a LTCP that offers an effective combination of costs, benefits and environmental protection.<br />
However, although greatly reduced, CSO discharges will continue to occur under the LTCP and<br />
\\Gh-wash\ENG 1160\LTCP\LTCP Final\exec sum.doc ES-18 FINAL - July 2002
Executive Summary<br />
water quality provisions will need to be adopted that address wet weather discharges from the<br />
combined sewer system.<br />
Studies conducted as part of the LTCP have demonstrated that pollution sources other than CSOs<br />
(storm water, upstream sources, non point sources) cause substantial impairment to the receiving<br />
waters. These sources will have to be significantly reduced to reach the equivalent degree of<br />
protection that can be achieved by the LTCP. Cost-effective and reliable technical programs to<br />
effectively reduce the impact of the other pollution sources may not be available for the foreseeable<br />
future. Besides the technical uncertainties of reduction of the other pollution sources, a significant<br />
component of these sources originate in political jurisdictions outside the District. Given the history<br />
and experience of dealing with diverse pollution sources and other political jurisdictions, the results<br />
of future efforts to control these sources cannot be predicted with any degree of certainty. The CSO<br />
studies have shown that the benefits of the LTCP are reliable and implementable. As WASA and the<br />
District develop provisions to implement the LTCP, consideration should be given to formation of a<br />
watershed based forum to reduce the other pollution sources.<br />
In view of the complex and technically difficult situation regarding control of diverse and<br />
undocumented pollution sources, consistent “fishable and swimmable” water quality conditions for<br />
District waters receiving CSO discharges may not be achievable, particularly during wet weather. In<br />
any case, the recommended LTCP would provide the foundation to work towards “fishableswimmable”<br />
conditions. To such an end, the recommended LTCP would accomplish the following:<br />
<br />
<br />
A situation whereby the remaining CSO discharges would not negatively affect achieving the<br />
“fishable” component of the “fishable-swimmable” use designation. In this regard, fishing<br />
could be practiced whether or not a CSO discharge was occurring.<br />
A situation wherein the remaining CSO discharges would preclude achieving full body<br />
contact a small percentage of the time. However, there would be few occurrences throughout<br />
the warm weather recreational period when the public might occasionally be precluded from<br />
full body contact by CSO discharges.<br />
Given the magnitude of the investment proposed for CSO control, WASA has a responsibility to<br />
protect the investment in the LTCP and to seek wet weather discharge provisions in the water quality<br />
standards prior to implementation. Implementing the LTCP without such provisions would expose<br />
rate payers to significant economic risk since the control plan would not technically meet water<br />
quality standards and would be subject to challenge. A framework for such provisions in the<br />
standards could be as follows:<br />
<br />
Provide for the limited discharges as included in the LTCP to continue. The designated use<br />
would be restricted during times of discharge and for a limited time thereafter.<br />
\\Gh-wash\ENG 1160\LTCP\LTCP Final\exec sum.doc ES-19 FINAL - July 2002
Executive Summary<br />
<br />
<br />
<br />
<br />
Develop compliance requirements based on the physical elements of the control plan (e.g.<br />
capacity to store a set volume or to convey CSO at a set rate).<br />
Exclude those wet weather events over and above the capacity of those facilities included in<br />
the plan.<br />
Provide for public notification when discharges are occurring and for established times after<br />
discharges cease.<br />
Provide for a post construction-monitoring program to measure instream conditions.<br />
Additional information is presented in Section 14 of this report.<br />
11. POST CONSTRUCTION MONITORING<br />
A program will be required to monitor performance of the final LTCP. This program would<br />
commence as usable components of the final LTCP are placed in operation. The monitoring program<br />
would comprise elements as follows:<br />
<br />
<br />
<br />
<br />
Flow monitoring and sampling at representative CSO outfalls on each receiving water<br />
system.<br />
Flow monitoring on representative facilities that transfer flow from CSO outfalls to storage<br />
and a system to measure the degree to which storage facilities are filled.<br />
A visual notification system placed at three or four locations on each receiving water at<br />
public access locations. This system would serve to notify the public of the occurrence of<br />
overflows based on the flow monitoring at the representative CSO outfalls. The system<br />
would comprise a series of colored lights, flags or pendents.<br />
An instream monitoring program would be developed to periodically obtain information on<br />
water quality. This program could be structured similar to that employed to obtain<br />
information for the LTCP.<br />
\\Gh-wash\ENG 1160\LTCP\LTCP Final\exec sum.doc ES-20 FINAL - July 2002
Introduction<br />
Section 1<br />
Introduction<br />
1.1 OVERVIEW AND PURPOSE<br />
The District of Columbia <strong>Water</strong> and <strong>Sewer</strong> Authority (WASA or Authority) operates a wastewater<br />
collection system comprised of separate and combined sewers. Approximately two-thirds of the<br />
District is served by separate systems, which consist of two independent piping systems: one system<br />
for “sanitary” wastewater (i.e. sewage from homes and businesses) and one system for storm water.<br />
The remaining one-third or approximately 12,478 acres is served by a combined sewer system (CSS),<br />
which conveys both storm water and sanitary wastewater in one piping system. The combined sewer<br />
service area is located primarily in the older central part of the District. The location of the combined<br />
sewer area in the District is shown on Figure 1-1.<br />
During dry weather, sanitary wastewater collected in the CSS is conveyed to the Authority’s Blue<br />
Plains Advanced Wastewater Treatment <strong>Plan</strong>t (BPWWTP). During periods of heavy rainfall, the<br />
capacity of a combined sewer may be exceeded and the excess flow, which is a mixture of storm<br />
water and sanitary wastewater, is discharged directly to the Anacostia River, Rock Creek, the<br />
Potomac River or their tributary waters. This excess flow is called <strong>Combined</strong> <strong>Sewer</strong> Overflow<br />
(CSO). Release of this excess flow is necessary to prevent flooding in homes, businesses, and streets.<br />
Figure1-2 depicts how a combined sewer system and separate sewer system function.<br />
The occurrence of a CSO event depends on many factors other than the total rainfall amount. These<br />
include temporal and spatial rainfall distribution, rainfall intensity, antecedent moisture conditions,<br />
and the operations of the control measures in the combined sewer system. Because of this<br />
complexity, it is not possible to develop a simple rule relating rainfall volume to the occurrence of an<br />
overflow.<br />
There are a total of 60 outfalls listed in WASA’s existing National Pollutant Discharge Elimination<br />
<strong>System</strong> (NPDES) Permit. The NPDES permit is issued and administered by the U.S. Environmental<br />
Protection Agency (EPA). In addition to other conditions, the permit requires preparation of a <strong>Long</strong><br />
<strong>Term</strong> <strong>Control</strong> <strong>Plan</strong> (LTCP) for the CSS to reduce the impact of CSO on the water quality of<br />
receiving waters. This report has been developed to fulfill this requirement and is the result of a<br />
three-year effort by WASA and its team of consultants known as Engineering Program Management<br />
Consultant–III (EPMC-III). Key WASA staff members involved in developing the LTCP are noted<br />
in the Acknowledgements, as are the participating firms that make up the consulting team.<br />
\\Gh-wash\ENG 1160\LTCP\LTCP Final\Sec 1.doc 1-1 FINAL - July 2002
Introduction<br />
1.2 HISTORICAL BACKGROUND<br />
1.2.1 Late 1800’s to 1950<br />
Prior to the late 1800’s, sewage in the District drained through natural streambeds and natural<br />
waterways such as Tiber Creek and Slash Run, which became open sewers. Many of these streams<br />
discharged into the Washington City canal that had been built in the early 1800’s through the central<br />
part of the District for commercial purposes. The canal ran from the Potomac River near 17 th Street<br />
to the Anacostia River at New Jersey Avenue. Sewage was discharged to the canal at such low<br />
elevations that it would not be carried into the river during high tides. The continual accumulation<br />
of the foul deposits in the canal caused many nuisance problems. There was also periodic flooding<br />
of low-lying areas of the rapidly growing City.<br />
A Board of Public Works initiated underground sewer pipe construction in 1871. This program was<br />
taken over by three presidentially-appointed commissioners in 1874 and, from 1878, by the U.S.<br />
Army Corps of Engineers. <strong>Combined</strong> sewers discharged untreated sewage and storm water runoff<br />
into rivers and canals with some interceptors built piecemeal to enclose parts of the old canals and<br />
move discharge points away from developed downtown areas. In 1890, President Harrison sent<br />
Congress an overall engineering plan (much of which was implemented) for new interceptors to<br />
carry sanitary and storm water runoff considerably farther from the then-populated areas, to enclose<br />
the remaining canals and to pump most of the City’s sewage across the Anacostia River for discharge<br />
into the Potomac downstream from the developed City. Main Pumping Station was put into service<br />
to that end in 1907.<br />
In 1916, Congress authorized the State of Maryland to connect to the District’s sewer system.<br />
Agreements were subsequently developed between the District and the Washington Suburban<br />
Sanitary District (WSSD) to accept wastewater from Montgomery County and Prince George’s<br />
County. As the population of the District grew and District sewers were extended to serve parts of<br />
Maryland, pollution loadings began to exceed the assimilative capacity of the river. In 1938,<br />
BPWWTP, providing primary sedimentation processes, was placed in operation. By this time the<br />
District sewer system was also carrying sanitary flows from adjacent Prince Georges and<br />
Montgomery Counties, primarily from the lower Anacostia Valley, Rock Creek, and the Little Falls<br />
area just upstream of the city along the Potomac River.<br />
1.2.2 1950’s to 1980’s<br />
The rapid population expansion of the city during and after World War II greatly taxed the sewer<br />
system. Major studies of the city’s combined sewer system were conducted in the mid-1950s,<br />
resulting in the preparation of two companion reports documenting the then-current conditions of the<br />
system and recommending a major capital program for system development (Metcalf and Eddy 1955,<br />
Board of Engineers 1957). The Board of Engineers (consisting of three prominent engineers, Frank<br />
A. Marston, Samuel A. Greeley, and Gustav V. Requardt) recommended a plan of new relief<br />
\\Gh-wash\ENG 1160\LTCP\LTCP Final\Sec 1.doc 1-4 FINAL - July 2002
Introduction<br />
interceptors and pumping stations to greatly increase the system’s conveyance capacity to the Blue<br />
Plains Wastewater Treatment <strong>Plan</strong>t (WWTP). This plan became known as “Project C”, and the<br />
following key elements were constructed, starting in the early 1960’s:<br />
<br />
<br />
<br />
Relief sewers to parallel existing sewers and provide additional capacity, which included the<br />
Upper Potomac Interceptor Relief <strong>Sewer</strong>, Rock Creek Main Interceptor Relief <strong>Sewer</strong>, and the<br />
East Side Interceptor Relief <strong>Sewer</strong>.<br />
Pumping stations to convey wastewater to the BPWWTP, which included the Potomac, “O”<br />
Street, and East Side Pumping Stations.<br />
Force mains to convey flow from the aforementioned pumping stations, which included the<br />
Potomac River Force Mains, East Side Force Main, and the Anacostia Force Main and<br />
Gravity <strong>Sewer</strong>.<br />
In 1960, the District adopted a policy to ultimately separate the system over an extended period,<br />
extending well past the year 2000. Following this policy, active separation projects were under taken<br />
in several smaller drainage areas on the west side of Rock Creek in the early 1960’s; however, the<br />
difficulty associated with the construction of these projects brought the active program to a halt.<br />
In 1970 and 1973, two engineering planning studies were conducted on the combined sewer system<br />
to assess the feasibility of using off-line storage in the form of deep tunnels, mined caverns and<br />
surface reservoirs for containment of combined sewer flows (Roy F. Weston 1970, Metcalf and Eddy<br />
1973). This option was studied in the light of adoption of a similar plan for the city of Chicago in its<br />
Tunnel and Reservoir <strong>Plan</strong> (TARP). The first study called for a total storage volume of 1.05 billion<br />
gallons throughout the District, sized to hold storm events occurring up to once in 15 years, at a<br />
projected cost of $1.1 billion, in 1999 dollars. The second study proposed an alternate storage<br />
configuration of 600 million gallons for an overflow frequency of once per year, at a cost of $1.2<br />
billion, in 1999 dollars. Both plans were rejected by the District because of the magnitude of the<br />
estimated costs.<br />
1.2.3 1980’s to present<br />
Under EPA mandate, and with EPA grant supported funding, the District conducted another facility<br />
plan for CSO abatement resulting in a report that was issued in 1983 (O’Brien and Gere 1983). This<br />
facility plan was conducted under the then current EPA program guidance for federal grant support,<br />
which required the identification and quantification of beneficial uses to be achieved as a result of<br />
CSO control measure, and prescribed a marginal cost-benefit analysis for the selection of the<br />
abatement measure in which the federal government would participate. A two phase program was<br />
developed that focused primarily on overflows to the Anacostia River. Phase I was completed in<br />
1991 and consisted of two main elements. It consisted of a 400 mgd CSO treatment facility called<br />
the Northeast Boundary Swirl Facility and the installation of “inflatable dams” at eight of the largest<br />
\\Gh-wash\ENG 1160\LTCP\LTCP Final\Sec 1.doc 1-5 FINAL - July 2002
Introduction<br />
CSOs. The inflatable dams are balloon-like devices installed in existing sewers to store CSO in the<br />
sewer to prevent overflows. Both of these technologies were innovative at the time of<br />
implementation. Phase II, consisting of two additional swirl concentrator facilities, a sewer<br />
separation project, and a screening facility for the Piney Branch drainage area, was never<br />
implemented due to lack of funding.<br />
1n 1998, an evaluation of WASA’s pumping stations and conveyance system was performed (Delon<br />
Hampton & Associates, 1998.). The report recommended rehabilitation of the existing pumping<br />
stations to restore capacity. Further improvements were dependent on long term CSO planning.<br />
The sewage system was repeatedly the subject of study, design, and construction decade after decade<br />
to expand service to a growing, spreading population and to improve public health and water quality<br />
for the Metropolitan Washington area. However, during certain wet weather events, the old 19 th<br />
century combined sewer portion of the system still overflows into receiving waters. The current<br />
LTCP development effort addresses this legacy. Figure 1-3 highlights some of the key milestones in<br />
the CSS development.<br />
1.3 NATIONAL PERSPECTIVE<br />
<strong>Combined</strong> sewers are located in many older U.S. cities. There are currently 899 CSO permit holders<br />
with 10,115 CSO outfalls in the United States. The general locations of these systems are shown in<br />
the following chart. These CSO systems serve approximately 43 million people (EPA, 2000). Permit<br />
holders are at various stages of LTCP development and implementation as shown in the chart.<br />
WASA conducted a review of projects completed and underway at other CSO communities to<br />
incorporate lessons learned into their LTCP planning process.<br />
CSO Communities in U.S.<br />
Mid-West<br />
41%<br />
All Others<br />
8% NY, NJ<br />
12%<br />
Mid-<br />
Atlantic<br />
25%<br />
Northeast<br />
14%<br />
Must<br />
Develop<br />
LTCP<br />
41%<br />
Permit Holder Progress<br />
LTCP<br />
Underway<br />
27%<br />
No LTCP<br />
Required<br />
19%<br />
<strong>Control</strong>s<br />
in Place<br />
13%<br />
\\Gh-wash\ENG 1160\LTCP\LTCP Final\Sec 1.doc 1-6 FINAL - July 2002
Introduction<br />
1.4 EPA SPECIAL PANEL<br />
In 1998, the Environmental Protection Agency convened a “Special Panel on <strong>Combined</strong> <strong>Sewer</strong><br />
Overflows and Storm <strong>Water</strong> Management in the District of Columbia.” The Special Panel was<br />
chaired by Ms. Rebecca Hanmer, who at that time was the EPA Liaison to the District of Columbia.<br />
The Panel comprised representatives from over 25 local, regional, and federal agencies that have an<br />
interest in water quality issues in the District of Columbia. The Special Panel issued a report in<br />
September 1998 that included a wide range of recommendations generally grouped into the following<br />
categories:<br />
<br />
<br />
<br />
<br />
<br />
<br />
<br />
Actions the District of Columbia should take immediately<br />
Implementation of a watershed approach and cooperation with Maryland<br />
Federal agency responsibilities<br />
Public information and participation actions<br />
Improved assessment and monitoring programs<br />
Pollution prevention including a “war on trash”<br />
Financing wet weather pollution prevention and control<br />
WASA has incorporated many of the recommendations of the Special Panel. Most notably, WASA<br />
prepared a report titled “<strong>Combined</strong> <strong>Sewer</strong> <strong>System</strong> Nine Minimum <strong>Control</strong>s Summary Report”<br />
(Summary Report) in July 1999, which represented an update of the earlier Nine Minimum <strong>Control</strong>s<br />
Report submitted to the EPA in 1996. The Summary Report provided an update on various activities<br />
undertaken by WASA as part of the Nine Minimum <strong>Control</strong>s (NMC) program and included<br />
recommendations for enhancement of several activities associated with this program. An “NMC<br />
Action <strong>Plan</strong> Report” was prepared in February 2000, which detailed a schedule for implementing the<br />
recommended enhancements.<br />
WASA has continued to abide by the recommendations of the Special Panel and many of the<br />
recommendations of this <strong>Long</strong> <strong>Term</strong> <strong>Control</strong> <strong>Plan</strong> are directed towards addressing recommendations<br />
in the Special Panel Report.<br />
1.5 LTCP – PLANNING APPROACH<br />
In 1994 the EPA issued a national CSO Policy, which requires municipalities to develop a long term<br />
plan for controlling CSOs (i.e. a <strong>Long</strong> <strong>Term</strong> <strong>Control</strong> <strong>Plan</strong> or LTCP). The CSO policy became law<br />
with the passage of the Wet Weather <strong>Water</strong> Quality Act of 2000 in December 2000.<br />
The approach to developing the LTCP is specified in EPA’s CSO <strong>Control</strong> Policy and Guidance<br />
Documents, and involves the following elements:<br />
<strong>System</strong> Characterization, Monitoring and Modeling<br />
\\Gh-wash\ENG 1160\LTCP\LTCP Final\Sec 1.doc 1-8 FINAL - July 2002
Introduction<br />
Public Participation<br />
Consideration of Sensitive Areas<br />
Evaluation of Alternatives<br />
Cost/Performance Consideration<br />
Operational <strong>Plan</strong><br />
Maximizing Treatment at the Treatment <strong>Plan</strong>t<br />
Implementation Schedule<br />
Post Construction Compliance Monitoring Program<br />
Coordination with State <strong>Water</strong> Quality Standards<br />
Subsequent sections of the report will discuss each of these elements in more depth.<br />
WASA submitted its LTCP Program <strong>Plan</strong> to EPA in July 1999. An extensive monitoring program in<br />
accordance with an EPA-approved Quality Assurance Project <strong>Plan</strong> was conducted from August 1999<br />
– June 2000. The data gathered from this monitoring effort was used to develop computer models to<br />
evaluate alternatives for mitigating the impact of CSO’s on the receiving waters. Study memoranda<br />
were prepared throughout the development of the LTCP to present significant data and findings.<br />
These memoranda were distributed to regulatory agency for review as they were developed. A list of<br />
these documents is included in Appendix A. Review meetings were also held with regulatory<br />
agencies during development of the LTCP.<br />
In June 2001, a Draft LTCP was submitted to regulatory agencies and the public. An extensive<br />
public outreach program was conducted and many comments on the Draft LTCP were received.<br />
WASA has prepared this Final LTCP taking into regulatory agency comments, public comments, and<br />
additional water quality standard and total maximum daily load (TMDL) requirements.<br />
\\Gh-wash\ENG 1160\LTCP\LTCP Final\Sec 1.doc 1-9 FINAL - July 2002
Existing Conditions<br />
Section 2<br />
Existing Conditions<br />
2.1 INTRODUCTION<br />
This section discusses physical features and the framework of regulations that affect the development<br />
and selection of the CSS <strong>Long</strong> <strong>Term</strong> <strong>Control</strong> <strong>Plan</strong>. Physical features that have the greatest impact on<br />
the District receiving waters are their watersheds and the regional rainfall patterns. Governing<br />
regulations are concerned with water quality and sensitive areas; and establish criteria upon which<br />
the LTCP will be selected.<br />
2.2 WATERSHEDS<br />
The USEPA CSO <strong>Control</strong> Policy emphasizes the importance of the watershed approach in the<br />
development of a <strong>Long</strong> <strong>Term</strong> <strong>Control</strong> <strong>Plan</strong> (LTCP) for CSOs. Of particular importance to CSO<br />
control planning and management is the NPDES <strong>Water</strong>shed Strategy (USEPA, 1994). This strategy<br />
outlines national objectives and implementation activities to integrate the NPDES program into the<br />
broader watershed protection approach. The major advantage in using a watershed-based approach in<br />
LTCP development is that it allows for the site-specific determination of the relative impacts of<br />
CSOs and non-CSO sources of pollution on water quality (USEPA, 1995).<br />
There are three principal waterbodies within the District. These are the Potomac River, Anacostia<br />
River and Rock Creek. Figure 2-1 shows the watersheds of these waterbodies with drainage areas<br />
extending across multiple states and/or jurisdictions. Both the Anacostia River and Rock Creek<br />
watersheds include land area in Maryland and the District. The Potomac watershed includes land area<br />
in Virginia, West Virginia, Maryland, Pennsylvania and the District. As shown in the Figure 2-1,<br />
the Anacostia and Rock Creek are sub-watersheds of the entire Potomac River basin (EPMC-III,<br />
1999c). The District encompasses only a small portion of each watershed. General information<br />
about each of the three watersheds including physical characteristics and pollution sources is<br />
summarized in Table 2-1 below.<br />
Table 2-1<br />
<strong>Water</strong>shed Characteristics<br />
Characteristic Anacostia River Potomac River Rock Creek<br />
Population Population – Slightly over<br />
761,000<br />
Population – the majority exist along the<br />
river in the Washington Metropolitan area<br />
Population – slightly over<br />
408,000<br />
Land Use Land Use – Primarily<br />
residential, agricultural and<br />
commercial/industrial<br />
Land Use – Primarily agricultural and<br />
forest land<br />
Land Use – Primarily<br />
residential, agricultural and<br />
commercial/industrial<br />
Topography<br />
Generally flat within the<br />
District, flat and rolling hills<br />
upstream of the District<br />
Upper <strong>Water</strong>shed – steep mountainous<br />
terrain<br />
Lower <strong>Water</strong>shed – rolling hills and flat<br />
within the District<br />
Generally moderate grades<br />
within the District, rolling hills<br />
upstream of the District<br />
\\Gh-wash\ENG 1160\LTCP\LTCP Final\Sec 2.doc 2-1 FINAL - July 2002
Existing Conditions<br />
Table 2-1<br />
<strong>Water</strong>shed Characteristics<br />
Characteristic Anacostia River Potomac River Rock Creek<br />
Geology Piedmont and Coastal Plain Upper Basin – sedimentary rocks<br />
Middle Basin – crystalline rocks<br />
Lower Basin – unconsolidated deposits<br />
Hydrology<br />
Drainage Area – 176 sq. mi.<br />
Annual Average Flow - 139<br />
cfs<br />
Drainage Area – 14,670 sq. mi.<br />
Annual Average Flow - 10,790 cfs<br />
Mostly Piedmont Physiographic<br />
Province<br />
Drainage Area – 76.5 sq. mi<br />
Annual Average Flow – 63.7 cfs<br />
Wetlands Area 3% 1.1% 1.7%<br />
Pollution<br />
Sources<br />
Portion of<br />
<strong>Water</strong>shed Area<br />
within<br />
The District<br />
Average Flow<br />
Rate<br />
Gauging<br />
Location<br />
Municipal Treatment <strong>Plan</strong>ts<br />
Industrial <strong>Plan</strong>ts<br />
Mining Operations<br />
Agricultural Runoff<br />
<strong>Combined</strong> <strong>Sewer</strong> Overflow<br />
Storm <strong>Water</strong> Runoff<br />
Municipal Treatment <strong>Plan</strong>ts<br />
Industrial <strong>Plan</strong>ts<br />
Mining Operations<br />
Agricultural Runoff<br />
<strong>Combined</strong> <strong>Sewer</strong> Overflow<br />
Storm <strong>Water</strong> Runoff<br />
Municipal Treatment <strong>Plan</strong>ts<br />
Agricultural Runoff<br />
<strong>Combined</strong> <strong>Sewer</strong> Overflow<br />
Storm <strong>Water</strong> Runoff<br />
17% 0.5% 20%<br />
139.4 cfs (90.1 mgd) 10,790 cfs (6,975 mgd) 63.7 cfs (41.2 mgd)<br />
Sum of the following three<br />
gauges: Northeast Branch,<br />
Northwest Branch and Watts<br />
Branch<br />
Near Washington D.C. upstream of Little<br />
Falls Branch<br />
Sherrill Drive<br />
Period of Record 1938-1998 1930-1998 1929-1999<br />
Each water body has unique flow characteristics and can be characterized as follows:<br />
<br />
<br />
<br />
Anacostia River – the entire main stem of the Anacostia River within the District is tidal and<br />
often sluggish. During low flow conditions, the residence time of water in the river can be as<br />
long as 100 to 110 days. The average tidal range is about three feet.<br />
Rock Creek - Rock Creek is a free flowing stream for the majority of its length, except for<br />
the last quarter mile, which is affected by the tide. The creek is relatively shallow and fast<br />
moving. It is also turbulent due to the irregular bottom of the creek bed.<br />
Potomac River – the Potomac River is much larger that the Anacostia or Rock Creek. The<br />
river has substantial flow rates and the water is generally of better quality that the Anacostia<br />
or Rock Creek. The fall line separating the riverine and estuarine sections of the Potomac is<br />
located just above Chain Bridge and the District. The Potomac is tidal as it passes through<br />
the District and the average tidal range is about three feet in the District.<br />
2.3 RAINFALL CONDITIONS<br />
EPA’s CSO <strong>Control</strong> Policy (1994) requires the effectiveness of CSO controls to be evaluated on a<br />
“system-wide, annual average basis.” Identification of annual average rainfall conditions is thus a<br />
fundamental step in the LTCP process. Once selected, the average rainfall conditions become the<br />
\\Gh-wash\ENG 1160\LTCP\LTCP Final\Sec 2.doc 2-2 FINAL - July 2002
Existing Conditions<br />
basis for modeling the sewer system and receiving waters to evaluate the occurrence of CSOs, their<br />
impact on receiving waters, and the efficacy of CSO controls.<br />
Table 2-2 summarizes historical and annual average rainfall conditions within the District. Over the<br />
50-year period of record, the years 1988 – 1990 were selected as a combination of years that best<br />
represents system-wide, annual average rainfall conditions in the District. The years chosen represent<br />
a fairly conservative approach, since they are equivalent to the 68 th percentile year in terms of<br />
rainfall. The rainfall statistics for these three years are presented in Table 2-2 (EPMC-III, 1999d).<br />
Table 2-2<br />
Annual Average Rainfall Conditions in the District<br />
Statistic 1988 1989 1990<br />
Average of<br />
1988-1990<br />
<strong>Long</strong> <strong>Term</strong><br />
Average 1<br />
Annual Rainfall (inches) 31.74 50.32 40.84 40.97 38.95<br />
No. Events > 0.05 inches 2 61 79 74 71 74<br />
Average Storm Duration (Hours) 2 9.6 11.2 9.6 10.1 9.9<br />
Average Maximum Intensity (in/hr) 0.15 0.18 0.15 0.16 0.15<br />
Maximum Intensity (in/hr) 1.32 1.31 1.25 1.29 1.30<br />
Percentile 3 14th 90th 68th 68th<br />
Notes: 1. Ronald Reagan National Airport hourly data, 1949-1998<br />
2. Individual events separated by a minimum of 6 hours with no rain. A threshold of 0.05” was selected since<br />
rainfall less than this produces minimal, if any, runoff.<br />
3. Percentile is based on total annual rainfall.<br />
2.4 REGULATORY REQUIREMENTS<br />
Regulatory requirements affect the development of WASA’s <strong>Long</strong> <strong>Term</strong> <strong>Control</strong> <strong>Plan</strong> (LTCP) to<br />
control discharges from its <strong>Combined</strong> <strong>Sewer</strong> <strong>System</strong> (CSS). The applicable regulations are listed and<br />
their effect on LTCP development is described below (EPMC-III, 2001a).<br />
2.4.1 <strong>DC</strong> <strong>Water</strong> Quality Standards (WQS)<br />
Current <strong>Water</strong> Quality Standards<br />
The three major waterways in the District are assigned current use classifications, designated use<br />
classifications and associated WQS by the District of Columbia Department of Health (DOH).<br />
The designated uses, current classification and water quality standards of the District receiving<br />
waters are shown in Tables 2-3 and 2-4 (<strong>DC</strong> Register, 2000). In addition to numeric standards<br />
the WQS also include narrative language that require Class A waters be free from discharges of<br />
untreated sewage and litter, and surface waters to be free from substances discharged in amounts<br />
that cause injury to, are toxic to, or produce adverse physiological or behavioral changes in<br />
humans, plants and animals. The LTCP must address the differences between current and<br />
designated receiving water uses and water quality standards for each of the three District waters.<br />
\\Gh-wash\ENG 1160\LTCP\LTCP Final\Sec 2.doc 2-4 FINAL - July 2002
Existing Conditions<br />
Table 2-3<br />
Receiving <strong>Water</strong> Use Classifications<br />
Receiving <strong>Water</strong> Current use Designated Use<br />
Anacostia River B, C, D, E A, B, C, D, E<br />
Potomac River B, C, D, E A, B, C, D, E<br />
Rock Creek B, C, D, E A, B, C, D, E<br />
Use Classes<br />
A – Primary contact recreation<br />
B – Secondary contact recreation and aesthetic enjoyment<br />
C – Protection and propagation of fish, shellfish and wildlife<br />
D – Protection of human health related to consumption of fish and shellfish<br />
E – Navigation<br />
Table 2-4<br />
D.C. <strong>Water</strong> Quality Standards (<strong>DC</strong> Register, 2000)<br />
Constituent<br />
Criteria for Classes<br />
A B C<br />
Bacteriological (Number/100 ml)<br />
Fecal coliform<br />
200 1000<br />
(maximum, 30 day geometric mean for 5 samples)<br />
Physical<br />
Dissolved oxygen (mg/L)<br />
Minimum daily average<br />
(3 samples per 24 hrs, once per 8 hrs)<br />
5.0<br />
One hour minimum<br />
March through June<br />
July through February<br />
5.0<br />
4.0<br />
Temperature (Celsius)<br />
Maximum<br />
Maximum change above ambient<br />
32.2<br />
2.8<br />
PH<br />
Greater than<br />
and less than<br />
Turbidity<br />
increase above ambient (NTU)<br />
6.0<br />
8.5<br />
20<br />
6.0<br />
8.5<br />
20<br />
6.0<br />
8.5<br />
20<br />
Total dissolved gases (maximum % saturation) 110<br />
Hydrogen Sulfide (maximum ug/L) 2.0<br />
Oil & Grease (mg/L) 10.0<br />
<br />
Possible <strong>Water</strong> Quality Standards Modifications<br />
In EPA’s May 2000 draft guidance on implementing WQS, the EPA recommended moving from<br />
a fecal coliform standard to an e. coli and enterococci standard for Class A fresh and marine<br />
waters, respectively. The recommended WQS for e. coli is a geometric mean of equal to or less<br />
than 126 MPN/100 ml for Class A waters. The recommended standard for Class B is 5 times the<br />
geometric mean of the Class A standard or 630 MPN/100 ml. EPA also recommended single<br />
sample maximums which can range from 235 MPN/100 for designated beach areas to 576<br />
MPN/100 for infrequently used full body contact recreation. Thus far, 12 of the 34 states with<br />
CSO-impacted waters have adopted the new standards. The DOH is aware of this new criteria<br />
\\Gh-wash\ENG 1160\LTCP\LTCP Final\Sec 2.doc 2-5 FINAL - July 2002
Existing Conditions<br />
and plans to consider the adoption of the new bacteria standard in its WQS at its next triennial<br />
review scheduled for late 2002 or early 2003. Therefore, e-coli concentrations have been<br />
monitored and modeled as part of the LTCP development effort to evaluate the performance of<br />
alternatives in relation to this potential new standard.<br />
2.4.2 EPA <strong>Combined</strong> <strong>Sewer</strong> Overflow (CSO) <strong>Control</strong> Policy<br />
The EPA first issued requirements for control of CSOs with publication of a <strong>Control</strong> Strategy in<br />
September 1989. In April 1994, the agency issued its CSO <strong>Control</strong> Policy designed to elaborate on<br />
the Strategy and to expedite compliance with the requirements of the CWA. The purpose of the<br />
policy is to coordinate the planning, selection, design and implementation of CSO management<br />
practices and controls, to meet the requirements of the CWA and to involve the public fully during<br />
the decision-making process.<br />
The policy is framed around the principal elements as follows:<br />
Implementation of minimum technology-based CSO controls; and<br />
Development of long-term CSO control plans which evaluate alternatives for attaining<br />
compliance with the CWA, including compliance with water quality standards and<br />
protection of designated uses, and modifications to the standards if warranted.<br />
CSO policy became law with the passage of the Wet Weather <strong>Water</strong> Quality Act of 2000 in<br />
December 2000. EPA implements the CSO <strong>Control</strong> Policy through the NPDES Permit Program.<br />
2.4.2.1 Minimum Technology-Based CSO <strong>Control</strong>s<br />
Minimum requirements for technology-based controls have been developed by EPA for combined<br />
sewer systems. These requirements are included in EPA’s list of “Nine Minimum <strong>Control</strong>s” (NMC)<br />
which are summarized as follows:<br />
1. Proper operation and regular maintenance programs for the sewer system and the CSOs;<br />
2. Maximize use of the collection system for storage;<br />
3. Review and modification of pretreatment requirements to assure CSO impacts are<br />
minimized;<br />
4. Maximize flow to the POTW (public owned treatment works) for treatment;<br />
5. Prohibition of CSOs during dry weather;<br />
6. <strong>Control</strong> of solid and floatable materials in CSOs;<br />
7. Pollution prevention;<br />
8. Public notification to ensure that the public receives adequate notification of CSO<br />
occurrences and CSO impacts; and<br />
9. Monitoring to effectively characterize CSO impacts and the efficacy of CSO controls.<br />
\\Gh-wash\ENG 1160\LTCP\LTCP Final\Sec 2.doc 2-6 FINAL - July 2002
Existing Conditions<br />
The policy is based on implementation of the nine minimum controls through effective management<br />
programs with only minor construction. Any major construction is viewed as being part of long-term<br />
CSO control plans. Permittees are required to implement and document implementation of the nine<br />
minimum controls. WASA has been implementing its NMC Program in accordance with the CSO<br />
Policy. WASA’s nine minimum controls program was first approved by EPA in 1996.<br />
2.4.2.2 <strong>Long</strong> <strong>Term</strong> CSO <strong>Control</strong> <strong>Plan</strong>s<br />
Under the policy, a long-term CSO control plan comprises principal elements as follows:<br />
1. <strong>System</strong> Characterization, Monitoring and Modeling, which includes compilation of<br />
background information, field monitoring and development of predictive models tailored to<br />
the complexity of the CSO system and information needs associated with evaluation of CSO<br />
control options and water quality impacts.<br />
2. Public Participation, which requires the permittee to employ a public participation process<br />
that actively involves the affected public in the decision-making to select the long term CSO<br />
controls.<br />
3. Consideration of Sensitive Areas, which requires permittees to give the highest priority to<br />
controlling overflows to sensitive areas such as outstanding natural resource waters, public<br />
drinking water intakes and protection areas, waters with threatened or endangered species<br />
and their habitat, waters with primary contact recreation, and shellfish beds.<br />
4. Evaluation of Alternatives, which includes controls necessary to achieve zero overflow<br />
events per year, a range of overflow events from one to twelve per year and expansion of<br />
treatment capacity.<br />
5. Cost/Performance Consideration, which requires that appropriate cost/performance curves be<br />
developed to demonstrate the relationships among a comprehensive set of reasonable control<br />
alternatives that correspond to the specified range of control levels. This should include<br />
analysis to determine where the increment of pollution reduction achieved in the receiving<br />
water diminishes compared to increased cost.<br />
6. Operational <strong>Plan</strong>, which requires that after the NPDES permitting authority and permittee<br />
agree on necessary CSO controls to be implemented under the LTCP, the permittee will<br />
revise their operation and maintenance program to include the agreed-upon long term CSO<br />
controls.<br />
7. Maximizing Treatment at the Treatment <strong>Plan</strong>t, one goal of the CSO <strong>Control</strong> Policy is to<br />
increase the amount of wet weather flow receiving full treatment.<br />
8. Implementation Schedule, which requires the development of a construction and financing<br />
schedule for the implementation of the LTCP. Schedules for implementation of CSO controls<br />
may be phased based on the relative importance of adverse impacts upon WQS and<br />
designated uses, identified priority projects and on financial capability.<br />
9. Post-Construction Compliance Monitoring Program, which requires that implementation of a<br />
\\Gh-wash\ENG 1160\LTCP\LTCP Final\Sec 2.doc 2-7 FINAL - July 2002
Existing Conditions<br />
post-construction water quality monitoring program adequate to verify compliance with<br />
water quality standards and protection of designated uses as well as ascertain the<br />
effectiveness of CSO controls.<br />
10. Coordination with State <strong>Water</strong> Quality Standards, EPA requires the review of WQS as part of<br />
the LTCP development process. EPA regulations and guidance provide states with the<br />
flexibility to adapt their WQS, and implementation procedures to reflect site-specific<br />
conditions including those related to CSOs. For example, states could adopt partial uses by<br />
defining when primary contact recreation such as swimming is suspended, such as during a<br />
particular type of storm event. In making such adjustments to their uses, states must ensure<br />
that downstream uses are protected, and that after the storm event passes, the use is fully<br />
protected.<br />
This report summarizes WASA’s efforts to complete the elements above. Additional reports<br />
developed in support of the LTCP development process are listed in the Appendix A.<br />
2.4.2.3 <strong>Control</strong> Approaches Under CSO Policy<br />
The policy outlines two basic approaches as a framework for developing and evaluating alternatives.<br />
These two approaches are:<br />
“Presumption” Approach<br />
The “presumption” approach states that a CSO program that meets one of the following three<br />
conditions is presumed to provide an adequate level of control to meet applicable state and<br />
local WQS in the receiving body of water. The acceptability of the “presumption” approach is<br />
subject to the approval of the permitting authority. If implementation of CSO controls based<br />
on the presumption approach do not result in attainment of WQS, additional controls beyond<br />
those already implemented may be required. The three conditions quoted directly from the<br />
Policy are:<br />
“1. No more than an average of four overflow events per year, provided that the<br />
permitting authority may allow up to two additional overflow events per year. For<br />
the purpose of this criterion, an overflow event is one or more overflows from a<br />
combined sewer system as a result of a precipitation event that does not receive the<br />
minimum treatment specified.”<br />
The CSO policy defines an overflow event as “…one or more overflows from a CSS as the<br />
result of a precipitation event that does not receive the minimum treatment specified…”. In<br />
terms of defining an overflow event, a municipality may be considered to have more than<br />
one CSS. For each CSS, a single overflow event under the Policy will have occurred if one<br />
or more of the CSO outfalls discharges untreated or inadequately treated combined sewage<br />
\\Gh-wash\ENG 1160\LTCP\LTCP Final\Sec 2.doc 2-8 FINAL - July 2002
Existing Conditions<br />
during a single rain event. The calculation of four overflow events per average year would<br />
thus apply to each CSS individually. For example, if the Anacostia CSOs are considered to<br />
be a single CSS and if a single precipitation event causes five of the 17 outfalls to overflow,<br />
this is counted as one overflow under the Policy. Note that the NPDES permitting authority<br />
may approve up to two more overflows (total six overflows) per average year.<br />
In addition, note that the limit of four overflows per year applies to overflows not receiving<br />
the minimum treatment of primary clarification, solids and floatables disposal, and<br />
disinfection. Outfalls may overflow more frequently if they receive the minimum level of<br />
treatment. For this evaluation, excess flow discharged from Blue Plains Outfall 001 is not<br />
considered a CSO overflow since it receives the required minimum treatment.<br />
“2. The elimination or the capture for treatment of no less than 85% by volume of the<br />
combined sewage collected in the combined sewer system during precipitation events<br />
on a system-wide annual average basis.”<br />
Under this criterion, the 85% by volume applies to the flow collected in the CSS, not 85% of<br />
the volume discharged. Thus, no more than 15% of the total flow collected in the CSS<br />
during storm events should be discharged without receiving the minimum level of treatment.<br />
The total volume applies on a system-wide, annual average basis. CSS modeling results<br />
indicate that once WASA completes its current efforts to rehabilitate existing pump stations<br />
and inflatable dams it will meet this criterion. However, receiving water models of this<br />
condition indicate that WQS will not be met; therefore evaluation efforts will focus on the<br />
demonstration approach.<br />
“3. The elimination or removal of no less than the mass of the pollutants, identified as<br />
causing water quality impairment through the sewer system characterization,<br />
monitoring, and modeling effort, for the volumes which would be eliminated or<br />
captured for treatment under paragraph 2 above.” (EPA, 1994).<br />
Under this approach, a CSO plan could be devised which removed 85% of the specific<br />
pollutants which cause water quality impairment. This is not necessarily 85% of the CSO<br />
volume. In addition, the pollutants that are currently removed by existing controls can be<br />
credited toward the 85% total.<br />
\\Gh-wash\ENG 1160\LTCP\LTCP Final\Sec 2.doc 2-9 FINAL - July 2002
Existing Conditions<br />
“Demonstration” Approach<br />
The “demonstration” approach states that a CSO program is adequate if it meets the state and<br />
local WQS of the receiving body(ies) of water. With this approach there are no specific<br />
limits on CSO events, flow or pollutant loading. A successful “demonstration” approach<br />
must meet each of the following criteria:<br />
“1. The planned control program is adequate to meet WQS and protect designated uses,<br />
unless WQS or uses cannot be met as a result of natural background conditions or<br />
pollution sources other than CSO’s;<br />
2. The CSO discharges remaining after implementation of the proposed control<br />
program will not preclude the attainment of WQS or the receiving waters’ designated<br />
uses or contribution to their impairment. Where WQS are not met in part because of<br />
natural background conditions or pollution sources other than CSO discharges, a<br />
total maximum daily load, including a wasteload allocation and a load allocation or<br />
other means should be used to apportion pollutant loads;<br />
3. The planned control program will provide the maximum pollution reduction benefits<br />
reasonably attainable; and.<br />
4. The planned control program is designed to allow cost effective expansion or cost<br />
effective retrofitting if additional controls are determined to be necessary to meet<br />
WQS or designated uses” (EPA, 1994).<br />
The demonstration approach requires that CSO discharges that remain after LTCP<br />
implementation do not preclude attainment of WQS. Modeling indicates that natural<br />
background conditions or pollution sources other than CSOs are contributing to WQS<br />
violations in the District, and that control of CSOs alone will not permit attainment of WQS.<br />
In order to assess this, pollutant loads other than CSOs were estimated and evaluated as part<br />
of the LTCP development effort. An assessment of the relative contribution of CSO loads to<br />
the receiving waters was made and then a range of CSO controls were identified to determine<br />
the quantifiable benefit. The effect of reduction in non-CSO loads to the receiving water was<br />
also evaluated. In cases where natural background conditions or pollution sources other than<br />
CSOs are contributing to WQS violations and where application of controls is not expected to<br />
meet WQS, regulatory agencies are responsible for developing a total maximum daily load<br />
(TMDL) for CSOs and other loads. The EPA CSO guidance documents also specify that the<br />
permitting authority should consider the maximum pollution reduction benefits that can be<br />
reasonably obtained. “Reasonably obtained” refers to the consideration of the cost of<br />
implementation of the control program in relation to the anticipated benefits to water quality.<br />
\\Gh-wash\ENG 1160\LTCP\LTCP Final\Sec 2.doc 2-10 FINAL - July 2002
Existing Conditions<br />
2.4.3 Use Attainability Analysis (UAA)<br />
As part of the water quality standards review required by the CSO <strong>Control</strong> Policy; a UAA, which is<br />
defined as “a structured scientific assessment of the chemical, biological, and economic condition in<br />
a waterway” (EPA, 2000), may be used to determine if currently enforceable WQS can be achieved<br />
and if justification for reclassification exists. In the case of the District, the DOH would be<br />
responsible for UAA preparation. Some CSO cities are pursuing UAAs for wet weather conditions<br />
due to the urban nature of their watersheds and the large storm flow volumes. This is a path that<br />
WASA and DOH could choose to pursue, if desired.<br />
2.4.4 Total Maximum Daily Loads<br />
The federal CWA requires that impaired waterways be identified (commonly called the 303d List)<br />
and stipulates that total maximum daily loads (TMDLs) be developed for pollutants of concern to<br />
bring impaired waterways up to water quality standards. The DOH is responsible for listing impaired<br />
District waters and developing associated TMDLs. <strong>Water</strong>bodies on the District’s 303d list that are<br />
thought to be partially impaired due to combined sewer overflows are listed in Table 2-5 (DOH,<br />
1998).<br />
Table 2-5<br />
Impaired District <strong>Water</strong>s Impacted by CSOs<br />
<strong>Water</strong>body Pollutants of Concern Priority Rank Action Needed<br />
Lower Anacostia BOD, bacteria, organics, High 1 <strong>Control</strong> CSOs, Point and<br />
metals, TSS, grease & oil<br />
Upper Anacostia BOD, bacteria, organics,<br />
metals, TSS, grease & oil<br />
Nonpoint Pollution<br />
High 2 <strong>Control</strong> CSOs, Point,<br />
Nonpoint and Upstream<br />
Pollution<br />
Kingman Lake BOD, bacteria, organics, High 6 <strong>Control</strong> CSOs and Nonpoint<br />
metals, TSS, grease & oil<br />
Pollution<br />
Upper Rock Creek Organics, metals and bacteria Medium 15 <strong>Control</strong> CSOs, Nonpoint and<br />
Upstream Pollution<br />
Lower Rock Creek Organics, metals and bacteria Medium 16 <strong>Control</strong> CSOs and Nonpoint<br />
Pollution<br />
Luzon Branch Organics Low 25 <strong>Control</strong> CSOs and Nonpoint<br />
Pollution<br />
Piney Branch Organics and metals Low 30 <strong>Control</strong> CSOs and Nonpoint<br />
Pollution<br />
Upper Potomac Organics and bacteria Low 34 <strong>Control</strong> CSOs, Nonpoint and<br />
Upstream Pollution<br />
Middle Potomac Organics, bacteria and pH Low 35 <strong>Control</strong> CSOs and Nonpoint<br />
Pollution<br />
Lower Potomac Organics and bacteria Low 36 <strong>Control</strong> CSOs, Point and<br />
Nonpoint Pollution<br />
As of June 2001, there are three TMDLs in the District:<br />
<br />
Oil and Grease – in January 1999, DOH issued a TMDL for oil and grease for Hickey Run, a<br />
\\Gh-wash\ENG 1160\LTCP\LTCP Final\Sec 2.doc 2-11 FINAL - July 2002
Existing Conditions<br />
tributary to the Anacostia River. There are no CSOs discharging to Hickey Run and this TMDL<br />
does not affect selection of the CSO controls.<br />
<br />
Biochemical Oxygen Demand (BOD) - In December 2001, EPA approved DOH’s TMDL for<br />
dissolved oxygen (expressed as BOD) for the Upper and Lower Anacostia River. The load<br />
allocations were expressed in terms of the average year based on the average of the period 1988-<br />
1990. A load allocation for CSO is shown in Table 2-6. Note that CSOs do discharge to the<br />
Upper Anacostia, but no loads were allocated to CSO in this section of the river.<br />
<br />
Total Suspended Solids (TSS) – In March 2002, EPA established a TMDL for TSS for the Upper<br />
and Lower Anacostia Rivers. The purpose of the TMDL was to address water clarity. The<br />
TMDL was expressed in tons of TSS for the growing season of April to October 1989. A load<br />
allocation for CSO is shown in Table 2-6.<br />
Table 2-6<br />
Anacostia TMDL Load Summary<br />
Biochemical Oxygen Demand (lbs/yr) Total Suspended Solids(Tons/yr)<br />
Load Source Existing Load 1 TMD Allocation Existing Load 2 TMD Allocation<br />
CSO in Upper Anacostia 0 0 252 58<br />
CSO in Lower Anacostia 1,574,132 152,906 198 45.4<br />
Total CSO 1,574,132 152,906 450 103.4<br />
Notes:<br />
1. As reported by DOH. The estimated loads developed as part of the LTCP differ from the loads in the TMDL.<br />
2. As reported by EPA. The estimated loads developed as part of the LTCP differ from the loads in the TMDL.<br />
DOH is also developing TMDLs for fecal coliform for the Anacostia River, Potomac River and Rock<br />
Creek. Additional TMDLs are expected in the future.<br />
2.4.5 WASA’s National Pollutant Discharge Elimination <strong>System</strong> (NPDES) Permit<br />
The latest WASA NPDES Permit No. <strong>DC</strong>0021199, issued by EPA, was effective on 1/22/97 and had<br />
an expiration date of 7/1/99. Since a reapplication was made but a new permit has not yet been<br />
issued, the existing permit remains in effect. The permit stipulates limits on flow and effluent<br />
pollutants for WASA’s two outfalls at Blue Plains WWTP as well as requirements associated with<br />
operating the combined sewer system. <strong>Plan</strong>s to expand or change discharge operations with regards<br />
to CSO control may require changes to the existing permit. Since EPA issues the permit, the EPA<br />
will play a primary role in the development, approval and implementation of the LTCP; however,<br />
certification of the permit is required from DOH.<br />
2.4.6 District’s Storm <strong>Water</strong> MS4 Permit<br />
An MS4 permit for the separate storm sewer system has been issued to the District of Columbia<br />
\\Gh-wash\ENG 1160\LTCP\LTCP Final\Sec 2.doc 2-12 FINAL - July 2002
Existing Conditions<br />
Government (not WASA). The permit, NPDES Permit No. <strong>DC</strong>0000221 gives the District the<br />
authority under the provisions of the CWA to discharge from its separate storm water sewer system<br />
to the local waterways. The latest permit became effective on April 19, 2000, and is scheduled to<br />
expire on April 19, 2003. The permit describes the types of discharges that are authorized and has<br />
conditions requiring identification of sources, the implementation and enforcement of Storm <strong>Water</strong><br />
Pollution Prevention and Management Program (SWMP) practices and monitoring and reporting<br />
requirements. Details on the numerous activities, focused on further reducing the discharge of<br />
pollutants to receiving waters, are discussed in Section 3 of this report and presented in the Municipal<br />
Separate Storm <strong>Sewer</strong> <strong>System</strong> First Annual Review (April 19, 2001).<br />
The storm water permit will have a limited affect on the preparation of the LTCP. Generally, the<br />
LTCP should consider any benefits of load reduction from the separate storm water system due to<br />
implementation of the SWMP. The financial burden for implementing both programs will be born by<br />
District residents and should be considered.<br />
2.4.7 Chesapeake Bay Agreement<br />
The Chesapeake Bay Agreement, signed by the states of Maryland, Virginia, Pennsylvania, the<br />
District of Columbia, the Chesapeake Bay Commission and EPA, is a series of guidelines designed to<br />
improve the quality of the life and water in and around the Chesapeake Bay. The guidelines of the<br />
policy in terms of water quality are to achieve and maintain the 40% nutrient reduction goal of 1987<br />
based on 1985 pollutant discharge levels, develop nutrient and sediment loading criteria, limits and<br />
water quality standards, eliminate the discharge of chemical contaminants and restore the Anacostia<br />
River to previously established water quality and wildlife habitat standards. As the agreement<br />
represents a partnership arrangement, compliance is non-regulatory. The selected CSS LTCP will<br />
help move the region closer to achieving its goals. It is also expected that the Chesapeake Bay<br />
Program, the organization that administers the Chesapeake Bay Agreement, will be involved in the<br />
review of WQS and the WASA LTCP.<br />
2.5 SENSITIVE AREAS<br />
2.5.1 CSO Policy Requirements<br />
The CSO Policy states that sensitive areas are to be determined by the NPDES Permitting Authority in<br />
coordination with State and Federal Agencies. For WASA, the NPDES Permitting Authority is<br />
Region III of EPA, and the District Government functions as the State regulatory agency. The CSO<br />
Policy indicates that sensitive areas may include the following:<br />
<br />
<br />
<br />
<br />
<strong>Water</strong>s designated as Outstanding National Resource <strong>Water</strong>s (ONRW)<br />
National Marine Sanctuaries<br />
Public drinking water intakes<br />
<strong>Water</strong>s designated as protected areas for public water supply intakes<br />
\\Gh-wash\ENG 1160\LTCP\LTCP Final\Sec 2.doc 2-13 FINAL - July 2002
Existing Conditions<br />
<br />
<br />
<br />
Shellfish beds<br />
<strong>Water</strong>s with threatened or endangered species and their habitat<br />
<strong>Water</strong>s with primary contact recreation<br />
For such areas, the CSO Policy indicates the LTCP should:<br />
a. Prohibit new or significantly increased overflows;<br />
b. i. Eliminate or relocate overflows that discharge to sensitive areas wherever<br />
physically possible and economically achievable, except where elimination or<br />
relocation would provide less environmental protection than additional treatment;<br />
or<br />
ii. Where elimination or relocation is not physically possible and economically<br />
achievable, or would provide less environmental protection than additional<br />
treatment, provide the level of treatment for remaining overflows deemed necessary<br />
to meet WQS for full protection of existing and designated uses. In any event, the<br />
level of control should not be less than those described in Evaluation of Alternatives<br />
below; and<br />
c. Where elimination or relocation has been proven not to be physically possible and<br />
economically achievable, permitting authorities should require, for each subsequent<br />
permit term, a reassessment based on new or improved techniques to eliminate or<br />
relocate, or on changed circumstances that influence economic achievability. (EPA,<br />
1994)<br />
2.5.2 General Assessment<br />
CSO oufalls can discharge to the following receiving waters:<br />
<br />
<br />
<br />
The Potomac River (below Three Sisters Islands)<br />
The Anacostia River (below East Capitol Street)<br />
Rock Creek (below Military Road)<br />
Table 2-7 compares the existing uses of District waters receiving CSO discharges to sensitive areas<br />
classifications:<br />
\\Gh-wash\ENG 1160\LTCP\LTCP Final\Sec 2.doc 2-14 FINAL - July 2002
Existing Conditions<br />
Table 2-7<br />
Comparison of District <strong>Water</strong>s to Sensitive Areas Classifications<br />
Sensitive Areas Classification<br />
<strong>Water</strong>s Designated as Outstanding National<br />
Resource <strong>Water</strong>s (ONRW)<br />
National Marine Sanctuaries<br />
Public drinking water intakes<br />
<strong>Water</strong>s designated as protected areas for<br />
public water supply intakes<br />
Shellfish beds<br />
Assessment<br />
None of the waters are designated ONRW<br />
None of the waters are National Marine Sanctuaries<br />
None of the waters have public water supply intakes<br />
None of the waters are designated as a protected area for<br />
public water supply.<br />
None of the waters support shellfishing.<br />
The two remaining classifications, waters with threatened or endangered species and primary contact<br />
recreation, are described below.<br />
2.5.3 <strong>Water</strong>s With Threatened or Endangered Species or Their Habitat<br />
Two federally listed species have been identified in the vicinity of the receiving waters in the District<br />
as follows:<br />
<br />
Hay’s Spring Amphipod (Stygobromus hayi) – this is a federally listed endangered<br />
species which occurs in Rock Creek at two locations: south of Military Road<br />
approximately between Nicholson and Emerson Streets, NW and approximately between<br />
the National Zoo and the Connecticut Avenue Bridge (See Figure 2-2, end of this<br />
section). These are the only known locations of the amphipod in the country. The<br />
amphipod is a small crustacean (resembling a tiny shrimp) about one-quarter inch long<br />
that lives in decaying deciduous leaf litter and mud at the exit of springs and groundwater<br />
seeps. The springs in Rock Creek are reported to issue forth from crevices in rocks. The<br />
species is believed to feed on decaying leaves, organic matter and decomposer bacteria<br />
and fungi found on organic matter. The species was first discovered in 1938, and was<br />
listed in 1982. One of the reasons for its listing was reportedly its vulnerability to<br />
extinction due to its extremely restricted distribution. Little is known about the species,<br />
but it is reported to be adversely affected by high water flows/flooding in Rock Creek,<br />
pollution of the groundwater and surface water, and siltation (USFWS, 2000a, 2000b)<br />
<br />
Bald Eagle (Haliaeetus leucocephalus) – the bald eagle is a federally listed threatened<br />
species. In 1995, the species was reclassified from endangered to threatened due to its<br />
recovery. Active bald eagle nest sites are reported just south of the Wilson Bridge in<br />
Maryland, and near the confluence of the Potomac and Anacostia Rivers (See Figure 2-<br />
1). During nesting season, eagles are typically limited to areas within one mile of their<br />
nest sites. However, eagles may venture much farther from their nest sites outside<br />
\\Gh-wash\ENG 1160\LTCP\LTCP Final\Sec 2.doc 2-15 FINAL - July 2002
Existing Conditions<br />
nesting season. Numerous foraging bald eagles have been observed within the District<br />
along the Potomac shoreline between the Wilson Bridge and the Blue Plains Wastewater<br />
Treatment <strong>Plan</strong>t. In addition, it is reported that bald eagles may occur sporadically at any<br />
location along the Potomac River or mainstem Anacostia Rivers. (USFWS, 2000a,<br />
2000b)<br />
2.5.4 <strong>Water</strong>s With Primary Contact Recreation<br />
District of Columbia regulations list two uses for each water body in the District as follows: the<br />
current use and the designated use. The current use is the use which is generally and usually met in<br />
the water body in spite of numeric water quality criteria which may not be met sometimes. The<br />
designated use is the use specified for the water body in the water quality standards whether or not it<br />
is being attained. The D.C. Department of Health (DOH) has established the current use of the<br />
Anacostia, Potomac and Rock Creek as Class B, secondary contact recreation and aesthetic<br />
enjoyment. None of the waters are used for primary contact recreation. Indeed, a ban on swimming<br />
in waters of the District was issued in 1971. The designated use of the waters includes class A,<br />
primary contact recreation (<strong>DC</strong> Register, 2000). A review of the literature was conducted to identify<br />
the past uses of the receiving waters and the occurrence of facilities such as beaches which would<br />
facilitate primary contact recreation. This review is summarized below:<br />
Past Uses<br />
Anacostia River<br />
Prior to the arrival of Europeans in 1608, many wetlands were located along the banks of the<br />
Anacostia River. Settlement along the Anacostia River for tobacco farming resulted in the<br />
use of the Anacostia River as a shipping channel for trade. Bladensburg emerged as the<br />
leading tobacco trading port and the river was reported to be navigable north of the town in<br />
1742. As development and farming increased along the river, erosion on the banks filled the<br />
river, reducing its navigability. Dredging of the channel first began around 1800 to allow<br />
farmers relying on Bladensburg to continue to use the river to market their products. By the<br />
mid 1800s, siltation had completely isolated Bladensburg as ships could no longer reach this<br />
port town. By 1876, dredging of the river occurred at regular intervals to keep up with<br />
worsening siltation problem. (Engineering Science, 1989).<br />
The dredging process created tidal mud flats on the banks of the river. The rich sediments in<br />
the river mud combined with runoff and raw sewage to create a haven for mosquitoes. The<br />
mosquitoes began to convey malaria to riverfront residents and workers, reaching epidemic<br />
proportions in the late 1890s. Beginning in 1902 Congress approved funds for land<br />
reclamation of the mud flats up to the Navy Yard Bridge. Dredging and land reclamation<br />
continued all along the Anacostia River through the 1920s and a seawall was constructed on<br />
the riverbanks by the Army Corps of Engineers to contain the dredged material. By 1930, the<br />
\\Gh-wash\ENG 1160\LTCP\LTCP Final\Sec 2.doc 2-16 FINAL - July 2002
Existing Conditions<br />
Anacostia River was contained to its present banks, the mud flats reclaimed, and malaria<br />
mostly eradicated. Around this time, the Federal Government established Kingman Lake and<br />
other protected parklands along the shores of the river (Engineering-Science, 1989).<br />
During the suburban expansion of the 1940s and 1950s, siltation and pollution increased in<br />
the Anacostia River and its health decreased accordingly. From the 1940s – 1960s, marinas<br />
were established along the western shore of the river just north of the Navy Yard, changing<br />
the main use of the river from commercial to recreational (Engineering-Science, 1989).<br />
<br />
Potomac River<br />
Commercial activity began early in the 1700s in the Georgetown area at the outlet of Rock<br />
Creek. A prominent shipping route which came to be known as the Georgetown Channel<br />
existed at the time extending from Easby Point to the south. Eventually, due to the expansion<br />
of tobacco and grain farming in the Potomac River and Rock Creek watersheds, siltation<br />
problems increased in severity, forcing dredging operations beginning in the 1800s. In 1837,<br />
the US Coast Survey indicated that above <strong>Long</strong> Bridge (at the site of present day 14 th Street<br />
Bridge), the prevailing depth was only 3 feet (Engineering-Science, 1989). Dredging<br />
reopened the Georgetown Channel throughout the 1833 - 1881 period, but only temporarily<br />
due to the severity of the siltation problems. Similar to the Anacostia River, the dredging<br />
produced open mud flats that spurred the growth of malaria-transmitting mosquitoes. Land<br />
reclamation on the Potomac River occurred simultaneously with the work on the Anacostia<br />
River, virtually eliminating the malaria problem by 1930 (Engineering-Science, 1989).<br />
Beginning in 1892 but more pervasively in the 1940s, marinas and boating clubs began to<br />
appear along the banks of the Potomac River, signaling the change in use patterns from<br />
commercial to recreational (Engineering-Science, 1989).<br />
<br />
Rock Creek<br />
Tobacco farming occurred within the Rock Creek watershed beginning in the mid to late<br />
1600s. As more of the land in the Rock Creek watershed became cultivated, siltation grew as<br />
a problem. As early as 1703, a trading post was founded on the eastern shore of Rock Creek<br />
at its confluence with the Potomac River. Throughout the 1700s, Georgetown dominated the<br />
area in terms of trade and commerce as it served as the major trading port for farms along the<br />
upper Rock Creek basin. Historical records indicate that Rock Creek was navigable at this<br />
time up to the present P Street Bridge. Rock Creek was much wider at the confluence in the<br />
1700s - 1800s before land reclamation projects in the 1800s – 1900s narrowed the Potomac<br />
River to its present width. Due to the limited navigability of Rock Creek, it was not used as a<br />
principal shipping channel above Georgetown. (Engineering-Science, 1989).<br />
\\Gh-wash\ENG 1160\LTCP\LTCP Final\Sec 2.doc 2-17 FINAL - July 2002
Existing Conditions<br />
In the 1900s, farms were replaced with suburban development. Although the immediate area<br />
around Rock Creek was surrounded by parkland, the characteristics of flows in the creek<br />
changed substantially due to increased imperviousness of the watershed.<br />
Past Public Beaches/Facilities<br />
A review of published records associated with the three waterways indicate the following:<br />
<br />
Anacostia River<br />
No records of public beaches or swimming locations on the Anacostia River have been found<br />
in the literature. However, it is likely that river bathing and pleasure swimming was<br />
practiced to some degree in the river at various locations in the past.<br />
<br />
Potomac River<br />
River bathing was reportedly common in the pre-colonial and colonial period. The literature<br />
indicates that in the 1920s, Decoration Day was considered the customary opening day for<br />
water sports on the Potomac including swimming. Hundreds of swimmers reportedly took<br />
part in opening day ceremonies. Two public facilities enabling swimming have been<br />
identified:<br />
o Tidal Basin - a supervised public bathing beach on the Tidal Basin south of the<br />
Washington Monument operated from 1918-1924. Officially, the beach was closed<br />
at the end of the 1924 season due to pollution.<br />
o Above the Key Bridge – swimming was reported in the literature from summer<br />
cottages that used to line the sides of the Potomac. In addition, swimming access was<br />
reportedly provided by entrepreneurs who placed floats in the river for swimmers. It<br />
is unclear when swimming from the cottages, camps and commercial floats above<br />
Key Bridge was discontinued. The literature speculates that the acquisition of the<br />
C&O Canal Company property in 1938 by the Federal Government and the<br />
construction of the George Washington Memorial Parkway may have ended<br />
swimming in this portion of the River. (ICPRB, 1982)<br />
As early as 1894 it was reported by the USPHS that fecal bacteria made the water at<br />
certain locations in the Potomac River unsafe for swimming. In 1932, bacterial<br />
contamination forced the closure to swimming of the Potomac River from Three Sisters<br />
Island to Fort Washington. In 1957 the USPHS declared the entire Potomac River unsafe<br />
for swimming (ICPRB, 2000a). On August 27, 1971, the District of Columbia<br />
regulations prohibited all primary contact in any District waterway. Since that time the<br />
ban on swimming has not been lifted.<br />
\\Gh-wash\ENG 1160\LTCP\LTCP Final\Sec 2.doc 2-18 FINAL - July 2002
Existing Conditions<br />
<br />
Rock Creek<br />
As with the Anacostia River, it is likely that creek wading and bathing was practiced to<br />
some degree in Rock Creek in the past. One public facility was identified. It is described<br />
as a bathing beach at 25 th and N Street, NW. The bathing beach was reportedly adjoining<br />
the Francis Junior High School and included a bathhouse. (Washington Post, 1928).<br />
There is also a reference in the literature to swimming in Rock Creek at a location called<br />
“Big Rock” (The Mayflower’s Log, 1935). Its location is unknown.<br />
Current Uses<br />
Today, the 1971 ban on primary contact recreation in all District waters remains in effect. The<br />
waters are not legally used for primary contact recreation. All of the waters are used to some degree<br />
for secondary contact recreation. Many of the marinas built in District waters from the 1890s –<br />
1970s are still in use today. The three primary areas with marinas are the lower east Anacostia just<br />
upstream of the Navy Yard, along the Washington Ship Channel and along the Potomac River in<br />
Georgetown. A boat ramp exists on the east side of the Anacostia along Anacostia Park adjacent to<br />
the railroad bridge just upstream of the Skating Pavilion. The marinas/boat ramps currently in<br />
operation are:<br />
<br />
Anacostia River<br />
- Buzzard Point Marina, 2200 1 st St. SW<br />
- District Yacht Club, 1409 <strong>Water</strong> St. SE<br />
- Washington Yacht Club, 1500 M St. SE<br />
- Anacostia Community Rowing Center, 115 “O” St, SE<br />
- Anacostia Marina, 1900 M St. SE<br />
- National Park East Boat Ramp<br />
- Seafarer’s Boat Club, M St. SE<br />
- James Creek Marina, 200 V St. SW<br />
<br />
Potomac River<br />
- Capital Yacht Club 11 th Street, SW<br />
- Columbia Island Marina, Columbia Island<br />
- Spirit of Washington Cruise Line, 6 th and <strong>Water</strong> Streets, SW<br />
- Washington Marina, 1300 Maine Ave. SW<br />
- Tidal Basin Boat House, 1501 Maine Ave. SW,<br />
- Gangplank Marina, 600 <strong>Water</strong> St. SW<br />
- Thompson Boat Center, Rock Creek Parkway & Virginia Ave., NW<br />
- Jack’s Rental Canoe Rowboats, 3500 K St., NW<br />
- Potomac Boat Club, 3530 <strong>Water</strong> St., NW<br />
- Washington Canoe Club, 3700 K St., NW<br />
\\Gh-wash\ENG 1160\LTCP\LTCP Final\Sec 2.doc 2-19 FINAL - July 2002
Existing Conditions<br />
DOH has issued a health advisory for fish caught in the Anacostia and Potomac Rivers and Rock<br />
Creek due to PCBs and other chemical contaminants which have been found in certain fish species.<br />
DOH recommends that catfish, carp or eel not be eaten. Largemouth bass, sunfish or other fish may<br />
be eaten in limited quantities. Younger and smaller fish of legal size can be eaten. DOH<br />
recommends a catch and release policy.<br />
Commercial activity in District waterways has been almost completely replaced with recreational<br />
activity. However, military ships still port at the Navy Yard and Fort McNair on the southwest side<br />
of the lower Anacostia River.<br />
2.5.5 Findings<br />
An analysis of the District waters with respect to the CSO Policy was conducted and is summarized in<br />
Table 2-8.<br />
Table 2-8<br />
Sensitive Areas Assessment<br />
CSO<br />
Discharge<br />
Receiving<br />
<strong>Water</strong><br />
Segments<br />
Potomac River<br />
(below Three<br />
Sisters Islands)<br />
Anacostia<br />
River<br />
(below<br />
Benning Road)<br />
Current Uses Classification of District <strong>Water</strong>s Receiving CSO Discharges Compared to Sensitive<br />
Areas Classifications or Designations (1)<br />
ONRW<br />
None<br />
None<br />
National<br />
Marine<br />
Sanctuaries<br />
None<br />
None<br />
Threatened or<br />
Endangered<br />
Species or habitat<br />
Threatened Bald<br />
Eagle – sporadic<br />
locations<br />
Threatened Bald<br />
Eagle – sporadic<br />
locations<br />
Primary<br />
Contact<br />
Recreation<br />
Public<br />
<strong>Water</strong><br />
Supply<br />
Intake<br />
PWS<br />
Protected<br />
Area<br />
Shellfish<br />
Bed<br />
None (2) None (3) None None<br />
None (2) None None None<br />
Rock Creek None(4) None<br />
Endangered Hay’s<br />
Spring Amphipod None (2) None None None<br />
– Three locations<br />
Little Falls<br />
Branch<br />
None None None None None None None<br />
Notes:<br />
(1) Classifications or Designations per CSO Policy and WASA’s NPDES Permit<br />
(2) Existing uses include secondary contact recreation such as boating, fishing and wading<br />
(3) The nearest public water supply intake is above the dam at Little Falls, about 4.3 miles above Three Sisters<br />
Islands and upstream of the area impacted by CSOs.<br />
(4) Rock Creek and its tributaries are designated Special <strong>Water</strong>s of the District of Columbia.<br />
The status of the Bald Eagle was recently reclassified from endangered to threatened. This was due<br />
to the significant increase in the bird’s numbers and its expanding range. This increase in the bird’s<br />
proliferation has occurred without the benefit of additional CSO controls. It is likely that any<br />
additional CSO controls identified as part of the LTCP will assist in the continued recovery of the<br />
eagle. In addition, the eagle is reported to occur sporadically along the main stem of the Potomac<br />
and Anacostia Rivers. The intent of the CSO Policy is to focus on portions of waterways which may<br />
\\Gh-wash\ENG 1160\LTCP\LTCP Final\Sec 2.doc 2-20 FINAL - July 2002
Existing Conditions<br />
be classified as sensitive. It is impractical and inconsistent with the CSO Policy to classify entire<br />
waterways as sensitive due to the possible sporadic occurrence of eagles anywhere along their length.<br />
None of the District waters are currently used for primary contact recreation, while all of the waters<br />
are used to some degree for secondary contact recreation. The designated use of the waters includes<br />
primary contact recreation. Research of the literature indicates that while swimming was practiced in<br />
each receiving water to some degree in the past, there were limited public facilities enabling primary<br />
contact recreation. No facilities were identified in the Anacostia River. One facility which has long<br />
been abandoned has been identified in Rock Creek. Two facilities were identified in the Potomac<br />
River. One facility in the Potomac is the Tidal Basin, which does not receive CSO discharges. The<br />
other area was upstream of the Key Bridge, which is upstream of the majority of CSO discharges.<br />
There are no known current plans for construction of public swimming facilities along the<br />
waterways. Given that the intent of the CSO Policy is to focus on portions of waterways which may<br />
be classified as sensitive, it is impractical to classify all waterways as sensitive based on the future<br />
potential for primary contact recreation.<br />
The endangered Hay’s Spring amphipod is reported to have habitats in two limited sections of Rock<br />
Creek: just downstream of the Zoo and at a location upstream of the Zoo. These sections of Rock<br />
Creek can receive CSO discharges from the outfalls to Rock Creek. As a result, these portions of<br />
Rock Creek are eligible for consideration as sensitive areas, pending determination by regulatory<br />
agencies. This has been considered in greater detail in Section 9. Figure 2-2 shows the general<br />
location of the reported amphipod colonies. No other District waters are proposed for consideration<br />
as sensitive areas as defined by the CSO Policy.<br />
\\Gh-wash\ENG 1160\LTCP\LTCP Final\Sec 2.doc 2-21 FINAL - July 2002
Existing <strong>System</strong>s<br />
Section 3<br />
Existing <strong>System</strong>s<br />
3.1 INTRODUCTION<br />
The District of Columbia <strong>Water</strong> and <strong>Sewer</strong> Authority (WASA) operates and maintains the<br />
wastewater collection and treatment system for the District of Columbia, and also provides<br />
wastewater treatment for surrounding areas including parts of suburban Virginia and Maryland. The<br />
service area for the Blue Plains Wastewater Treatment <strong>Plan</strong>t (BPWWTP) covers approximately 735<br />
square miles.<br />
With a population of approximately 600,000, the District of Columbia occupies 61 square miles<br />
within the Blue Plains Service Area. Storm water and sanitary wastewater flows in this area are<br />
collected as follows:<br />
Separate storm water and sanitary sewer collection systems cover 41 square miles (26,200<br />
acres) and serve a population of approximately 250,000.<br />
A combined storm water and sanitary sewer collection system covers 20 square miles (12,955<br />
acres) serves a population of approximately 350,000.<br />
The remainder of this section provides more specific information on the configuration of the existing<br />
systems.<br />
3.2 COMBINED SEWER SYSTEM (CSS)<br />
The CSS generally serves the central, older portions of the District of Columbia. Approximately<br />
66% of this area drains to the lower Anacostia River, with the remainder tributary to Rock Creek and<br />
the Potomac River.<br />
There are 60 outfalls listed in WASA’s current NPDES permit. One outfall discharges treated excess<br />
flow at the BPWWTP, while the remainder are located at various points across the District. The<br />
outfalls are distributed as follows:<br />
<br />
<br />
17 are located on the Anacostia River<br />
14 are located on the Potomac River (1 abandoned, CSO No. 30; includes one outfall at Blue<br />
Plains WWTP, and one outfall at Little Falls Branch, tributary to the Potomac)<br />
29 Rock Creek (1 abandoned, CSO No. 55)<br />
Table 3-1 lists the outfalls, their location, associated CSO drainage areas and receiving waters. The<br />
locations of the outfalls and combined sewersheds are presented on Figure 3-1 through 3-3.<br />
\\Gh-wash\ENG 1160\LTCP\LTCP Final\Sec 3.doc 3-1 FINAL - July 2002
Existing <strong>System</strong>s<br />
NPDES<br />
Outfall<br />
No.<br />
001<br />
002<br />
003<br />
004<br />
005<br />
006<br />
007<br />
008<br />
Table 3-1<br />
Summary of Permitted Outfalls<br />
Permitted Outfall Location<br />
Drainage<br />
CSO Drainage Area Area<br />
(acres) Receiving <strong>Water</strong><br />
Blue Plains Wastewater Treatment<br />
<strong>Plan</strong>t, Excess Flow Treatment Outfall Entire Service Area -- Potomac River<br />
Blue Plains Wastewater Treatment<br />
<strong>Plan</strong>t Main Outfall Entire Service Area -- Potomac River<br />
Bolling Air Force Base, at Giavanolli<br />
and Chanute, SW Entire Service Area -- Potomac River<br />
No tributary area,<br />
Downstream side of Fredrick<br />
Emergency Bypass for<br />
Douglas Bridge<br />
combined Poplar Pt. P.S. -- Anacostia River<br />
Across from Navy Yard, aligned with<br />
Parsons Ave., SE Fort Stanton 65.51 Anacostia River<br />
Good Hope Road and Welsh<br />
Memorial Bridge Fort Stanton 13.56 Anacostia River<br />
Between 11 th St. and Anacostia<br />
Bridges, SE Fort Stanton 188.13 Anacostia River<br />
Anacostia Avenue, west of Blaine St.<br />
NE<br />
009 O St. Sewage Pumping Station, SE<br />
010 O St. Sewage Pumping Station, SE<br />
011 Main Sewage Pumping Station, SE<br />
011(a)<br />
Main Sewage Pumping Station, SE<br />
No tributary area,<br />
Emergency Bypass for<br />
separate Anacostia Main<br />
Interceptor -- Anacostia River<br />
B St./N.J. Ave<br />
41.27 Anacostia River<br />
B St/N.J Ave-<br />
O St. pumped 732.72 Anacostia River<br />
012 Main Sewage Pumping Station, SE Tiber Creek 1,153.83 Anacostia River<br />
013<br />
Southeast Federal Center, aligned<br />
with 4 th St. Canal Street <strong>Sewer</strong> 20.10 Anacostia River<br />
014 Navy Yard, aligned with 6 th St., SE<br />
Navy Yard/M St.: 6 th St –<br />
7 th St 128.06 Anacostia River<br />
Navy Yard, aligned with 9th Street,<br />
015 SE Navy Yard/9 th St-M St. 30.82 Anacostia River<br />
016 12th and O Streets, SE<br />
Navy Yard/M St.: 12 th St.–<br />
9 th St. 152.58 Anacostia River<br />
017 M and <strong>Water</strong> Street, SE<br />
Navy Yard/M St.: 14 th to<br />
Penn Ave. 259.91 Anacostia River<br />
East of Barney Circle and South of<br />
018 Pennsylvania Avenue Bridge, SE Barney Circle 48.93 Anacostia River<br />
019 Adjacent to Service Drive behind Northeast Boundary 4,242.39 Anacostia River<br />
\\Gh-wash\ENG 1160\LTCP\LTCP Final\Sec 3.doc 3-2 FINAL - July 2002
Existing <strong>System</strong>s<br />
NPDES<br />
Outfall<br />
No.<br />
020<br />
Permitted Outfall Location<br />
swirl facility and D.C. General<br />
Hospital<br />
Table 3-1<br />
Summary of Permitted Outfalls<br />
CSO Drainage Area<br />
Drainage<br />
Area<br />
(acres)<br />
Receiving <strong>Water</strong><br />
Rock Creek Parkway and<br />
Independence, NW Easby Point 573.14 Potomac River<br />
021 Rock Creek Parkway and C St., NW Slash Run 473.78 Potomac River<br />
022 Rock Creek Parkway and G St., NW I St.- 22 nd St., NW 125.23 Potomac River<br />
023 South of 30 th and K Streets, NW West of Rock Creek<br />
Potomac River<br />
Diversion <strong>Sewer</strong> – K St.<br />
024 South of 30 th and K Streets, NW<br />
To Wisconsin Ave. 41.66 Potomac River<br />
025 South of 31st and K Streets, NW 31 st & K St NW 9.89 Potomac River<br />
026<br />
Wisconsin Avenue and <strong>Water</strong> Street,<br />
NW <strong>Water</strong> St District (WRC) 13.88 Potomac River<br />
027 33 rd and <strong>Water</strong> Sts., NW Georgetown 179.38 Potomac River<br />
028<br />
Key bridge and Whitehurst Freeway,<br />
NW 37 th St-Georgetown 21.06 Potomac River<br />
029<br />
Adjacent to C&O Canal, aligned with<br />
38 th St. NW College Pond 300.79 Potomac River<br />
030 Fox Hall and Canal Road (Abandoned) -- Potomac River<br />
031<br />
Rock Creek Pkwy and Pennsylvania<br />
Avenue, NW.<br />
032 26th and M Street, NW.<br />
033<br />
034<br />
035<br />
Across street from St. Francis Jr.<br />
High and aligned with N St., NW.<br />
Penn Ave-Middle East<br />
Rock Creek 1.11 Rock Creek<br />
26 th St- M St. -Middle E.<br />
Rock Creek 10.38 Rock Creek<br />
N St.-25 th –Middle E. Rock<br />
Creek 13.08 Rock Creek<br />
Just west of St. Francis Jr. High and<br />
north of N St., NW Slash Run (1) Rock Creek<br />
P St. Bridge and Rock Creek<br />
Parkway Northwest Boundary 546.69 Rock Creek<br />
036 22nd Street, South of Q Street NW. Mass Ave & 24 th – E. Rock 69.76 Rock Creek<br />
037<br />
038<br />
<strong>Water</strong>side Dr. and Rock Creek<br />
Parkway<br />
Between arch footbridge and<br />
Connecticut Ave., north of Kalorama<br />
Circle, NW.<br />
039 Connecticut Avenue Bridge and<br />
Kalorama Circle West – E.<br />
Rock Creek 16.61 Rock Creek<br />
Kalorama Circle East – E.<br />
Rock Creek 9.54 Rock Creek<br />
Belmont Rd – East Rock<br />
Creek 54.25 Rock Creek<br />
\\Gh-wash\ENG 1160\LTCP\LTCP Final\Sec 3.doc 3-3 FINAL - July 2002
Existing <strong>System</strong>s<br />
Table 3-1<br />
Summary of Permitted Outfalls<br />
NPDES<br />
Outfall<br />
No.<br />
Permitted Outfall Location<br />
Rock Creek Parkway, NW.<br />
CSO Drainage Area<br />
Drainage<br />
Area<br />
(acres)<br />
Receiving <strong>Water</strong><br />
040<br />
Aligned with Biltmore Rd.,<br />
between Connecticut Ave and<br />
Ellington Bridge.<br />
041 Beach Dr. and Ontario Pl., NW<br />
042 Harvard St. and Beach Dr NW.<br />
043<br />
Upstream of Harvard St. and Beach<br />
Dr NW.<br />
044 Kenyon Street and Beach Dr.., NW.<br />
045<br />
046<br />
047<br />
048<br />
North of Beach Dr. and Walbridge Pl,<br />
NW.<br />
Piney Branch Parkway and Park<br />
Road, NW.<br />
Piney Branch Parkway and Ingleside<br />
Terrace<br />
South of Piney Branch Parkway and<br />
17 th St.<br />
Biltmore St – East Rock<br />
Creek 24.52 Rock Creek<br />
Ontario Rd – Upper E.<br />
Rock Creek 27.17 Rock Creek<br />
Quarry Rd – Upper E.<br />
Rock Creek 36.22 Rock Creek<br />
Irving St. – Upper E. Rock<br />
Creek 70.31 Rock Creek<br />
Kenyon St. – Upper E.<br />
Rock Creek 17.07 Rock Creek<br />
LamontSt. – Upper E. Rock<br />
Creek 17.17 Rock Creek<br />
Park Road – Upper E. Rock<br />
Creek 17.38 Rock Creek<br />
Ingleside Terr. – Upper E.<br />
Rock Crk. 18.16 Rock Creek<br />
Oak St-Mt. Pleasant Upper<br />
E. Rock Creek 26.06 Rock Creek<br />
049<br />
North of Piney Branch Parkway and<br />
17 th St. Piney Branch 2,433.20 Rock Creek<br />
050 Rock Creek Parkway and L St., NW<br />
M St. – 27 th St – West<br />
Rock Creek 36.41 Rock Creek<br />
051<br />
052<br />
053<br />
054<br />
Across Rock Creek Parkway, aligned<br />
with Olive St., NW.<br />
Olive – 29 th St. – West<br />
Rock Creek 11.87 Rock Creek<br />
Between P and Penna.<br />
Ave Bridges, aligned with O Street,<br />
NW. O St.-31 st St., NW 108.50 Rock Creek<br />
Q St. Bridge and Rock Creek<br />
Parkway, NW. Q St. – West Rock Creek 5.50 Rock Creek<br />
Massachusetts Avenue and Rock<br />
Creek Parkway, NW.<br />
No tributary area, relief for<br />
combined West Rock<br />
Creek Diversion <strong>Sewer</strong> -- Rock Creek<br />
055<br />
Massachusetts Avenue and Rock<br />
Creek Parkway, NW. (Abandoned) -- Rock Creek<br />
No tributary area, relief for<br />
Rock Creek<br />
\\Gh-wash\ENG 1160\LTCP\LTCP Final\Sec 3.doc 3-4 FINAL - July 2002
Existing <strong>System</strong>s<br />
NPDES<br />
Outfall<br />
No.<br />
Permitted Outfall Location<br />
056 Normanstone Dr. and Rock Creek<br />
Parkway, NW.<br />
057<br />
058<br />
28th Street and Rock Creek Parkway,<br />
NW<br />
Table 3-1<br />
Summary of Permitted Outfalls<br />
CSO Drainage Area<br />
combined West Rock<br />
Creek Diversion <strong>Sewer</strong><br />
Drainage<br />
Area<br />
(acres)<br />
--<br />
Receiving <strong>Water</strong><br />
Cleveland – 28 th St. &<br />
Conn. Ave. 84.50 Rock Creek<br />
Connecticut Avenue and Rock Creek<br />
Parkway, NW. Connecticut Avenue 5.24 Rock Creek<br />
059 16th and Rittenhouse Streets, NW. Separated (Luzon Valley) -- Rock Creek<br />
Clara Barton Parkway and Broad St.,<br />
Potomac River<br />
060 NW (2) --<br />
tributary<br />
Total CSO Drainage Area 12,477.76<br />
Notes (1): Common Drainage Area shared with CSO outfall 021.<br />
(2): CSO 060 is Little Falls Emergency Bypass located just outside the District of Columbia on WSSC’s<br />
section of the separate Potomac Interceptor. WASA feels this outfall has been placed on their permit in<br />
error and is working with EPA to have it removed.<br />
3.2.1 Collection <strong>System</strong><br />
A schematic of the major conveyance pipelines and pumping stations in the WASA’s sewer system is<br />
presented in Figure 3-4. It is convenient to think of the drainage areas and CSS as being divided into<br />
two subsystems - an Anacostia system and a Potomac/Rock Creek system. The Northeast Boundary,<br />
Navy Yard, Fort Stanton, and Tiber Creek drainage areas are part of the Anacostia system. The other<br />
drainage areas are part of the Potomac/Rock Creek system, with the B St/NJ Ave drainage area<br />
serving as a link between the Anacostia and Potomac/Rock Creek systems. The ratio of maximum<br />
design capacity to dry weather capacity of the two systems is significantly different. Prior studies<br />
(Board of Engineers, 1955) indicate this factor is approximately two for the Northeast Boundary<br />
Trunk <strong>Sewer</strong>. However, this factor is typically significantly higher for trunk sewers and interceptors<br />
serving the Potomac/Rock Creek system, allowing them to carry more wet weather flow before<br />
discharging to receiving waters.<br />
\\Gh-wash\ENG 1160\LTCP\LTCP Final\Sec 3.doc 3-5 FINAL - July 2002
Existing <strong>System</strong>s<br />
Under the Intermunicipal Agreement (IMA) with surrounding jurisdictions, WASA conveys up to an<br />
average of 212 mgd of separate sanitary flow from outside District boundaries through both its<br />
combined and separate sanitary systems to the BPWWTP. The IMA flows in the separate sanitary<br />
system as well as the combined system have substantial peaks during wet weather events. In addition<br />
to the flow from surrounding jurisdictions, WASA also conveys and treats the wastewater from<br />
federal facilities in the District. Federal properties cover about 25% of the District’s total land area<br />
and about 14% in the combined sewer area as shown in Figure 3-5. Modeling conducted as part of<br />
the <strong>Long</strong> <strong>Term</strong> <strong>Control</strong> <strong>Plan</strong> indicates that approximately 18% of the combined sewer overflow is<br />
contributed by Federal properties on a system-wide annual average basis. This percentage is greater<br />
than the direct percentage of land area because many Federal properties in the combined sewer area<br />
are in highly urbanized locations with little pervious area.<br />
Streets<br />
<strong>Water</strong><br />
Federal Facilities<br />
Parks<br />
CSO Area<br />
<strong>DC</strong> Boundary<br />
Figure 3-5<br />
Federal Properties<br />
Virtually all the wastewater that is conveyed to BPWWTP, including the contribution from<br />
surrounding jurisdictions and federal facilities, must be pumped. The major facilities that pump<br />
wastewater to Blue Plains are as follows:<br />
\\Gh-wash\ENG 1160\LTCP\LTCP Final\Sec 3.doc 3-10 FINAL - July 2002
Existing <strong>System</strong>s<br />
<br />
<br />
<br />
<br />
<br />
<br />
<br />
Potomac Pumping Station: This station was designed to have a firm capacity of 460 mgd and<br />
pumps the wastewater from the Potomac/Rock Creek system to BPWWTP via force mains<br />
that cross under the Anacostia River at the confluence with the Potomac River. It also<br />
conveys wastewater loads from surrounding jurisdictions that enter the District via the Rock<br />
Creek Main Interceptor and the Potomac Interceptor.<br />
Main Pumping Station: This station is split into a sanitary side and a storm side. The sanitary<br />
side primarily handles dry weather sanitary flows, designed to have a firm capacity of 240<br />
mgd. It pumps wastewater from the Tiber Creek and B Street/New Jersey Ave. drainage<br />
areas, as well as flows from the Potomac/Rock Creek system that enter the B St/NJ Ave.<br />
Trunk <strong>Sewer</strong>, under the Anacostia River via siphons to BPWWTP. The storm side is used<br />
during wet weather events, with a firm capacity of 400 mgd, to lift storm overflows into the<br />
Anacostia River and prevent flooding of basements and streets in the surrounding low-lying<br />
drainage areas.<br />
“O” Street Pumping Station: Like the Main Pumping Station, this station is split into sanitary<br />
and storm sides and is designed to have firm capacities of 45 and 500 mgd, respectively. The<br />
sanitary side pumps wastewater from the Southwest Interceptor, which serves a low-lying<br />
area, to one of the siphons that run under the Anacostia and to BPWWTP. The storm side<br />
pumps combined sewage from the B Street/New Jersey Avenue Relief <strong>Sewer</strong>, which serves a<br />
low-lying area of the B Street/New Jersey Avenue drainage area, to the Anacostia River.<br />
Poplar Point Pumping Station: This station was designed to have a firm capacity of 45 mgd<br />
and pumps combined wastewater from the Anacostia Main Interceptor to the Outfall <strong>Sewer</strong>s<br />
that lead to BPWWTP. The Anacostia Main Interceptor conveys the combined and sanitary<br />
flows from the portion of the District that is east of the Anacostia River.<br />
Eastside Pumping Station: This station was designed to have a firm capacity of 45 mgd and<br />
pumps separate sanitary wastewater from the East Side Interceptor Relief <strong>Sewer</strong>. During<br />
storm events it also transports the material removed by the Northeast Boundary Swirl Facility<br />
(NEBSF). All flows are pumped across the Anacostia River via a force main and into the<br />
108” Anacostia River Force Main. The operation of the NEBSF is discussed further in<br />
Section 3.2.3.<br />
Rock Creek Pumping Station: This station was designed to have a firm capacity of 40 mgd<br />
and pumps combined wastewater flows from the Georgetown and West Rock Creek Area on<br />
to the Potomac Pumping Station for transport to BPWWTP.<br />
WSSC Anacostia Pumping Stations #1 and #2: As stipulated in the IMA, these stations can<br />
pump an average of 83.2 mgd and a peak of 185.0 mgd of WSSC flow into the 108”<br />
Anacostia River Force Main. Some District sanitary sewers near the boundary drain to<br />
Maryland because of the nature of the topography. As a result, these pumping stations are<br />
permitted to convey an additional 14 mgd of District flow. This results in a net peak of 199<br />
mgd (185 mgd WSSC flow + 14 mgd District flow).<br />
\\Gh-wash\ENG 1160\LTCP\LTCP Final\Sec 3.doc 3-11 FINAL - July 2002
Existing <strong>System</strong>s<br />
The capacities of the pumping stations are summarized in Table 3-2.<br />
Table 3-2<br />
Pumping Station Design Capacities<br />
Facility Design Firm Capacity 1<br />
Potomac Pumping Station<br />
460 mgd<br />
Main Pumping Station<br />
Sanitary Pumps – 240 mgd<br />
Storm Pumps – 400 mgd<br />
O Street Pumping Station<br />
Sanitary Pumps – 45 mgd<br />
Storm Pumps – 500 mgd<br />
Poplar Point Pumping Station<br />
45 mgd<br />
East Side Pumping Station<br />
45 mgd<br />
Rock Creek Pumping Station<br />
40 mgd<br />
WSSC’s Anacostia Pumping Station 199 mgd peak<br />
No. 1 and 2<br />
Notes: 1. Designed to have indicated capacity with largest pump out of service.<br />
3.2.2 Blue Plains Wastewater Treatment <strong>Plan</strong>t<br />
A process flow schematic for the BPWWTP is shown in Figure 3-6. The facility is rated for an<br />
annual average flow of 370 mgd, and the treatment train consists of screening, grit removal, primary<br />
treatment, secondary treatment, nutrient removal, filtration and disinfection. During wet weather<br />
events, flows up to 740 mgd can receive treatment for up to 4 hours. After the first 4 hours, the<br />
treatment capacity is reduced to 511 mgd to protect the biological process. Additional flows of up to<br />
336 mgd that exceed the treatment capacity of the plant receive excess flow treatment, which consists<br />
of screening, grit removal, primary treatment and disinfection before discharge to the Potomac River.<br />
This results in an overall plant capacity of 1076 mgd for the first four hours and 847 mgd thereafter.<br />
The amount of flow that is diverted and the duration during which it is diverted to excess flow<br />
treatment depends on the flow rates and durations of the storm events.<br />
3.2.3 Existing CSO <strong>Control</strong>s and Programs<br />
In addition to the excess flow treatment capacity of BPWWTP, WASA has several facilities and<br />
programs in place to address CSOs. The Phase I CSO <strong>Control</strong>s completed in 1991 include the<br />
Northeast Boundary Swirl Facility and the inflatable dam system for in-system storage. These and<br />
other CSO controls are described below.<br />
\\Gh-wash\ENG 1160\LTCP\LTCP Final\Sec 3.doc 3-12 FINAL - July 2002
Existing <strong>System</strong>s<br />
CSO Regulators: Regulator structures associated with each CSO outfall control the amount of flow<br />
diverted to interceptors, which convey wastewater to BPWWTP. During dry weather, flows are<br />
diverted to BPWWTP for treatment. During wet weather events, the regulators divert combined<br />
sewage, the mixture of sanitary wastewater and storm water, within the system up to design<br />
capacities. When flows exceed the design capacities of the system, the regulator structures divert<br />
excess flow to CSO outfalls, which discharge to the receiving waters. Release of the combined sewer<br />
overflow to the outfalls is necessary to prevent flooding in homes, businesses, and streets. The<br />
frequency and volume of discharge from each of these structures varies depending on the relative<br />
capacity of the downstream interceptor, the hydraulic geometry of the overflow structure itself, storm<br />
intensities and duration, and the size of the contributing drainage area.<br />
Northeast Boundary Swirl Facility (NEBSF): The NEBSF is located at the south end of the RFK<br />
Stadium parking lot, on the west bank of the Anacostia River, and adjacent to the East Side Pump<br />
Station. This facility went into operation in January 1991. During storm events, this facility<br />
provides treatment and disinfection for up to 400 mgd of combined sewer overflow before<br />
discharging to the Anacostia River at CSO Outfall 019. Flow in excess of 400 mgd overflows<br />
directly to the Anacostia River without treatment and disinfection. The routing of flows to the<br />
NEBSF and to the Anacostia River is controlled by three inflatable dams. Treatment processes<br />
include mechanical screening of influent combined sewage, followed by concentration of solid<br />
materials in three swirl concentrator tanks and disinfection of the treated effluent. The concentrated,<br />
solids-bearing underflow is discharged to the 48-inch East Side Interceptor Relief <strong>Sewer</strong>, where it<br />
flows by gravity to the East Side Pumping Station. The East Side Pumping Station then pumps the<br />
discharge to BPWWTP as described earlier in Section 3.2.1.<br />
In-<strong>System</strong> Storage: WASA operates and maintains twelve inflatable dams at eight different locations.<br />
The structure number, location and number of dams per site are presented in Table 3-3. The<br />
inflatable dams consist of multi-ply elastomeric (i.e., “rubber”) fabric dams installed in major<br />
overflow conduits within the combined sewer system. The installation consists of the dam,<br />
attachment hardware, mechanical inflation equipment housed in a nearby vault, air piping and valves,<br />
an over-pressure blowoff tank and an automatic control system. The objective of the inflatable dam<br />
installation is to increase the effective depth to which the sewage must rise in the combined sewer<br />
before overflows occur. The effect of the installation is to retain a greater volume of combined<br />
sewage flow resulting from low to moderate intensity storms by maximizing storage within the CSS.<br />
During higher intensity storms, when the full carrying capacity of the overflow conduit is required to<br />
prevent upstream flooding, the dam is deflated automatically based on a signal from an upstream<br />
level sensor or a supervisory override command from an operator. During dry weather conditions the<br />
dams are normally maintained fully inflated under low pressure. The six dams at structures 14, 15,<br />
15a, and 16 are currently out of service. However, an effort is currently underway to upgrade and<br />
replace inflatable dams and appurtenances at all existing inflatable dam locations.<br />
\\Gh-wash\ENG 1160\LTCP\LTCP Final\Sec 3.doc 3-14 FINAL - July 2002
Existing <strong>System</strong>s<br />
Table 3-3<br />
Inflatable Dam Locations<br />
Structure<br />
Number Location <strong>Combined</strong> <strong>Sewer</strong><br />
Number of<br />
Dams<br />
14 Main Pumping Station – West Side B St. – New Jersey Ave. Trunk <strong>Sewer</strong> 2<br />
15 South Capitol and E Sts., SE B St. – New Jersey Ave. Trunk <strong>Sewer</strong> 1<br />
15a Half and L Sts., SE B St. – New Jersey Ave. Trunk <strong>Sewer</strong> 1<br />
16 Main Pumping Station – East Side Tiber Creek Trunk <strong>Sewer</strong> 2<br />
24 RFK Memorial Stadium – South Parking Lot Northeast Boundary <strong>Sewer</strong> 3<br />
34 23rd and Constitution, NW Easby Point Trunk <strong>Sewer</strong> 1<br />
35 Kennedy Center - East Parking Lot East Rock Creek Diversion <strong>Sewer</strong> 1<br />
52 22nd St., between M and N Sts., NW Slash Run Trunk <strong>Sewer</strong> 1<br />
Total Number of Inflatable Dams 12<br />
Nine Minimum <strong>Control</strong>s: In addition to the aforementioned devices and facilities, WASA also has a<br />
Nine Minimum <strong>Control</strong>s (NMC) program in place to address the issue of CSO’s. WASA first<br />
provided documentation on its NMC program in a December 1996 report entitled “Nine Minimum<br />
<strong>Control</strong>s Compliance Report”. As part of its continuous improvement effort, WASA prepared a<br />
report titled “<strong>Combined</strong> <strong>Sewer</strong> <strong>System</strong> Nine Minimum <strong>Control</strong>s Summary Report” in July 1999,<br />
which represented an update of the earlier Nine Minimum <strong>Control</strong>s Report submitted to the EPA.<br />
The Summary Report provided an update on various activities undertaken by WASA as part of the<br />
Nine Minimum <strong>Control</strong>s (NMC) program and included recommendations for enhancement of several<br />
activities associated with this program. A “NMC Action <strong>Plan</strong> Report” was prepared in February<br />
2000, which detailed a schedule for implementing the recommended enhancements. Examples of<br />
measures that have been implemented include:<br />
<br />
<br />
<br />
<br />
<br />
<br />
<br />
<br />
<br />
Inspections of critical facilities such as outfalls, regulators, pump stations and tide gates<br />
Maximization of storage in the collection system through the use of inflatable dams<br />
Implementation of a pretreatment program for industrial users<br />
Inspection, maintenance and improvement of regulators and outfalls to prevent and correct<br />
dry weather overflows<br />
Operation of the Northeast Boundary Swirl facility to control CSOs and floatables<br />
Operation of skimmer boats on the Anacostia and screens at certain pump stations to control<br />
floatables<br />
Installation and demonstration evaluation of End-of-Pipe Netting system for floatables<br />
control at CSO Outfall 018<br />
Placement of notification signs at outfalls for public notification<br />
Development of a CSO web page on the D. C. WASA website<br />
\\Gh-wash\ENG 1160\LTCP\LTCP Final\Sec 3.doc 3-15 FINAL - July 2002
Existing <strong>System</strong>s<br />
<br />
Major maintenance projects such as the cleaning of the Eastside Interceptor and the sonar<br />
inspection of the Anacostia siphons<br />
LTCP Development Effort: WASA submitted its LTCP Program <strong>Plan</strong> to EPA in July 1999. An<br />
extensive monitoring program for the LTCP was carried out from August 1999 – June 2000. The<br />
data gathered from this monitoring effort has been used to develop computer models to evaluate<br />
alternatives for mitigating the impact of CSO’s and other major sources of pollution on the receiving<br />
waters. A Draft LTCP was submitted in June 2001. This report describes the proposed Final LTCP.<br />
3.3 SEPARATE SANITARY SEWER SYSTEM<br />
Generally the newer sections of the District surrounding the older central portion are served by a<br />
separate sanitary sewer system. In these areas sanitary sewage is collected in a system of service<br />
sewers typically located at a depth of 11 feet below ground to allow for gravity flow from basements<br />
of adjacent buildings. The sanitary sewer system typically has smaller pipes than the combined sewer<br />
system, since it does not handle storm water flows. The separate system has three pump stations that<br />
convey only sanitary sewage as follows:<br />
Earl Place Pump Station<br />
Third and Constitution Avenue Pump Station<br />
Upper Anacostia Pump Station<br />
The majority of the District’s separate sanitary sewer system sewersheds discharge into the combined<br />
sewer system for final conveyance to BPWWTP for treatment except for a portion of the Southeast<br />
area of the District.<br />
3.4 SEPARATE STORM WATER SYSTEM<br />
3.4.1 Collection <strong>System</strong><br />
The areas surrounding the core of the District of Columbia are served by a separate storm sewer<br />
system. The location of the District Government’s separate storm sewer shed is presented on Figure<br />
3-7. These areas generally consist of neighborhoods that have been developed or redeveloped during<br />
the 20th century. A total of 447 separate storm sewer sheds and storm sewer outfalls have been<br />
identified as being owned by the District of Columbia (Peer Consultants, 1996). An additional 627<br />
separate storm sewer outfalls and associated storm sewer sheds in the District of Columbia were<br />
identified as being owned by other agencies such as the National Park Service, the Air Force, and<br />
other federal agencies. A database was developed for all of the separate storm sewer outfalls and<br />
sewer sheds owned by the District as part of the District of Columbia’s Part 2 Storm <strong>Water</strong> Permit<br />
Application (Peer Consultants, 1996).<br />
\\Gh-wash\ENG 1160\LTCP\LTCP Final\Sec 3.doc 3-16 FINAL - July 2002
Existing <strong>System</strong>s<br />
3.4.2 Existing <strong>Control</strong>s and Programs<br />
On April 19, 2000, the U.S. Environmental Protection Agency issued NPDES Permit No.<br />
<strong>DC</strong>0000221 to the Government of the District of Columbia authorizing discharges from the District’s<br />
Municipal Separate Storm <strong>Water</strong> <strong>System</strong> (MS4) under certain specified conditions. As part of that<br />
permit, the District is obligated to comply with various reporting requirements and perform<br />
numerous activities focused on further reducing the discharge of pollutants to receiving waters.<br />
Details of these activities are presented in the Municipal Separate Storm <strong>Sewer</strong> <strong>System</strong> First Annual<br />
Review (April 19, 2001). Presented below is a summary of some of the major activities planned or<br />
currently underway.<br />
3.4.2.1 MS4 Retrofits<br />
<strong>Plan</strong>s are currently underway to conduct an evaluation to determine the location, sizing and number<br />
of MS4 retrofits necessary to meet the requirements of the CWA and EPA regulations. The results of<br />
these evaluations will be presented in the First Annual Report due April 19, 2002.<br />
3.4.2.2 Management <strong>Plan</strong> For Commercial, Residential & Government Areas<br />
The District’s DOH is applying greater focus on its storm water controls to encourage the use of<br />
functional landscape at parking lots and/or new developments by implementing low impact<br />
development such as reduced road length and width, infiltration ditches, porous pavements, grassy<br />
swales and filter strips.<br />
Approximately 800 storm water BMPs (Best Management Practices) have been approved in the<br />
District of Columbia. Most are designed for small parcels of land that are undergoing<br />
redevelopment. Many are for sites that are less then one acre. Eighty percent are sand filters and the<br />
rest are primarily oil and grit separators, wet and dry ponds, and rooftop detention facilities.<br />
Approximately 50 - 60 percent have been constructed. The storm water BMPs are spread across the<br />
combined and separate sewer systems.<br />
A limited number of BMP performance and maintenance studies have been conducted and the<br />
results are not finalized and therefore not yet available. The <strong>DC</strong> Department of Health is currently<br />
transferring the BMP information to an electronic database. No report on BMP status will be<br />
available until the database is complete. (Personal Communication with Hamid Karami 4/2001).<br />
There are plans to expand the requirements of the BMPs to include road construction and Federal<br />
facilities. The District Department of Health (DOH) also intends to hire additional staff to assist in<br />
the review and enforcement of the BMPs.<br />
\\Gh-wash\ENG 1160\LTCP\LTCP Final\Sec 3.doc 3-18 FINAL - July 2002
Existing <strong>System</strong>s<br />
Listed below are additional elements of the Management <strong>Plan</strong> that are underway or being pursued by<br />
the District, and generally include the joint efforts and coordination between DOH, <strong>DC</strong>RA, DPW,<br />
DOT, and WASA:<br />
Coordinated catch basin cleaning and street sweeping strategy<br />
Solid waste program to include leaf collection<br />
<br />
<br />
<br />
<br />
<br />
<br />
<br />
Preventive maintenance inspections for all existing SWM (Stormwater Management)<br />
facilities<br />
Rain leader disconnect program<br />
Phased approach to public education including collecting pet feces and environmentally<br />
friendly fertilizing and landscaping techniques.<br />
Modeling of storm water impacts<br />
Method to measure performance of these activities.<br />
Strengthen erosion control program for new construction.<br />
Program to control storm water discharges from Federal and District government areas to<br />
same extent as that for commercial, residential and industrial areas.<br />
3.4.2.3 Management <strong>Plan</strong> For Industrial Facilities<br />
The District’s DOH is presently working towards implementation of a program to monitor and<br />
control pollutants discharged to the storm sewer system from industrial facilities including: private<br />
solid waste transfer stations; hazardous waste treatment, disposal and or recovery plants; those<br />
subject to the Emergency <strong>Plan</strong>ning and Community Right-to-Know Act (also know as SARA Title<br />
III or EPCRA); those with NPDES permits; and those with a discharge to the storm sewer system. In<br />
keeping with this effort, the District maintains and updates an industrial facilities database as well as<br />
performs on-site assistance, inspections and outreach programs to industrial facilities. In addition<br />
the DOH has developed a <strong>Water</strong> Pollution <strong>Control</strong> Contingency <strong>Plan</strong> in response to accidental spills<br />
that provides guidance on response to non-permitted hazardous material releases.<br />
3.4.2.4 Management <strong>Plan</strong> For Construction Sites<br />
Pollutant discharges from construction sites is controlled through the sediment and erosion control<br />
review process based on the guidelines published by the DOH. Although comprehensive<br />
enforcement regulations are in-place, a single written enforcement strategy has not been prepared.<br />
The number of sediment and erosion control site inspections for fiscal year 2000 was 5,172, which<br />
exceeded the target of 3000 (First Annual Review, April 19, 2001).<br />
The DOH also implements educational measures for construction site operators through site<br />
inspections and dissemination of its Storm <strong>Water</strong> Management Guidebook and Sediment & Erosion<br />
<strong>Control</strong> Handbook to owners and project designers.<br />
\\Gh-wash\ENG 1160\LTCP\LTCP Final\Sec 3.doc 3-19 FINAL - July 2002
Existing <strong>System</strong>s<br />
3.4.2.5 <strong>Control</strong> Of Pollution From Municipal Landfills & Other Municipal Waste Facilities<br />
The DPW collects solid waste from approximately 100,000 single-family residences throughout the<br />
City. In FY 2000, DPW crews collected approximately 118,000 tons of waste. All District<br />
government collected waste (including bulk waste, litter receptacle waste, street cleaning debris, and<br />
other material) totals approximately 207,000 tons per year. Commercial haulers collect waste and<br />
recyclable materials from multi-family and commercial and institutional properties. Commercial<br />
haulers collect approximately 423,000 tons per year (First Annual Review, April 19, 2001).<br />
As part of the District’s plan to reduce pollutants from District-owned or operated solid waste<br />
transfer stations, and maintenance and storage yards for waste transportation fleets and equipment,<br />
the District has established a solid waste facility permitting process for private solid waste transfer<br />
stations, which includes performance standards for operation. These regulations are currently being<br />
challenged in court and cannot be enforced at this time.<br />
3.4.2.6 <strong>Control</strong> Of Pollutants From Hazardous Waste Sites<br />
The District has or is in the process of implementing a number of programs aimed at controlling<br />
pollutant discharges to the MS4 from hazardous waste sites. The DOH has developed a document<br />
entitled “Hazardous Waste Management”, which describes the procedures for proper identification,<br />
handling and reporting of hazardous materials. A general plan for a hazardous waste monitoring and<br />
control program is given in DOH’s “Strategic <strong>Plan</strong> for Enhancement of Environmental Health<br />
Administration Hazardous Waste Division”. A standard operating procedure for hazardous waste<br />
reporting has been written by DOH. The District plans to integrate these documents into a unified<br />
program.<br />
In addition to the above, the DOH has prepared standard operating procedures for hazardous waste<br />
site identification numbering and entry into the Resource Conservation and Recovery Information<br />
<strong>System</strong> (RCRIS) national database.<br />
3.4.2.7 Pesticides, Herbicides And Fertilizer Application<br />
The DOH’s Pesticide Management Program describes its applicator certification and training,<br />
licensing and enforcement of pesticide regulations. In addition, the District makes educational<br />
literature available to the general public regarding pesticide control and reduction by private property<br />
owners.<br />
3.4.2.8 Deicing Activities<br />
In an effort to minimize water quality degradation from chemical deicers, salt, sand and/or salt/deicer<br />
mixtures, the District had developed a scope-of-work with Howard University Department of<br />
Engineering to conduct a study of Best Management Practices related to roadway construction and<br />
\\Gh-wash\ENG 1160\LTCP\LTCP Final\Sec 3.doc 3-20 FINAL - July 2002
Existing <strong>System</strong>s<br />
maintenance and snow management. The investigation being prepared focuses on the effectiveness<br />
of alternative management practices and not on the environmental impacts of these practices.<br />
3.4.2.9 Additional Activities<br />
Additional activities that are planned or currently underway through DOH include the following:<br />
Management <strong>Plan</strong> to detect and remove illicit discharges<br />
Enforcement <strong>Plan</strong><br />
Public Education Program<br />
Monitoring Program for storm water outfalls.<br />
\\Gh-wash\ENG 1160\LTCP\LTCP Final\Sec 3.doc 3-21 FINAL - July 2002
<strong>Sewer</strong> <strong>System</strong>s Characterization<br />
Section 4<br />
<strong>Sewer</strong> <strong>System</strong>s Characterization<br />
4.1 INTRODUCTION<br />
The purpose of sewer system characterization is to assess the magnitude, frequency, duration and<br />
nature of CSO and separate storm water discharges to facilitate assessment of their water quality<br />
impacts and to evaluate of control measures. Characterization was performed by:<br />
<br />
<br />
<br />
Assembling data on the sewer system – developing and organizing basic data on the<br />
construction of the sewer systems<br />
Monitoring – collecting measurements in the field on combined sewer overflow (CSO) and<br />
separate storm water system (SSWS) flow volumes, durations, overflow rates, and pollutant<br />
concentrations<br />
Computer modeling – developing a predictive model for both the combined sewer system<br />
(CSS) and SSWS<br />
Each of these is described below.<br />
4.2 BASIC SEWER SYSTEM DATA<br />
Basic data on the sewer system and the sewer sheds was obtained from a variety of sources as shown<br />
in Table 4-1. Furthermore, previous studies provided valuable background information on the<br />
history and previous assessments of the CSS:<br />
<br />
<br />
<br />
<br />
Metcalf & Eddy Engineers, 1955: The capacities of existing sewers and pump stations, the<br />
physical conditions of existing sewers, and the extent of CSO problems in the District were<br />
evaluated.<br />
Boards of Engineers, 1957: Using the findings in the Metcalf & Eddy Engineers, 1955 report<br />
as a design basis, recommendations on new construction and modifications to the existing<br />
sewer system were issued to serve the year 2000 projected population in the District and<br />
surrounding areas.<br />
O’Brien & Gere, 1983: Data was gathered during a monitoring program, and entered into a<br />
sewer system and receiving water computer model, whose output results were used to<br />
develop recommendations to address the CSO problem. Many of the recommendations of<br />
this report, such as regulator modifications, inflatable dam installations, and the building of<br />
the NEBSF, were implemented.<br />
Delon Hampton & Associates, 1998: Recommendations were issued for upgrades and<br />
rehabilitations of the major pump stations, as well as for the increase of wet weather<br />
conveyance capacity to BPWWTP. WASA has moved ahead with the procurement of a<br />
\\Gh-wash\ENG 1160\LTCP\LTCP Final\Sec 4.doc 4-1 FINAL - July 2002
<strong>Sewer</strong> <strong>System</strong>s Characterization<br />
<br />
program manager and designer for these rehabilitation projects and is ready to begin<br />
implementation once the sizing, layout and location of facilities are finalized as part of the<br />
selection of the Final LTCP.<br />
Engineering Program Management Consultant-III, 2000a: This document, otherwise known<br />
as the “Structures Book” was updated based on detailed inspections of each regulator<br />
structure. To-scale drawings of each regulator structure, including dimensions and invert<br />
elevations were included.<br />
Table 4-1<br />
Sources of Data<br />
Type Data Source(s)<br />
Hydrologic<br />
Hydraulic<br />
1. Urban catchments and<br />
sewershed areas<br />
Digitization of paper maps from Metcalf & Eddy<br />
(1955) and Board of Engineers (1957)<br />
GIS images from Peer Consultants (1996)<br />
2. Surface Slopes 10’ contours from the USGS Quad Sheets<br />
3. Surface Roughness and<br />
Percent Imperviousness<br />
Peers Consultants (1996)<br />
4. Infiltration Parameters Soil Coverage Maps<br />
5. Rainfall Data<br />
1. Pipes and Manholes<br />
(invert elevations, slopes,<br />
profiles, dimensions)<br />
2. Diversion Structures<br />
3. Pump Stations/ Inflatable<br />
Dams (capacities,<br />
operational schemes)<br />
<br />
<br />
<br />
<br />
<br />
<br />
<br />
<br />
<br />
<br />
<br />
NC<strong>DC</strong> data for Ronald Reagan National Airport<br />
Daily data from U.S. Soldiers’ Home, Dalecarlia<br />
Reservoir and the National Arboretum<br />
15-minute data from the four internal gages set up<br />
during EPMC-III Study<br />
Digitization of paper maps from the Metcalf &<br />
Eddy (1955) and Board of Engineers (1957)<br />
As-built and counter maps from WASA Archives<br />
EPMC- III (2000a)<br />
Field inspections<br />
As-built drawings from WASA archives<br />
Logs maintained by WASA<br />
Field experience of WASA Staff<br />
Direct observation during both wet and dry weather<br />
4. Tide Levels NOAA Data for the Washington Shipping Channel<br />
5. Dry Weather Flow<br />
<br />
<br />
<br />
SCADA Data maintained by WASA<br />
Monitoring Data from EPMC-III Study<br />
Monitoring Data from MWCOG’s Study on Upper<br />
Potomac Interceptor<br />
\\Gh-wash\ENG 1160\LTCP\LTCP Final\Sec 4.doc 4-2 FINAL - July 2002
<strong>Sewer</strong> <strong>System</strong>s Characterization<br />
4.3 MONITORING PROGRAM<br />
Monitoring of both the CSS and SSWS was undertaken as part of the LTCP from August 1999 –<br />
August 2000. The purpose of the monitoring was to collect data on the magnitude and nature of CSO<br />
and SSWS discharges to enable calibration of the computer models and to assess receiving water<br />
impacts. The monitoring consisted of the following major components:<br />
<br />
Rain Gages and NEXRAD Radar Data<br />
Four rain gages were installed in the CSS to collect data on rainfall in selected drainage areas<br />
in the CSS. The drainage areas were selected to correspond with the major CSO outfalls that<br />
were monitored. The rain gages were situated, to the extent possible, in the centroids of their<br />
drainage areas to obtain representative measurements of rainfall. However, rainfall can vary<br />
widely over even a small geographic area. Therefore, NEXRAD radar rainfall data at a 2 km<br />
x 2 km (1.25 mile x 1.25 mile) grid resolution was used to calculate the total rainfall in each<br />
drainage area during each rain event. This radar rainfall data was then corrected and adjusted<br />
using the measurements recorded at the rain gages. Rain gage locations are shown on Figure<br />
4-1.<br />
<br />
CSS Flow Monitoring and Sampling<br />
Flow monitors were installed at 15 locations in the combined sewer system, as shown on<br />
Figure 4-1 and in Table 4-2. Eight of these locations were CSO outfalls, while the remainder<br />
were internal system points in the CSS. The monitors at the internal system points were used<br />
to measure dry weather flows to better calibrate the CSS computer model. At some<br />
locations, more than one flow monitor was required due to the configuration of the sewers.<br />
Flow monitors operated continuously and collected data at five or fifteen minute intervals<br />
depending on locations. Samples were collected at seven locations to characterize the nature<br />
of CSO overflows. Samples were typically collected at ½ hour to 1 hour intervals throughout<br />
the overflow events. Table 4-3 summarizes the rain events during which samples were taken<br />
at the CSS monitoring locations. Figure 4-2 graphically depicts the relative amounts of CSO<br />
volume that came out of the outfalls during the monitoring period.<br />
In addition to the data available from the installed flow monitors, flow data at various<br />
locations was also obtained from WASA’s SCADA system. Although most of the SCADA<br />
points measure flows into WASA’s sewer system from surrounding jurisdictions, some<br />
measure flows from WASA’s pump stations to BPWWTP, and were thus valuable in<br />
constructing the computer model.<br />
\\Gh-wash\ENG 1160\LTCP\LTCP Final\Sec 4.doc 4-3 FINAL - July 2002
<strong>Sewer</strong> <strong>System</strong>s Characterization<br />
Overflows from the sampled and flow monitored outfalls comprised approximately 70% of<br />
the total combined sewer drainage area. The remainder of the CSS drainage areas are<br />
composed of over twenty other smaller drainage areas, most of which are under 200 acres.<br />
<br />
SSWS Flow Monitoring and Sampling<br />
Flow monitors were installed on three storm sewers in the SSWS to collect data on flow and<br />
water quality. One of these flow monitors was installed on a storm sewer which ultimately<br />
discharges to a combined sewer in the Soldier’s Home area. This flow monitor provided data<br />
on the storm water generated from relatively undeveloped green space in the CSS. The<br />
SWSS monitoring locations are summarized in Table 4-2. Table 4-3 summarizes the rain<br />
events during which samples were taken at the SWSS monitoring locations.<br />
Millions of gallons<br />
900<br />
800<br />
700<br />
600<br />
500<br />
400<br />
300<br />
200<br />
100<br />
0<br />
31.97<br />
CSO 007<br />
(Fort<br />
Stanton)<br />
Figure 4-2<br />
Total Monitored CSO Overflow Volume (mg)<br />
November 1999 - August 2000<br />
Total Rainfall 1 = 32.69"<br />
363.36<br />
CSO 010,<br />
011, 011a<br />
(B St./New<br />
Jersey)<br />
116.25<br />
CSO 012<br />
(Tiber<br />
Creek)<br />
805.50<br />
CSO 019<br />
(Northeast<br />
Boundary<br />
Swirl<br />
Effluent)<br />
185.65<br />
CSO 019<br />
(Northeast<br />
Boundary<br />
Swirl<br />
Bypass)<br />
1 Average of four installed rain gages and National Airport rain gage.<br />
46.05<br />
CSO 020<br />
(Easby<br />
Point)<br />
284.48<br />
CSO 021<br />
(Slash Run)<br />
16.22<br />
CSO 049<br />
(Piney<br />
Branch)<br />
CSO Outfall and Drainage Area<br />
\\Gh-wash\ENG 1160\LTCP\LTCP Final\Sec 4.doc 4-5 FINAL - July 2002
<strong>Sewer</strong> <strong>System</strong>s Characterization<br />
Table 4-2<br />
CSS and SWSS Monitoring Sites<br />
Drainage Area Site Sampler Location Type of Monitoring<br />
Rain Gages<br />
Northeast Company 12 Fire<br />
Rhode Island Ave and 5 th St. NE Rainfall<br />
Boundary Station<br />
Piney Branch Company 24 Fire<br />
Gallatin St and Georgia Ave NW Rainfall<br />
Station<br />
Slash Run West End Branch<br />
24 th /L St. NW Rainfall<br />
Library<br />
Tiber Creek/B. WASA Storm <strong>Water</strong><br />
1 st and D St. SE Rainfall<br />
St. N.J. Lift Station<br />
<strong>Combined</strong> <strong>Sewer</strong> <strong>System</strong><br />
Fort Stanton CSO 007 13 th and Ridge St. S.E. CSO overflow<br />
B St./New<br />
Jersey Ave CSO 010 X ‘O’ Street Pumping Station<br />
CSO sampling, no<br />
flow monitoring<br />
CSO 011 B St. N.J. Ave. Trunk <strong>Sewer</strong> (Main P.S.) CSO overflow<br />
Upstream of Structure<br />
35a “F” St/New Hampshire N.W. In-system hydraulics<br />
Downstream of<br />
Structure 35a 23 rd /Constitution, State Dept. Parking Lot In-system hydraulics<br />
Tiber Creek CSO 012 X Tiber Creek Trunk <strong>Sewer</strong> (Main P.S.) CSO overflow<br />
Northeast<br />
Boundary<br />
Easby Point<br />
Slash Run<br />
Piney Branch<br />
Flooding Area #1 “W” St/5 th St. N.E. In-system hydraulics<br />
Flooding Area #2 Neal Street N.E. In-system hydraulics<br />
Flooding Area #3 “O” St/ N. Capitol St. N.W. In-system hydraulics<br />
CSO 019 X Northeast Boundary Swirl Effluent CSO overflow<br />
CSO 019 X Northeast Boundary Swirl Bypass CSO overflow<br />
Easby Point <strong>Sewer</strong> (23 rd and Constitution,<br />
CSO 020<br />
Mall Area)<br />
CSO overflow<br />
Slash Run Trunk <strong>Sewer</strong> Overflow (Near<br />
CSO 021<br />
X Kennedy Center)<br />
Overflow<br />
Slash Run Trunk <strong>Sewer</strong> Dry Weather Flow<br />
CSO 021<br />
(Near Kennedy Center)<br />
Diverted flow<br />
CSO 049 X Piney Branch <strong>Sewer</strong> CSO overflow<br />
Piney Branch Diverted Flow (East Rock<br />
X Creek Diversion <strong>Sewer</strong>)<br />
Diverted flow<br />
CSO 049<br />
Separate Storm <strong>Water</strong> <strong>System</strong><br />
Suitland Suitland Pkwy Storm<br />
Parkway <strong>Water</strong><br />
Hickey Run Hickey Run Storm<br />
<strong>Water</strong><br />
Soldier’s Home<br />
X<br />
Martin Luther King Jr. Ave. and Suitland<br />
Pkwy, S.E.<br />
Route 50 (New York Ave) Access Road,<br />
N.E.<br />
Storm water<br />
X<br />
Storm water<br />
Soldier’s Home Storm<br />
<strong>Water</strong> Irving St/N. Capitol St N.E. Storm water<br />
\\Gh-wash\ENG 1160\LTCP\LTCP Final\Sec 4.doc 4-6 FINAL - July 2002
<strong>Sewer</strong> <strong>System</strong>s Characterization<br />
Table 4-3<br />
Summary of CSS and SWSS Sampling<br />
Rain Events<br />
Site<br />
Suitland Pkwy--<br />
(Separate Storm<br />
water)<br />
Hickey Run-<br />
(Separate Storm<br />
water)<br />
CSO 010 – “O”<br />
Street P.S.<br />
CSO 012 – Tiber<br />
Creek<br />
CSO 019 –<br />
Northeast<br />
Boundary<br />
(Swirl Effluent)<br />
CSO 019 –<br />
Northeast<br />
Boundary<br />
(Swirl Bypass)<br />
CSO 021 – Slash<br />
Run<br />
CSO 049 – Piney<br />
Branch (dry<br />
weather flow side)<br />
CSO 049 – Piney<br />
Branch (overflow<br />
side)<br />
9/14/99 x x<br />
9/21/99 x x<br />
10/17/99 x x<br />
2/13 –2/14/00 x x<br />
2/18 –2/19/00 x x<br />
2/27 –2/28/00 x x x<br />
3/21/00 x x x x<br />
3/27/00 x x x<br />
4/8/00 x x<br />
4/25/00 x x<br />
5/19/00 x<br />
5/22/00 x<br />
6/15/00 x x<br />
6/22/00 x x<br />
7/14/00 x x<br />
7/16/00 x<br />
8/3/00 x<br />
8/6/00 x<br />
8/27/00 x x x<br />
9/19/00 x x x<br />
9/25/00 x<br />
TOTAL 5 5 4 4 8 5 7 3 1<br />
4.4 EVENT MEAN CONCENTRATIONS<br />
Event mean concentrations (EMCs) were used to calculate conventional pollutant loads from the<br />
CSS, SSWS, and the Authority’s wastewater treatment plant at Blue Plains (BPWWTP). EMCs are<br />
defined as the total mass of pollutants discharged divided by the total flow volume. EMCs for each<br />
monitored storm were calculated by computing a flow weighted average concentration of all the<br />
samples that were taken during the storm. In addition, overall EMCs for each site were calculated by<br />
computing flow weighted averages over all the monitored storm events. The EMCs were compared<br />
with EMCs calculated in previous studies (EPMC-III, 2000b) as a quality assurance check.<br />
To generate loads to receiving waters, EMCs were multiplied by the modeled overflow volume from<br />
the CSS and the modeled flow volumes from the SSWS and BPWWTP effluent. The resulting<br />
pollutant loads served as inputs to the receiving water models.<br />
Important details concerning the calculation of EMCs are as follows:<br />
\\Gh-wash\ENG 1160\LTCP\LTCP Final\Sec 4.doc 4-7 FINAL - July 2002
<strong>Sewer</strong> <strong>System</strong>s Characterization<br />
<br />
At one CSO site (CSO 019 – Northeast Boundary), separate EMCs were calculated for the<br />
Swirl Effluent versus the Swirl Bypass, as the concentrations of key constituents were<br />
different after treatment and disinfection.<br />
<br />
Fecal coliform and e. coli concentrations were found to be extremely variable by site and by<br />
storm. At the same site, concentrations were found to vary by many orders of magnitude<br />
within the same storm and between different storms. A “first flush” effect was not always<br />
observed. This is consistent with CSO sampling results of other CSO programs. The lack of<br />
consistent first flush effect could be due to the spatial and temporal variations in rainfall,<br />
particularly in large drainage areas like Northeast Boundary. Given the high variability in<br />
bacteriological results, employing separate EMCs for each site may have distorted CSO loads<br />
during the evaluation phase. In order to provide a consistent framework for evaluating the<br />
effects of CSOs, a single EMC for fecal coliform and e. coli was used for all untreated CSOs.<br />
Each EMC was calculated by dividing the total number of organisms by the total volume of<br />
CSO at all sampled storms for all sites to generate an overall system EMC.<br />
The EMCs for conventional parameters are summarized in Table 4-4.<br />
\\Gh-wash\ENG 1160\LTCP\LTCP Final\Sec 4.doc 4-8 FINAL - July 2002
<strong>Sewer</strong> <strong>System</strong>s Characterization<br />
Table 4-4<br />
Event Mean Concentrations for Conventional Pollutants<br />
Parameter<br />
Units<br />
B St./NJ Ave.<br />
(CSO 009,<br />
010, 011,<br />
011a)<br />
Tiber Creek<br />
(CSO 012)<br />
Anacostia CSOs<br />
NEB Swirl<br />
Effluent<br />
(CSO 019)<br />
NEB Swirl<br />
Bypass<br />
(CSO 019)<br />
All Other<br />
Anacostia<br />
CSOs<br />
Potomac<br />
and Rock<br />
Creek Outfall 001<br />
CSOs (Excess<br />
Flow)<br />
Blue Plains<br />
Outfall<br />
002<br />
Separate<br />
Storm<br />
<strong>Water</strong><br />
<strong>System</strong><br />
CBOD 5, Total mg/L 51 74 39 34 53 36 56.6 5 19<br />
CBOD 5, Dissolved mg/L 7 15 12 9 10 11 15<br />
Chemical oxygen<br />
demand mg/L 110 161 135 143 138 107 73<br />
Dissolved Organic<br />
Carbon mg/L 9 24 12 10 15 16<br />
Total Suspended<br />
Solids mg/L 147 186 118 182 171 130 130.1 7 94<br />
Volatile Suspended<br />
Solids mg/L 77 81 48 58 72 0 18<br />
Ammonia-as N mg/L 2.90 0.66 0.69 0.46 1.34 0.96 8.7 3.8 0.84<br />
Nitrate+Nitrate-as N mg/L 0.60 0.81 0.79 0.78 0.73 0.85 0.7 9.3 0.94<br />
Total Kjeldahl<br />
Nitrogen mg/L 6.0 4.0 4.0 2.4 4.1 3.8 16.3 1.54 2.2<br />
Organic Nitrogen mg/L 3.1 3.34 3.31 1.94 2.76 2.84 7.6 1.36<br />
Total Organic<br />
Carbon mg/L 14 30 16 12 19 0 19<br />
Total Phosphorus mg/L 1.31 0.98 0.85 0.83 1.04 1.04 2.4 0.18 0.44<br />
Ortho Phosphorus<br />
(dissolved) mg/L 0.37 0.11 0.23 0.15 0.21 0.22 0.8 0.05 0.22<br />
Hardness mg/L 85 71 43 40 66 37 56<br />
Fecal Coliform<br />
MPN/<br />
100 ml 939,270 939,270 191,309 939,270 939,270 939,270 70,206 200 28,265<br />
E. Coli<br />
MPN/<br />
100 ml 686,429 686,429 122,011 686,429 686,429 686,429 51,250 126 16,238<br />
Dissolved Oxygen mg/L 6 6 6 6 6 6 6 6.8 6<br />
Organic Phosphorus mg/L 0.94 0.87 0.62 0.68 0.83 0.82 1.6 0.13 0.22<br />
4.5 TOXICS MONITORING AND ANALYSIS<br />
4.5.1 Priority Pollutants<br />
Monitoring was carried out for both CSO and storm water discharges for the 127 priority pollutants,<br />
which include the following classes of pollutants:<br />
Total Recoverable Metals and Cyanide<br />
Dissolved Metals<br />
Pesticides/PCBs<br />
Volatiles and Semivolatiles<br />
In accordance with the monitoring program approved by regulatory agencies, manual grab samples<br />
were collected during one storm event at each of the following locations:<br />
Northeast Boundary (NEB) Swirl Facility Effluent at CSO 019<br />
Piney Branch – East Rock Creek Diversion <strong>Sewer</strong> located adjacent to CSO 049<br />
Hickey Run separate storm water monitoring site<br />
\\Gh-wash\ENG 1160\LTCP\LTCP Final\Sec 4.doc 4-9 FINAL - July 2002
<strong>Sewer</strong> <strong>System</strong>s Characterization<br />
Two samples were collected during the course of each storm event at each location. One sample was<br />
collected near the beginning of the event and the second sample was collected near the end of the<br />
event. At Piney Branch, samples were collected during a storm event in the East Rock Creek<br />
Diversion <strong>Sewer</strong> (ERCDS) and not at the CSO outfall. The ERCDS represents combined sewage<br />
captured in the combined sewer system and not CSO overflow. This was done because the infrequent<br />
and short durations of overflows at Piney Branch made sampling CSO overflow extremely difficult.<br />
The captured flow in the CSS is typically more concentrated than CSO overflow. This sampling is<br />
thus a conservative assessment of the overflow at Piney Branch.<br />
For CSO, all results were below the laboratory method reporting limits for all priority pollutants<br />
except cyanide, chloroform and several metals. For storm water, asbestos, cyanide and chloroform<br />
and several metals were detected above the laboratory reporting limits. Metals will be discussed<br />
further in section 4.5.2. Results for the detected pollutants are summarized in Table 4-5.<br />
Due to the intermittent and fairly short-term nature of CSOs, only acute standards (one hour average)<br />
are applicable. Chronic standards (4 day average) are not applicable. A comparison of the<br />
monitoring results for asbestos, cyanide and chloroform against the acute water quality standards are<br />
shown below:<br />
Table 4-5<br />
Detected Priority Pollutant Parameters<br />
(Not including Metals)<br />
Location Parameter Sampling Results<br />
CSO<br />
Criteria Maximum<br />
Concentration /Acute<br />
(one hour average)<br />
NEB Swirl Cyanide 14 and 3 ug/l 22 ug/l<br />
NEB Swirl Chloroform 5 ug/l No Acute Standard 1<br />
Storm water<br />
Hickey Run Cyanide 4 ug/l<br />
Hickey Run Chloroform 9 ug/l No Acute Standard 1<br />
Hickey Run Asbestos 510.811 mf/l No Acute Standard<br />
Note 1: Human health criteria is 470 ug/l.<br />
It can be seen from the comparison above that the sampling results for cyanide and chloroform are<br />
well below applicable water quality standards. In addition, Notices of Violations for the period July<br />
1999 to June 2001 from the WASA pretreatment program were reviewed. No violations for<br />
Significant Industrial Users (SIUs) within the combined sewer drainage area were found for the<br />
\\Gh-wash\ENG 1160\LTCP\LTCP Final\Sec 4.doc 4-10 FINAL - July 2002
<strong>Sewer</strong> <strong>System</strong>s Characterization<br />
pollutants of concern in the table above. Therefore, cyanide and chloroform are not considered to be<br />
substances that require further control as part of the LTCP.<br />
4.5.2 Metals<br />
In addition to the metals analyses carried out as a part of the priority pollutant scans, additional total<br />
recoverable and dissolved metals sampling and laboratory analyses were completed. Table 4-6 shows<br />
the number of storm events and total number of samples collected over the monitoring period.<br />
Table 4-6<br />
Summary of Metals Sampling<br />
Location<br />
Item<br />
Suitland Pkwy-<br />
(Separate Storm<br />
water)<br />
Hickey Runt-<br />
(Separate Storm<br />
water)<br />
CSO 010 – “O”<br />
Street P.S.<br />
CSO 012 – Tiber<br />
Creek<br />
CSO 019 –<br />
Northeast<br />
Boundary<br />
(Swirl Effluent)<br />
CSO 019 –<br />
Northeast<br />
Boundary<br />
(Swirl Bypass)<br />
CSO 021 – Slash<br />
Run<br />
CSO 049 – Piney<br />
Branch (dry<br />
weather flow side)<br />
<strong>Water</strong>body<br />
Anacostia River<br />
Potomac Rock<br />
River Creek<br />
No. of storms 3 5 1 5 5 4 6 4<br />
Total samples 3 5 1 2 7 17 2 8 12 13<br />
Note 1: 5 samples were analyzed for metals except for mercury which had 4 samples and hexavalent chromium which<br />
had 1 sample.<br />
Note 2: 17 samples for metals except for hexavalent chromium, which had 15 samples.<br />
For detected metals with existing WQS, 97 th percentile daily values were calculated using the<br />
statistics model developed by the Virginia Department of Environmental Quality using the<br />
monitored sample results. The 97 th percentile is typically used to establish permit limits for<br />
continuous discharges to protect against acute toxicity. Therefore, it is a conservative evaluation<br />
technique for short, intermittent discharges such as CSO.<br />
The 97 th percentile concentrations are compared against the criteria maximum concentrations (acute)<br />
water quality standard in Table 4-7.<br />
\\Gh-wash\ENG 1160\LTCP\LTCP Final\Sec 4.doc 4-11 FINAL - July 2002
<strong>Sewer</strong> <strong>System</strong>s Characterization<br />
Parameter (all<br />
except Hg and<br />
Se are dissolved)<br />
CMC/Acute<br />
<strong>Water</strong> Quality<br />
Standard<br />
(mg/L) 4<br />
Table 4-7<br />
Summary of 97 th Percentile Daily Values for Metals at<br />
Monitored CSO and Storm <strong>Water</strong> Outfalls<br />
Suitland<br />
Parkway<br />
(Separate<br />
Storm <strong>Water</strong>)<br />
Hickey Run<br />
(Separate Storm<br />
<strong>Water</strong>)<br />
Calculated 97 th Percentile Daily Value (mg/L)<br />
Anacostia River<br />
O St. Pump<br />
Station<br />
(CSO 010)<br />
Tiber<br />
Creek<br />
(CSO<br />
012)<br />
CSO<br />
019<br />
(Swirl<br />
Bypass)<br />
CSO 019<br />
(Swirl<br />
Effluent)<br />
Rock Creek Potomac River<br />
Piney<br />
Branch<br />
(CSO 049)<br />
Slash Run (CSO<br />
021)<br />
Mercury(Hg) 0.0024
<strong>Sewer</strong> <strong>System</strong>s Characterization<br />
It was determined that the mixing zone modeling was not applicable for the Anacostia River and<br />
Piney Branch/Rock Creek representative outfalls, NEB CSO 019 and Piney Branch 049 evaluated for<br />
these waterbodies. This is due to the low 7Q10 flow rate in these receiving waters in relation to the<br />
CSO overflow rate modeled at these outfalls. As a result, there is no significant dilution available,<br />
during these low flow conditions.<br />
The EPA has been developing an improved method, the Biotic Ligand Model (BLM), to assess the<br />
metal availability and toxicity for biota. The EPA Ecological Processes and Effects Committee of the<br />
Science Advisory Board has found that the BLM can significantly improve predictions of the acute<br />
toxicity of certain metals, such as copper. The EPA is currently drafting new copper criteria that will<br />
incorporate the BLM for criteria calculations. In anticipation of BLM being implemented by EPA, it<br />
was used to estimate what prospective recalculated acute standards values for copper would be when<br />
the method is issued.<br />
The BLM approach takes into account other constituents such as dissolved organic carbon (DOC) in<br />
CSO that compete for the available dissolved copper, thus reducing its bioavailablity. Therefore, the<br />
BLM method recalculates the CMC/Acute standard taking into account that some of the dissolved<br />
copper is not bioavailable, allowing a higher standard that is just as protective. Table 4-9 displays the<br />
97 th Percentile Daily value as compared to the average condition and a conservative (worst case)<br />
scenario for the CSO overflow, demonstrating that the prospective recalculated acute copper water<br />
quality criteria based on the BLM would be above the maximum CSO concentrations for average and<br />
extreme water quality conditions.<br />
Table 4-9<br />
BLM Calculated CMCs for Dissolved Copper<br />
<strong>Water</strong>body<br />
NEB CSO 019<br />
Anacostia River<br />
Piney Branch CSO<br />
049/Rock Creek<br />
Parameter<br />
Dissolved<br />
Copper<br />
Dissolved<br />
Copper<br />
97 th<br />
Percentile<br />
Daily Value<br />
BLM Calculated Criteria Maximum Concentration/ Acute<br />
(one hour average) 1 (ug/l)<br />
(ug/l) Average Condition 1 Worst Case Scenario 2<br />
25.8 113 28<br />
22.2 113 28<br />
Note 1: Calculated using the CSO mean hardness of 54 mg/l.<br />
Note 2: Calculated using a hardness of 6 mg/l.<br />
It is unclear whether the BLM method will be developed for zinc in the future. Note that dissolved<br />
zinc and dissolved copper concentrations in storm water are comparable to measured CSO overflow<br />
concentrations indicating that the source of these constituents in CSO is mostly likely runoff (See<br />
Table 4-7 above).<br />
\\Gh-wash\ENG 1160\LTCP\LTCP Final\Sec 4.doc 4-13 FINAL - July 2002
<strong>Sewer</strong> <strong>System</strong>s Characterization<br />
Since metals in SSWS are similar to metals levels in CSO, this suggests that sources are diffuse, part<br />
of the urban environment, and are picked up by runoff. Elimination of CSOs by separation would<br />
increase SSWS loads and increase metals discharge. CSO control captures and treats a large part of<br />
the storm water, reducing metals loads. The recommended CSS LTCP will provide significant<br />
reductions in CSO discharges. Discharges remaining after the recommended LTCP is implemented<br />
will typically occur well after the first flush and therefore, metals concentrations may be lower.<br />
Moreover since metals appear to be picked up from the urban environment in runoff, storm water<br />
management programs (SWMP) might afford the most reasoned approach to achieving the overall<br />
goal of meeting WQS in the waterbodies. SWMPs may further reduce metals in CSO as well. In the<br />
interim, the selected LTCP described in Section 13 provides an effective solution to mitigate<br />
dissolved metals discharges to receiving waters by reducing CSO discharges.<br />
4.6 MODELING PROGRAM<br />
4.6.1 <strong>Combined</strong> <strong>Sewer</strong> <strong>System</strong><br />
The basic sewer system data and monitoring data were input into computer models that simulated the<br />
operation of the CSS and SSWS. The models were calibrated and validated using the monitoring<br />
data from October 1999 to June 2000, and various LTCP alternatives were evaluated by the predicted<br />
behavior of the CSS and SSWS for rain events during the forecast period of 1988 through 1990.<br />
Detailed descriptions of the model inputs are provided for reference in the respective study<br />
memoranda of model documentation for the combined sewer and separate storm water systems<br />
(EPMC-III 1999a and 1999b).<br />
CSS Model Description<br />
The MOUSE model was selected and calibrated as a tool for characterization and evaluation of the<br />
CSS. After an extensive evaluation of commercially available computer models, MOUSE was<br />
selected specifically for its ability to model the performance of additional real time controls.<br />
MOUSE, developed by DHI Inc. of Denmark, is a comprehensive package of programs developed<br />
specifically for the evaluation of complex hydraulic systems. It contains components that replicate<br />
the generation of runoff across urban watersheds, and the transport of both runoff and sanitary flow<br />
through combined sewer systems. The key inputs and sources of data are listed in Table 4-1. All the<br />
hydrologic and hydraulic elements present in the calibrated model (1999-2000) were retained in the<br />
forecast model (1988-1990).<br />
Calibration of the combined sewer model was performed using the data from the flow monitors<br />
installed at the internal system points and the monitored outfalls, log data from all the pump stations<br />
and flow meter data from the surrounding jurisdictions which deliver flow to the District. The<br />
hydrologic model of MOUSE was run for each precipitation event, and the hydraulic model was run<br />
subsequently to characterize hydraulic routing to the pump stations and outfalls. About half of the<br />
\\Gh-wash\ENG 1160\LTCP\LTCP Final\Sec 4.doc 4-14 FINAL - July 2002
<strong>Sewer</strong> <strong>System</strong>s Characterization<br />
precipitation events from the monitoring period of October 1999 through June 2000 were used for<br />
model calibration, and the remaining half were used for model validation.<br />
Post-processing programs were developed to group the results from all the precipitation events used<br />
for model calibration and validation. The percent differences between the monitored and modeled<br />
flow volumes at the meters and pump stations were used to determine the adequacy of calibration.<br />
For the forecast model, the hydrologic/ hydraulic model elements required modification based on the<br />
long-term control alternative being evaluated, for example:<br />
- Implementing surface storage measures such as roof-top retention and low-impact<br />
development<br />
- Building real time controls, such as new inflatable dams or repairing the ones that are not<br />
operational<br />
- Building new storage structures in the collection system such as retention basins and deep<br />
tunnel<br />
- Retrofitting diversion structures/ pipes with capacity limitations<br />
- Rehabilitating existing pumps or building new pump stations.<br />
Rainfall Characterization<br />
Precipitation data was available at the Ronald Reagan National Airport (hourly intervals), four<br />
installed rain gages (15-minute intervals), and the daily-recording gages at the U.S. Soldier’s and<br />
Airman’s Home, National Arboretum, and Dalecarlia Reservoir for the calibration period. As<br />
described in Section 4.3, this rain gage data was used in conjunction with radar rainfall data<br />
(NEXRAIN) to obtain a more accurate estimate of rainfall patterns and amounts. This data was input<br />
into a 2 km by 2 km resolution grid in the model. All the hydrologic and hydraulic elements were<br />
input in the MOUSE model with their geographical coordinates. The model automatically uses the<br />
data from the closest grid for hydrologic modeling in a sewer shed.<br />
However, during the forecast period, only the daily data at the Dalecarlia Reservoir and National<br />
Arboretum, along with the hourly data at Ronald Reagan National Airport were available. Rainfall<br />
disaggregation procedures and linear interpolation techniques were used to estimate spatially-varied<br />
hourly precipitation data for 4 km by 4 km grids in the District. Some long-term control alternatives<br />
utilize storage structures in the collection system such as retention basins and deep tunnels that would<br />
increase the travel time within the sewer system. Assuming that the stored water would be dewatered<br />
over a 48-hour period, the precipitation events in the forecast period of 1988-1990 that were<br />
separated by less than 48-hours were clustered. This clustering process yielded 171 unique<br />
precipitation events over the three year period that were run in batch mode similar to the<br />
calibration/validation model.<br />
\\Gh-wash\ENG 1160\LTCP\LTCP Final\Sec 4.doc 4-15 FINAL - July 2002
<strong>Sewer</strong> <strong>System</strong>s Characterization<br />
Wastewater Flows in Dry Weather<br />
For the calibration/validation period, the flows observed at all the metered locations during each wet<br />
weather event were separated into a dry weather flow and a wet weather component caused by the<br />
rain event. The dry weather flow during a wet weather event was estimated by taking an average of<br />
the dry weather flows immediately before and after the wet weather event. The incremental flows<br />
between any two metered locations (flow meters or pumps) were used to apportion the flows<br />
contributed by individual sewer sheds located between these two locations. Where available, the log<br />
sheets of pump stations and SCADA data maintained by WASA were used to supplement the above<br />
data in order to determine flow contributions from the sewer sheds in the District and the surrounding<br />
boundaries.<br />
BPWWTP has a rated annual average flow capacity of 370 mgd. This capacity is projected to meet<br />
the needs of the Blue Plains service area (District plus surrounding jurisdictions) until the year 2020<br />
based on the Flow Projection Model developed by the Metropolitan Washington Council of<br />
Governments. The Blue Plains Intermunicipal Agreement of 1985 (IMA) allocates wastewater<br />
treatment capacity between the District and the surrounding jurisdictions. The surrounding<br />
jurisdictions are allocated an annual average capacity of 212 mgd. The District is allocated a<br />
capacity of 148 mgd with 10 mgd reserved to accommodate additional Potomac Interceptor flows for<br />
a total of 158 mgd. Currently, wastewater flows from the District to BPWWTP average about 170<br />
mgd. However, the surrounding counties served by BPWWTP are not fully utilizing their allocated<br />
wastewater treatment capacity. During the calibration period (1999-2000), the flows to BPWWTP<br />
averaged about 320 mgd, significantly less than the 370 annual average plant capacity.<br />
WASA has a wastewater flow reduction and water conservation program in place to reduce the dry<br />
weather flow from the District to meet its IMA allowance. For purposes of the LTCP, the annual<br />
average dry weather flows allowed by the IMA were used in the model for the forecast period. This<br />
is conservative since current flows are significantly less than the flows allowed by the IMA. Average<br />
annual flows for the District and the surrounding areas for the calibration/ validation period, for the<br />
forecast period, and as specified in the IMA are listed in Table 4-10.<br />
\\Gh-wash\ENG 1160\LTCP\LTCP Final\Sec 4.doc 4-16 FINAL - July 2002
<strong>Sewer</strong> <strong>System</strong>s Characterization<br />
Location<br />
Table 4-10<br />
Average Annual Flows<br />
Average Flow During<br />
Calibration Period (mgd)<br />
(1999-2000)<br />
Average Dry Weather Flow<br />
During Forecast Period (mgd)<br />
(1988-1990)<br />
IMA Allowance<br />
(mgd)<br />
Surrounding Jurisdictions<br />
Potomac Interceptor 46.9 54.6 54.6<br />
Upper Potomac Interceptor 6.5 10.3 10.3<br />
Total Rock Creek 19.0 33.5 33.5<br />
Total WSSC Anacostia Pump Station 57.4 83.2 83.2<br />
Chain Bridge 4.2 9.4 9.4<br />
Little Falls 3.3 7.6 7.6<br />
Watts Branch 0.9 1.3 1.3<br />
Upper Oxon Run 4.6 6.1 6.1<br />
Lower Oxon Run 2.0 6.0 6.0<br />
Subtotals 144.8 212.0 212.0<br />
District<br />
East Rock Creek 18.8 25.9 None<br />
Piney Branch 9.9 in East Rock Creek None<br />
Rock Creek Main 22.0 19.9 None<br />
Upper Potomac Interceptor- West<br />
Rock Creek (Above Rock Creek PS) 7.5 6.8 None<br />
Upper Potomac Interceptor Relief<br />
<strong>Sewer</strong> 15.4 13.9 None<br />
B Street/ New Jersey 44.5 40.2 None<br />
Anacostia Main Interceptor (Poplar<br />
Point PS) 13.9 12.6 None<br />
Upper Eastside Interceptor 18.6 16.7 None<br />
O Street 3.7 3.3 None<br />
Oxon Run-Twin Outfall <strong>Sewer</strong>s 20.8 18.7 None<br />
Subtotals 175.1 158.0 158.0<br />
TOTAL SYSTEM 319.9 370.0 370.0<br />
GIS maps of the District’s combined and separate storm water areas, along with the suburban service<br />
areas, were used to define input for the flow projection model, and future flows were estimated for<br />
major sewersheds such as Piney Branch, Northeast Boundary, and Total Rock Creek Service Area.<br />
These estimates, in turn, were apportioned on the area-weighted basis to smaller portions of the<br />
major sewersheds for use in the forecast model.<br />
Dry weather flows typically vary with water usage during the day. Therefore, diurnal variations in<br />
flows are modeled using diurnal peaking factors within the District and surrounding areas. These<br />
diurnal peaking factors were estimated from the variations of dry weather flows observed during<br />
\\Gh-wash\ENG 1160\LTCP\LTCP Final\Sec 4.doc 4-17 FINAL - July 2002
<strong>Sewer</strong> <strong>System</strong>s Characterization<br />
select dry days in the calibration/ validation period. The diurnal peaking factors for flows from the<br />
major boundary points as well as the District are listed in Table 4-11.<br />
Hour<br />
Potomac<br />
Interceptor<br />
Upper<br />
Potomac<br />
Interceptor<br />
Table 4-11<br />
Diurnal Dry Weather Flow Factors<br />
Total<br />
Rock<br />
Creek<br />
WSSC<br />
Anacostia<br />
Pump Stations<br />
Chain<br />
Bridge<br />
Little<br />
Falls<br />
Watts<br />
Branch<br />
Upper<br />
Oxon<br />
Run<br />
Lower<br />
Oxon<br />
Run<br />
District<br />
0 1.14 1.11 1.04 1.06 0.33 0.82 0.86 0.88 0.79 0.93<br />
1 1.12 1.08 0.95 0.91 0.01 0.64 0.71 0.76 0.62 0.90<br />
2 1.08 0.98 0.83 0.78 0.01 0.50 0.60 0.71 0.51 0.85<br />
3 0.99 0.78 0.72 0.79 0.02 0.43 0.53 0.66 0.46 0.83<br />
4 0.91 0.68 0.63 0.68 0.06 0.40 0.52 0.65 0.47 0.82<br />
5 0.78 0.62 0.54 0.49 0.16 0.40 0.57 0.68 0.60 0.86<br />
6 0.66 0.58 0.51 0.53 0.42 0.49 0.80 0.86 0.86 0.95<br />
7 0.59 0.59 0.64 0.67 0.87 0.90 1.10 1.09 1.17 1.01<br />
8 0.56 0.76 0.87 0.77 1.44 1.34 1.21 1.18 1.20 1.11<br />
9 0.60 0.96 1.07 1.05 1.89 1.43 1.15 1.16 1.19 1.22<br />
10 0.66 1.07 1.17 1.20 1.78 1.41 1.15 1.14 1.18 1.18<br />
11 0.87 1.11 1.23 1.27 1.59 1.38 1.14 1.10 1.21 1.11<br />
12 1.05 1.14 1.26 1.22 1.47 1.32 1.15 1.06 1.14 1.06<br />
13 1.19 1.14 1.25 1.25 1.37 1.25 1.10 1.03 1.14 1.04<br />
14 1.24 1.14 1.21 1.23 1.28 1.20 1.07 1.02 1.06 1.00<br />
15 1.28 1.14 1.17 1.13 1.26 1.15 1.07 1.01 1.08 0.98<br />
16 1.28 1.13 1.12 1.00 1.16 1.11 1.08 1.03 1.09 1.00<br />
17 1.23 1.13 1.09 1.02 1.14 1.10 1.10 1.08 1.12 1.04<br />
18 1.16 1.13 1.08 1.15 1.30 1.15 1.16 1.13 1.21 1.04<br />
19 1.14 1.14 1.10 1.18 1.37 1.17 1.22 1.18 1.28 1.02<br />
20 1.12 1.15 1.13 1.16 1.39 1.16 1.24 1.21 1.29 1.03<br />
21 1.11 1.16 1.14 1.16 1.34 1.13 1.22 1.19 1.21 1.04<br />
22 1.11 1.15 1.14 1.15 1.26 1.08 1.17 1.15 1.14 1.01<br />
23 1.14 1.12 1.11 1.14 1.06 1.02 1.07 1.05 0.96 0.97<br />
Wet Weather Influence on Flow from Separate Sanitary <strong>System</strong>s<br />
Besides diurnal variations, the dry weather flow in the separate sanitary system of the District and the<br />
surrounding jurisdictions increases during wet weather periods. This increase in dry weather flow<br />
was modeled by applying a wet weather peaking factor developed for individual major locations<br />
listed above. For all the locations except the District, regression equations were developed between<br />
rainfall at the Ronald Reagan National Airport and the flows observed in each of those locations<br />
during wet days in the calibration/ validation period. The time of concentration for individual service<br />
areas up to the District boundary for each of the locations were also determined from the regression<br />
equations. The time of concentration was then included in the model as lag time for runoff from the<br />
surrounding service areas to reach the District boundary. The magnitude of the peaking factors<br />
depended on the amount of rain.<br />
For the separate sanitary portion of the District, a constant wet weather peaking factor of 1.25 was<br />
used to account for increases in flow rates during wet weather. This was based on reviewing wet<br />
\\Gh-wash\ENG 1160\LTCP\LTCP Final\Sec 4.doc 4-18 FINAL - July 2002
<strong>Sewer</strong> <strong>System</strong>s Characterization<br />
weather peaking factors for comparably large areas of the surrounding jurisdictions. The range of<br />
wet weather peaking factors used is summarized in Table 4-12.<br />
Table 4-12<br />
Wet Weather Peaking Factors for Dry Weather Flow<br />
Range of Wet Weather Peaking<br />
Location<br />
Factors for Dry Weather Flow 1<br />
Potomac Interceptor 1.04 to 1.32<br />
Upper Potomac Interceptor 1.34<br />
Total Rock Creek 1.03 to 1.29<br />
Total WSSC Anacostia Pump Station 1.03 to 1.63<br />
Chain Bridge 1.26 to 1.92<br />
Little Falls 1.01 to 1.37<br />
Watts Branch 1.01 to 1.90<br />
Upper Oxon Run 1.01 to 1.74<br />
Lower Oxon Run 1.49 to 2.08<br />
District 1.25<br />
Notes: 1. Flow Rate as a function of time = annual average dry weather<br />
flow x wet weather peaking factor x diurnal peaking factor.<br />
River Tide Levels<br />
<strong>Long</strong>-term hourly tide data was available at the Washington Shipping Channel for the calibration/<br />
validation period as well as for the forecast period of 1988 through 1990. Correction factors<br />
developed from the ground elevation data were used to estimate tide level time-series at each of the<br />
sixty outfall locations.<br />
Model Calibration and Validation and Forecast Model Application<br />
Continuous time-series of precipitation, dry weather flow and tide levels developed above were input<br />
as boundary conditions in the calibration/validation model. The diversion structures were modeled<br />
appropriately as overflow weirs or pipes. Operation rules for the pumps and inflatable dams were<br />
established based on the rating curves and the procedures used by WASA’s staff. The model was<br />
calibrated against all storms where reliable data was collected during the monitoring period. All the<br />
precipitation events chosen for calibration and validation were run successively. Post-processing<br />
programs developed in FORTRAN and in Microsoft ACCESS were used to disaggregate the dry<br />
weather flow and runoff at all the metered locations. The modeled dry weather flows and runoffs<br />
were then compared with the monitored flows at those locations. Finally, the hydrologic and<br />
hydraulic parameters were adjusted until the calibration percent difference between the modeled and<br />
monitored flows was minimized and so that the overall modeled CSO overflow volumes were<br />
estimated conservatively. Table 4-13 compares the monitored and modeled flow volumes at the<br />
major metered locations and shows that the modeled flows were conservatively estimated at 10%<br />
above monitored flows.<br />
\\Gh-wash\ENG 1160\LTCP\LTCP Final\Sec 4.doc 4-19 FINAL - July 2002
<strong>Sewer</strong> <strong>System</strong>s Characterization<br />
Location<br />
Overflow Locations<br />
Table 4-13<br />
Calibration Results<br />
Monitored Flow<br />
Volume (mg)<br />
Modeled Flow Volume<br />
(mg) Difference (%)<br />
CSO 007 (Fort Stanton) 20.1 26.5 31.9<br />
CSO 010 (O Street Storm) 255.0 272.7 6.9<br />
CSO 010, 011, 011a, 012 (Main<br />
and O Street Area Total)<br />
323.8 358.2 10.6<br />
CSO 049 (Piney Branch) 12.5 9.0 -28.3<br />
CSO 021 (Slash Run) 230.4 252.9 9.7<br />
CSO 020 (Easby Point) 41.2 40.9 -0.6<br />
CSO 019 (Northeast Boundary<br />
Total, Swirl and Bypass)<br />
772.6 865.0 12.0<br />
Total CSO Overflow 1,655.6 1,825.2 +10<br />
Pump Station Outputs<br />
Main Pump Station 3,594.0 3,635.3 1.1<br />
Potomac Pump Station 6,904.6 6,943.2 0.6<br />
Blue Plains Raw Wastewater<br />
Pump Stations 1 & 2<br />
17,442.0 17,468.0 0.2<br />
Additional post-processing programs were developed to group the model results for individual<br />
calibration/ validation events into a continuous time-series of overflows for receiving water model<br />
application.<br />
The calibrated model was adapted for evaluation of long-term control alternatives by replacing the<br />
appropriate rainfall, dry weather flow and tide databases. The existing system, as well as the system<br />
with immediate controls such as cleaning interceptors and rehabilitating pumps and inflatable dams,<br />
were run to establish baseline conditions. All the 171 precipitation events in the forecast period were<br />
run successively in the MOUSE model, and the post-processing programs were again used to group<br />
the model results into continuous time-series of overflows for receiving water model application.<br />
Once the baseline scenarios were modeled, the long-term control alternatives involving surface and<br />
collection system storage, retrofitting under-capacity pipes and diversion structures were modeled by<br />
appropriately modifying the hydrologic/ hydraulic elements.<br />
4.6.2 Separate Storm <strong>Water</strong> <strong>System</strong><br />
In the separate storm water system, the estimation of pollutant loads discharged to individual<br />
receiving waters is of primary interest as opposed to a detailed representation of flows within the<br />
storm sewer system. Therefore, the level of sewer shed and pipe conveyance characterization is<br />
simpler compared to the combined sewer system.<br />
\\Gh-wash\ENG 1160\LTCP\LTCP Final\Sec 4.doc 4-20 FINAL - July 2002
<strong>Sewer</strong> <strong>System</strong>s Characterization<br />
In the calibrated model, the individual sewer sheds were grouped into hydrologically similar clusters,<br />
and the outfall for each cluster was identified from the geographic locations of the storm sewer<br />
outfalls of all the sewer sheds in that cluster. Weighted average values of the hydrological parameters<br />
including surface slope, roughness, percent imperviousness and infiltration capacity were calculated<br />
for a cluster from the parameters of individual sewer sheds encompassed in the cluster. The MOUSE<br />
model automatically assigned precipitation data from the closest 2 km by 2 km grid to each of the<br />
clusters. Calibration of the hydrologic parameters was achieved using the flow data monitored during<br />
the calibration/ validation period in three hydrologically unique sewer sheds in the District. In<br />
addition, the parameters developed using more rigorous calibration procedures in the adjacent<br />
combined sewer system were used as guidance in the finalization of calibration parameters. The<br />
MOUSE model was run successively for all the calibration/ validation events, and the postprocessing<br />
programs were used to develop continuous time-series of flow data for receiving water<br />
model application.<br />
Since the separate storm water system does not include detailed hydraulic elements, only the<br />
precipitation database required modification in the adaptation of the calibrated model for forecasting<br />
purposes. The MOUSE model was again run successively for all the 171 precipitation events, and the<br />
continuous pollutographs for receiving water model application were developed using the postprocessing<br />
programs.<br />
\\Gh-wash\ENG 1160\LTCP\LTCP Final\Sec 4.doc 4-21 FINAL - July 2002
Receiving <strong>Water</strong>s Characterization<br />
Section 5<br />
Receiving <strong>Water</strong>s Characterization<br />
5.1 INTRODUCTION<br />
A receiving water monitoring and modeling program for the Anacostia River, Potomac River, and<br />
Rock Creek was conducted concurrently with the CSS and SSWS monitoring and modeling<br />
programs to collect a sufficient amount of water quality data to quantify real-time impacts associated<br />
with CSOs and other pollutant sources. Other objectives of monitoring were to identify existing<br />
pollutant sources and impacts, define baseline conditions, and to support the development of reliable<br />
models. Event mean concentrations for the receiving waters for the forecast period 1988-1990 were<br />
calculated and calibrated using the monitoring data. Each of the three receiving waters was divided<br />
into a number of discrete segments for modeling purposes. <strong>Water</strong> quality parameter concentrations<br />
were then calculated for each discrete segment. Receiving water data collected by other<br />
municipalities and jurisdictions, as well as historical data were considered. The receiving water<br />
monitoring program was conducted by the Metropolitan Washington Council of Governments<br />
(COG). The receiving water modeling program utilized existing models for each receiving water.<br />
The models were updated and modified to assess water quality impacts as part of the LTCP<br />
development effort. Wet weather impacts on water quality in the receiving waters, as determined by<br />
monitoring and modeling programs, are discussed in Section 6.<br />
5.2 MONITORING PROGRAM<br />
Table 5-1 lists the parameters that were analyzed during each component of the receiving water<br />
monitoring program. The sampling locations for the fecal coliform and e. coli monitoring, wet<br />
weather surveys, continuous monitoring, and boundary condition monitoring are shown on Figure<br />
5-1.<br />
5.2.1 Baseline Bacteriological Monitoring (Fecal Coliform and E. Coli Monitoring)<br />
Regular sampling for total coliform and fecal coliform, as well as field parameters (temperature,<br />
D.O., pH and conductivity) was performed at six (6) locations on the Anacostia, three (3) on the<br />
Potomac, and seven (7) on Rock Creek. In addition, samples for e. coli were collected at three (3)<br />
locations on the Anacostia, two (2) on the Potomac, and three (3) on Rock Creek. The sampling was<br />
conducted twice per week for a ten (10) month period between December 1999 and October 2000.<br />
Since the sampling was at regular intervals, the data collected represents wet and dry weather<br />
conditions. The complete data is in MWCOG 2000a, 2000b, 2000c, and 2001a.<br />
5.2.2 Anacostia Wet Weather Surveys<br />
Wet weather surveys were performed to determine impacts of CSO and stormwater on water quality<br />
during and after a storm. This data is also used to support model calibration and verification. In the<br />
Anacostia River, four (4) wet weather surveys were performed. For each survey, samples were<br />
\\Gh-wash\ENG 1160\LTCP\LTCP Final\Sec 5.doc 5-1 FINAL - July 2002
Receiving <strong>Water</strong>s Characterization<br />
collected at five (5) locations in the Anacostia every 4 hours for a 48-hour period. Analyses included<br />
field parameters, conventional pollutants, and bacteriological parameters for one of the storms. The<br />
data is presented in MWCOG 2001b.<br />
Table 5-1<br />
Parameters for Receiving <strong>Water</strong> Monitoring<br />
Wet<br />
Weather<br />
Baseline Weekly<br />
Continuous<br />
Monitoring<br />
Boundary Condition Monitoring<br />
SOD Study<br />
Parameter<br />
Anacostia Anacostia Rock Creek/<br />
Potomac<br />
Temperature x x x x x<br />
Anacostia Anacostia Potomac Rock Creek Anacostia<br />
PH x x x x x x<br />
D.O. x x x x x x<br />
Conductivity x x x x x x<br />
Turbidity x x x x<br />
Fecal Coliform x x x x x x<br />
Total Coliform x x x x x x<br />
E. coli x x<br />
Alkalinity x x<br />
BOD x x<br />
COD<br />
Chlorophyll a x x x<br />
CBOD5 (total) x x<br />
Hardness<br />
Dis. Org. Carbon x x x<br />
Total Org. Carbon x x x<br />
Total Phosphorus x x x x<br />
Ortho Phosphate x x x x<br />
Total Soluble Phos. x x<br />
TKN x x x x<br />
SKN x x<br />
Total Nitrogen<br />
NH3 as N x x x x<br />
(NO2 +NO3) as N x x x x x<br />
TSS x x x<br />
TDS<br />
VSS x x<br />
Hydrogen sulfide<br />
Oxygen demand<br />
Methane<br />
Carbon Isotopes<br />
Nitrogen Isotopes<br />
x<br />
x<br />
x<br />
x<br />
x<br />
x<br />
x<br />
x<br />
x<br />
\\Gh-wash\ENG 1160\LTCP\LTCP Final\Sec 5.doc 5-3 FINAL - July 2002
Receiving <strong>Water</strong>s Characterization<br />
5.2.3 Continuous Monitoring Program – Anacostia River<br />
COG operated continuous monitors at three locations on the Anacostia (Seafarer's Marina, Benning<br />
Road, and below the Navy Yard CSO Area). The monitors were operated from April through<br />
October, 1999-2000. Data (temperature, D.O. pH and conductivity) was collected every 30 minutes<br />
at these locations. The complete data is in MWCOG 2000a, 2000b, 2000c, and 2001a.<br />
5.2.4 Boundary Condition Monitoring<br />
The purpose of boundary condition monitoring was to assess the pollutant load in the receiving<br />
waters at the District Boundaries, upstream of CSOs.<br />
For Rock Creek, bacteriological constituents are the primary parameters of concern and were<br />
collected as part of the baseline bacteriological program (5.2.1). For the other parameters, historical<br />
data from 1985-1995 was used to develop the boundary conditions needed for the water quality<br />
models.<br />
For the Potomac River, COG currently operates an existing monitoring system at Chain Bridge.<br />
Samples collected at this station were tested for many parameters, including: temperature, DO, pH,<br />
conductivity, TSS, turbidity, dissolved organic carbon, TKN, ammonia, alkalinity, BOD, fecal<br />
coliform, total coliform, chlorophyll, alkalinity, and hardness. The fecal data was collected<br />
approximately once per month. In order to characterize the boundary conditions of the<br />
bacteriological parameters, sampling was conducted upstream of the CSOs as described in the<br />
baseline bacteriological monitoring (5.2.1).<br />
For the Anacostia River, two boundary monitors were installed just above the confluence of the<br />
Northwest and Northeast Branches of the river upstream of the District boundary. They were<br />
installed at the USGS Flow Gage Stations located in Bladensburg MD. The program operated<br />
between August 1999 and April 2000. Base flow samples were collected weekly and/or biweekly<br />
during the monitoring period, storm samples were collected using automatic flow samplers that were<br />
programmed to automatically composite samples. Samplers were programmed to automatically<br />
collect a sample aliquot when the incremental flow differential in the river exceeded a threshold<br />
level. Samples aliquots were then taken on an equal flow-paced interval so that a flow-weighed<br />
composite sample was collected. Fifteen to sixteen storm samples were collected during the<br />
monitoring period.<br />
In addition to this monitoring, additional bacteriological monitoring was conducted at the Anacostia<br />
boundary stations. Total and fecal coliform samples and e. coli samples were collected between<br />
March 2000 and October 2000 to increase the database of bacteriological data at the upstream<br />
boundary.<br />
\\Gh-wash\ENG 1160\LTCP\LTCP Final\Sec 5.doc 5-4 FINAL - July 2002
Receiving <strong>Water</strong>s Characterization<br />
5.2.5 Sediment Oxygen Demand (SOD) Study<br />
The oxygen demand exerted by sediment in the Anacostia River affects dissolved oxygen levels in<br />
the water body. Dissolved oxygen is a water quality parameter of concern. In addition, CSOs,<br />
separate storm water discharges, and upstream sources contribute to the sediment load in receiving<br />
waters. Three separate sampling events were conducted between June 2000 and December 2000 to<br />
characterize the oxygen demands from the Anacostia Sediments. The results of this sampling<br />
program are presented in “Sediment Oxygen Demand in the Anacostia River” MWCOG 2001c.<br />
5.2.6 Quality Assurance Project <strong>Plan</strong><br />
All of the receiving water monitoring activities were conducted in accordance with the Quality<br />
Assurance Project <strong>Plan</strong> (QAPP) that was approved by the EPA and <strong>DC</strong> DOH in August 1999<br />
(EPMC-III, 1999). The purpose of the QAPP was to document the type and quality of data needed,<br />
and the procedures required to assure that the data was collected and managed in a manner consistent<br />
with applicable requirements and generally accepted and approved quality assurance objectives.<br />
Analytical data and documentation of QA/QC procedures was submitted to the EPA in February<br />
2000, June 2000, October 2000, and January 2001.<br />
5.3 EVENT MEAN CONCENTRATIONS<br />
Running the receiving water models requires the input of flows and loads from many sources. This<br />
includes both upstream sources and sources within the District. <strong>Water</strong> quality of these sources was<br />
characterized by event mean concentrations (EMCs). EMCs were developed for all of the water<br />
quality constituents required for modeling. Loads were developed by multiplying the EMCs by flow<br />
and appropriate conversion factors.<br />
EMCs were calculated for the upstream boundary of each receiving water. For the Potomac River,<br />
the boundary is at Chain Bridge. In Rock Creek, the boundary of the model was the <strong>DC</strong>/MD line. In<br />
the model of the Anacostia River, the confluence of the NW & NE branches of the river was used as<br />
the upstream boundary. In all three receiving waters, monitoring data was available near these<br />
boundaries, and this data was used to calculate the EMCs. The monitoring stations used include<br />
stations at Chain Bridge on the Potomac River and a station on Rock Creek just north of the <strong>DC</strong><br />
boundary in Montgomery County. Stations on the NW and NE branches of the Anacostia just<br />
upstream of their confluence were used for the Anacostia boundary.<br />
Base flow and storm flow EMCs were calculated for each of these boundaries. This was done to<br />
allow for the different constituent concentrations observed under dry and wet weather flow<br />
conditions. This is particularly important for bacteria (fecal coliform and e. coli) and total suspended<br />
solids (TSS) where the base flow or dry weather concentration is often much smaller than the storm<br />
flow or wet weather concentration. The flow record for the USGS gage closest to each of the<br />
\\Gh-wash\ENG 1160\LTCP\LTCP Final\Sec 5.doc 5-5 FINAL - July 2002
Receiving <strong>Water</strong>s Characterization<br />
monitoring stations was analyzed to determine whether a certain day is a base flow or storm flow<br />
day. This was accomplished by applying HYSEP, a USGS program that separates a hydrograph or<br />
flow series into base flow and storm flow days. This record of base flow and storm flow was then<br />
used to sort the monitoring data according to base flow and storm flow days, and lead to the<br />
identification of the EMCs given in Table 5-2.<br />
Parameter<br />
Table 5-2<br />
Receiving <strong>Water</strong> Boundary Conditions – Event Mean Concentrations<br />
Units<br />
Rock Creek 1 Anacostia River –<br />
Northwest Branch 2 Anacostia River –<br />
Northeast Branch 2<br />
Base<br />
Base<br />
Storm Flow Flow Storm Flow Flow<br />
Base<br />
Flow<br />
Potomac River<br />
Storm<br />
Flow Base Flow Storm Flow<br />
CBOD 5<br />
mg/L 2.7 3.2 1 8.02 1.08 5.55 2.7 3.2<br />
NH3 mg/L as N 0.2 0.22 0.03 0.08 0.05 0.08 0.02 0.07<br />
TSS mg/L 12 94 3 311 7 475 5 to 15 3 35 to 212 3<br />
DO mg/L 8.6 to 15.3 4 7.6 to 15.8 5 7.6 to 15.8 5 7.4 to 15.3 4<br />
OrgN mg/L as N 0.5 0.53 0.38 2.91 0.49 2.11 0.54 to 1.3 3 0.34 to 0.42 3<br />
NOx mg/L as N 1.1 1.17 1.06 0.54 0.85 0.59 0.99 to 1.47 3 0.79 to 1.56 3<br />
PO4 mg/L 0.02 0.04 0.03 0.05 0.02 0.05 0.04 to 0.06 3 0.02<br />
OrgP mg/L 0.07 0.11 0.01 0.41 0.05 0.46 0.01 to 0.04 3 0.01 to 0.02 3<br />
Chla mg/L 0 0 1.37 1 1.09 1 0 0<br />
Fecal<br />
coliform<br />
#/100 ml<br />
280 2,100 500 8,000 500 8,000 60 350<br />
E. coli #/100 ml 230 900 200 3,500 200 3,500 30 190<br />
Notes:<br />
1. The EMC values for Rock Creek are also used for Cameron Run and Four Mile Run in Virginia<br />
2. A flow weighted composite of the NE & NW Branch Anacostia EMCs was used for Lower Beaverdam<br />
3. The EMC varied with flow. See Table 5-5 for detailed information<br />
4. The dissolved oxygen EMC varies by month. See Table 5-4 for detailed information<br />
5. The Anacostia River dissolved oxygen concentration was given as 90% of saturation<br />
EMC values for tributaries and other inputs to the receiving waters were also calculated. Monitoring<br />
data on Piscataway Creek and Pimmit Run were used to determine EMCs for these streams. A<br />
combination of monitoring data and DMR reports were used to calculate EMCs for the Alexandria,<br />
Arlington and Blue Plains Wastewater Treatment <strong>Plan</strong>ts. The EMC’s for the Alexandria and<br />
Arlington Wastewater Treatment <strong>Plan</strong>ts are shown in Table 5-3. The EMCs for Blue Plains are<br />
presented in Section 4.<br />
\\Gh-wash\ENG 1160\LTCP\LTCP Final\Sec 5.doc 5-6 FINAL - July 2002
Receiving <strong>Water</strong>s Characterization<br />
Table 5-3<br />
Event Mean Concentrations for Streams and other Permitted Discharges<br />
Piscataway Creek 1 Pimmit Run<br />
Alexandria and<br />
Arlington WWTP<br />
Parameter Units Base Flow Storm Flow Base Flow Storm Fow All Data<br />
CBOD 5<br />
mg/L 2.2 2.2 1.3 1.5 2<br />
NH3 mg/L as N 0.13 0.09 0.03 0.04 1.5<br />
TSS mg/L 12 12 12 94 7<br />
DO mg/L 5.7 to 12.6 2 8.7 to 13.8 2 6<br />
OrgN mg/L as N 1.14 0.98 0.2 0.27 NA<br />
Nox mg/L as N 1.41 1.01 0.17 0.22 NA<br />
PO4 mg/L 0.05 0.06 0.02 0.03 NA<br />
OrgP mg/L 0.06 0.08 0.09 0.08 NA<br />
Chla mg/L 0 0 0 0 0<br />
Fecal<br />
coliform.<br />
#/100 ml<br />
750 2,200 200 890 1.8<br />
E. coli #/100 ml 420 1,220 110 490 0.9<br />
Notes:<br />
1. The EMC values for Piscataway Creek were also used for Henson Creek and Oxon Run<br />
2. The dissolved oxygen value varies by month. See Table 5-4 for detailed information<br />
The variability of dissolved oxygen at the boundary as a function of month is shown in Table 5-4.<br />
Table 5-4<br />
Monthly Dissolved Oxygen Event Mean Concentrations at Boundaries<br />
Dissolved Oxygen Concentration in mg/L<br />
Location Jan Feb Mar Apr May Jun Jul Aug Sep Oct Nov Dec<br />
Rock Creek 14.9 15.3 12 11 8.9 8.6 8.6 8.6 9.5 10.3 11.7 13.6<br />
Potomac 14.9 15.3 12 11 8.9 8.6 7.4 7.8 8.2 10.3 11.7 13.6<br />
Piscataway 12.3 12.6 11.3 10.2 8.6 6.9 5.7 5.8 6.6 7.6 9.5 11.6<br />
Pimmit Run 13.2 13.8 12.4 11.1 10.1 8.9 8.7 8.9 8.8 10.2 11.6 13.6<br />
Some constituents in the Potomac received even further breakdown based upon season and flow. The<br />
EMCs were determined as a function of wet and dry weather and of flow rate in the Potomac. The<br />
EMCs are shown in Table 5-5. This follows previous work done by MWCOG in the Potomac<br />
(MWCOG, 1987).<br />
\\Gh-wash\ENG 1160\LTCP\LTCP Final\Sec 5.doc 5-7 FINAL - July 2002
Receiving <strong>Water</strong>s Characterization<br />
Table 5-5<br />
Flow Varying Event Mean Concentrations for the Potomac River Boundary<br />
Base Flow (cfs)<br />
Storm Flow (cfs)<br />
Parameter Units Q < 2,000 Q
Receiving <strong>Water</strong>s Characterization<br />
A schematic of the model segmentation showing 35 completely mixed segments is presented in<br />
Figure 5-2 along with CSO outfalls.<br />
The state variables simulated within TAM/WASP are as follows:<br />
<br />
<br />
<br />
<br />
<br />
<br />
<br />
<br />
Fecal coliform<br />
E. coli<br />
Oxidized nitrogen (NO2 and NO3)<br />
Ammonia<br />
Organic nitrogen<br />
Organic phosphorus<br />
Inorganic phosphorus<br />
Phytoplankton (chl-a)<br />
CBOD 5<br />
Dissolved Oxygen<br />
Fecal coliform and e. coli are new state variables, as they were not previously modeled within<br />
TAM/WASP.<br />
TAM/WASP also contains a sediment oxygen demand sub-model that predicts sediment oxygen<br />
demand and associated fluxes of aqueous methane, gaseous methane, ammonia, and gaseous<br />
nitrogen. The state variables of principal interest in the assessment of CSO impacts and the ability of<br />
CSO controls to improve water quality were dissolved oxygen, fecal coliform and e. coli.<br />
The water quality model was calibrated with observed data available for a nine-month period<br />
extending from October 1999 through June 2000. Loads from the combined sewer system and<br />
separate storm water system were obtained by running the calibrated models for the sewer systems,<br />
using the actual rainfall measured during the monitoring period. Flow and pollutant loads at the<br />
District/Maryland Boundary were obtained from data collected during the monitoring period.<br />
Additional detail on the development and calibration of TAM/WASP is described in Study<br />
Memorandum LTCP 6-7.<br />
Application of the model in development of the LTCP focused on a three-year simulation period of<br />
1988 to 1990 wherein observed rainfall and upstream flow for this period were the principal driving<br />
mechanisms. The major loading inputs to the model are upstream loads generated in Maryland,<br />
separate storm water loads generated within <strong>DC</strong>, and the CSO loads generated within <strong>DC</strong>.<br />
\\Gh-wash\ENG 1160\LTCP\LTCP Final\Sec 5.doc 5-9 FINAL - July 2002
Receiving <strong>Water</strong>s Characterization<br />
Potomac River<br />
D.C<br />
MD N<br />
Wilson<br />
Bridge<br />
12<br />
Segment #<br />
Typ<br />
Arlington<br />
Bridge<br />
Roosevelt<br />
Bridge<br />
Key<br />
Bridge<br />
3<br />
Chain<br />
Bridge<br />
11<br />
4<br />
060<br />
002 001<br />
003<br />
10<br />
14 th St.<br />
Brdg.<br />
6<br />
5<br />
027,<br />
028<br />
Blue Plains<br />
Flow<br />
Anacostia River<br />
020<br />
021<br />
022<br />
023/<br />
024<br />
Rock<br />
Cree<br />
025,<br />
026<br />
Potomac<br />
River<br />
Haines<br />
Point<br />
35<br />
South<br />
Capital<br />
009, 010, 011,<br />
011a, 012<br />
013, 014<br />
N<br />
Poto<br />
mac<br />
River<br />
031<br />
050<br />
M St.<br />
Flow<br />
Legend<br />
P St.<br />
004<br />
051 053<br />
052<br />
032, 033,<br />
034, 035<br />
005<br />
006<br />
11 th St. 25<br />
007<br />
054<br />
CSO Outfall No.<br />
CSO Location<br />
17 Model Segment<br />
No.<br />
7<br />
Mass<br />
Ave.<br />
056<br />
036,<br />
037,<br />
038<br />
039,<br />
040<br />
057<br />
041-<br />
043<br />
058<br />
015, 016<br />
Penn.<br />
Ave<br />
017<br />
National<br />
Zoo<br />
044<br />
045<br />
018<br />
17<br />
22<br />
Rock<br />
Creek<br />
048<br />
18<br />
Flow<br />
Anacostia<br />
River<br />
046<br />
019<br />
20<br />
047<br />
049<br />
Tilden<br />
17<br />
008<br />
East<br />
Capitol<br />
Broad<br />
Branch<br />
Piney<br />
Branch<br />
Flow<br />
15<br />
Benning<br />
Rd.<br />
Military<br />
Rd.<br />
Flow<br />
059<br />
New York Ave<br />
MD<br />
<strong>DC</strong><br />
Figure 5-2<br />
Receiving <strong>Water</strong> Models Segmentation<br />
7<br />
N<br />
Confluence of<br />
NE and NW<br />
Branches<br />
1<br />
<strong>DC</strong><br />
MD<br />
40<br />
\\Gh-wash\ENG 1160\LTCP\LTCP Final\Sec 5.doc 5-10 FINAL - July 2002
Receiving <strong>Water</strong>s Characterization<br />
5.4.2 Potomac River<br />
The Potomac River was modeled using EPA’s Dynamic Estuary Model, or DEM (EPA, 1979). DEM<br />
is a one-dimensional model that consists of a hydrodynamic model (DYNHYD) that simulates water<br />
movement, and a water quality model (DYNQUAL) that simulates mass transport and the water<br />
quality. DEM encompasses the entire length of the tidal Potomac River from the head of tide at<br />
Chain Bridge in <strong>DC</strong> to the mouth of the Potomac at its confluence with the Chesapeake Bay. The<br />
zone of interest for the LTCP was limited to the upper tidal Potomac between Chain Bridge and the<br />
Woodrow Wilson Bridge. The model segments and CSO discharges within this area are presented in<br />
Figure 5-2.<br />
DEM is an approved regulatory modeling tool that has been used on several major studies and<br />
feasibility plans including the original <strong>DC</strong> CSO Abatement Study (O’Brien & Gere, 1983), the Blue<br />
Plains Feasibility Study (Greeley and Hansen, 1985), and the Potomac Dissolved Oxygen Study<br />
(LTI, 1988). The state variables within DEM include:<br />
<br />
<br />
<br />
<br />
Fecal coliform<br />
E. coli<br />
Total Kjeldahl Nitrogen (TKN)<br />
Total phosphorus<br />
CBOD 5<br />
Dissolved Oxygen<br />
While it was originally developed as a eutrophication model, application of DEM since the early<br />
1980s has been limited to the assessment of bacteria and dissolved oxygen issues. The state variables<br />
of principal interest in the assessment of CSO impacts and the ability of CSO controls to improve<br />
water quality were dissolved oxygen, fecal coliform and e. coli.<br />
The hydraulic model was retested but not calibrated in this study as it had been calibrated in earlier<br />
efforts. A limited calibration of the bacteria variables was undertaken with the available data for a<br />
nine-month period extending from October 1999 through June 2000.<br />
Application of the model in development of the LTCP focused on a three-year simulation period of<br />
1988 to 1990 wherein observed rainfall and upstream flow for this period were the principal driving<br />
mechanisms. The major loading inputs to the model are upstream loads generated in the Potomac<br />
<strong>Water</strong>shed, separate storm water loads generated within <strong>DC</strong>, separate storm water loads generated<br />
within Maryland and Virginia tributaries that flow directly to the tidal Potomac, <strong>DC</strong> and Northern<br />
Virginia WWTP discharges, and the CSO loads generated within <strong>DC</strong>.<br />
\\Gh-wash\ENG 1160\LTCP\LTCP Final\Sec 5.doc 5-11 FINAL - July 2002
Receiving <strong>Water</strong>s Characterization<br />
5.4.3 Rock Creek<br />
Rock Creek was modeled using EPA’s Storm <strong>Water</strong> Management Model, or SWMM (Huber and<br />
Dickinson, 1988). The TRANSPORT Block of SWMM was applied to model hydraulics and<br />
pollutant transport. This application built upon earlier modeling efforts undertaken as part of the<br />
original CSO Abatement Study (LTI, 1981). In particular, the cross-sectional data and slope<br />
information from the earlier effort were used extensively in construction of SWMM input. SWMM<br />
is a one-dimensional model. A network of 40 model segments were utilized to describe the <strong>DC</strong><br />
portion of Rock Creek extending from the MD/<strong>DC</strong> line to the mouth near Thompson’s Boat House.<br />
An additional 3 model segments were utilized to describe a short section of Piney Branch. The model<br />
segments and CSO discharges within this area are presented in Figure 5-2.<br />
The state variables incorporated within the Rock Creek Model were fecal coliform and e. coli. The<br />
hydraulic model was tested for conservation of mass. Centering largely on adjustment of first-order<br />
decay, the bacteria components of the model were calibrated with the available data for the ninemonth<br />
period extending from October 1999 through June 2000. Dissolved oxygen was not modeled<br />
as there is no evidence of dissolved oxygen problems in Rock Creek.<br />
Application of the model in development of the LTCP focused on a three-year simulation period of<br />
1988 to 1990 wherein observed rainfall and upstream flow for this period were the principal driving<br />
mechanisms. The major loading inputs to the model are upstream loads generated in the Montgomery<br />
County portion of the watershed, separate storm water loads generated within <strong>DC</strong>, and the CSO loads<br />
generated within <strong>DC</strong>.<br />
\\Gh-wash\ENG 1160\LTCP\LTCP Final\Sec 5.doc 5-12 FINAL - July 2002
Pollutant Loads and Predicted <strong>Water</strong> Quality<br />
Section 6<br />
Pollutant Loads and Predicted <strong>Water</strong> Quality<br />
6.1 INTRODUCTION<br />
This section describes the pollutant loads on the receiving waters and the predicted water quality for<br />
each receiving water based on WASA’s past CSO abatement efforts and currently planned<br />
improvements. In addition to CSOs, pollution sources such as storm water, sediments (in the<br />
Anacostia River) and natural background sources also affect water quality. Much of the time, the<br />
water flowing into the District does not meet water quality standards due to upstream sources of<br />
pollution. In many cases, these other factors would prohibit the attainment of water quality standards<br />
even if no CSO discharges occurred. While the LTCP is required only to address CSO issues,<br />
WASA is considering these other factors as part of a watershed approach to improving water quality.<br />
6.2 CSO OVERFLOW PREDICTIONS<br />
The combined sewer system model was used to predict CSO overflow frequency and volume for the<br />
average year conditions. As described previously in Sections 2 and 3, the average year is defined as<br />
the arithmetic average of the predictions for years 1988, 1989 and 1990. Overflow predictions were<br />
made to determine the benefits provided by the existing Phase I CSO <strong>Control</strong>s and the expected<br />
benefits from the planned Pump Stations Rehabilitation as follows:<br />
<br />
Scenario B1- Prior to Phase I CSO <strong>Control</strong>s – This was the configuration of the CSS prior to<br />
implementation of the Phase I CSO controls in the early 1980’s. No inflatable dams were<br />
present and the Northeast Boundary Swirl Facility did not exist. The capacities of the Main<br />
and Potomac Pumping Stations were 200 mgd and 265 mgd, respectively.<br />
<br />
Scenario C2 – Phase I CSO <strong>Control</strong>s – This was the system configuration after the Phase I<br />
CSO controls were constructed. It includes the addition of the inflatable dams for in-system<br />
storage and the Northeast Boundary Swirl Facility. The capacities of the Main and Potomac<br />
Pumping Stations were 200 mgd and 265 mgd, respectively.<br />
<br />
Scenario C3 – Phase I CSO <strong>Control</strong>s and Pump Stations Rehabilitation – This scenario<br />
includes the Phase I CSO controls and rehabilitation of Main and Potomac Pumping Stations<br />
to achieve firm pumping capacities of 240 and 460 mgd, respectively. WASA’s current<br />
capital improvement program as of June 2001 includes rehabilitation of the Main, Eastside,<br />
and Poplar Point Pump stations and replacement of the inflatable dams. Rehabilitation of the<br />
Potomac Pump Station is currently in the study phase.<br />
The predicted CSO overflow volumes for each of the scenarios is summarized in Table 6-1.<br />
\\Gh-wash\ENG 1160\LTCP\LTCP Final\Sec 6.doc 6-1 FINAL - July 2002
Pollutant Loads and Predicated <strong>Water</strong> Quality<br />
Table 6-1<br />
Annual CSO Overflow Predictions for Average Year<br />
(Average of 1988-1990)<br />
No.<br />
Scenario<br />
Anacostia<br />
River<br />
CSOs<br />
Potomac<br />
River<br />
CSOs<br />
Overflow Volume (mg)<br />
Rock Creek<br />
CSOs (Excluding<br />
Luzon Valley ,<br />
CSO 059)<br />
CSO<br />
Total<br />
Blue Plains<br />
Excess Flow<br />
(Outfall 001)<br />
B1 Prior to CSO Phase I <strong>Control</strong>s 2,142 1,063 49 3,254 1,517<br />
C2 Phase I CSO <strong>Control</strong>s 1,485 953 52 2,490 2,012<br />
C3 With Phase I CSO <strong>Control</strong>s and<br />
Pump Station Rehabilitation (Main<br />
at 240 mgd, Potomac at 460 mgd)<br />
1,282 639 49 1,969 2,428<br />
As can be seen in the table above, Phase I <strong>Control</strong>s provided significant CSO reduction and increased<br />
the amount of flow receiving excess flow treatment at BPWWTP. The planned Pump Stations<br />
Rehabilitation program will also reduce CSOs and increase flow receiving excess flow treatment.<br />
Note that the total CSO overflow volume to Rock Creek is calculated excluding Luzon Valley (CSO<br />
059) since this area has been separated. The predicted CSO overflow volume and frequency for each<br />
CSO in scenario C3 is shown in Table 6-2.<br />
Table 6-2<br />
Annual CSO Overflow Predictions for Average Year (Average of 1988-1990) 1<br />
Scenario C3 – Phase I <strong>Control</strong>s and Pump Station Rehabilitation<br />
CSO<br />
NPDES<br />
No.<br />
004<br />
Description<br />
Anacostia River CSOs<br />
No. of<br />
Overflows<br />
CSO<br />
Overflow<br />
Volume (mg)<br />
CSO<br />
NPDES<br />
No.<br />
Description<br />
Rock Creek CSOs<br />
No. Overflows<br />
No. /yr<br />
CSO Overflow<br />
Volume (mg)<br />
Poplar Point Emergency<br />
Relief 0 0.00 031 Penn Ave 9 0.22<br />
005 Ft. Stanton 73 16.54 032 26th - M St 0 0.00<br />
006 Ft. Stanton 5 0.11 033 N St. - 25th St 6 4.48<br />
007 Ft. Stanton 64 36.97 034<br />
Slash Run Trunk<br />
<strong>Sewer</strong> 0 0.00<br />
008<br />
Anacostia Main Interceptor<br />
Relief 0 0.00 035 Northwest Boundary 0 0.00<br />
009 B St./New Jersey Avenue 54 16.84 036 Mass Ave & 24th 29 1.64<br />
010 B St./New Jersey Avenue 18 247.21 037 Kalorama Circle West 3 0.05<br />
011 B St./New Jersey Avenue 0 0.00 038 Kalorama Circle East 0 0.00<br />
011a B St./New Jersey Avenue 0 0.00 039 Belmont Rd 0 0.00<br />
012 Tiber Creek 6 21.74 040 Biltmore St 1 0.03<br />
013 Canal Street <strong>Sewer</strong> 28 9.78 041 Ontario Rd 0 0.00<br />
014 Navy Yard 49 38.98 042 Quarry Rd 0 0.00<br />
015 Navy Yard 12 0.72 043 Irving St. 1 0.15<br />
\\Gh-wash\ENG 1160\LTCP\LTCP Final\Sec 6.doc 6-2 FINAL - July 2002
Pollutant Loads and Predicted <strong>Water</strong> Quality<br />
CSO<br />
NPDES<br />
No.<br />
Description<br />
No. of<br />
Overflows<br />
CSO<br />
Overflow<br />
Volume (mg)<br />
CSO<br />
NPDES<br />
No.<br />
Description<br />
No. Overflows<br />
No. /yr<br />
CSO Overflow<br />
Volume (mg)<br />
Anacostia River CSOs<br />
Rock Creek CSOs<br />
016 Navy Yard 24 13.30 044 Kenyon St. 0 0.00<br />
017 Navy Yard 32 20.05 045 Lamont St. 2 0.03<br />
018 Navy Yard 35 4.70 046 Park Road 2 0.01<br />
019<br />
Northeast Boundary Swirl<br />
Effluent 36 645.64 047 Ingleside Terr. 3 0.25<br />
019<br />
Northeast Boundary Swirl<br />
Bypass 13 209.17 048 Oak St-Mt Pleasant 2 0.08<br />
Anacostia Subtotal 1,282 049 Piney Branch 25 39.73<br />
Potomac River CSOs 050 M St -27th St 0 0.00<br />
003 Bolling Overflow 0 0 051 Olive - 29th St. 0 0.00<br />
020 Easby Point 21 54.81 052 O St.-31st St, 0 0.00<br />
021 Potomac Pump Station 30 458.43 053 Q St 0 0.00<br />
022 I St. – 22 nd St. NW 30 30.04 054<br />
West Rock Creek<br />
Diversion <strong>Sewer</strong> 0 0.00<br />
023/024<br />
West Rock Creek Diversion<br />
<strong>Sewer</strong> 17 16.23 055 Abandoned 0<br />
025 31st & K St NW 14 0.16 056 Normanstone Dr. 0 0.00<br />
026 <strong>Water</strong> St District (WRC) 0 0.00 057<br />
Cleveland - 28th St &<br />
Conn. Ave 15 2.33<br />
027 Georgetown 72 52.50 058 Connecticut Ave. 0 0.00<br />
028 37th St- Georgetown 13 0.49 059 Luzon Valley 87 171.56<br />
029 College Pond 56 26.00 Rock Creek Subtotal (Including Luzon Valley) 221<br />
030 Abandoned 0 0 Rock Creek Subtotal (Excluding Luzon Valley) 49<br />
060 Little Falls Branch 0 0.00<br />
Potomac Subtotal 639<br />
6.3 ANACOSTIA RIVER<br />
6.3.1 Pollutant Loads to Anacostia River<br />
Using the models for the CSS, SSWS, data on boundary condition flow rates for the years 1988-<br />
1990, and the event mean concentrations for each pollutant source; the pollutant load to the<br />
Anacostia River was calculated for the average year. The load sources were divided into the<br />
following categories:<br />
<br />
<br />
<br />
CSO Overflow – represents overflow from the CSS and includes CSO that is treated by the<br />
Northeast Boundary Swirl Facility.<br />
D.C. Storm <strong>Water</strong> – this consists of District’s separate storm water system and flow from<br />
Hickey Run and Watts Branch.<br />
Other Storm <strong>Water</strong> – represents storm water from park lands on each side of the Anacostia<br />
that are not conveyed through storm pipes, but instead run off directly to the river.<br />
Examples include Anacostia Park and portions of the National Arboretum.<br />
Load estimates are summarized in Table 6-3 and on Figures 6-1 through 6-2.<br />
\\Gh-wash\ENG 1160\LTCP\LTCP Final\Sec 6.doc 6-3 FINAL - July 2002
Pollutant Loads and Predicated <strong>Water</strong> Quality<br />
Table 6-3<br />
Sources of Pollutant Loads to Anacostia River Within District<br />
Phase I <strong>Control</strong>s and Pump Station Rehabilitation (Average 1988-1990)<br />
Pollutant Source<br />
CBOD5<br />
(lb/yr x 1000)<br />
TSS<br />
(lb/yr x 1000)<br />
Fecal Coliforms<br />
(#/yr x 10 14 )<br />
E. Coli<br />
(#/yr x 10 14 )<br />
CSO Overflow 443 1,490 254 181<br />
D.C. Storm <strong>Water</strong> 771 3,815 52 30<br />
Other Storm <strong>Water</strong> 44 376 5 3<br />
Upstream 1,937 115,967 104 46<br />
Total 3,195 121,648 415 260<br />
Figure 6-1<br />
Sources of CBOD5 to Anacostia River<br />
CSO<br />
Overflow<br />
14%<br />
Figure 6-2<br />
Sources of Fecal Coliform to Anacostia<br />
River<br />
CSO<br />
Overflow<br />
61%<br />
Upstream<br />
61%<br />
D.C. Storm<br />
<strong>Water</strong><br />
24%<br />
Other<br />
Storm<br />
<strong>Water</strong><br />
1%<br />
Upstream<br />
25%<br />
Other Storm<br />
<strong>Water</strong><br />
1%<br />
D.C. Storm<br />
<strong>Water</strong><br />
13%<br />
Note that for CBOD5 and TSS, upstream load sources predominate. For bacteriological parameters,<br />
CSOs are a significant source but modeling indicates that even with total CSO removal the remaining<br />
loads to not allow water quality standards to be met.<br />
6.3.2 Predicted <strong>Water</strong> Quality for the Anacostia River<br />
Using the loads and flows predicted above, the Anacostia River receiving water model was run<br />
continuously for the period 1988-1990. The arithmetic average of the three years is defined as the<br />
average year condition. The predicted water quality with the loads sources for the C3 Scenario is<br />
shown on Figure 6-3.<br />
\\Gh-wash\ENG 1160\LTCP\LTCP Final\Sec 6.doc 6-4 FINAL - July 2002
District of Columbia <strong>Water</strong> and <strong>Sewer</strong> Authority<br />
<strong>Combined</strong> <strong>Sewer</strong> <strong>System</strong> <strong>Long</strong> <strong>Term</strong> <strong>Control</strong> Paln<br />
Figure 6-3<br />
Anacostia River Predicted <strong>Water</strong> Quality<br />
Phase I <strong>Control</strong>s and Pump Station Rehabilitation (Scenario C3)<br />
Fecal Coliforms - Time Exceeding Class A Standard<br />
# of Days Fecal >200 (All Loads) # of Days Fecal >200 (CSO Loads Only)<br />
# of Mos Geomean>200<br />
350<br />
12<br />
# of Days/yr<br />
300<br />
250<br />
200<br />
150<br />
100<br />
50<br />
10<br />
8<br />
6<br />
4<br />
2<br />
# of Months<br />
0<br />
Haines Point South Capital<br />
St.<br />
Navy Yard RFK Stadium <strong>DC</strong>/MD<br />
Boundary<br />
Confluence<br />
NE & NW<br />
Branch<br />
0<br />
Fecal Coliforms - Predicted Geometric Mean<br />
May Geomean (Wet Month)<br />
Class A <strong>Water</strong> Quality Standard<br />
Sept. Geomean<br />
Class B <strong>Water</strong> Quality Standard<br />
4,000<br />
Monthly Geometric Mean<br />
3,500<br />
3,000<br />
2,500<br />
2,000<br />
1,500<br />
1,000<br />
500<br />
Range of Predictions<br />
0<br />
Haines Point<br />
South Capital<br />
St.<br />
Navy Yard RFK Stadium <strong>DC</strong>/MD<br />
Boundary<br />
Confluence<br />
NE & NW<br />
Branch<br />
Dissolved Oxygen<br />
No Days Dissolved Oxygen
Pollutant Loads and Predicated <strong>Water</strong> Quality<br />
6.4 ROCK CREEK<br />
6.4.1 Pollutant Loads in Rock Creek<br />
Using the models for the CSS, SSWS, data on boundary condition flow rates for the years 1988-<br />
1990, and the event mean concentrations for each pollutant source, the pollutant load to Rock Creek<br />
was calculated for the average year. The load sources were divided into the following categories:<br />
<br />
<br />
<br />
CSO Overflow – this is overflow from the CSS.<br />
D.C. Storm <strong>Water</strong> – this is comprised of District’s separate storm water system and includes<br />
Broad Branch and Luzon Valley.<br />
Other Storm water – this is comprised of storm water from park lands on each side of Rock<br />
Creek, such as from Rock Creek Park.<br />
Load estimates are summarized Table 6-4 and in Figure 6-4.<br />
Table 6-4<br />
Sources of Pollutant Loads to Rock Creek Within District<br />
Scenario C3- Phase I <strong>Control</strong>s and Pump Station Rehabilitation<br />
Average Year (Average 1988-1990)<br />
Pollutant Source<br />
CBOD5<br />
(lb/yr x 1000)<br />
TSS<br />
(lb/yr x 1000)<br />
Fecal Coliforms<br />
(#/yr x 10 14 )<br />
E. Coli<br />
(#/yr x 10 14 )<br />
CSO Overflow 42 189 18 14<br />
D.C. Storm <strong>Water</strong> 226 1,116 15 9<br />
Other Storm water 10 90 1 1<br />
Upstream 419 9,765 10 4<br />
Total 697 11,160 44 28<br />
Figure 6-4<br />
Sources of Fecal Coliform to Rock Creek<br />
Upstream<br />
22%<br />
CSO<br />
Overflow<br />
42%<br />
Other<br />
Storm<br />
<strong>Water</strong><br />
3%<br />
D.C. Storm<br />
<strong>Water</strong><br />
33%<br />
\\Gh-wash\ENG 1160\LTCP\LTCP Final\Sec 6.doc 6-6 FINAL - July 2002
Pollutant Loads and Predicted <strong>Water</strong> Quality<br />
6.4.2 Predicted <strong>Water</strong> Quality in Rock Creek<br />
Using the loads and flows predicted above, the Rock Creek receiving water model was run<br />
continuously for the period 1988-1990. The arithmetic average of the three years is defined as the<br />
average year condition. The predicted water quality with the loads sources for the C3 Scenario is<br />
shown on Figure 6-5.<br />
6.5 POTOMAC RIVER<br />
6.5.1 Pollutant Loads to the Potomac River<br />
Using the models for the CSS, SSWS, data on boundary condition flow rates for the years 1988-<br />
1990, and the event mean concentrations for each pollutant source, the pollutant load to Potomac<br />
River was calculated for the average year. The load sources were divided into the following<br />
categories:<br />
<br />
<br />
<br />
<br />
CSO Overflow – this is overflow from the CSS.<br />
D.C. Storm <strong>Water</strong> – this is comprised of District’s separate storm water system<br />
Other Storm <strong>Water</strong> – this consists of Alexandria and Arlington storm water and Virginia<br />
streams such as Four Mile Run, Spout Run and others.<br />
Wastewater Treatment <strong>Plan</strong>ts - comprises loads from Arlington, Alexandria and Blue<br />
Plains Wastewater Treatment <strong>Plan</strong>ts, including Blue Plains excess flow treatment.<br />
Load estimates are summarized Table 6-5 and in Figures 6-6 and 6-7.<br />
Table 6-5<br />
Sources of Pollutant Loads to Potomac River Within District<br />
Scenario C3- Phase I <strong>Control</strong>s and Pump Station Rehabilitation<br />
Average Year (Average 1988-1990)<br />
Pollutant Source<br />
CBOD5<br />
(lb/yr x 1000)<br />
TSS<br />
(lb/yr x 1000)<br />
Fecal Coliforms<br />
(#/yr x 10 14 )<br />
E. Coli<br />
(#/yr x 10 14 )<br />
CSO Overflow 214 791 237 173<br />
D.C. Storm <strong>Water</strong> 386 1,910 26 15<br />
Other Storm water 1,323 20,424 59 32<br />
Upstream 64,942 1,770,113 273 148<br />
Wastewater Treatment <strong>Plan</strong>ts 7,564 12,712 75 54<br />
Total 74,429 1,805,950 670 422<br />
\\Gh-wash\ENG 1160\LTCP\LTCP Final\Sec 6.doc 6-7 FINAL - July 2002
District of Columbia <strong>Water</strong> and <strong>Sewer</strong> Authority<br />
<strong>Combined</strong> <strong>Sewer</strong> <strong>System</strong> <strong>Long</strong> <strong>Term</strong> <strong>Control</strong> <strong>Plan</strong><br />
Figure 6-5<br />
Rock Creek Predicted <strong>Water</strong> Quality<br />
Phase I <strong>Control</strong>s and Pump Station Rehabilitation (Scenario C3)<br />
Fecal Coliforms - Time Exceeding Class A Standard<br />
# of Days Fecal >200 (All Loads) # of Days Fecal >200 (CSO Loads Only)<br />
# of Mos Geomean>200<br />
# of Days/yr<br />
400<br />
350<br />
300<br />
250<br />
200<br />
150<br />
100<br />
50<br />
0<br />
M Street Mass. Ave. Zoo After Piney<br />
Branch<br />
Before Piney<br />
Branch<br />
<strong>DC</strong>/MD<br />
Boundary<br />
12<br />
10<br />
8<br />
6<br />
4<br />
2<br />
0<br />
# of Months<br />
1,600<br />
Fecal Coliforms - Predicted Geometric Mean<br />
May Geomean (Wet Month) March Geomean Class A <strong>Water</strong> Quality Standard<br />
Monthly Geometric Mean<br />
1,400<br />
1,200<br />
1,000<br />
800<br />
600<br />
400<br />
200<br />
Range of Predictions<br />
0<br />
M Street Mass. Ave. Zoo After Piney<br />
Branch<br />
Before Piney<br />
Branch<br />
<strong>DC</strong>/MD<br />
Boundary<br />
\\Gh-wash\ENG 1160\LTCP\LTCP Final\[LTCP_6_graphs.xls]Ana-Graph<br />
6-8
Pollutant Loads and Predicted <strong>Water</strong> Quality<br />
Figure 6-6<br />
Sources of CBOD5 to Potomac River<br />
Other Storm<br />
<strong>Water</strong><br />
2%<br />
CSO<br />
Overflow<br />
0%<br />
D.C. Storm<br />
<strong>Water</strong><br />
1%<br />
WWTP<br />
10%<br />
Upstream<br />
87%<br />
Figure 6-7<br />
Sources of Fecal Coliform to Potomac<br />
River CSO<br />
WWTP<br />
Overflow<br />
11%<br />
Upstream<br />
41%<br />
35%<br />
D.C. Storm<br />
<strong>Water</strong><br />
4%<br />
Other<br />
Storm<br />
<strong>Water</strong><br />
9%<br />
6.5.2 Predicted <strong>Water</strong> Quality in the Potomac River<br />
Using the loads and flows predicted above, the Potomac River receiving water model was run<br />
continuously for the period 1988-1990. The arithmetic average of the three years is defined as the<br />
average year condition. The predicted water quality with the loads sources for the C3 Scenario is<br />
shown on Figure 6-8.<br />
6.6 NEED FOR WATERSHED APPROACH<br />
Based on the analysis above it is clear that all three receiving waters are impacted by a variety of<br />
pollutant sources. While the control of CSO discharges into each receiving water will have a<br />
beneficial impact on water quality, to achieve the goal of fishable and swimmable for these<br />
waterbodies, a comprehensive watershed wide effort must be implemented in conjunction with the<br />
selected LTCP.<br />
Maryland is currently developing a TMDL for the Upper Anacostia River and it is not yet known if a<br />
Use Attainability Analysis will be pursued for wet weather conditions. Such decisions will impact the<br />
water quality entering the District.<br />
In addition, the District is working to improve the quality of storm flows to District waters as<br />
discussed in Section 3 – Existing <strong>System</strong>s. The relative cost and benefits of the storm water<br />
improvements and CSO reduction must be balanced to achieve the greatest benefits with the funds<br />
provided by District ratepayers.<br />
\\Gh-wash\ENG 1160\LTCP\LTCP Final\Sec 6.doc 6-9 FINAL - July 2002
District of Columbia <strong>Water</strong> and <strong>Sewer</strong> Authority<br />
<strong>Combined</strong> <strong>Sewer</strong> <strong>System</strong> <strong>Long</strong> <strong>Term</strong> <strong>Control</strong> Paln<br />
Figure 6-8<br />
Potomac River Predicted <strong>Water</strong> Quality<br />
(Phase I <strong>Control</strong>s and Pump Station Rehabilitation (Scenario C3)<br />
Fecal Coliforms - Time Exceeding Class A Standard<br />
# of Days Fecal >200 (All Loads) # of Days Fecal >200 (CSO Loads Only)<br />
# of Mos Geomean>200<br />
250<br />
12<br />
200<br />
10<br />
# of Days/yr<br />
150<br />
100<br />
50<br />
8<br />
6<br />
4<br />
2<br />
# of Months<br />
0<br />
South of<br />
Wilson Bridge<br />
Blue Plains<br />
Confluence<br />
w/Anacostia<br />
Memorial<br />
Bridge<br />
Georgetown<br />
<strong>DC</strong>/MD<br />
Boundary<br />
0<br />
Fecal Coliforms - Predicted Geometric Mean<br />
May Geomean (Wet Month) Sept. Geomean Class A <strong>Water</strong> Quality Standard<br />
400<br />
Monthly Geometric Mean<br />
350<br />
300<br />
250<br />
200<br />
150<br />
100<br />
50<br />
Range of Predictions<br />
0<br />
South of<br />
Wilson Bridge<br />
Blue Plains<br />
Confluence<br />
w/Anacostia<br />
Memorial<br />
Bridge<br />
Georgetown<br />
<strong>DC</strong>/MD<br />
Boundary<br />
Dissolved Oxygen<br />
No Days Dissolved Oxygen
Screening of CSO <strong>Control</strong> Technologies<br />
Section 7<br />
Screening of CSO <strong>Control</strong> Technologies<br />
7.1 INTRODUCTION<br />
A wide range of CSO control technologies was considered for application to WASA’s <strong>Combined</strong><br />
<strong>Sewer</strong> <strong>System</strong> (CSS). The technologies are grouped into the following general categories:<br />
<br />
<br />
<br />
<br />
<br />
<br />
<br />
<br />
Source <strong>Control</strong><br />
Inflow <strong>Control</strong><br />
<strong>Sewer</strong> <strong>System</strong> Optimization<br />
<strong>Sewer</strong> Separation<br />
Storage<br />
Treatment<br />
Receiving <strong>Water</strong> Improvement<br />
Floatables <strong>Control</strong><br />
Each technology is described below, and a summary assessment is provided in Table 7-1.<br />
7.2 SOURCE CONTROL<br />
To control pollutants at their source, management practices can be applied where pollutants<br />
accumulate. Source management practices are described below:<br />
<br />
Public Education – Public education programs can be aimed at reducing (1) littering by the<br />
public and the potential for litter to be discharged to receiving waters during CSO events and<br />
(2) illegal dumping of contaminants in the sewer system that could be discharged to receiving<br />
waters during rain events. As part of its nine minimum controls program, WASA has<br />
implemented a public education program. Elements of the program include tours of Blue<br />
Plains WWTP, a CSO web site, inserts in water and sewer bills, a CSO newsletter, water<br />
conservation educational leaflets and presentations to community groups. In addition, the<br />
District Government has programs in place and under development that address litter control.<br />
(EPMC-III, 1999a). Public education programs cannot reduce the volume, frequency or<br />
duration of CSO overflows, but can help improve CSO quality by reducing floatable debris in<br />
particular. Public education and information is an integral part of any LTCP. It is<br />
recommended that the education programs be coupled with other control measures to provide<br />
significant benefits to receiving water quality.<br />
\\Gh-wash\ENG 1160\LTCP\LTCP Final\Sec 7.doc 7-1 FINAL - July 2002
Screening of CSO <strong>Control</strong> Technologies<br />
CSO <strong>Control</strong> Technology<br />
Source <strong>Control</strong><br />
Table 7-1<br />
Assessment of CSO <strong>Control</strong> Technologies<br />
CSO Volume<br />
Performance<br />
Bacteria<br />
Floatables<br />
Suspended Solids<br />
Implementation and Operational Factors<br />
Public Education None Low Medium Medium Part of ongoing WASA NMC <strong>Plan</strong>.<br />
Ineffective at reducing CSO volume, bacteria and<br />
very fine particulate pollution. District has<br />
Street Sweeping None Low Medium Medium<br />
mechanical sweepers. Effective at floatables<br />
removal, cost-intensive O & M. District would<br />
need a new fleet of vacuum sweepers for removal<br />
of fine particulates.<br />
Construction Site Erosion <strong>Control</strong> None Low Low Medium<br />
<strong>DC</strong>RA has program in place. Contractor pays for<br />
controls. Reduces sewer sediment loading,<br />
enforcement required.<br />
Catch Basin Cleaning None Low Medium Low<br />
Part of ongoing WASA NMC <strong>Plan</strong>, labor intensive,<br />
requires specialized equipment.<br />
Industrial Pretreatment Low Low Low Low<br />
WASA has program in place. There is limited<br />
industrial activity in and out of combined sewer<br />
area.<br />
Garbage Disposal Ban None Low Adverse High<br />
Requires increased allocation of resources to<br />
enforce, alternative dumping alternatives<br />
recommended.<br />
<strong>Combined</strong> <strong>Sewer</strong> Flushing None Low Low Medium<br />
Maximizes existing collection system volume,<br />
reduces first flush effect, subject to resettling<br />
problems, labor intensive.<br />
Inflow <strong>Control</strong><br />
Reduces CSO volume during storm events,<br />
“Daylight” orphaned storm sewers Medium Medium Medium Medium<br />
potential for increased stormwater pollution loads,<br />
construction would be disruptive to effected areas,<br />
cost intensive.<br />
Relatively low volume, construction would be<br />
Offload Ground <strong>Water</strong> Pumpage Low Low Low Low<br />
disruptive to effected areas, not cost effective.<br />
Requires large area in congested urban<br />
Storm <strong>Water</strong> Detention Medium Medium Medium Medium<br />
environment, potential siting difficulties and public<br />
opposition, construction would be disruptive to<br />
affected areas, increased O & M.<br />
Street Storage of Storm <strong>Water</strong> Medium Medium Medium<br />
Potential flooding and freezing problems, public<br />
Medium<br />
opposition, low operational cost.<br />
Potentially reduces dry weather flow making room<br />
<strong>Water</strong> Conservation Low Low Low Low for CSO, ancillary benefit is reduced water<br />
consumption<br />
Inflow/Infiltration <strong>Control</strong> Low Low Low Low<br />
Infiltration usually lower volume than inflow,<br />
infiltration can be difficult to control<br />
Stream Diversion Low None None None<br />
Study undertaken by WASA shows no free-flowing<br />
streams entering the CSS.<br />
Low Impact Development-Retrofit<br />
Site specific, requires widespread application<br />
Bioretention Medium Medium Medium Medium across District to be effective, potential to be cost<br />
intensive in some areas.<br />
Site specific, low cost, good BMP for residential<br />
Dry Wells Medium Medium Low Medium<br />
areas, requires interaction with homeowners and<br />
businesses, widespread participation required to be<br />
effective.<br />
Filter Strips Medium Medium Low Medium<br />
Site specific, low cost, good BMP for parking lots,<br />
requires interaction with private owners in<br />
residential areas, requires widespread application<br />
across District to be effective.<br />
\\Gh-wash\ENG 1160\LTCP\LTCP Final\Sec 7.doc 7-2 FINAL - July 2002
Screening of CSO <strong>Control</strong> Technologies<br />
CSO Volume<br />
Performance<br />
Bacteria<br />
CSO <strong>Control</strong> Technology<br />
Implementation and Operational Factors<br />
Site specific, low cost, good BMP for parking lots,<br />
Vegetated Buffers Medium Medium Medium Medium<br />
requires interaction with homeowners in residential<br />
areas, requires widespread application across<br />
District to be effective.<br />
Level Spreader Low Low Low<br />
Site specific, must be used in conjunction with<br />
Medium<br />
other LID-R techniques, low cost.<br />
Site specific, requires widespread application<br />
Grassed Swales Medium Medium Low Medium across District to be effective, potential to be costintensive<br />
in some areas.<br />
Good BMP for residential areas, minimal capture<br />
Rain Barrels Low Medium Low Medium<br />
of total runoff volume, requires barrel coverage to<br />
inhibit mosquitoes, low cost, requires interaction<br />
with home and business owners.<br />
Site specific, requires widespread application<br />
Cisterns Medium Medium Low Medium across District to be effective, potential to be costintensive<br />
in some areas.<br />
Site specific, low cost, good BMP for residential<br />
Infiltration Trenches/Catch Basins Medium Medium Medium Medium areas, widespread participation required to be<br />
effective.<br />
Site specific, cost intensive, non-intrusive<br />
Rooftop Greening Medium Low Low Medium<br />
construction, other beneficial effects to city,<br />
requires widespread application to be effective,<br />
requires interaction with all property owners.<br />
Increased Tree Cover Low Low None Low<br />
Site specific, low cost, little capture of stormwater<br />
runoff, other beneficial effects to city.<br />
Permeable Pavements Medium Medium Low<br />
Site specific, cost intensive, subject to clogging,<br />
Medium<br />
increased O & M costs, labor intensive.<br />
<strong>Sewer</strong> <strong>System</strong> Optimization<br />
Part of ongoing WASA NMC <strong>Plan</strong>, low cost<br />
Optimize Existing <strong>System</strong> Medium Medium Medium Medium<br />
relative to large scale structural BMPs, limited by<br />
existing system volume and dry weather flow dam<br />
elevations.<br />
Real Time <strong>Control</strong> Medium Medium Medium<br />
Highly automated system, increased O & M,<br />
Medium<br />
increased potential for sewer backups.<br />
<strong>Sewer</strong> Separation<br />
Disruptive to affected areas, cost intensive,<br />
Complete Separation High Medium Low Low potential for increased stormwater pollutant loads,<br />
requires homeowner participation.<br />
Partial Separation High Medium Low Low<br />
Disruptive to affected areas, cost intensive,<br />
potential for increased stormwater pollutant loads.<br />
Low cost, requires home and business owner<br />
Rain Leader Disconnection Medium Medium Low Low participation, potential for increased storm water<br />
pollutant loads.<br />
Storage<br />
In - stream storage of CSO High High High High<br />
Limited space for siting, limited storage volume,<br />
potential odor problems, aesthetically unpleasing.<br />
Earthen Basins High High High High<br />
Disruptive to affected areas, lack of space in urban<br />
environment, potential odor problems.<br />
Requires large space, potential odor control<br />
Open Concrete Tanks High High High High problems, disruptive to effected area, public<br />
opposition.<br />
Closed Concrete Tanks High High High High<br />
Requires large space, disruptive to affected area,<br />
cost intensive, aesthetically acceptable.<br />
Disruptive to affected areas, potentially expensive<br />
Storage Pipelines/Conduits High High High High<br />
in congested urban areas, aesthetically acceptable,<br />
provides storage and conveyance.<br />
Floatables<br />
Suspended Solids<br />
\\Gh-wash\ENG 1160\LTCP\LTCP Final\Sec 7.doc 7-3 FINAL - July 2002
Screening of CSO <strong>Control</strong> Technologies<br />
CSO Volume<br />
Performance<br />
Bacteria<br />
CSO <strong>Control</strong> Technology<br />
Implementation and Operational Factors<br />
Non-disruptive, requires little area at ground level,<br />
Tunnels High High High High<br />
capital intensive, provides storage and conveyance,<br />
pump station required to lift stored flow out of<br />
tunnel.<br />
Treatment<br />
Screening/ Netting <strong>System</strong>s None None High None <strong>Control</strong>s only floatables.<br />
Primary Sedimentation 1 Low Medium High<br />
Limited space at Blue Plains WWTP, difficult to<br />
Medium<br />
site in urban areas.<br />
Variable pollutant removal performance, increased<br />
Swirl Concentrator 1 None Medium High Low O & M. Foul sewer flow requires pumping to<br />
WWTP.<br />
Variable pollutant removal performance, increased<br />
Vortex Separator 1 None Medium High Low O & M. Foul sewer flow requires pumping to<br />
WWTP.<br />
Limited space at Blue Plains WWTP, requires<br />
High Rate Physical/Chemical<br />
Treatment 1 None Medium High High construction of extensive new conveyance<br />
conduits, high O&M costs.<br />
Disinfection None High Low Low Limited space at Blue Plains, increased O & M.<br />
Requires large space and long detention times,<br />
Constructed Wetlands Medium Medium Low Medium reduced effectiveness in winter, low cost O & M,<br />
ineffective for floatables.<br />
Expansion of BPWWTP High High High High<br />
Limited by space at Blue Plains WWTP, increased<br />
O & M.<br />
Receiving <strong>Water</strong> Improvement<br />
Side Stream Aeration None None None None<br />
High O & M, only effective for increasing DO,<br />
limited effective area.<br />
In-stream Aeration None None None None<br />
High O & M, only effective for increasing DO,<br />
limited effective area.<br />
Divert Blue Plains Effluent to<br />
None None None None<br />
Cost-intensive, high O & M, limited beneficial<br />
Anacostia River<br />
effects to water quality.<br />
Pump Ground <strong>Water</strong> to Anacostia<br />
River<br />
Solids and Floatables <strong>Control</strong>s<br />
Floatables<br />
Suspended Solids<br />
None None None None<br />
Cost-intensive, disruptive to effected areas, limited<br />
beneficial effects to water quality increased O &<br />
M.<br />
Easy to implement, potential negative aesthetic<br />
Netting <strong>System</strong>s None None High None<br />
impact<br />
Simple to install, difficult to clean, negative<br />
Containment Booms None None High None<br />
aesthetic impact<br />
Manual Bar Screens None None High None Prone to clogging, requires manual maintenance<br />
Relatively low maintenance, requires suitable<br />
Weir Mounted Screens None None High None<br />
physical configuration, must bring power to site<br />
Limited hydraulic capacity makes these suitable for<br />
Screens with Backwash None None High None<br />
small outfalls only<br />
Low maintenance, easy to install, requires proper<br />
Fixed baffles None None High None<br />
hydraulic configuration<br />
Floating Baffles None None High None Moving parts make them susceptible to failure<br />
Requires suitable catch basin configuration,<br />
Catch Basin Modifications None None High None potential for street flooding and increased<br />
maintenance efforts<br />
1. Process includes pretreatment screening and disinfection.<br />
\\Gh-wash\ENG 1160\LTCP\LTCP Final\Sec 7.doc 7-4 FINAL - July 2002
Screening of CSO <strong>Control</strong> Technologies<br />
<br />
Street Sweeping – The major objectives of municipal street cleaning are to enhance the<br />
aesthetic appearance of streets by periodically removing the surface accumulation of litter,<br />
debris, dust and dirt, and to prevent these pollutants from entering storm or combined sewers.<br />
Common methods of street cleaning are manual, mechanical and vacuum sweepers, and<br />
street flushing. Studies on the effect of street sweeping on the reduction of floatables and<br />
pollutants in runoff have been conducted. New York City found that street cleaning can be<br />
effective in removing floatables. Increasing street cleaning frequency from twice per week to<br />
six times per week reduced floatables by about 42% on an item count basis. A significant<br />
quantity of floatables was found to be located on sidewalks that were not cleanable by<br />
conventional equipment. (HydroQual, 1995).<br />
In the National Urban Renewal Program (NURP)- funded studies of the late 1970s to the<br />
early 1980s, street sweeping was found to be generally ineffective at removing pollutants and<br />
improving the quality of urban runoff (MWCOG, 1983 and EPA, 1983). The principal<br />
reason for this is that mechanical sweepers were employed at the time. Mechanical sweepers<br />
cannot pick up the finer particles (diameter < 60 microns). Studies have shown that these<br />
fine particles contain a majority of the target pollutants along city streets that are washed into<br />
sewer systems (Sutherland, 1995). In the early 1990s new vacuum-assisted sweeper<br />
technology was introduced that can pick up the finer particles along city streets. A recent<br />
study showed that these vacuum-assisted sweepers have a 70% pickup efficiency for particles<br />
less than 60 microns (Sutherland, 1995).<br />
Street sweeping only affects the pollutant concentration in the storm water component of<br />
combined sewer flows. Thus, a street sweeping program is ineffective at reducing the<br />
volume and frequency of CSO events. Furthermore, the total area accessible to sweepers is<br />
limited. Areas such as sidewalks, traffic islands, and congested street parking areas can not<br />
be cleaned by this method. Although a street sweeping program employing high efficiency<br />
sweepers could reduce the concentrations of some pollutants in CSOs, bacteriological<br />
pollution originates primarily from the sanitary component of sewer flows. Thus, minimal<br />
reductions in fecal coliform and e. coli concentrations of CSOs would be expected.<br />
Enhanced street sweeping might thus be more appropriate to consider as part of an enhanced<br />
storm water management program.<br />
<br />
Construction Site Erosion <strong>Control</strong> – Construction site erosion control involves management<br />
practices aimed at controlling the washing of sediment and silt from disturbed land associated<br />
with construction activity. Erosion control has the potential to reduce solids concentrations<br />
in CSOs and reduce sewer cleanout O & M costs. The District government (not WASA) is<br />
responsible for sediment and erosion control and has a program in place to regulate land<br />
disturbance (<strong>DC</strong>RA, 1988). Given the extremely small amount of land under construction at<br />
\\Gh-wash\ENG 1160\LTCP\LTCP Final\Sec 7.doc 7-5 FINAL - July 2002
Screening of CSO <strong>Control</strong> Technologies<br />
any one time and that District Government programs are already in place, this alternative is<br />
considered to be implemented to a satisfactory level and will not be considered further.<br />
<br />
Catch Basin Cleaning – The major objective of catch basin cleaning is to reduce conveyance<br />
of solids and floatables to the combined sewer system by regularly removing accumulated<br />
catch basin deposits. Methods to clean catch basins include manual, bucket, and vacuum<br />
removal. Cleaning catch basins can only remove an average of 1-2% of the BOD 5 produced<br />
by a combined sewer watershed (EPA, 1978). As a result catch basins cannot be considered<br />
an effective pollution control alternative for BOD removal. However, catch basins can be<br />
effective in reducing floatables in combined sewer. WASA has a catch basin cleaning<br />
program in place, for the District’s 25,000 catch basins, as part of its NMC program. The<br />
program was recently upgraded and includes cleaning catch basins an average of once per<br />
year with areas susceptible to flooding cleaned on a more frequent basis. This alternative is<br />
considered to be implemented to a satisfactory level.<br />
<br />
Industrial Pretreatment – Industrial pretreatment programs are geared toward reducing<br />
potential contaminants in CSO by controlling industrial discharges to the sewer system.<br />
WASA has an approved local pretreatment program consistent with the Clean <strong>Water</strong> Act and<br />
its amendments.<br />
<br />
Garbage Disposal Ban – The rationale behind a garbage disposal ban is to reduce solids and<br />
organic loading to the combined sewer system by prohibiting garbage disposals. Note that<br />
this is only effective for CSO events that occurred when significant numbers of people would<br />
be using disposals (e.g. dinner time). Dislike for this alternative was voiced at the<br />
Stakeholder Advisory Panel due to the inconvenience it would cause to the public. Due to its<br />
limited benefit and public opposition, this alternative has been eliminated from further<br />
consideration.<br />
<br />
<strong>Combined</strong> <strong>Sewer</strong> Flushing – The major objective of combined sewer flushing is to resuspend<br />
deposited sewage solids and transmit these solids to the wastewater treatment plant<br />
during dry-weather to prevent a storm event from flushing them to a receiving water.<br />
<strong>Combined</strong> sewer flushing consists of introducing a controlled volume of water over a short<br />
duration at key points in the collection system. This can be done using external water from a<br />
tank truck by gravity or pressurized feed or using internal water detained manually or<br />
automatically.<br />
A recent feasibility study of combined sewer flushing indicated that manual flushing using an<br />
external pressurized source of water is most effective. However, repeated sewer flushing<br />
achieved no important gain in the fraction of pollutants removed, and 70 percent of the<br />
\\Gh-wash\ENG 1160\LTCP\LTCP Final\Sec 7.doc 7-6 FINAL - July 2002
Screening of CSO <strong>Control</strong> Technologies<br />
flushed solids quickly resettled. Therefore, repeated flushing in a downstream sequence is<br />
probably necessary to achieve control of pollutants.<br />
<strong>Combined</strong> sewer flushing is most effective when applied to flat collection systems since<br />
solids are more likely to become deposited in flat systems. A 2% BOD 5 removal has been<br />
estimated for sewer flushing (EPA, 1978). Due to the limited benefits of this alternative, it<br />
will not be considered further.<br />
7.3 INFLOW CONTROL<br />
Inflow control involves eliminating or retarding storm water inflow to the CSS, lowering the<br />
magnitude of the peak flow through the system, and thereby reducing overflows. Methods for inflow<br />
control are described below:<br />
<br />
Daylight “Orphaned” Storm <strong>Sewer</strong>s – Over time, redevelopment has occurred at certain<br />
locations within the combined sewer system. When this redevelopment has occurred, sewers<br />
have been locally separated as part of the construction project. In many locations, locally<br />
separated storm sewers discharge to an existing combined sewer because there is no other<br />
outlet for the sewer. This alternative involves extending storm sewers so they discharge to a<br />
receiving water, thereby offloading the combined sewer system and reducing CSO<br />
discharges. However, this alternative increases storm water flows and its associated pollutant<br />
loads to the receiving waters. This alternative has been retained for consideration.<br />
<br />
Offload Groundwater Pumpage – Several buildings in the District, particularly those in the<br />
Federal Triangle, have basements below the ground water table that are kept dry by<br />
dewatering pumps. In many cases, these pumps discharge to the CSS. This alternative<br />
involves routing this groundwater pumpage to a storm sewer and then to a receiving water to<br />
offload the CSS, thereby reducing CSO discharges. This alternative has been retained for<br />
consideration.<br />
<br />
<strong>Water</strong> Conservation, Infiltration/Inflow (I/I) Reduction - <strong>Water</strong> conservation and infiltration<br />
control are both geared toward reducing the dry weather flow in the system, thereby allowing<br />
the system to accommodate more CSO. <strong>Water</strong> conservation includes measures such as<br />
installing low flow fixtures, public education to reduce wasted water, leak detection and<br />
correction, and other programs. Infiltration is ground water that enters the collection system<br />
through leaking pipe joints, cracked pipes, manholes, and other similar sources. Excessive<br />
amounts of infiltration can take up hydraulic capacity in the collection system. In contrast,<br />
inflow in the form of surface drainage is intended to enter the CSS. For combined sewer<br />
communities, sources of inflow that might be controlled include leaking or missing tide gates<br />
and inflow in the separate sanitary system located upstream of the CSS.<br />
\\Gh-wash\ENG 1160\LTCP\LTCP Final\Sec 7.doc 7-7 FINAL - July 2002
Screening of CSO <strong>Control</strong> Technologies<br />
It can be difficult and expensive to achieve significant reductions in flow from water<br />
conservation and I/I measures. The measures involve disparate sources of flow spread<br />
throughout a large area. In addition, modeling conducted as part of the LTCP has shown that<br />
reduction of these sources is predicted to have a minor impact on reducing CSO. This is<br />
because the relative magnitude of the dry weather flow is small compared to the storm water<br />
runoff which causes CSO overflows.<br />
As described in Section 4, the Blue Plains Intermunicipal Agreement of 1985 (IMA) allocates<br />
the District 148 mgd of capacity at BPWWTP with 10 mgd reserved to accommodate<br />
additional Potomac Interceptor flows for a total of 158 mgd. Currently, wastewater flows<br />
from the District to BPWWTP average about 170 mgd. WASA has a wastewater flow<br />
reduction and water conservation program in place to reduce the dry weather flow from the<br />
District. The LTCP has been prepared on the basis that the District portion of the DWF will<br />
be reduced to the IMA allowance of 158 mgd. The LTCP prepared herein thus already takes<br />
advantage of a significant amount of reduction in flow due to these programs. If this does not<br />
occur, modeling indicates that combined sewer storage volumes may need to be increased by<br />
about 2.5% to provide an equivalent degree of control.<br />
<br />
Stream Diversion – In many old cities like the District, creeks and streams were used as open<br />
sewers and then eventually bricked over to contain the foul odors as development occurred.<br />
In some cases headwaters of streams may still flow into combined sewers and take up<br />
capacity of the CSS. This alternative consists of piping creek flow to a receiving water body<br />
or constructing a detention pond to contain a portion of the creek flow during wet weather to<br />
reduce the load on the combined sewer system. Although old District maps show the past<br />
existence of free-running streams in the combined sewer area of District, most notably Tiber<br />
Creek, recent field investigations could not identify any streams entering the combined sewer<br />
system. A highly urbanized area that quickly directs all rainfall to catch basins and roof<br />
leaders connected to the CSS has replaced the natural land hydrology of the past. Thus,<br />
stream diversion is not applicable in the District and this alternative has been eliminated from<br />
further consideration.<br />
<br />
Low Impact Development Retrofit – The goal of low impact development (LID) is to mimic<br />
predevelopment site hydrology by using site design techniques that store, infiltrate, evaporate<br />
and detain runoff. LID has the potential to reduce both the volume of storm water generated<br />
by a site and its peak overflow rate, thereby improving the quality of the storm water. Low<br />
Impact Development Retrofit (LID-R) refers to the modification of an existing site to<br />
accomplish LID goals. Since most of the District is developed, LID-R is most relevant.<br />
\\Gh-wash\ENG 1160\LTCP\LTCP Final\Sec 7.doc 7-8 FINAL - July 2002
Screening of CSO <strong>Control</strong> Technologies<br />
Data is available to assess the cost and benefits of LID to undeveloped sites. However, due<br />
to the complications of existing infrastructure and the cost of acquiring land, few studies have<br />
been conducted for applying LID-R to urban areas. These costs are also highly site specific.<br />
Therefore, in order to assess the implementability and costs of applying LID-R within the<br />
District, a site specific cost estimation approach is required using some of the common LID-<br />
R techniques as described below:<br />
o Bioretention (Rain Garden) – a planting bed or landscaped area used to hold runoff<br />
and to allow it to infiltrate.<br />
o Dry Wells – an excavated pit, backfilled with granular material to allow infiltration.<br />
o Filter Strips – a band of vegetation located between the runoff location and the<br />
receiving channel or water body. Overland flow over the filter strip allows<br />
infiltration and filtering of storm water.<br />
o Vegetated Buffers – a strip of vegetation around sensitive areas such as water bodies<br />
that provides infiltration, slows and disperses storm water and allows some trapping<br />
of sediment.<br />
o Level Spreader – an aggregate filled trench designed to convert concentrated flow to<br />
sheet flow to promote infiltration and reduce erosion.<br />
o Grassed Swales – depressions designed to collect, treat, and retain runoff from a<br />
storm event. Swales can be designed to be dry or wet (with standing water) between<br />
rain events. Wet swales typically contain water tolerant vegetation and use natural<br />
processes to remove pollutants.<br />
o Rain Barrels – a barrel placed at the end of a roof downspout to capture and hold<br />
runoff from roofs. The water in the barrel must be manually emptied onto the<br />
ground, or it can be put to beneficial use to water vegetation. The barrel top typically<br />
has a protective screen to inhibit mosquitoes. WASA currently has a demonstration<br />
program underway that applies this technology to residential properties.<br />
o Cisterns – rain water from roofs is diverted into underground tanks and stored for<br />
non-potable uses.<br />
o Infiltration Trenches – an excavated trench backfilled with stone to create a<br />
subsurface basin that provides storage for water and allows infiltration.<br />
o Rooftop Greening – the practice of constructing precultivated vegetation mats on<br />
rooftops to capture rainfall, thereby reducing runoff and CSO.<br />
o Increased Tree Cover – planting trees in the City to capture a portion of rainfall.<br />
o Permeable Pavements – reduces runoff to the combined sewer drainage system by<br />
allowing precipitation to infiltrate through the pavement and into the earth.<br />
As LID-R techniques are distributive by design, they must be applied over a large area in<br />
order to achieve any significant reductions in runoff volume and/or flow rate to the combined<br />
\\Gh-wash\ENG 1160\LTCP\LTCP Final\Sec 7.doc 7-9 FINAL - July 2002
Screening of CSO <strong>Control</strong> Technologies<br />
sewer system. In urban areas, it is not cost-effective to demolish existing infrastructure just<br />
for the purpose of LID-R application alone. It is generally accepted that LID-R becomes<br />
cost-effective when redevelopment is under construction simultaneously within an urban<br />
area. This is because the streets and sidewalks are already dug up, allowing substantial<br />
construction cost savings. To take advantage of applying LID-R during redevelopment<br />
projects, the District would need to supplement its existing storm water management<br />
regulations to include or require LID techniques for new construction. The disadvantage of<br />
this approach is that substantial redevelopment typically occurs over a long period of time.<br />
In the case of roof top greening, it requires significant participation and cooperation of<br />
business and private property owners. It may take many decades for the elimination of<br />
significant runoff volume. The District government is responsible for setting storm water<br />
management regulations; therefore, any implementation effort for this alternative requires<br />
that they be the lead organization. Due to its potential in combination with other CSO<br />
abatement programs and technologies, LID-R has been retained for further consideration.<br />
7.4 SEWER SYSTEM OPTIMIZATION<br />
This CSO control technology involves making the best use of existing facilities to limit overflows.<br />
The techniques are described below:<br />
<br />
<br />
Optimize Existing <strong>System</strong> – This approach involves evaluating the current standard operating<br />
procedures for facilities such as pumps stations, control gates, inflatable dams, and treatment<br />
facilities to determine if improved operating procedures can be developed to provide benefit<br />
in terms of CSO control.<br />
Real Time <strong>Control</strong> (RTC) – In RTC, sewer level and flow data are measured in “real time”<br />
at key points in the sewer system. The collected data is typically transferred to a control<br />
device such as a central computer where decisions are made to operate gates, pump stations,<br />
inflatable dams and other control components to maximize use of the existing sewer system<br />
and to limit overflows. Local dynamic controls are used to control regulators to prevent<br />
flooding and system wide dynamic controls are used to implement control objectives such as<br />
maximizing flow to the WWTP or transferring flows from portion of the CSS to another to<br />
fully utilize the system. Predicative control, which incorporates use of weather forecast data<br />
is also possible, but is complex and requires sophisticated operational capabilities. RTC can<br />
reduce CSO volumes where in-system storage capacity is available. In-system storage is a<br />
method of using excess sewer capacity by containing combined sewage within a sewer and<br />
releasing it to the WWTP after a storm event when capacity for treatment becomes available.<br />
Methods of equipping sewers for in-system storage include inflatable dams, mechanical gates<br />
and increased overflow weir elevations. RTC has been used in other cities such as Quebec,<br />
Canada; Louisville, Kentucky; and Cleveland, Ohio. Refer to Figure 7-1 for a diagram of an<br />
example inflatable dam system. WASA’s inflatable dam system is an RTC system using the<br />
\\Gh-wash\ENG 1160\LTCP\LTCP Final\Sec 7.doc 7-10 FINAL - July 2002
Screening of CSO <strong>Control</strong> Technologies<br />
storage in the existing large combined sewers to limit overflows. Enhancement or addition to<br />
this system will be considered.<br />
GRADE<br />
MANHOLE<br />
UNDERGROUND<br />
CONTROL VAULT<br />
CONTROL PIPING<br />
FLOW<br />
TRUNK SEWER<br />
INFLATABLE DAM<br />
JUNCTION<br />
CHAMBER<br />
TO WASTEWATER<br />
TREATMENT PLANT<br />
OVERFLOW TO<br />
RECEIVING WATER<br />
DURING WET<br />
WEATHER EVENTS –<br />
DAM DEFLATES TO<br />
PREVENT FLOODING<br />
FIGURE 7-1<br />
TYPICAL INFLATABLE DAM<br />
7.5 SEWER SEPARATION<br />
<strong>Sewer</strong> separation is the conversion of a combined sewer system into a system of separate sanitary<br />
sewers and storm sewers. This alternative prevents sanitary wastewater from being discharged to<br />
receiving waters. However when combined sewers are separated, storm sewer discharges will greatly<br />
increase and contribute more pollutant load to the receiving waters since storm water will no longer<br />
be captured and treated in the combined sewer system. New stringent storm water regulations may<br />
require some type of pollutant control on the storm water system. In addition, this alternative<br />
involves substantial city-wide excavation, thus exasperating street disruption problems in the District.<br />
Varying degrees of sewer separation could be achieved as follows:<br />
<br />
Rain Leader (Gutters and Downspouts) Disconnection – Rain leaders are disconnected from<br />
the combined sewer system and the storm runoff is diverted elsewhere. Depending on the<br />
neighborhood, the leaders may be run to a dry well, vegetation bed, a lawn, a storm sewer or<br />
the street. For most residences in the District’s combined sewer area, the most feasible rain<br />
\\Gh-wash\ENG 1160\LTCP\LTCP Final\Sec 7.doc 7-11 FINAL - July 2002
Screening of CSO <strong>Control</strong> Technologies<br />
<br />
<br />
leader disconnection scheme is diversion to the street. Unfortunately, this scheme contributes<br />
to nuisance street flooding and only briefly delays the water from entering the combined<br />
sewer system through catch basins.<br />
Partial Separation – <strong>Combined</strong> sewers are separated in the streets only, or other public rightof<br />
way. This is accomplished by constructing either a new sanitary wastewater system or a<br />
new storm water system.<br />
Complete Separation – In addition to separation of sewers in the streets, storm water runoff<br />
from each private residence or building such as from rooftops and parking lots is also<br />
separated.<br />
Figure 7-2 shows a diagram of these methods of separation. For other cities, separation has proved<br />
most feasible for CSO areas of 200 acres or less. This alternative will be considered further in the<br />
Section 8.<br />
Existing<br />
<strong>System</strong><br />
Partial<br />
Separation<br />
Complete<br />
Separation<br />
S<br />
R<br />
CB<br />
MH<br />
CB<br />
S<br />
R<br />
CB<br />
MH<br />
CB<br />
S<br />
R<br />
CB<br />
MH<br />
CB<br />
S<br />
R<br />
S<br />
R<br />
S<br />
R<br />
R<br />
R<br />
R<br />
S<br />
S<br />
S<br />
CB<br />
CB<br />
CB<br />
CB<br />
CB<br />
CB<br />
MH<br />
MH<br />
MH<br />
LEGEND<br />
<strong>Combined</strong> <strong>Sewer</strong> R – Roof Drain<br />
MH – Manhole<br />
Sanitary <strong>Sewer</strong><br />
S – <strong>Sewer</strong><br />
CB – Catch Basin<br />
Storm <strong>Sewer</strong><br />
FIGURE 7-2<br />
SEWER SEPARATION ALTERNATIVES CB Catch<br />
7.6 STORAGE<br />
The objective of retention basins (also referred to as off-line storage) is to reduce overflows by<br />
capturing combined sewage in excess of WWTP capacity during wet weather for controlled release<br />
into wastewater treatment facilities after the storm. Retention basins can provide a relatively<br />
\\Gh-wash\ENG 1160\LTCP\LTCP Final\Sec 7.doc 7-12 FINAL - July 2002
Screening of CSO <strong>Control</strong> Technologies<br />
constant flow into the treatment plant and thus reduce the size of treatment facilities required.<br />
Retention basins have had considerable use and are well documented. Retention facilities may be<br />
located at overflow points or near dry-weather or wet weather treatment facilities. A major factor<br />
determining the feasibility of using retention basins is land availability. Operation and maintenance<br />
cost are generally small, requiring only collection and disposal cost for residual sludge solids, unless<br />
inlet or outlet pumping is required. Many demonstration projects have included storage of peak<br />
storm water flows, including those in Richmond, Virginia; Chippewa Falls, Wisconsin; Boston,<br />
Massachusetts; Milwaukee, Wisconsin; and Columbus, Ohio. The following are types of CSO<br />
retention facilities that have been considered:<br />
<br />
In-Stream Storage – EquiFlow is a proprietary system sold by Fresh Creek Technologies, Inc.<br />
for storing CSO in the receiving water at the discharge of a CSO outfall. Floating curtains<br />
are constructed around the outfall creating a storage chamber in the water body for CSO. In<br />
fresh water applications as would be encountered in the District, CSO discharging from the<br />
combined sewer would be conveyed through the storage structure created by the curtains<br />
around a series of baffles to prevent short-circuiting of the storage. CSO entering the storage<br />
area displaces river water. Heavy materials in the CSO sink to the river bottom and lighter<br />
materials (also called “floatables”) rise to the surface. If the CSO overflow is large enough, it<br />
eventually fills the storage volume and is relieved through openings in the curtain to the<br />
receiving water. After CSO conditions subside, the contents within the curtain would be<br />
pumped back into the existing sewer system for treatment at the wastewater treatment plant.<br />
The storage chamber is not covered and any CSO stored in the chamber is exposed to the<br />
atmosphere. No bottom is constructed in the storage chamber, thereby placing the CSO in<br />
direct contact with the native material on the bottom of the water body. WASA conducted a<br />
study to identify potential sites to apply the Equiflow <strong>System</strong> (EPMC-III, 2000a). The site at<br />
Main and O Street Pumping Stations was the only site identified to be suitable based on<br />
system requirements. Approximately 5 mg of storage was estimated to be available at this<br />
site, which is much less than the volume associated with a typical overflow event. In<br />
addition, the Anacostia waterfront is being redeveloped to provide for public access to river.<br />
In-stream storage of CSO would negatively impact that effort due to aesthetic, odor and<br />
sanitation concerns. In addition, members of the Stakeholder Advisory Panel expressed a<br />
dislike to the aesthetic impact of such a system and to the prospects of open storage of CSO.<br />
Given these factors, in-stream storage of CSO has been eliminated from further<br />
consideration.<br />
<br />
Earthen Basins – Earthen basins are CSO storage facilities at locations where land is<br />
available. Basins typically have sloped sides, are typically uncovered, and include a<br />
synthetic liner or concrete lining to prevent exfiltration and to facilitate maintenance.<br />
Earthen basins are typically used in relatively unpopulated areas where land is plentiful and<br />
\\Gh-wash\ENG 1160\LTCP\LTCP Final\Sec 7.doc 7-13 FINAL - July 2002
Screening of CSO <strong>Control</strong> Technologies<br />
odors are not objectionable. Considering the lack of available land and the highly urbanized<br />
environment of the District, earthen basins have been eliminated from further consideration.<br />
<br />
Open Concrete Tanks – Open concrete tanks can be used for storage of CSO. Open concrete<br />
tanks are similar to earthen basins except the side walls are vertical instead of being sloped<br />
and the tank is constructed of reinforced concrete. The tanks can also include equipment to<br />
facilitate cleaning and dewatering of the basin. Since there is no top, odors and wildlife can<br />
cause a nuisance. Open concrete tanks have typically been used at remote wastewater<br />
treatment plant sites or in rural areas where land and aesthetic concerns are less of an issue.<br />
Given the lack of available land and the urban nature of the District, open concrete tanks<br />
have been eliminated from further consideration.<br />
<br />
Closed Concrete Tanks – Closed concrete tanks are similar to open tanks except that the<br />
tanks are covered and include many mechanical facilities to minimize their aesthetic and<br />
environmental impact. Closed concrete tanks typically include odor control systems,<br />
washdown/solids removal systems, and access for cleaning and maintenance. Closed concrete<br />
tanks have been constructed below grade such that the surface at grade can be used for parks,<br />
playgrounds, parking or other light uses. Closed concrete tanks are potentially viable<br />
alternatives for WASA’s CSS and have therefore been retained for further consideration.<br />
<br />
Storage Pipelines/Conduits – Large diameter pipelines or conduits can provide significant<br />
storage in addition to the ability to convey flow. Pipelines are typically constructed between<br />
an overflow point and a pump station or treatment facility. The pipelines include some type<br />
of discharge control to allow flow to be stored within the pipeline during wet weather. After<br />
the rain event, the contents of the pipeline are allowed to flow by gravity along its length.<br />
Pipelines have the advantage of requiring a relatively small right of way for construction.<br />
Disadvantages are that it takes a relatively large diameter pipeline or cast-in-place conduit to<br />
provide the volume required to accommodate large CSO drainage areas and requires street<br />
excavation causing traffic disruption. For large CSO areas, pipeline sizes may become so<br />
large that construction from the surface becomes impractical and construction of a tunnel is<br />
more feasible.<br />
<br />
Tunnels – Tunnels are similar to storage pipelines in that they can provide significant storage<br />
volume in addition to offering the ability to convey flow. Tunnels have the advantage of<br />
causing minimal surface disruption and of requiring little right of way for construction.<br />
Excavation to construct the tunnel is carried out deep beneath the city and therefore would<br />
not impact traffic. The ability to construct tunnels at a reasonable cost depends on the<br />
geology. Tunnels have been used in many CSO control plans including Chicago, Illinois;<br />
Rochester, New York; Cleveland, Ohio; Richmond, Virginia; Toronto, Canada and others. A<br />
\\Gh-wash\ENG 1160\LTCP\LTCP Final\Sec 7.doc 7-14 FINAL - July 2002
Screening of CSO <strong>Control</strong> Technologies<br />
schematic diagram of a storage tunnel system is shown in Figure 7-3. The storage tunnel<br />
stores flow and conveys it to a dewatering station where floatables are removed at a<br />
screening house and then flows are lifted for conveyance to the WWTP.<br />
Screening<br />
House<br />
Gravity <strong>Sewer</strong><br />
to Treatment<br />
<strong>Plan</strong>t<br />
CSO Outfall<br />
Tunnel<br />
Diversion<br />
Structure and<br />
Dropshaft<br />
Vent<br />
Shaft<br />
Access<br />
Shaft<br />
Trash<br />
Rack<br />
Pump<br />
Station<br />
FIGURE 7-3<br />
STORAGE TUNNEL SCHEMATIC<br />
Force<br />
Main<br />
7.7 TREATMENT<br />
Screening – The major objective of screening is to provide high rate solids/liquid separation<br />
for combined sewer floatables and debris thereby preventing floatables from entering<br />
receiving waters. The following categories of screens are applicable to CSO outfall<br />
applications.<br />
o Trash Racks and Manually Cleaned Bar Racks – Trash racks are intended to remove<br />
large objects from overflow and have a clear spacing between approximately 1.5 to<br />
3.0 inches. Manually cleaned bar racks are similar and have clear spacings between<br />
1.0 to 2.0 inches. Both screens must be manually raked and the screenings allowed to<br />
drain before disposal. WASA has installed one bar rack at CSO 040 in Rock Creek.<br />
o Netting <strong>System</strong>s – Netting <strong>System</strong>s are intended to remove floatables and debris at<br />
CSO outfalls. A system of disposable mesh bags is installed in either a floating<br />
structure at the end of the outfall or in an underground chamber on the land side of<br />
the outfall. Nets and captured debris must be periodically removed using a boom<br />
truck and disposed of in a landfill. WASA has installed an end-of-pipe netting system<br />
at CSO outfall 018 on the Anacostia River and has contracted COG to independently<br />
evaluate the effectiveness and O&M concerns for this demonstration program.<br />
\\Gh-wash\ENG 1160\LTCP\LTCP Final\Sec 7.doc 7-15 FINAL - July 2002
Screening of CSO <strong>Control</strong> Technologies<br />
o Mechanically Cleaned Bar Screens – Mechanically cleaned bar screens typically have<br />
clear spacing between 0.25 and 1.0 inches. Bars are mounted 0 to 39 degrees from<br />
the vertical and rake mechanisms periodically remove material trapped on the bar<br />
screen. Facilities are typically located in a building to house collected screenings that<br />
must be collected after a CSO event and then transported to a landfill. The Northeast<br />
Boundary Swirl Facility is equipped with mechanically cleaned bar screens to treat<br />
the influent to the facility.<br />
o Fine Screens – Fine screens in CSO facilities typically follow bar screens and have<br />
openings between 0.010 and 0.5 inches. Flow is passed through the opening and<br />
solids are retained on the surface. Screens can be in the shape of a rotary drum or<br />
linear horizontal or vertical screens. Proprietary screens such as ROMAG have been<br />
specifically designed for wet weather applications. These screens retain solids on the<br />
dry weather side of the system so they can be conveyed to the wastewater treatment<br />
plant with the sanitary wastewater thereby minimizing the need for manual collection<br />
of screenings.<br />
Manually cleaned screens for CSO control at remote locations have not been widely applied due<br />
to the need to clean screens, and the potential to cause flooding if screens blind. Mechanically<br />
cleaned screens have had much greater application at CSO facilities. Due to the widely varying<br />
nature of CSO flow rates, even mechanically cleaned screens are subject to blinding under certain<br />
conditions. In addition, the screening must be housed in a building to limit aesthetic concerns<br />
and may require odor facilities as well. Fine screens have had more limited application for CSOs<br />
in the United States. ROMAG reports that over 250 fine screens have been installed in Europe<br />
and several screens have been installed in the United States (EPA, 1999a).<br />
<br />
Primary Sedimentation – The objective of sedimentation is to produce a clarified effluent by<br />
gravitational settling of the suspended particles that are heavier than water. It is one of the<br />
most common and well-established unit operations for wastewater treatment. Sedimentation<br />
also provides storage capacity, and disinfection can occur concurrently in the same tank. It is<br />
also very adaptable to chemical additives, such as lime, alum, ferric chloride, and polymers,<br />
which provide higher suspended solids and BOD removal. Many CSO control demonstration<br />
projects have included sedimentation. These include Dallas, Texas; New York City, New<br />
York; Saginaw, Michigan; and Mt. Clements, Michigan (EPA, 1978). Studies on existing<br />
storm water basins indicate suspended solids removals of 15 to 89 percent; BOD 5 removals<br />
of 10 to 52 percent (EPA, 1978, Fair and Geyer, 1965, Ferrara and Witkowski, 1983, Oliver<br />
and Gigoropolulos, 1981). WASA’s existing excess flow treatment train at BPWWTP<br />
utilizes this process to treat up to 336 mgd during storm events.<br />
\\Gh-wash\ENG 1160\LTCP\LTCP Final\Sec 7.doc 7-16 FINAL - July 2002
Screening of CSO <strong>Control</strong> Technologies<br />
<br />
Swirl/Vortex Concentrators – Three vortex technologies are currently marketed: USEPA<br />
Swirl Concentrator, Storm King Hydrodynamic Separator of British design, and the FluidSep<br />
vortex separator of German design. Although each of the three is configured somewhat<br />
differently, the operation of each unit and the mechanisms for solids separation are similar.<br />
Flow enters the unit at a controlled tangential velocity and is directed around the perimeter of<br />
a cylindrical shell, creating a swirling, vortex pattern. The swirling action causes solids to<br />
move to the outside wall and fall toward the bottom, where the solids concentrated flow is<br />
conveyed through a sewer line to the WWTP. The overflow is discharged over a weir at the<br />
top of the unit. Various baffle arrangements capture floatables that are subsequently carried<br />
out in the underflow. Principal attributes of the swirl concentrator are the ability to treat high<br />
flows in a very small footprint, and a lack of mechanical components and moving parts,<br />
thereby making it less operation and maintenance intensive.<br />
Swirl/Vortex separators have been operated in Decatur Illinois; Columbus, Georgia;<br />
Syracuse, New York; West Roxbury, Massachusetts; Rochester, New York; Lancaster,<br />
Pennsylvania; Toronto, Ontario, Canada. Swirl concentrator prototypes have achieved<br />
suspended solids removals of 12 to 86 percent in Lancaster, Pennsylvania; 18 to 55 percent in<br />
Syracuse, New York; and 6 to 36 percent in West Roxbury, Massachusetts. BOD 5 removals<br />
from 29 to 79 percent have been achieved with the swirl concentrator prototype in Syracuse<br />
New York. (Alquier, 1982). New York City is currently evaluating the performance of the<br />
three swirl/vortex technologies at full scale (133 mgd each) at the Corona Avenue Vortex<br />
Facility (Zaccagnino et al, 2000).<br />
The performance of vortex separators has been found to be inconsistent in many cases. A<br />
pilot study in Richmond, Virginia showed that the performance of two vortex separators was<br />
irregular and ranged from
Screening of CSO <strong>Control</strong> Technologies<br />
with sample pumps and possible stratification in the influent conduit have raised some<br />
concerns about the accuracy of the performance evaluation. In the spring of 2001, WASA<br />
initiated another performance evaluation of the facility using a new sampling system.<br />
However due the inconsistent performance and limited benefits of this technology, additional<br />
swirl/vortex facilities are not being considered.<br />
<br />
High Rate Physical Chemical Treatment (HRPCT) – High rate physical/chemical treatment is<br />
a traditional gravity settling process enhanced with flocculation and settling aids to increase<br />
loading rates and improve performance. The pretreatment requirements for high rate<br />
treatment are screening and degritting, identical to that required prior to primary<br />
sedimentation. The first stage of HRPCT is coagulant addition, where ferric chloride, alum<br />
or a similar coagulant is added and rapidly mixed into solution. Degritting may be<br />
incorporated into the coagulation stage with a larger tank designed for gravity settling of grit<br />
material. The coagulation stage is followed by a flocculation stage where polymer is added<br />
and mixed to form floc particles that will settle in the following stage. Also in this stage<br />
recycled sludge or micro sand from the settling stage is added back in to improve the<br />
flocculation process. Finally, the wastewater enters the gravity settling stage that is enhanced<br />
by lamella tubes or plates. Disinfection, which is not part of the HRPCT process, typically is<br />
completed after treatment to the HRPCT effluent. Sludge is collected at the bottom of the<br />
clarifier and either pumped back to the flocculation stage or wasted periodically when sludge<br />
blanket depths become too high. The two principal manufacturers of HRPCT processes are<br />
Infilco Degremont Incorporated, which manufacturers the DensaDeg process, and US Filter,<br />
which manufactures the Actiflo process. Each is described in more detail below:<br />
o IDI DensaDeg – Infilco Degremont offers the DensaDeg 2D and 4D processes, both<br />
of which require screening upstream. The 2D process requires upstream grit removal<br />
as well, but the 4D process integrates grit removal into the coagulation stage.<br />
Otherwise the 2D and 4D processes are identical. Figure 7-4 shows a schematic<br />
diagram of an IDI DensaDeg 4D system.<br />
There have been 138 DensaDeg systems installed worldwide since 1984, 46 of which<br />
are for wastewater applications. There are currently four DensaDeg systems installed<br />
for CSOs, all of which started up in France in 1999 with capacities from 13 to 63.5<br />
mgd. In the US there have been five pilot tests of the DensaDeg system for CSOs,<br />
and of these there are at least two that are currently under construction for full-scale<br />
operation. DensaDeg performance varies with rise rate and chemical dosages, but in<br />
general removal rates of 80 - 95% for TSS and 30 - 60% for BOD can be expected.<br />
Phosphorous and nitrogen are also removable with this process, although the removal<br />
\\Gh-wash\ENG 1160\LTCP\LTCP Final\Sec 7.doc 7-18 FINAL - July 2002
Screening of CSO <strong>Control</strong> Technologies<br />
efficiencies are dependent on the solubility of these compounds present in the<br />
wastewater. Removal efficiencies are also dependent on start-up time. Typically the<br />
DensaDeg process takes about 30 minutes before optimum removal rates are<br />
achieved to allow for the build-up of sludge solids.<br />
Air<br />
Flocculating aid<br />
(Polymer)<br />
Grease/scum draw off<br />
Coagulant<br />
Treated water<br />
Raw<br />
Wastewater<br />
1<br />
Grit<br />
Drawoff<br />
2<br />
4 6<br />
3<br />
5<br />
7<br />
Sludge Recirculation<br />
1 Grit removal/coagulation<br />
2 & 3 Flocculation<br />
4 Grease and scum removal<br />
5 & 6 Presettling and lamellar<br />
tube setting<br />
7 Sludge thickening<br />
Figure 7-4<br />
IDI DensaDeg HRPCT<br />
o U.S. Filter Actiflo – The US Filter Actiflo process is different from the DensaDeg<br />
process in that fine sand is used to ballast the sludge solids. As a result, the solids<br />
settle faster, but specialized equipment must be incorporated in the system to<br />
accommodate the handling sand throughout the system. Figure 7-5 shows the<br />
components of a typical US Filter Actiflo system.<br />
The US Filter Actiflo process does require screening upstream. Grit removal is<br />
recommended, but since the system uses microsand as ballast in the process, the<br />
presence of grit is tolerable in the system. If grit removal does not precede the<br />
process, the tanks must be flushed of accumulated grit every few months to a year,<br />
depending on the accumulation of grit and system run times.<br />
There are 113 Actiflo systems in operation or under construction worldwide since<br />
1991, 32 of which are for wastewater applications. Of the 32 wastewater applications,<br />
14 are in operation and 18 are under construction. There are currently two Actiflo<br />
\\Gh-wash\ENG 1160\LTCP\LTCP Final\Sec 7.doc 7-19 FINAL - July 2002
Screening of CSO <strong>Control</strong> Technologies<br />
systems operational for CSOs in Europe, and at least four under construction, three of<br />
which are in the US. The 4 sites under construction are scheduled for start-up in<br />
2001. The CSO sites either in operation or under construction range from 1 to 510<br />
mgd. In the US there have been 74 pilot tests of the Actiflo system since September<br />
of 1995, 24 of which have been for wastewater applications including CSOs. Actiflo<br />
performance varies with rise rate and chemical dosages, but in general removal rates<br />
of 80 - 95% for TSS and 30 - 60% for BOD are typical. Phosphorous and nitrogen<br />
are also removable with this process, although the removal efficiencies are dependent<br />
on the solubility of these compounds present in the wastewater. Phosphorous<br />
removal is typically between 60 – 90%, and nitrogen removal is typically between 15<br />
– 35%. Removal efficiencies are also dependent on start-up time. Typically the<br />
Actiflo process takes about 15 minutes before optimum removal rates are achieved.<br />
Sludge<br />
Hydrocyclone<br />
Sludge to Hydrocyclone to<br />
Remove Microsand for Reuse<br />
Polymer<br />
Raw<br />
Wastewater<br />
Coagulant<br />
M<br />
Micro-Sand<br />
M<br />
M<br />
Clarified<br />
<strong>Water</strong><br />
Coagulation<br />
Stage<br />
Flocculation<br />
Stage<br />
Plate Settler<br />
With Scraper<br />
Figure 7-5<br />
U.S. Filter Actiflo HRPCT<br />
<br />
Disinfection – The major objective of disinfection is to control the discharge of pathogenic<br />
microorganisms in receiving waters. Disinfection of combined sewer overflow is included as<br />
part of many CSO treatment facilities, including those in Washington, D.C.; Boston,<br />
Massachusetts; Rochester, New York; and Syracuse, New York. The disinfection methods<br />
considered for use in combined sewer overflow treatment are chlorine gas, calcium or sodium<br />
hypochlorite, chloride dioxide, peracetic acid, ozone, ultraviolet radiation, and electron beam<br />
irradiation. The chemicals are all oxidizing agents that are corrosive to equipment and in<br />
concentrated forms are highly toxic to both microorganisms and people. Each is described<br />
below.<br />
\\Gh-wash\ENG 1160\LTCP\LTCP Final\Sec 7.doc 7-20 FINAL - July 2002
Screening of CSO <strong>Control</strong> Technologies<br />
o Chlorine gas – Chlorine gas is extremely effective and relatively inexpensive.<br />
However, it is extremely toxic and its use and transportation must be monitored or<br />
controlled to protect the public. Chlorine gas is a respiratory irritant and in high<br />
concentrations can be deadly. Therefore, it is not well suited to populous or<br />
potentially non-secure areas. The use of gaseous chlorine for disinfection is not<br />
suitable for WASA because of the dangers involved.<br />
o Calcium or Sodium Hypochlorite – Hypochlorite systems are common in wastewater<br />
treatment installations. For years, large, densely populated metropolitan areas have<br />
employed hypochlorite systems in lieu of chlorine gas for safety reasons. The<br />
hypochlorite system uses sodium hypochlorite in a liquid form much like household<br />
bleach and is similarly effective as chlorine gas although more expensive. It can be<br />
delivered in tank trucks and stored in aboveground tanks. The storage life of the<br />
solution is 60 to 90 days (before the disinfecting ability of the solution starts to<br />
degrade).<br />
o Chlorine Dioxide – Chlorine dioxide is an extremely unstable and explosive gas and<br />
any means of transport is potentially very hazardous. Therefore, it must be generated<br />
on site. The overall system is relatively complex to operate and maintain compared<br />
to more conventional chlorination.<br />
o Ozone – Ozone is a strong oxidizer and must be applied to CSO as a gas. Due to the<br />
instability of ozone, it must also be generated on site. Ozone disinfection is relatively<br />
expensive, with the cost of the ozone generation equipment being the primary capital<br />
cost item. Operating costs can be very high depending on power costs, since<br />
ozonation is a power intensive system. Ozonation is also relatively complex to<br />
operate and maintain compared to chlorination. Ozone is not considered practical for<br />
CSO applications because it must be generated on site in an intermittent fashion in<br />
response to variable and fluctuating CSO flow rates.<br />
o UV Disinfection – UV disinfection uses light with wavelengths between 40 and 400<br />
nanometers for disinfection. Light of the correct wavelength can penetrate cells of<br />
pathogenic organisms, structurally altering DNA and preventing cell function.<br />
Because UV light must penetrate the water to be effective, the TSS level of CSOs can<br />
affect the disinfection ability.<br />
o Electron Beam Irradiation – Electron Beam Irradiation uses a stream of high energy<br />
electrons directed into a thin film of water. The electrons break apart water<br />
molecules and produce a number of reactive chemical species, which can kill<br />
pathogenic organisms. Electron beam irradiation is not considered practical since it<br />
has not been evaluated or applied for CSO treatment (EPA 1999b; EPA 1999c).<br />
\\Gh-wash\ENG 1160\LTCP\LTCP Final\Sec 7.doc 7-21 FINAL - July 2002
Screening of CSO <strong>Control</strong> Technologies<br />
Disinfection reduces potential public health impacts from CSOs but needs to be used in<br />
conjunction with other technologies.<br />
In order to protect aquatic life in the receiving waters, dechlorination facilities would be<br />
installed whenever chlorination is used as a disinfectant. Dechlorination would be<br />
accomplished by injection of sodium bisulfite in the flow stream before discharge of treated<br />
CSO flow to waterways. Dechlorination with sodium bisulfite is rapid; hence no contact<br />
chamber is required since the reaction with chlorine is immediate.<br />
<br />
Constructed Wetlands – Constructed wetlands use natural biotic systems to treat wastewater.<br />
Elements of a modern wastewater treatment plant occur naturally in wetlands. Aquatic<br />
plants, animals and bacteria utilize the organic wastes, nutrients, greases and bacteriological<br />
pollution found in CSOs. Complex relationships between roots and nitrifying bacteria<br />
convert ammonia to nitrates that is consumed by algae and other aquatic life. A benefit of<br />
constructed wetlands is that no energy is required to maintain treatment processes (aside from<br />
pumping if required to deliver CSOs to the wetland area). However, major drawbacks with<br />
constructed wetlands are (1) they require large areas of land, and (2) treatment processes are<br />
extremely slow (especially in winter) and (3) CSO is left open to the environment requiring<br />
constructed wetland areas to be fenced off to prevent public contact. There are few places in<br />
the District near major CSOs where large tracts of land could be reclaimed as constructed<br />
wetlands and removed from public use. Given the large flow rates and volumes associated<br />
with District CSOs, constructed wetlands are an unsuitable alternative and have been<br />
eliminated from further consideration.<br />
<br />
Expansion of BPWWTP – Over the years, Blue Plains WWTP has been steadily increasing<br />
its capacity to accommodate the rapid population growth in the District and surrounding<br />
suburbs. At the present time, space is very limited at the site. Although there is room for<br />
four more primary clarifiers, the resulting extra capacity would be insufficient to address<br />
CSO treatment requirements. The higher loading rates associated with high rate<br />
physical/chemical treatment processes are much more feasible given the limited space.<br />
However, space for disinfection facilities would also be required. Finally, there is<br />
insufficient conveyance capacity in the existing pumping stations and outfall sewers to<br />
convey CSOs to the Blue Plains facility. Significant pipelines or tunnels are required in<br />
addition to any expansion in plant capacity.<br />
7.8 RECEIVING WATER IMPROVEMENT<br />
Receiving waters can also be treated directly with various technologies that improve water quality.<br />
The Anacostia River, a sluggish river significantly impacted by the tidal flux, appears to be suited for<br />
\\Gh-wash\ENG 1160\LTCP\LTCP Final\Sec 7.doc 7-22 FINAL - July 2002
Screening of CSO <strong>Control</strong> Technologies<br />
this alternative. Below are described the different treatment options that could aid in improving<br />
water quality in conjunction with CSO control measures:<br />
<br />
Aeration – Aeration improves the dissolved oxygen content of the river by adding air. Air<br />
could be added directly to the river (“in stream”) or a portion of the river could be diverted to<br />
a side channel (“side stream”) for the addition of air and then rejoined with the main river.<br />
Refer to Figure 7-6 for a schematic diagram of a typical side stream aeration facility. The<br />
Metropolitan <strong>Water</strong> Reclamation District of Greater Chicago uses side stream aeration to<br />
improve the water quality of the Calumet River and the Cal-Sag Channel. The Chicago water<br />
authority operates five Sidestream Elevated Pool Aeration Stations (SEPA) along the Cal-Sag<br />
Channel. The SEPA stations lift 100 – 800 mgd of water from 12 to 15 feet, allowing it to<br />
drop down a series of steps and aerate the water. The SEPA stations and waterfalls have<br />
been incorporated into park settings that allow and encourage public use of the area. Side<br />
stream aeration has been retained for consideration, but in-stream aeration has been<br />
eliminated due to difficulties in implementation, such as the potential for disrupting<br />
Anacostia River sediments and the natural thermocline of the receiving water.<br />
PUMPING<br />
STATION<br />
FIGURE 7-6<br />
SIDESTREAM AERATION FACILITY<br />
<br />
Flow Augmentation of Anacostia River – Adding water upstream of the CSO outfalls could<br />
achieve improved flushing action of the Anacostia River and its pollutants downstream<br />
toward the Potomac River where there is greater assimilative capacity. Potential sources of<br />
water that could be pumped to the Anacostia River are:<br />
o Blue Plains Effluent – Treated effluent from the BPWWTP would be pumped to the<br />
Anacostia River. A new pumping station and extensive pipeline between Blue Plains<br />
\\Gh-wash\ENG 1160\LTCP\LTCP Final\Sec 7.doc 7-23 FINAL - July 2002
Screening of CSO <strong>Control</strong> Technologies<br />
and the Anacostia River north of CSO 019 would be required. A receiving water<br />
model run incorporating this scheme showed no significant water quality<br />
improvement to the Anacostia River. As a result it has been eliminated from further<br />
consideration.<br />
o Existing groundwater pumpage in District – Several buildings in the District,<br />
particularly those in the Federal Triangle, have basements below the ground water<br />
table that are kept dry by pumping groundwater to the combined and separate sanitary<br />
sewer system. WASA has estimated this pumpage to be approximately 8.6 mgd on<br />
an annual average basis. Given the small volume of this pumpage, the significant<br />
disruptive construction and high cost required to deliver it from buildings all over the<br />
District to a receiving water, this alternative is unlikely to provide cost effective CSO<br />
control. However, it has been retained for possible combination with other inflow<br />
control options.<br />
7.9 SOLIDS AND FLOATABLES CONTROL<br />
Technologies that provide solids and floatables control do not reduce the frequency or magnitude of<br />
CSO overflows, but can reduce the presence of aesthetically objectionable items such as cups, paper,<br />
styrofoam and sanitary matter, etc. The full range of technologies was investigated to determine<br />
which might be applicable to WASA’s combined sewer system. These included both end of pipe<br />
technologies such as netting and screens, as well as BMPs such as catch basin modifications and<br />
street cleaning which could be implemented upstream of outfalls in the drainage area. Each of these<br />
technologies is summarized below:<br />
<br />
Netting Devices - Netting devices can be used to separate floatables from CSOs by passing<br />
the flow through a set of netted bags. Floatables are retained in the bags, and the bags are<br />
periodically removed for disposal. Netting systems can be located in-water at the end of the<br />
pipe, or can be placed in-line to remove the floatables before discharge to the receiving<br />
waters. WASA has installed a floating end of pipe netting system at CSO 018 as a<br />
demonstration project and is currently evaluating its performance.<br />
<br />
Containment Booms - Containment booms are specially fabricated floatation structures with<br />
suspended curtains designed to capture buoyant materials. They are typically anchored to a<br />
shoreline structure and to the bottom of the receiving water. After a rain event, collected<br />
materials can be removed using either a skimmer vessel or a land-based vacuum truck. A 2-<br />
year pilot study of containment booms was conducted by New York City in Jamaica Bay.<br />
An assessment of the effectiveness indicated that the containment booms provided a retention<br />
efficiency of approximately 75%.<br />
\\Gh-wash\ENG 1160\LTCP\LTCP Final\Sec 7.doc 7-24 FINAL - July 2002
Screening of CSO <strong>Control</strong> Technologies<br />
<br />
Bar Screens - Manually Cleaned - Manually cleaned bar screens can be located within in-line<br />
CSO chambers or at the point of outfall to capture floatables. The configuration of the screen<br />
would be similar to that found in the influent channels of small wastewater pumping stations<br />
or treatment facilities. Retained materials must be manually raked and removed from the<br />
sites after every storm. For multiple CSOs, this would result in very high maintenance<br />
requirements. Previous experience with manually cleaned screens in CSO applications has<br />
shown these units to have a propensity for clogging. In Louisville, KY, screens installed in<br />
CSO locations became almost completely clogged with leaves from fall runoff. Because of<br />
the high frequency of cleaning required, it was decided to remove the screens.<br />
<br />
Weir-Mounted Screens - Mechanically Cleaned - Horizontal mechanical screens are weirmounted<br />
mechanically cleaned screens driven by electric motors or hydraulic power packs.<br />
The rake mechanism is triggered by a float switch in the influent channel and returns the<br />
screened materials to the interceptor sewer. Various screen configurations and bar openings<br />
are available depending on the manufacturer. Horizontal screens can be installed in new<br />
overflow weir chambers or retrofitted into existing structures if adequate space is available.<br />
Electric power service must be brought to each site.<br />
<br />
Overflow Screen with Automatic Backwash - H.I.L. Technology Inc. has recently introduced<br />
an overflow screening system called the Hydro-Jet Screen, which is equipped with an air<br />
regulated siphon to control automatic backwashing of the screen. This system functions as a<br />
regulator within the sewer system. Dry weather flows are contained within the system and<br />
are conveyed to the wastewater treatment plant (WWTP). Wet weather flows which cannot<br />
be passed on to the WWTP rise in the Hydro-Jet Screen inlet channel and discharge over the<br />
weir to an inclined polymer coated screen which traps floatables and other solids greater than<br />
6mm. The screened flow passes through a self priming auto break siphon which initiates the<br />
screen backwash cycle. The water level below the screen rises forcing air through, dislodging<br />
floatables and flushing them to a screenings collection channel. The collection channel<br />
returns the screenings to the pass on flow to the WWTP. The backwash cycle typically occurs<br />
every 30-45 seconds during a storm event. No external power source is required for<br />
operation. The energy within the water flow drives the system. This is a new technology with<br />
the first installation just constructed in England at the end of 1998.<br />
<br />
Baffles Mounted in Regulator<br />
o Fixed Underflow Baffles - Underflow baffles consist of a transverse baffle mounted<br />
in front of and perpendicular to the overflow pipe. During a storm event, the baffle<br />
prevents the discharge of floatables by blocking their path to the overflow pipe. As<br />
the storm subsides, the floatables are conveyed to downstream facilities by the dry<br />
weather flow in the interceptor sewer. The applicability and effectiveness of the<br />
\\Gh-wash\ENG 1160\LTCP\LTCP Final\Sec 7.doc 7-25 FINAL - July 2002
Screening of CSO <strong>Control</strong> Technologies<br />
baffle depends on the configuration and hydraulic conditions at the regulator<br />
structure.<br />
o Floating Underflow Baffles - A variation on the fixed underflow baffle is the floating<br />
underflow baffle developed in Germany and marketed under the name HydroSwitch<br />
by Grande, Novac & Associates. The floating baffle is mounted within a regulator<br />
chamber sized to provide floatables storage during wet weather events. All floatables<br />
trapped behind the floating baffle are be directed to the WWTP through the dry<br />
weather flow pipe. By allowing the baffle to float, a greater range of hydraulic<br />
conditions can be accommodated. This technology has not yet been demonstrated in<br />
the United States, however, there are operating units in Germany.<br />
<br />
Overflow Siphon - The overflow siphon consists of an air regulated siphon with a vertical<br />
suction tube, a trumpet-like inlet, and a V-shaped discharge section. This setup allows<br />
conveyance of a large volume of flow over the discharge weir in a relatively small area. The<br />
floatables are retained behind the weir as flow is discharge through the siphon inlet below the<br />
water surface. The retained floatables are then returned the interceptor sewer when flow<br />
subsides.<br />
<br />
Catch Basin Modifications - Catch basin modifications consist of various devices to prevent<br />
floatables from entering the CSS. Inlet grates reduce the amount of street litter and debris<br />
that enters the catch basin. Catch basin modifications such as hoods, submerged outlets and<br />
vortex valves, alter the outlet pipe conditions and keep floatables from entering the CSS.<br />
Catch basin hoods are similar to the underflow baffle concept described previously for<br />
installation in regulator chambers. These devices also provide a water seal for containing<br />
sewer gas. The success of a catch basin modification program is dependent on having catch<br />
basins with sumps deep enough to install hoods-type devices. Surveys of WASA’s catch<br />
basins indicate there are limited numbers of basins suitable for this in the combined sewer<br />
system. A potential disadvantage of catch basin outlet modifications and other insert-type<br />
devices is the fact that retained materials could clog the outlet if cleaning is not performed<br />
frequently enough. This could result in backup of storm flows and increased street flooding.<br />
<br />
Best Management Practices (BMPS) – BMPs such as street cleaning and public education<br />
have the potential to reduce solids and floatables in CSO. These are described in the<br />
beginning of this section.<br />
A comparison of floatables control technologies is presented in Table 7-2.<br />
\\Gh-wash\ENG 1160\LTCP\LTCP Final\Sec 7.doc 7-26 FINAL - July 2002
Screening of CSO <strong>Control</strong> Technologies<br />
Table 7-2<br />
Comparison of Solids and Floatable <strong>Control</strong> Technologies<br />
Technology Implementation Effort Required Maintenance Effectiveness Relative Cost<br />
End-of-Pipe Netting Moderate Moderate High Moderate<br />
In-Line Netting High Moderate High High<br />
Containment Booms Moderate Moderate Moderate Moderate<br />
Bar Screens - Manual Low High Moderate Low<br />
Weir-Mounted Screens Low Moderate High Moderate<br />
Screen with Backwash High Low High High<br />
Fixed Baffles Low Low Moderate Low<br />
Floating Baffles High Low Moderate Moderate<br />
Street Cleaning Low High High Moderate<br />
Catch Basin Modifications Low Moderate Moderate Low<br />
Public Education Moderate Low Variable Moderate<br />
7.10 SCREENING OF CONTROL TECHNOLOGIES<br />
The various treatment technologies described previously have been screened for further, in-depth<br />
consideration. The results of the analysis are summarized below in Table 7-3.<br />
\\Gh-wash\ENG 1160\LTCP\LTCP Final\Sec 7.doc 7-27 FINAL - July 2002
Screening of CSO <strong>Control</strong> Technologies<br />
Table 7-3<br />
Screening of CSO <strong>Control</strong> Technologies<br />
CSO <strong>Control</strong> Technology<br />
Source <strong>Control</strong><br />
Public Education<br />
Street Sweeping<br />
Construction Site Erosion <strong>Control</strong><br />
Catch Basin Cleaning<br />
Industrial Pretreatment<br />
Retain for<br />
Consideration<br />
Implemented to<br />
Satisfactory Level<br />
X<br />
X<br />
X<br />
X<br />
Eliminate from<br />
Further<br />
Consideration<br />
Consider Combining<br />
with Other <strong>Control</strong><br />
Technologies<br />
X<br />
Garbage Disposal Ban<br />
<strong>Combined</strong> <strong>Sewer</strong> Flushing<br />
Inflow <strong>Control</strong><br />
“Daylight” orphaned storm sewer<br />
Offload Ground <strong>Water</strong> Pumpage<br />
Storm <strong>Water</strong> Detention<br />
Street Storage of Storm <strong>Water</strong><br />
<strong>Water</strong> Conservation<br />
Infiltration/Inflow Reduction<br />
Stream Diversion<br />
Low Impact Development-Retrofit<br />
Bioretention<br />
Dry Wells<br />
Filter Strips<br />
Vegetated Buffers<br />
Level Spreader<br />
Grassed Swales<br />
Rain Barrels<br />
Cisterns<br />
Infiltration Trenches/catch<br />
basins<br />
Rooftop Greening<br />
Increased Tree cover<br />
Permeable Pavements<br />
<strong>Sewer</strong> <strong>System</strong> Optimization<br />
Optimize Existing <strong>System</strong><br />
Real Time <strong>Control</strong><br />
<strong>Sewer</strong> Separation<br />
Complete Separation<br />
Storage<br />
Partial Separation<br />
Rain Leader Disconnection<br />
In - stream storage of CSO<br />
Earthen Basins<br />
Open Concrete Tanks<br />
Closed Concrete Tanks<br />
X<br />
X<br />
X<br />
X<br />
X<br />
X<br />
X<br />
X<br />
X<br />
X<br />
X<br />
X<br />
X<br />
X<br />
X<br />
X<br />
X<br />
X<br />
X<br />
X<br />
X<br />
X<br />
X<br />
X<br />
X<br />
X<br />
X<br />
X<br />
X<br />
X<br />
X<br />
\\Gh-wash\ENG 1160\LTCP\LTCP Final\Sec 7.doc 7-28 FINAL - July 2002
Screening of CSO <strong>Control</strong> Technologies<br />
CSO <strong>Control</strong> Technology<br />
Storage Pipelines/Conduits<br />
Tunnels<br />
Treatment<br />
Screening<br />
Primary Sedimentation<br />
Swirl Concentrator<br />
Vortex Separator<br />
High Rate Physical Chemical<br />
Treatment<br />
Disinfection<br />
Constructed Wetlands<br />
Expansion of BPWWTP<br />
Receiving <strong>Water</strong> Improvement<br />
Side Stream Aeration<br />
In-stream Aeration<br />
Divert Blue Plains Effluent to<br />
Anacostia River<br />
Pump Ground <strong>Water</strong> to Anacostia<br />
Solids and Floatable <strong>Control</strong>s<br />
Netting <strong>System</strong>s<br />
Containment Booms<br />
Manual Bar Screens<br />
Weir Mounted Screens<br />
Screens with Backwash<br />
Fixed baffles<br />
Floating Baffles<br />
Catch Basin Modifications<br />
Retain for<br />
Consideration<br />
X<br />
X<br />
X<br />
X<br />
X<br />
X<br />
X<br />
X<br />
X<br />
X<br />
Implemented to<br />
Satisfactory Level<br />
Eliminate from<br />
Further<br />
Consideration<br />
X<br />
X<br />
X<br />
X<br />
X<br />
X<br />
X<br />
X<br />
X<br />
X<br />
X<br />
Consider Combining<br />
with Other <strong>Control</strong><br />
Technologies<br />
X<br />
\\Gh-wash\ENG 1160\LTCP\LTCP Final\Sec 7.doc 7-29 FINAL - July 2002
Preliminary <strong>Control</strong> Program Alternatives<br />
Section 8<br />
Preliminary <strong>Control</strong> Program Alternatives<br />
8.1 INTRODUCTION<br />
This section describes the development of preliminary control plan alternatives and the factors used<br />
to evaluate the alternative plans. Alternative elements that apply to the entire District, as well as<br />
those specific to each of the three receiving waters were evaluated. These alternative elements were<br />
evaluated based on criteria such as ability to comply with regulatory requirements, public acceptance,<br />
feasibility, and ease of operation and maintenance. Final alternatives were selected based on the<br />
merits of the alternative as compared to the criteria. Final alternatives will be analyzed further and<br />
evaluated for cost effectiveness in Section 9.<br />
8.2 ALTERNATIVE ELEMENTS<br />
Options for CSO control can be divided into the following categories: <strong>System</strong> wide elements,<br />
Anacostia River elements, Rock Creek elements, and Potomac River elements. Elements in each of<br />
these categories can be combined to constitute a complete LTCP.<br />
8.2.1 <strong>System</strong> Wide Elements<br />
The following system wide alternatives were evaluated:<br />
<br />
<br />
<br />
<br />
<br />
<br />
Low Impact Development-Retrofit (LID-R)<br />
LID-R involves small scale projects such as filter strips, dry wells, bioretention(rain gardens),<br />
cisterns, porous pavement, and sand filtration reduce the amount of storm water runoff to the<br />
combined sewer system, as well as reduce pollutant loads.<br />
Rooftop Greening<br />
Rooftop greening involves installation of roofing systems that incorporate vegetation such as<br />
various plants, shrubs, and trees. The vegetation and accompanying soil absorb a portion of<br />
the storm water that would otherwise enter the CSS.<br />
Inflow <strong>Control</strong><br />
Inflow <strong>Control</strong> involves diverting flows from separate storm sewers and groundwater sump<br />
pumps connected to the CSS reduces the volume of water entering the CSS during storm<br />
events.<br />
Real Time <strong>Control</strong> (RTC)<br />
RTC involves expansion of the WASA’s existing RTC system with additional inflatable<br />
dams and improved pump station operations to increase in-system storage.<br />
<strong>Sewer</strong> Separation<br />
Partially or completely separating the combined sewer system.<br />
Pump and Treat or Pump and Store<br />
These two system-wide elements are similar in scope requiring the construction of an<br />
extensive collection and conveyance system, which essentially parallels the existing CSS.<br />
\\Gh-wash\ENG 1160\LTCP\LTCP Final\Sec 8.doc 8-1 FINAL - July 2002
Preliminary <strong>Control</strong> Program Alternatives<br />
Due to the extremely high flow rates involved with wet weather events, components of the<br />
system such as pumping stations and intercepting sewers are large, creating an extremely<br />
complex system and with large operation and maintenance requirements. Conveyed flows<br />
could be either stored or receive high rate treatment a site near Blue Plains WWTP.<br />
<br />
Pump Stations Rehabilitation<br />
Several pumping stations are currently functioning below their designed capacity due to<br />
aging pumps, controls and screening facilities. Rehabilitating these stations will provide<br />
significant benefits for CSO reduction. This element also takes into account the upgrade and<br />
replacement of the existing inflatable dams.<br />
<br />
Tunnel <strong>System</strong>s<br />
Includes various configurations of a large diameter deep tunnel system (approximately 70 to<br />
250 ft. below grade) to store overflow from the CSS. Regulator structures at CSO locations<br />
would direct overflow to drop shafts and into the tunnel. After the storm event, the tunnel<br />
systems would be dewatered over a period of one or two days, with the stored wastewater<br />
being sent to BPWWTP for treatment.<br />
Each of the system wide alternatives can constitute a LTCP and will be evaluated in subsection 8.3 as<br />
preliminary control plans.<br />
8.2.2 Anacostia River Elements<br />
The following Anacostia River Elements were evaluated:<br />
<br />
Use of Capitol Hill Relief <strong>Sewer</strong> (CHRS) for Storage<br />
The Capitol Hill Relief <strong>Sewer</strong> was originally designed to provide flooding relief in the<br />
Capital Hill Area. The CHRS tunnel was to function as a storm water outlet to the Anacostia<br />
River to which separate storm water pipelines could be connected. The tunnel was never<br />
completed due to the CSX railroad tunnel being constructed in conflict with the original<br />
CHRS profile. This sewer is approximately 4700 feet long, extending from 6th/Pennsylvania<br />
Ave. SE down to its outfall into the Anacostia River, in the Navy Yard. Its cross section<br />
ranges from 18’6” diameter circular pipe, to a 19’6” x 14’10” elliptical pipe, to an 18’ x 13’<br />
box sewer. As shown in Figure 8-1, there is a 300’ gap in the sewer where it would cross<br />
under the CSX railroad near 6th St. and Virginia Ave.<br />
For the purposes of the LTCP evaluation, the CHRS tunnel was evaluated for its potential to<br />
store CSOs. Calculations show that if the missing section was redesigned and constructed the<br />
entire length of the sewer could provide only 3.7 million gallons of storage volume.<br />
\\Gh-wash\ENG 1160\LTCP\LTCP Final\Sec 8.doc 8-2 FINAL - July 2002
Preliminary <strong>Control</strong> Program Alternatives<br />
The maximum storage elevation is limited by the elevation of the lowest regulator elevation<br />
of the Navy Yard CSO’s and this storage capacity may be further reduced by river water<br />
intrusion. In addition to completing the missing section, a dewatering pump station and<br />
bulkhead for the terminus at the Anacostia River as well as new pipelines sized to carry<br />
overflows from the CSO regulators to the CHRS tunnel would need to be constructed to<br />
utilize all of the potential storage volume. Under the C3 scenario (currently planned projects),<br />
the projected storage volume required to reduce CSOs to 4 overflows per year from the<br />
CSO’s on the west side of the Anacostia (009, 010, 011, 011a, 012, 013 – 018) is more than<br />
34 million gallons. Therefore, the configuration of the Capitol Hill Relief <strong>Sewer</strong> allows<br />
insufficient volume to be stored to attain significant reduction in CSO overflows and would<br />
require significant effort to retrofit for very little benefit. This element will not be considered<br />
further.<br />
<br />
Use of Anacostia Force Main and Gravity <strong>Sewer</strong><br />
The abandoned Anacostia Force Main and Gravity <strong>Sewer</strong> has a total volume of 4.6 mg and<br />
was evaluated for potential use as a storage facility and for use as a conveyance pipeline.<br />
Investigations indicate that the pipeline is in poor condition and would required extensive<br />
rehabilitation. As shown in Figure 8-2, the pipeline has multiple sections of inverted siphons<br />
or pressure sewer sections, which create an irregular profile. This undulating profile makes<br />
this sewer unsuitable for application as CSO storage facility. Numerous pump stations would<br />
be required to dewater the conduit after each storm event and solids deposition would be a<br />
continuing problem. According to WASA staff, the configuration of the Anacostia Force<br />
Main and Gravity <strong>Sewer</strong> resulted in serious odor problems while in operation. In addition,<br />
some CSOs on the east side of the Anacostia are below the elevation of the conduit, which<br />
would preclude gravity flow into the conduit at these locations. Therefore, this element will<br />
not be considered further for storage.<br />
The Anacostia Force Main and Gravity <strong>Sewer</strong> was also evaluated for use as a conveyance<br />
pipeline. Use of the sewer to convey the Fort Stanton outfalls (CSO 005, 006 and 007) on the<br />
east side of the Anacostia was determined not to be feasible because gravity flow is not<br />
achievable, necessitating pumping stations at each CSO. If the sewer were rehabilitated or<br />
replaced, it could be used to convey additional Northeast Boundary Flow to the Outfall<br />
<strong>Sewer</strong>s and then to BPWWTP. This would require expansion of East Side Pumping Station,<br />
construction of an additional force main across the Anacostia, rehabilitation and/or<br />
replacement of the Anacostia Force Main and Gravity <strong>Sewer</strong>, and expansion of BPWWTP.<br />
Expansion of BPWWTP is required since there is no additional treatment capacity at the<br />
plant. Based on its size, the maximum flow that might be expected if the existing sewer were<br />
rehabilitated as a force main is on the order of 175 mgd.<br />
\\Gh-wash\ENG 1160\LTCP\LTCP Final\Sec 8.doc 8-4 FINAL - July 2002
Preliminary <strong>Control</strong> Program Alternatives<br />
Overflow rates in excess of 1,000 mgd are regularly seen at Northeast Boundary, with rates at<br />
the larger events exceeding 1,350 mgd. Use of the Anacostia Force Main and Gravity <strong>Sewer</strong><br />
would thus require a large amount of expensive and disruptive construction but would not<br />
provide an acceptable level of control for Northeast Boundary. This alternative was thus<br />
eliminated from further consideration.<br />
<br />
Satellite Storage<br />
A review of land in the District was conducted to identify potential sites for satellite storage.<br />
Few sites were identified. Those that were identified were found to be owned by the<br />
National Park Service or the Federal Government. Satellite storage facilities capturing<br />
CSO’s at the locations noted below were considered.<br />
o RFK Stadium parking lot: CSO 019<br />
o Bolling AFB athletic field: CSO’s 009 - 018<br />
o East Anacostia Park athletic field: CSO’s 005 – 007<br />
After the wet weather event, the stored combined sewage would be released in a controlled<br />
manner to the conveyance system for transport to the BPWWTP for treatment. Satellite<br />
storage facilities can be sized to obtain the range of 2 to 12 overflows per year. This element<br />
will be evaluated further in subsection 8.3.<br />
<br />
Satellite High Rate Treatment<br />
A satellite treatment facility with high rate treatment, located at the RFK parking lot in<br />
Anacostia Park was considered. However, the need to adequately staff and maintain a<br />
sophisticated treatment facility at this location would add a significant layer of complexity to<br />
WASA’s existing system operations. In addition, high rate treatment generates a significant<br />
sludge stream that must receive further processing before disposal. Such processes are not<br />
compatible with an urban park area. This element will not be considered further.<br />
<br />
Side Stream Aeration<br />
Side stream aeration was evaluated for its potential to aid in improving the Anacostia River’s<br />
dissolved oxygen water quality in conjunction with CSO control measures. Analysis was<br />
performed on a test scenario of two side stream aeration stations, one located upstream of<br />
Benning Road and one in the vicinity of RFK stadium and no other controls. Results indicate<br />
that downstream reaches affected by the stations can be maintained at 3.0 mg/l. To achieve a<br />
level of 3.0 mg/l throughout the District, another station would be required at the District<br />
Boundary. Also, without pollution load reductions, side stream aeration cannot achieve the<br />
5.0 mg/l water quality standard for dissolved oxygen.<br />
\\Gh-wash\ENG 1160\LTCP\LTCP Final\Sec 8.doc 8-6 FINAL - July 2002
Preliminary <strong>Control</strong> Program Alternatives<br />
Side stream aeration will not be considered further for the LTCP since it does not reduce<br />
CSO overflows. However, its benefits may be appropriate as part of a watershed wide effort<br />
to improve dissolved oxygen.<br />
8.2.3 Rock Creek Elements<br />
Of the three receiving waters, Rock Creek has the most protective CSO conveyance facilities<br />
currently in place. Discharges to this receiving water are a fraction of those to the Anacostia and<br />
Potomac Rivers as discussed in Section 6 of the report. In the late 1930’s a large CSO <strong>Control</strong> project<br />
was under taken that constructed two large interceptor sewers, known as the East and West Rock<br />
Creek Diversion <strong>Sewer</strong>s, which parallel the creek on each side. The intent of this design was to<br />
intercept combined sewer flows along Rock Creek and convey the flow to the Potomac combined<br />
system where its conveyed on to BPWWTP or discharged to the Potomac River where a greater<br />
dilution capacity is available.<br />
Model runs indicate that most of the Rock Creek CSOs will not activate during the average year.<br />
However, one substantial CSO remains in this system, which is the Piney Branch Outfall (CSO 049).<br />
Several other outfalls along the system are projected to activate sporadically for short durations of<br />
time.<br />
The following Rock Creek elements were evaluated:<br />
Preliminary Alternatives for Piney Branch Outfall (049)<br />
o Local Tunnel – The overflow from CSO 049 would be stored in a tunnel dug into<br />
a nearby rock embankment with stored flow released by gravity into the Piney<br />
Branch Interceptor after wet weather events. The tunnel can be sized to achieve<br />
the 2 to 12 overflows once the desired level of protection is chosen.<br />
o Satellite Storage – The overflow from CSO 049 could also be diverted to a new<br />
storage basin just south of the outfall and released by gravity into the East Rock<br />
Creek Diversion <strong>Sewer</strong> after the wet weather event. The storage basin can be<br />
sized to achieve 2 to 12 overflows once the desired level of protection is chosen.<br />
These elements will be evaluated further in subsection 8.3.<br />
<br />
Other Rock Creek CSOs<br />
Several outfalls located south of ‘N’ Street NW in the flat section of Rock Creek are<br />
predicted to overflow because of surcharging in the Rock Creek Main Interceptor and<br />
because of low dam settings in the regulators. Preliminary alternatives evaluated for<br />
reducing other Rock Creek CSOs are as follows:<br />
\\Gh-wash\ENG 1160\LTCP\LTCP Final\Sec 8.doc 8-7 FINAL - July 2002
Preliminary <strong>Control</strong> Program Alternatives<br />
o Rock Creek regulator improvements and interconnection to the Potomac portion of<br />
the CSS to prevent surcharging in the Rock Creek Main Interceptor.<br />
o Construction of a relief sewer parallel to the Rock Creek Main Interceptor for a<br />
portion of its length<br />
These elements will be utilized in conjunction with all preliminary control plans<br />
evaluated in subsection 8.3.<br />
8.2.4 Potomac River Elements<br />
The following Potomac River elements were evaluated:<br />
<br />
Satellite Storage<br />
Satellite storage facilities in the following locations, and for the following outfalls, would<br />
capture CSOs during wet weather events in retention basins:<br />
o Georgetown D.C. Dept. of Public Works parking lot: CSO’s 023-029<br />
o Bolling AFB athletic field: CSO’s 020-022<br />
After the wet weather event, the combined sewage could be released in a controlled<br />
manner to the conveyance system for transport to BPWWTP for treatment.<br />
8.3 PRELIMINARY CONTROL PLAN ALTERNATIVES<br />
The alternative elements described above were assembled, based on the evaluation factors, to form<br />
complete CSO control programs. The set of preliminary control program alternatives that have been<br />
considered is presented below.<br />
8.3.1 Pump Stations Rehabilitation (Alternative C3)<br />
This alternative includes upgrade/replacement of the existing inflatable dams and rehabilitation of<br />
Main and Potomac Pumping Stations to achieve firm pumping capacities of 240 and 460 mgd,<br />
respectively. WASA’s current capital improvement program as of May 2001 includes rehabilitation<br />
of the Main, Eastside, and Poplar Point Pump Stations and replacement of the inflatable dams.<br />
Rehabilitation of the Potomac Pump Station is currently in the study phase.<br />
8.3.2 Real Time <strong>Control</strong> (Alternative D4)<br />
The real time control (RTC) alternative involves the expansion of WASA’s existing inflatable dams<br />
system and improved pump station operations in conjunction with local and system wide dynamic<br />
control scheme to store combined sewage and reduce CSOs. WASA currently has in-place a system<br />
of inflatable dams installed at locations noted in Table 8-1 below.<br />
\\Gh-wash\ENG 1160\LTCP\LTCP Final\Sec 8.doc 8-8 FINAL - July 2002
Preliminary <strong>Control</strong> Program Alternatives<br />
Table 8-1<br />
Existing Inflatable Dams<br />
Structure<br />
Number<br />
<strong>Combined</strong> <strong>Sewer</strong> No. of<br />
Dams<br />
<strong>Control</strong> Method Storage<br />
Elevation<br />
Storage<br />
Volume<br />
(mg)<br />
14 2 upstream level 3.00 18.32<br />
15 B St./N.J Ave. Trunk <strong>Sewer</strong> 1 upstream level -1.00 Note 1<br />
15a<br />
1 upstream level -1.00 Note 1<br />
16 Tiber Creek Trunk <strong>Sewer</strong> 2 upstream level 4.00 9.07<br />
24 (west &<br />
2 Flow & upstream level 12.00<br />
middle dams) Northeast Boundary <strong>Sewer</strong><br />
7.61<br />
24 (east dam)<br />
1 Flow & upstream level 12.50<br />
34 Easby Point Trunk <strong>Sewer</strong> 1 upstream level 8.50 1.12<br />
35 East Rock Creek Diversion 1 upstream level 8.50 1.93<br />
<strong>Sewer</strong><br />
52 Slash Run Trunk <strong>Sewer</strong> 1 upstream level 30.00 0.18<br />
Total Existing RTC Storage Volume 36.30<br />
Notes: 1. This dam does not store any sewage. Instead, it deflates to allow overflow to enter a Relief <strong>Sewer</strong>.<br />
The feasibility of installing additional inflatable dam installations to store combined sewage was<br />
assessed. The following criteria were used to consider several large sewers within the CSS:<br />
<br />
<br />
<br />
The diameter or width of the sewer needed to be at least six feet. <strong>Sewer</strong>s less than this size<br />
have very little storage volume compared to large diameter sewers.<br />
The slope of the sewer needed to be low enough to allow a sufficient storage volume.<br />
The elevations of upstream lateral connections were examined to avoid possible basement<br />
flooding problems.<br />
The proposed modifications to the existing system that were simulated in the model for each of the<br />
three receiving waters are described below and are also shown on Figure 8-3. Local dynamic controls<br />
were simulated to deflate dams to prevent flooding and maintain a hydraulic stability in the CSS.<br />
<strong>System</strong> wide dynamic controls for the modifications were utilized at key locations in the CSS to<br />
maximize control objectives such as transferring overflows from the Anacostia system to Potomac<br />
River where greater dilution is available for pollutant loads.<br />
For the Anacostia River:<br />
Existing dams 24-1 and 24-2 in the west and middle conduits of the triple span of the NEBTS<br />
in the vicinity of the Swirl Facility were removed and replaced with new dams 24-5 and 24-6,<br />
which were placed further downstream. This was done to increase the storage volume in the<br />
\\Gh-wash\ENG 1160\LTCP\LTCP Final\Sec 8.doc 8-9 FINAL - July 2002
Preliminary <strong>Control</strong> Program Alternatives<br />
<br />
<br />
<br />
triple span of the NEBTS. These new dams would be installed in an isolated area of National<br />
Park Service property close to the Anacostia shoreline.<br />
Dam 24-4 was added to the east conduit of the triple span of the NEBTS in the vicinity of the<br />
Swirl Facility to allow upstream storage before flow needed to be diverted to the Swirl<br />
Facility. This new dam would be installed within the NEBTS, between the existing Swirl<br />
Facility and D.C. General Hospital.<br />
Dam 100 was added for additional storage in the 20’ diameter span of the NEBTS near<br />
Florida St and H St NE, a residential area.<br />
The Main, “O” Street, Poplar Point, and Eastside pump stations were run at full capacity to<br />
force overflows to occur at CSO 003 (Bolling) to the Potomac River where greater dilution is<br />
available rather than at local Anacostia waters where feasible.<br />
For Rock Creek:<br />
An additional inflatable dam (Dam 105), installed on the Piney Branch Trunk <strong>Sewer</strong> on<br />
National Park Service property near 16th/Arkansas St NW, was simulated in the model.<br />
For the Potomac River:<br />
The wet well elevations at BPWWTP raw wastewater pump stations #1 and #2 were<br />
maintained at +4.0 to maximize storage of combined sewage in the Outfall <strong>Sewer</strong>s. The<br />
Potomac Pump Station was run at full capacity to force overflows to occur at CSO 003<br />
(Bolling) to the Potomac River where greater dilution is available rather than at local<br />
Potomac waters where feasible.<br />
The Upper Potomac Interceptor was rehabilitated, south of Georgetown University, where it<br />
is currently diverted to the Upper Potomac Interceptor and Relief <strong>Sewer</strong> for a short section<br />
due to a section of collapsed pipe.<br />
Dam 102 was installed in the Upper Piggy Back portion of the Upper Potomac Interceptor,<br />
just south of the Rock Creek Pump Station, near the intersections of 27th and K Streets NW.<br />
Dam 103 was installed in the Lower Piggy Back portion of Upper Potomac Interceptor and<br />
Relief <strong>Sewer</strong>.<br />
Dam 104 was installed in the West Rock Creek Diversion <strong>Sewer</strong>, east of the intersection of<br />
the C&O Canal and 29th St NW.<br />
8.3.3 Inflow <strong>Control</strong> (Alternative D10)<br />
Inflow control alternatives reduce the amount of combined sewage volume by decreasing or<br />
regulating the amount of storm water and groundwater that enters the combined sewer system. Three<br />
major inflow control alternatives, as shown in Figure 8-4, were identified and incorporated into the<br />
computer model:<br />
\\Gh-wash\ENG 1160\LTCP\LTCP Final\Sec 8.doc 8-11 FINAL - July 2002
Preliminary <strong>Control</strong> Program Alternatives<br />
<br />
Groundwater diversion: At many locations in the District, groundwater that infiltrates<br />
into the underground portions of large buildings is pumped to the combined sewer<br />
system. This groundwater could be diverted to a storm sewer. In a previous study (Peer<br />
Consultants 1999), several potential groundwater diversion projects were identified,<br />
mostly concentrating on Metro subway stations. The proposed projects, estimated<br />
diverted groundwater flows, and their corresponding drainage areas are listed in Table 8-<br />
2. For modeling purposes, the dry weather flows in the corresponding drainage areas<br />
were reduced by the amount of estimated diverted groundwater flows.<br />
Table 8 -2<br />
Groundwater Diversion Projects<br />
No.<br />
Project Description<br />
Flow<br />
Estimate<br />
(gpd) Drainage Area Location<br />
1 Metro Primary Network 223,500 Tiber Creek 7th/G St NW<br />
2 Metro Primary Network 223,500 B Street/New Jersey 14th/Constitution Ave NW<br />
3 Federal Triangle Project 1,800,000 B Street/New Jersey 12th/Constitution Ave NW<br />
4 Archives Metro Project 72,000 B Street/New Jersey 7th/Independence Ave SW<br />
5 Federal Center Metro Project 122,000 B Street/New Jersey 2nd/D St SW<br />
6 Federal Triangle Metro Project 72,000 B Street/New Jersey 12th/Constitution Ave NW<br />
Subtotal 2,289,500<br />
7 Brookland/CUA Metro Project 173,000 Northeast Boundary 8th/Irving St NE<br />
8 Stadium Armory #1 Metro Project 72,000 Northeast Boundary 19th/C St SE<br />
Subtotal 245,000<br />
9 Dupont Circle Metro Project 173,000 Slash Run Connecticut/O St NW<br />
10 Secondary Metro Project 5,514,000 Slash Run 15th/K St NW<br />
11 GW University Project 173,000 Slash Run 21st/Pennsylvania Ave NW<br />
Subtotal 5,860,000<br />
Grand Total 8,618,000<br />
<br />
Daylighting “orphan” storm sewers: The aforementioned study (Peer Consultants 1999) also<br />
identified many “orphan” storm sewers, that is, storm sewers that ultimately discharge into a<br />
combined sewer, rather than a receiving water. Several of these orphan storm sewers were<br />
selected for inclusion into projects to divert them to a nearby receiving water. Such projects<br />
would effectively separate parts of a combined sewer area and convert them to separate storm<br />
water areas. This alternative would require substantial excavation in the downtown area.<br />
Selected orphan storm sewers were grouped into sixteen distinct project groups, based on<br />
their geographical relationships. The project groups, and the acres of combined sewer area<br />
converted to separate storm area, are summarized in Table 8-3.<br />
\\Gh-wash\ENG 1160\LTCP\LTCP Final\Sec 8.doc 8-13 FINAL - July 2002
Preliminary <strong>Control</strong> Program Alternatives<br />
Table 8-3<br />
Orphan Storm <strong>Sewer</strong> Separation Project Summary<br />
Total Acreage<br />
Offloaded from<br />
Group CSO Drainage Total Pipe<br />
CSO Area<br />
(becomes<br />
New Storm<br />
<strong>Sewer</strong>’s Receiving<br />
No. Area length (ft) SSWS Area) Project Location <strong>Water</strong><br />
Discharge Location<br />
1 NEB 800 5.87 17th/Potomac SE Anacostia Near CSO 018<br />
2 CSO 046 660 3.8 18th/Park Road NW Rock Creek Near CSO 046<br />
3 Easby Point 1400 6.68<br />
14th/Pennsylvania<br />
NW Potomac Tidal Basin<br />
4 NEB 400 5.5 12/th/Monroe NE Anacostia<br />
Storm sewer at District Line at<br />
Eastern/22nd NE<br />
5 Piney Branch 5680 42.3 3rd/Aspen NW Rock Creek Near CSO 059<br />
6 Piney Branch 4100 30.8 13th/Decatur NW Rock Creek<br />
Into Rock Creek, 3000' north of<br />
CSO 046<br />
7 Easby Point 4100 43 21st/C St NW Potomac Near CSO 020<br />
8 Slash Run 4300 39.7 25th/Eye St NW Potomac Near CSO 021<br />
9 Fort Stanton 1236 18.4<br />
Martin Luther King<br />
Ave and Morris Rd<br />
SE<br />
Anacostia<br />
Suitland Pkwy storm sewer<br />
(near CSO 005)<br />
10 Fort Stanton 3372 53.36 16th/Galen St SE Anacostia<br />
Existing storm sewer at 16th/W St<br />
SE (near CSO 007)<br />
11 Fort Stanton 2500 6.9 13th/T St SE Anacostia Near CSO 007<br />
12 Fort Stanton 1200 6.44<br />
W. of Morris Rd/RR<br />
tracks Anacostia Near CSO 007<br />
13 NEB 7200 38.53<br />
6th/Brentwood Pkwy<br />
NE Potomac Tidal Basin<br />
13 Tiber Creek 8700 68.87<br />
N. Capitol and E St<br />
NE Potomac Tidal Basin<br />
13 B St/NJ Ave 7900 34.19<br />
6th/Constitution Ave<br />
NW Potomac Tidal Basin<br />
14 NEB 2976 64.4 Downing/13th NE Anacostia<br />
Hickey Run Storm <strong>Sewer</strong> (into<br />
Anacostia 3000' north of Benning<br />
Road Bridge)<br />
15 CSO 029 3662 28.3<br />
37th/Whitehaven St<br />
NW<br />
Potomac<br />
Foundry Branch Trunk <strong>Sewer</strong><br />
(near CSO 029)<br />
16 Easby Point 1100 4.61<br />
12th/Pennsylvania<br />
NW Potomac Tidal Basin<br />
TOTALS 61,286 501.65<br />
<br />
U.S. Soldier’s and Airman’s Home: The U.S. Soldier’s Home is an approximately 351 acre<br />
site located in the Northeast Boundary drainage area. While a portion of the site is separated,<br />
some of the storm sewers discharge to the combined sewer system because there are no other<br />
outlets available. Consideration has been given reducing CSO overflows by detaining or<br />
otherwise offloading this storm water from the combined sewer system. In addition to<br />
conducting several site visits, detailed sewer and topographic maps were obtained from the<br />
U.S. Soldier’s Home. Analysis of the sewer plans indicated that combined sewers serve<br />
approximately 83 acres or 24% of the site. Offloading of this drainage area would require<br />
conventional separation, which is considered as part of another alternative. <strong>Plan</strong>s indicated<br />
that the remainder of the site was separated. Existing storm water holding ponds were<br />
\\Gh-wash\ENG 1160\LTCP\LTCP Final\Sec 8.doc 8-14 FINAL - July 2002
Preliminary <strong>Control</strong> Program Alternatives<br />
observed on the site. These detention ponds serve approximately 102 acres or 29% of the<br />
site. Additional detention ponds for this drainage area would not serve a benefical purpose to<br />
CSO control. The plans indicate that the remaining 166 acres or 47% of the site is separated.<br />
To address this acreage, two storm water detention basins were incorporated in the model to<br />
offload flows from the 166 acres. Key design parameters for these two theoretical basins<br />
are shown below in Table 8-4. The basins would both offload storm water volume and<br />
would dampen the peak flow rates once the basin capacity was exceeded.<br />
Table 8-4<br />
U.S. Soldier’s and Airman’s Home Project Summary<br />
Parameter Basin #1 Basin #2<br />
Drainage Area 53 ac 113 ac<br />
Location See Figure 8-4<br />
Design Storm 2 year – 24 hour storm = 3.5”<br />
Design Criteria<br />
Limit basin outflow rate to 10% of existing condition<br />
Basin Volume 1.59 mg 2.7 mg<br />
8.3.4 Low Impact Development -Retrofit (Alternative D11)<br />
The objective of this alternative is to reduce the frequency and volume of CSOs by applying LID-R<br />
techniques within the District. These techniques would reduce the volume of storm water runoff and<br />
improve its water quality. The entire District area was considered for the application of LID-R since<br />
reduction of storm water pollution can improve the quality of the receiving waters. Aerial<br />
photographs of representative land uses in the District were reviewed to determine which<br />
technologies might be applicable, and the degree to which they could practically be applied. The<br />
actual LID-R technologies that were applied depended on the nature of the area. For example, in<br />
commercial settings, rooftop greening is an example of a technology that was found to be applicable.<br />
In residential settings, rain barrels and bioretention are examples of applicable technologies. The<br />
mix of LID-R technologies included the following: rain barrels, rooftop greening, bioretention,<br />
drywells, filter strips, grass swales, porous pavement, and sand filters. For this alternative, the<br />
achievable application rate for LID-R was estimated at 15% of the total District impervious area or<br />
1,963 acres. The quantity of water, which could be offloaded was calculated as a function of the<br />
impervious acreage for each land use type. The calculation was made for the entire District, not just<br />
the combined sewer area. It was assumed that LID-R technologies would capture up to the first 0.5”<br />
of rainfall. Once this limit was exceeded, runoff was assumed to discharge normally. Table 8-5<br />
summarizes the results.<br />
In addition as a part of the LID-R analysis, rooftop greening was applied to approximately 200 roof<br />
acres based on the application rates shown in Table 8-6.<br />
\\Gh-wash\ENG 1160\LTCP\LTCP Final\Sec 8.doc 8-15 FINAL - July 2002
Preliminary <strong>Control</strong> Program Alternatives<br />
In addition to offloading storm water, some LID-R technologies can remove pollutants. To account<br />
for this, the pollutant concentration in storm water was reduced. Literature values of pollutant<br />
removal efficiencies were used in combination with the overall percent of impervious acres treated.<br />
Table 8-5<br />
Areas Treated by LID-R<br />
% of Impervious<br />
Acres Treated @<br />
0.5” of Rain Based<br />
on Analysis Areas<br />
Total Land<br />
Area in<br />
District (ac)<br />
Impervious<br />
Area in<br />
District (ac)<br />
Impervious Area<br />
Treated at 0.5”of<br />
rain (ac)<br />
Land Use<br />
Institutional 33% 2,762 498 163<br />
Federal 23% 2,755 333 77<br />
Commercial 9% 1,666 1,072 99<br />
Residential 13% 19,081 8,845 1,143<br />
Industrial 22% 1,235 927 201<br />
Mixed Use 19% 2,012 869 169<br />
Parks 13% 9,864 861 111<br />
<strong>Water</strong> - 4,542 - -<br />
Totals 43,917 13,405 1,963<br />
Overall % of impervious acres treated at 0.5” of rain 15%<br />
Notes<br />
Average of<br />
institutional ,<br />
federal and<br />
commercial<br />
Average of<br />
institutional ,<br />
federal and<br />
commercial<br />
Table 8-6<br />
Rooftop Greening Application Rates used for Low Impact Development – Retrofit<br />
District Land Use<br />
Total Roof Area<br />
(Acres) % Applied<br />
Rooftop Greening Roof<br />
Area (Acres)<br />
Institutional 778 5 38.9<br />
Federal 851 10 85.1<br />
Commercial 726 10 72.6<br />
Totals 2355 196.6<br />
8.3.5 Rooftop Greening (Alternative D12)<br />
For this alternative, an aggressive application of rooftop greening was analyzed for the benefits it<br />
could provide independent of other efforts. For this alternative, government, commercial and<br />
institutional buildings were selected for application. These types of buildings typically have lower<br />
pitched roofs increasing the ease of roof retrofit versus the steep pitched roofs of residential buildings<br />
and private houses. Of the 7,183 acres of land in the use categories selected, approximately one third<br />
\\Gh-wash\ENG 1160\LTCP\LTCP Final\Sec 8.doc 8-16 FINAL - July 2002
Preliminary <strong>Control</strong> Program Alternatives<br />
(33% or 2,355 acres) is roof area. The models were then run to with an application rate of 25% of the<br />
roof area or 589 acres to determine the benefits and impact to CSOs.<br />
8.3.6 Satellite Storage (Alternative D7)<br />
As shown in Figure 8-5, satellite storage facilities would be constructed to address CSO’s for each of<br />
the three receiving waters, as follows:<br />
For the CSO’s along the Anacostia River, this alternative would consist of the four major<br />
components as follows:<br />
<br />
The Bolling Air Force Base Storage Basin would be located underneath an athletic field on<br />
Bolling Air Force Base. It would have enough capacity to hold the combined sewage from<br />
all the CSO’s on the west side of the Anacostia (009, 010, 011, 011a, and 012 – 018). After a<br />
rain event, the combined sewage would be pumped via a new force main to the Outfall<br />
<strong>Sewer</strong>s that lead to BPWWTP. If the satellite storage option were also to be selected for<br />
CSO’s 020, 021, and 022 on the Potomac, this basin would need to be sized to hold the<br />
combined sewage from those CSO’s as well.<br />
<br />
The Main Pump Station would be augmented to receive and pump the overflows from CSO’s<br />
009, 010, 011, 011a, and 012 – 018 to the aforementioned Bolling AFB Storage Basin.<br />
<br />
The Fort Stanton Storage Basin would be located underneath Anacostia Park, on the east side<br />
of the Anacostia. It would receive the overflows from CSO’s 005, 006, and 007. After a rain<br />
event, an upgraded Poplar Point Pump Station would pump the combined sewage into the<br />
Anacostia Main Interceptor.<br />
<br />
The Northeast Boundary Storage Basin would be located underneath a parking lot on the<br />
south side of RFK Stadium. It would store the overflow from CSO 019. After a rain event,<br />
the combined sewage would be pumped by the existing East Side Pump Station into the 108”<br />
Anacostia River Force Main.<br />
\\Gh-wash\ENG 1160\LTCP\LTCP Final\Sec 8.doc 8-17 FINAL - July 2002
Preliminary <strong>Control</strong> Program Alternatives<br />
For the CSO’s along Rock Creek, this alternative would involve the construction of the Piney Branch<br />
Short Storage Tunnel underneath a ridge north of Piney Branch, on National Park Service property.<br />
It would store the overflow from CSO 049. After a rain event, the combined sewage would be<br />
conveyed by gravity into the 2.75’ x 4.125’ Piney Branch Interceptor.<br />
For the CSO’s along the Potomac River, this alternative would consist of two major components as<br />
described below:<br />
<br />
A new interceptor and pumping station adjacent to the existing Potomac Pump Station to<br />
convey the overflows from CSO’s 020, 021, and 022 via new force mains across the Potomac<br />
River to the Bolling AFB Storage Basin described earlier.<br />
<br />
The Georgetown Storage Basin would be located underneath a D.C. Department of Public<br />
Works parking lot between <strong>Water</strong> Street and the Potomac River, in Georgetown. It would<br />
store the overflow from CSO’s 023/024, 025, 026, 027, 028, and 029. After a rain event, a<br />
new pump station would pump the combined sewage into the 96” Upper Potomac Interceptor<br />
and Relief <strong>Sewer</strong>.<br />
8.3.7 Pump to Blue Plains and Store (Alternative D8)<br />
Pumping and storing involves the construction of new pumping stations and pipelines to collect<br />
CSOs at their outfalls and convey them to a centrally located storage facility. After the wet weather<br />
event, the stored combined sewage would be released to the BPWWTP. The ideal location for the<br />
storage facility would be Blue Plains WWTP, but there is not enough space. Based on an analysis of<br />
the area surrounding Blue Plains, the storage facility could potentially be located at the <strong>DC</strong> impound<br />
lot just east of Blue Plains WWTP, as shown in Figure 8-6.<br />
This alternative requires major construction throughout the District, especially along local<br />
waterways. Underground pipelines would be placed along the Potomac River from Georgetown to<br />
East Potomac Park, along Rock Creek south of Pennsylvania Avenue and along both sides of the<br />
Anacostia from the NEB Swirl Facility to Main Pump Station. Five new pumping stations would be<br />
constructed adjacent to East Side, Main, ‘O’ Street, Poplar Point and Potomac Pump Stations. In<br />
addition, several large pipelines would be required along the B&O Railroad track route from Poplar<br />
Point Pump Station to the <strong>DC</strong> impound lot.<br />
\\Gh-wash\ENG 1160\LTCP\LTCP Final\Sec 8.doc 8-19 FINAL - July 2002
Preliminary <strong>Control</strong> Program Alternatives<br />
8.3.8 Pump to Blue Plains and Treat (Alternative D9)<br />
Pumping and treating involves the construction new pumping stations and pipelines to collect CSOs<br />
at their outfalls and convey them to a centrally located high rate treatment facility. There would be<br />
no storage of the combined sewage to shave the peak flows. The ideal location for the high rate<br />
treatment facility would be Blue Plains WWTP, but, as in the case of Alternative D8, there is not<br />
enough space. The high rate treatment facility could also potentially be located at the <strong>DC</strong> impound<br />
lot just east of Blue Plains WWTP, as shown in Figure 8-7.<br />
As in the case of Alternative D8, this alternative requires major construction throughout the District,<br />
especially along local waterways. Underground pipelines would be placed along the Potomac River<br />
from Georgetown to East Potomac Park, along Rock Creek south of Pennsylvania Avenue and along<br />
both sides of the Anacostia from the NEB Swirl Facility to Main Pump Station. Five new pumping<br />
stations would be constructed adjacent to East Side, Main, ‘O’ Street, Poplar Point and Potomac<br />
Pump Stations. In addition, several large pipelines would be required along the B&O Railroad track<br />
route from Poplar Point Pump Station to the <strong>DC</strong> impound lot. This alternative would significantly<br />
increase the operation and maintenance requirements of the CSS.<br />
8.3.9 Local Tunnels<br />
Various tunnel configurations were considered to store and convey combined sewer flows from the<br />
Anacostia drainage area, as listed in Table 8-7 below.<br />
Table 8-7<br />
Anacostia River Tunnel Alternatives<br />
Name No. Description<br />
D27-1 Retain Main and ‘O Pumping Stations at Present Location<br />
D27-2 Add Low Impact Redevelopment<br />
Tunnel From Poplar Point to<br />
D27-3 Add Real Time <strong>Control</strong><br />
Northeast Boundary<br />
D27-4 Add Low Impact Development and Real Time <strong>Control</strong><br />
D28 Relocate Main and ‘O’ Pumping Stations to Poplar Point<br />
D29-1 Retain Main and ‘O’ Pumping Stations at Present Location<br />
D29-2 Add Low Impact Redevelopment<br />
Tunnel from Blue Plains to D29-3 Add Real Time <strong>Control</strong><br />
Northeast Boundary D29-4 Add Low Impact Development and Real Time <strong>Control</strong><br />
D30 Relocate Main and ‘O’ Pumping Stations to Poplar Point and<br />
BPWWTP<br />
\\Gh-wash\ENG 1160\LTCP\LTCP Final\Sec 8.doc 8-21 FINAL - July 2002
Preliminary <strong>Control</strong> Program Alternatives<br />
For the Potomac River CSOs the following tunnel configuration sized to meet the 2 to 12 overflows<br />
per year range was evaluated.<br />
<br />
Storage Tunnel from Georgetown to Potomac Pumping Station<br />
This consists of a rehabilitating the Potomac Pumping Station to a firm capacity of 460 mgd<br />
and constructing a CSO storage tunnel. The tunnel would begin at CSO 029 west of the Key<br />
Bridge, run parallel to Georgetown, and terminate in Potomac Pumping Station. The low<br />
point of the tunnel would be at the existing Potomac Pumping Station. A new tunnel<br />
dewatering pump station would be construct at Potomac Pump Station to dewater the tunnel<br />
for conveyance of flows by the existing station to Blue Plains WWTP.<br />
For Rock Creek CSOs, the Piney Branch Tunnel would be constructed in conjunction with ancillary<br />
projects to modify several regulators.<br />
8.3.10 <strong>Sewer</strong> Separation (Alternative A1)<br />
For this alternative, the benefits of complete separation of the combined sewer system were<br />
evaluated. The alternative was evaluated on the premise that a new separate sanitary system would<br />
be constructed and the existing combined sewer system piping convert to a separate storm water<br />
system discharging to the receiving water. District dry weather flows with a peaking factor of 1.25<br />
for wet weather were modeled as being routed to BPWWTP for treatment. All storm water runoff<br />
was routed directly to the receiving waters. Storm water discharges were model using pollutant event<br />
mean concentrations as determined as part of the monitoring program discussed in Section 4. Issues<br />
associated with this alternative are as follows:<br />
<br />
Disruption – Separation essentially involves constructing a duplicate sewer system for the<br />
central one third of the District. <strong>Sewer</strong> construction would be necessary in every<br />
neighborhood and in the vast majority of streets in each neighborhood. Disruption associated<br />
with construction would be significant, widespread, and long lasting. While the installation<br />
of fiber optic cable in portions of the District require a relatively shallow and narrow trench,<br />
the installation of a separate sewer system would generally require closing of streets during<br />
construction. Construction might last 15 to 20 years or more. In addition to the nuisance, the<br />
degree of disruption associated with separation could have a significant negative impact on<br />
the economic well being of the District.<br />
<br />
Impacts to Private Property – the majority of buildings in the combined sewer area have roof<br />
drains and gutters discharging to the building sanitary system, which in turn discharges to the<br />
combined sewer system. Separation on private property would thus be required. Past<br />
separation experience in the District and in other cities has shown that obtaining access and<br />
permission from private property owners can be difficult, time consuming, and, in some<br />
\\Gh-wash\ENG 1160\LTCP\LTCP Final\Sec 8.doc 8-23 FINAL - July 2002
Preliminary <strong>Control</strong> Program Alternatives<br />
cases, not achievable. In addition, many row houses in the District do not have alleys along<br />
the back of the house to route the roof and backyard drainage to separate storm sewers. This<br />
could necessitate extremely expensive and disruptive construction on private property to<br />
achieve true separation.<br />
<br />
Technical Difficulty – Other cities have discovered some separation projects to be much<br />
more difficult to construct that originally anticipated. In some cases, the efforts to separate<br />
sewer systems have been abandoned. Part of the reason for this is that there are many<br />
unknowns involved in working with sewer systems which have been constructed over a long<br />
period of time. Records showing the location and nature of existing facilities may not exist.<br />
Costs and difficulties of construction can be much greater than originally anticipated<br />
depending on what is actually discovered. Public opposition to such a program may increase<br />
as actual construction proceeds.<br />
<br />
Impact on Receiving <strong>Water</strong> Quality – the analyses conducted as part of the LTCP indicate<br />
that separation does not provide as good water quality as a high degree of CSO control.<br />
Appendices B, C and D and Section 9 of this report present the predicted water quality.<br />
Table 8-8 summarizes the loads to the receiving waters for varying degrees of CSO control as<br />
compared to separation. In most cases, a high degree of CSO controls results in less pollutant<br />
load to the receiving waters when compared to separation. For fecal coliforms, separation is<br />
some cases results in less overall load to the receiving waters. This is true for the Potomac<br />
River at 4, 8 and 12 events per year. While there may be less load on an annual basis, the<br />
modeling indicated that this did not translate into better water quality. This is because the<br />
separate storm water system delivers pollutants to the receiving waters practically every time<br />
it rains, thereby adversely impacting water quality a great many times per year. With a high<br />
degree of CSO control, the loads is only delivered to the receiving water between 2 and 12<br />
times per year (depending on the degree of control selected). Even though the overall load<br />
may be somewhat higher, CSO discharges have a more limited impact because they are<br />
occurring far less frequently than storm water discharges which occur more than 70 times per<br />
average year.<br />
\\Gh-wash\ENG 1160\LTCP\LTCP Final\Sec 8.doc 8-24 FINAL - July 2002
Preliminary <strong>Control</strong> Program Alternatives<br />
Table 8-8<br />
Load Comparison: Separation vs. CSO <strong>Control</strong><br />
CSO<br />
Storm<br />
<strong>Water</strong><br />
Anacostia. Rock Creek Potomac<br />
Total<br />
CSO<br />
Storm<br />
<strong>Water</strong><br />
Upstream<br />
Upstream<br />
Total CSO Storm<br />
<strong>Water</strong><br />
Up-stream<br />
and WWTP<br />
Parameter<br />
Annual Volume<br />
(mg/yr)<br />
No Phase 1 <strong>Control</strong>s 2142 52,024 49 17,961 1063 2,369,262 2,648,297<br />
Phase 1 <strong>Control</strong>s 1485 51,367 52 17,964 953 2,369,262 2,648,187<br />
Pump Sta. Rehab. 1,282 51,164 49 17,961 639 2,369,262 2,647,873<br />
12 Overflows/yr 515 50,397 28 17,940 157 2,369,262 2,647,391<br />
8 Overflows/yr 262<br />
5,348 44,534<br />
50,144 22<br />
1,534 16,378<br />
17,934 96<br />
7,972<br />
2,369,262 2,647,330<br />
4 Overflows/yr 96 49,978 11 17,923 54 2,369,262 2,647,288<br />
2 Overflows/yr 32 49,914 9 17,921 22 2,369,262 2,647,256<br />
0 Overflows/yr 2 0<br />
49,882 0<br />
17,912 0<br />
2,369,262 2,647,234<br />
Complete Separation 0 9,667 44,534 54,201 0 3,885 16,378 20,263 0 8,939 2,369,262 2,648,201<br />
CBOD 5 (lb/yr x 1000)<br />
No Phase 1 <strong>Control</strong>s 755 3,507 42 697 335 72,063 74,107<br />
Phase 1 <strong>Control</strong>s 526 3,278 45 700 301 72,307 74,317<br />
Pump Sta. Rehab. 443 3,195 42 697 214 72,506 74,429<br />
12 Overflows/yr 174 2,926 29 684 47 72,126 73,882<br />
815 1937<br />
236 419<br />
1,709<br />
8 Overflows/yr 89 2,841 27 682 28 72,129 73,866<br />
4 Overflows/yr 32 2,784 24 679 16 72,136 73,861<br />
2 Overflows/yr 10 2,762 23 678 6 72,137 73,852<br />
0 Overflows/yr 2 0<br />
2,752 0<br />
655 0<br />
71,914 73.623<br />
Complete Separation 0 1,499 1937 3,436 0 608 419 1,027 0 1,862 71,401 73,263<br />
Fecal Coliforms (#/yr<br />
x 10 14 )<br />
No Phase 1 <strong>Control</strong>s 764 925 18 44 381 324 790<br />
Phase 1 <strong>Control</strong>s 322 483 19 45 341 337 763<br />
Pump Sta. Rehab. 254 415 18 44 237 348 670<br />
12 Overflows/yr 183 344 11 37 56 331 472<br />
57 104<br />
16 10<br />
85<br />
8 Overflows/yr 93 254 9 35 34 330 449<br />
4 Overflows/yr 34 195 5.5 32 19 331 435<br />
2 Overflows/yr 10 171 4.5 31 7 331 423<br />
0 Overflows/yr 2 0<br />
161 0<br />
26 0<br />
317 402<br />
Complete Separation 0 103 104 207 0 41 10 51 11 106 292 399<br />
Total<br />
8.4 EVALUATION OF PRELIMINARY CONTROL PLANS<br />
8.4.1 Evaluation Factors<br />
The following evaluation factors were considered as part of the preliminary alternatives evaluation<br />
and selection of final control plans for further evaluation.<br />
Regulatory Compliance<br />
Preliminary alternatives were evaluated on their ability to conform to CSO Policy requirements and<br />
to achieve CBOD5 load reductions required to meet the BOD TMDL for the Anacostia River.<br />
Preliminary control plans selected for further evaluation are analyzed for their ability to help achieve<br />
water quality standards in Section 9.<br />
\\Gh-wash\ENG 1160\LTCP\LTCP Final\Sec 8.doc 8-25 FINAL - July 2002
Preliminary <strong>Control</strong> Program Alternatives<br />
<br />
CSO Policy – Preliminary alternatives were evaluated on their ability to perform below the<br />
maximum of 12 overflows per year as stipulated in Section II. 4. C. Evaluation of<br />
Alternatives of the CSO Policy.<br />
<br />
D.C. TMDL for BOD for Anacostia River – Preliminary alternatives were assessed for their<br />
potential to meet BOD loads allocated to CSOs in the draft DOH BOD TMDL.<br />
Northeast Boundary Flooding<br />
The Northeast Boundary <strong>Sewer</strong> (NEB <strong>Sewer</strong>) is a combined sewer that begins on the west side of<br />
McMillian Reservoir and flows to the southeast primarily along Florida Avenue toward the<br />
Anacostia River. The sewer is approximately 23,000 feet long and varies in size and shape from<br />
about 4.5' x 3' in the upper reaches to over 22' x 18' in the lower reaches. The drainage area of the<br />
NEB <strong>Sewer</strong> is approximately 4,242 acres and comprises highly developed areas in the District.<br />
Numerous branch sewers convey wastewater and storm water to the NEB <strong>Sewer</strong>.<br />
Complaints of flooding have been reported along the NEB <strong>Sewer</strong> and its branch sewer system. As a<br />
result, several engineering studies have been conducted over the years in an attempt to address these<br />
flooding complaints. These studies have determined the following:<br />
<br />
<br />
<br />
<br />
The NEB <strong>Sewer</strong> and portions of its branch sewers have inadequate capacities to carry storm<br />
water flows generated by moderate rain storms.<br />
Surcharge of the trunk and branch sewer can occur during intense storms sufficient to cause<br />
overflow from catch basins and basement backups in certain areas.<br />
Certain collecting sewers that drain the area were of adequate capacity, but operated<br />
ineffectively due to backwater conditions in the NEB <strong>Sewer</strong>.<br />
Certain areas served by branch sewers were at a lower elevation than the crown of the NEB<br />
<strong>Sewer</strong> at the point of connection.<br />
In addition to general capacity issues associated with the NEB sewer, the following locations were<br />
identified as susceptible to local flooding:<br />
<br />
<br />
<br />
<br />
<br />
<br />
Area 1 - Rhode Island Avenue N.E. between 4 th and 6 th Streets<br />
Area 2 - West Virginia Avenue N.E. near Mt. Olivet Road<br />
Area 3 - P Street and 1 st Street N.W.<br />
Area 4 - Sherman Avenue and Harvard Street N.W.<br />
Area 5 - Constitution Avenue N.E., near Tennessee and 12 th Street<br />
Area 6 - Rhode Island Avenue N.W., near 6 th and R Street<br />
\\Gh-wash\ENG 1160\LTCP\LTCP Final\Sec 8.doc 8-26 FINAL - July 2002
Preliminary <strong>Control</strong> Program Alternatives<br />
Prior studies indicated that nuisance flooding in Areas 3 through 6 could be remedied by local<br />
drainage projects such as regrading and additional catch basins. Flooding in Areas 1 and 2 was<br />
determined to primarily be caused by inadequate capacity of the branch sewers serving the areas and<br />
could not be addressed with local remedial work.<br />
Given the long standing nature of the flooding problems and the fact that combined sewage is<br />
potential component of the flood waters, preliminary alternatives were evaluated on their ability to<br />
address flooding in the NEB sewer and local flood Areas 1 and 2.<br />
Implementability<br />
The preliminary alternatives were rated on implementability factors, which included whether<br />
acquisition of land was required, and, if so, how difficult it would be.<br />
The complexity of construction was also taken into consideration. If the preliminary alternative<br />
required land within a military facility or involved difficult construction in confined urban areas, it<br />
was considered less desirable to implement.<br />
Operational Complexity<br />
The degree of operational complexity for each system alternative included such factors as the<br />
complexity of the treatment technologies involved and the number of satellite facilities required.<br />
Ability to Upgrade<br />
Each system alternative was rated on how difficult it would be to upgrade the facilities planned.<br />
This consideration included the acreage of additional land available at the site for future expansion.<br />
Public Acceptance<br />
Public acceptance of the system alternatives was rated based on comments received to date. Also<br />
included in the consideration of public acceptance was the degree of treatment, the disruption of<br />
streets or private property whether there was a potential odor problem with CSO control facilities.<br />
8.4.2 Regulatory Compliance<br />
The ability to meet the range of overflows stipulated in the CSO Policy is shown graphically on<br />
Figure 8-8. The ability to conform to the CSO Policy and BOD TMDL Allocations for the Anacostia<br />
River is presented in Table 8-9.<br />
\\Gh-wash\ENG 1160\LTCP\LTCP Final\Sec 8.doc 8-27 FINAL - July 2002
District of Columbia <strong>Water</strong> and <strong>Sewer</strong> Authority<br />
<strong>Combined</strong> <strong>Sewer</strong> <strong>System</strong> <strong>Long</strong> <strong>Term</strong> <strong>Control</strong> <strong>Plan</strong><br />
Figure 8-8<br />
Number of Events and Overflow Volumes per year<br />
Anacostia River<br />
80<br />
2500<br />
70<br />
# of Anacostia Overflow Events<br />
# of Overflow Events/Average Year<br />
60<br />
50<br />
40<br />
30<br />
20<br />
10<br />
Anacostia Overflow Volume (mg)<br />
2000<br />
1500<br />
1000<br />
500<br />
Overflow Volume (mg)<br />
0<br />
B1 - No Phase I<br />
<strong>Control</strong>s<br />
C2 Phase I<br />
Contrls<br />
C3 - Phase I<br />
<strong>Control</strong>s + P.S.<br />
Rehab.<br />
D4 - RTC<br />
D10 - Inflow<br />
<strong>Control</strong><br />
D11 - LID<br />
D12 - Rooftop<br />
Greening<br />
2 overflows/yr 4 overflows/yr 8 overflows/yr 12 overflows/yr A1 - Separation<br />
0<br />
Alternative<br />
80<br />
Potomac River<br />
1400<br />
# of Overflow Events/Average Year<br />
70<br />
60<br />
50<br />
40<br />
30<br />
20<br />
10<br />
# of Potomac Overflow Events<br />
Potomac Overflow Volume (mg)<br />
1200<br />
1000<br />
800<br />
600<br />
400<br />
200<br />
Overflow Volume (mg)<br />
0<br />
B1 - No Phase<br />
I <strong>Control</strong>s<br />
C2 Phase I<br />
Contrls<br />
C3 - Phase I<br />
<strong>Control</strong>s + P.S.<br />
Rehab.<br />
D4 - RTC<br />
D10 - Inflow<br />
<strong>Control</strong><br />
D11 - LID<br />
D12 - Rooftop<br />
Greening<br />
2 overflows/yr 4 overflows/yr 8 overflows/yr 12 overflows/yrA1 - Separation<br />
0<br />
Alternative<br />
Rock Creek<br />
80<br />
1400<br />
# of Overflow Events/Average Year<br />
70<br />
60<br />
50<br />
40<br />
30<br />
20<br />
10<br />
# of Rock Creek Overflow Events<br />
Rock Creek Overflow Volume (mg)<br />
1200<br />
1000<br />
800<br />
600<br />
400<br />
200<br />
Overflow Volume (mg)<br />
0<br />
B1 - No Phase<br />
I <strong>Control</strong>s<br />
C2 Phase I<br />
Contrls<br />
C3 - Phase I<br />
<strong>Control</strong>s +<br />
P.S. Rehab.<br />
D4 - RTC<br />
D10 - Inflow<br />
<strong>Control</strong><br />
D11 - LID<br />
D12 - Rooftop 2 overflows/yr 4 overflows/yr 8 overflows/yr 12<br />
Greening<br />
overflows/yr<br />
A1 -<br />
Separation<br />
0<br />
Alternative<br />
\\Gh-wash\ENG 1160\LTCP\LTCP Final\[LTCP_8_Events.xls]Report Fig<br />
8-28
Preliminary <strong>Control</strong> Program Alternatives<br />
Table 8-9<br />
Performance of Preliminary CSO <strong>Control</strong> Alternatives<br />
Average Year 1988-1990<br />
No.<br />
Preliminary<br />
<strong>Control</strong><br />
Alternative<br />
# Events<br />
Anacostia<br />
River<br />
Volume<br />
(mg)<br />
CSO Overflow<br />
Potomac River (1) Rock Creek Total<br />
# Events<br />
Volume<br />
(mg)<br />
# Events<br />
Volume<br />
(mg)<br />
Volume<br />
(mg)<br />
Annual<br />
lbs of<br />
CBOD5<br />
to<br />
Anacostia<br />
Meets<br />
Annual<br />
Anacositia<br />
BOD<br />
TMDL<br />
Allocation<br />
(overall)<br />
B1<br />
No Phase I<br />
<strong>Control</strong>s<br />
75 2,142 74 1,063 30 49 3,254 754,965 No<br />
C2 Phase I <strong>Control</strong>s 75 1,485 74 953 30 52 2,490 526,050 No<br />
C3 P.S. Rehab. 75 1,282 74 639 30 49 1969 442,985 No<br />
D4<br />
D10<br />
D11<br />
P.S. Rehab. &<br />
Real Time<br />
<strong>Control</strong><br />
P.S. Rehab &<br />
Inflow <strong>Control</strong><br />
P.S. Rehab &<br />
Low Impact<br />
Development<br />
D12 P.S. Rehab &<br />
Rooftop<br />
Greening<br />
D7- Satellite Storage<br />
D8 - Pump to Blue Plains<br />
and Store<br />
D9 – Pump to Blue Plains<br />
and Treat<br />
D27, D28 - Tunnel From<br />
Poplar Point to Main and ‘O’<br />
St. Pumping Stations<br />
D29, D30- Tunnel from Blue<br />
Plains to Main and ‘O’ St.<br />
Pumping Stations<br />
A1<br />
<strong>Sewer</strong><br />
Separation<br />
75 858 74 586 30 49 1493 308,796 No<br />
70 1,111 74 607 30 46 1764 380,504 No<br />
73 1090 72 543 30 41 1674 419,391 No<br />
75 1218 71 607 30 47 1871 No<br />
2 32 2 22 2 9 63 10,253 Yes<br />
4 96 4 54 4 11 161 33,135 Yes<br />
8 262 8 96 8 22 380 89,097 Yes<br />
12 515 12 157 12 28 700 173,504 No<br />
0 0 0 0 0 0 0 (2) Yes<br />
(3)<br />
Notes:<br />
1. Excludes discharges from Blue Plains Outfalls 001 and 002, which discharge treated flow and are not CSOs.<br />
2. CBOD5 load from increased storm water discharges due to CSO Separation would be about 684,000 lbs/yr.<br />
3. Technically CSO would meet its allocation, since CSO discharges would be eliminated. However, the increased<br />
storm water loads due to separation of the combined sewer system would exceed the allocated load.<br />
\\Gh-wash\ENG 1160\LTCP\LTCP Final\Sec 8.doc 8-29 FINAL - July 2002
Preliminary <strong>Control</strong> Program Alternatives<br />
8.4.3 Selection of Final Alternatives<br />
The evaluation of the preliminary control plans is summarized in Table 8-10. Based on this<br />
evaluation, the preliminary alternatives selected for further analysis in Section 9 are as follows:<br />
Tunnel <strong>System</strong>s: These alternatives can provide storage capacity to the levels required by the CSO<br />
Policy with little disruption to surface facilities and does not impact the use of land above the tunnel.<br />
In addition, DOH’s draft BOD TMDL for the Anacostia River can also be achieved. Though satellite<br />
storage is also capable of providing a similar capacity, satellite facilities limit the uses of the surface<br />
and therefore obtaining sitting approval from land owners was expected to be quite difficult.<br />
Pumps Station Rehabilitation, Real Time <strong>Control</strong>, and LID-R with Rooftop Greening: Though these<br />
alternatives cannot provide the needed level of control independently, they will be evaluated further<br />
for benefits as a component of the LTCP in conjunction with the various tunnel configurations.<br />
<strong>Sewer</strong> Separation: This is the one alternative that will eliminate all CSO overflows and therefore will<br />
be considered in more depth.<br />
\\Gh-wash\ENG 1160\LTCP\LTCP Final\Sec 8.doc 8-30 FINAL - July 2002
Preliminary <strong>Control</strong> Program Alternatives<br />
Table 8-10<br />
Comparison of Preliminary <strong>Control</strong> <strong>Plan</strong> Alternatives<br />
No.<br />
B1<br />
Preliminary<br />
<strong>Control</strong><br />
Alternative<br />
No Phase I<br />
<strong>Control</strong>s<br />
CSO<br />
Policy<br />
D.C.<br />
<strong>Water</strong><br />
Quality<br />
Standards<br />
D.C.<br />
TMDL for<br />
BOD<br />
Potential to Meet Evaluation Factors<br />
Northeast<br />
Boundary<br />
Flooding<br />
Public<br />
Acceptance<br />
Implementable/<br />
Operational<br />
Factors<br />
Ability<br />
to<br />
Upgrade<br />
Retain as<br />
Final<br />
Alternative<br />
No No No No High Medium Medium No<br />
C2 Phase I <strong>Control</strong>s No No No No High Medium Medium No<br />
C3 Phase I <strong>Control</strong>s No No No No High Medium Medium Yes 2<br />
+ PS. Rehab.<br />
D4<br />
Real Time<br />
<strong>Control</strong><br />
No Low No No Medium Low Low Yes 2<br />
D10 Inflow <strong>Control</strong> No Low No No Low Low Low No<br />
D11 Low Impact No Low No Low High Medium Medium Yes 2<br />
Development 1<br />
D12<br />
Rooftop<br />
Greening<br />
Only<br />
No Low No Low Medium Medium Low No<br />
D7 Satellite Storage Yes High Yes High Low Low Low No<br />
D8<br />
D9<br />
Pump to Blue<br />
Plains and Store<br />
Pump to Blue<br />
Plains and Treat<br />
Yes High Yes No Low Low Medium No<br />
Yes High Yes No Low Low Medium No<br />
D27 Tunnel <strong>System</strong> –<br />
Retain Main and Yes High Yes High High Medium Medium Yes<br />
O St Pumping<br />
Stations<br />
D29 Tunnel <strong>System</strong> –<br />
Relocate Main Yes High Yes High High Medium Medium Yes<br />
and O Pumping<br />
Stations<br />
A1 <strong>Sewer</strong><br />
Yes No No High Low Low Low Yes<br />
Separation<br />
1. Includes some Roof Top Greening.<br />
2. Retained as an element to be used in conjunction with the Tunnel <strong>System</strong>s.<br />
\\Gh-wash\ENG 1160\LTCP\LTCP Final\Sec 8.doc 8-31 FINAL - July 2002
Selection of Draft LTCP<br />
Section 9<br />
Selection of Draft LTCP<br />
9.1 INTRODUCTION<br />
This section describes the detailed analysis used to select the Draft LTCP. The evaluation was<br />
conducted for each receiving water so that different levels and types of control could be considered<br />
for the Anacostia River, Potomac River and Rock Creek. At the completion of the alternatives<br />
evaluation, the selected alternatives for each receiving water were assembled into a comprehensive<br />
Draft LTCP entire combined sewer system. The Draft LTCP was issued in June 2001. Subsequent<br />
sections describe comments received on the plan, additional evaluations conducted and the section of<br />
the Final LTCP.<br />
9.2 EVALUATION APPROACH<br />
The current water quality standards for the District of Columbia do not address the transient nature of<br />
wet weather events. The standards also include a narrative component, which, among other items,<br />
require that discharges be “free of untreated sewage”. Given the current standards, no alternative<br />
short of complete separation can completely eliminate overflows (and thereby comply with current<br />
standards) during all conditions. However, the CSO Policy calls for an evaluation of controls<br />
necessary to reduce overflows to between zero and 12 events per average year. As a result, this<br />
section evaluates the effect on sizing, water quality and cost of alternative controls sized for between<br />
zero and 12 overflows per average year. The zero overflow per year option was evaluated in two<br />
ways. First, plans which would achieve zero overflows under all conditions (i.e. separation) were<br />
evaluated. Second, controls which would achieve zero overflows for all storms occurring in the 1988<br />
to 1990 analysis period were also developed. Note that plans which achieve zero overflows for all<br />
storms in the 1988-1990 analysis period would not prohibit overflows under all climate conditions.<br />
Individual storms or groupings of storms not represented in the three years could still cause<br />
overflows.<br />
The effect of CSO controls on the ability to meet water quality standards was evaluated by<br />
determining the impact of CSO control on bacteria and dissolved oxygen levels. For bacteria, both<br />
fecal coliform and e. coli were evaluated. The following summarizes the evaluation procedures:<br />
Bacteria<br />
Fecal Coliform – the existing water quality standards are written in terms of fecal coliform<br />
concentrations. The following parameters were evaluated:<br />
o Number of months exceeding Class A and Class B standards – the existing water<br />
quality standard is a 30 day geometric mean. The receiving water model produced a<br />
daily average fecal coliform concentration for each day in each month. Geometric<br />
means were calculated on a monthly basis using the daily values. The number of<br />
\\Gh-wash\ENG 1160\LTCP\LTCP Final\Sec 9.doc 9-1 FINAL - July 2002
Selection of Draft LTCP<br />
months exceeding the Class A standard of 200 organisms/100 ml and the Class B<br />
standard of 1,000 organisms/100 ml was tabulated.<br />
o Number of days predicted fecal coliform concentration exceeds 200/100 ml – there is<br />
no water quality standard limiting daily fecal coliform concentrations. However, wet<br />
weather conditions can produce elevated levels of fecal coliform during and after rain<br />
events. While these elevated levels of coliform may not have a significant effect on<br />
the 30 day geometric mean, they can affect the use of the water body. In order to<br />
assess the effect of this phenomenon, the number of days that the predicted<br />
concentration of fecal coliform would exceed 200/100 ml in the receiving waters was<br />
calculated. The value of 200/100 ml was selected to be consistent with the geometric<br />
mean. Note that a daily value of 200/100ml is much more conservative than a<br />
geometric mean of 200/100ml.<br />
o Number of days of CSO impact – Like the separate storm water system and the<br />
<strong>DC</strong>/Maryland boundary, CSO discharges can contribute to elevated fecal coliform<br />
concentrations during and immediately after rain events. In order to assess the effect<br />
of CSO controls on their own, other load sources were set to zero, and the number of<br />
days that CSOs would cause the fecal coliform concentration in the receiving water to<br />
exceed 200 was calculated. This is called the number of days of CSO impact and is a<br />
conservative way of estimating bacteriological CSO impacts.<br />
<br />
E. Coli – while there is no current water quality standard for e. coli, EPA has recommended<br />
that states move from a fecal coliform standard to an e. coli standard (EPA, 1986). E. coli<br />
was thus evaluated in the event this occurs in the District. The following parameters were<br />
evaluated:<br />
o Number of months exceeding geometric mean of 126/100 ml – EPA has<br />
recommended an e. coli geometric mean of equal to or less than 126/100 ml for Class<br />
A waters. As with fecal coliform, the receiving water model produced a daily<br />
average e. coli concentration for each day in each month. Geometric means were<br />
calculated on a monthly basis using the daily values. The number of months where<br />
the geometric mean exceeded 126/100 ml was tabulated.<br />
o Number of days predicted e. coli concentration exceeds 126/100 ml and 576/100 ml –<br />
EPA’s documents suggest a range of single sample maximum e. coli concentrations<br />
depending on the use of the water body. The suggested maximums range between<br />
235/100 ml for “designated beach areas” to 576/100 ml for “infrequently used full<br />
body contact recreation” areas. In order to be consistent with the analysis performed<br />
for fecal coliform where no single sample maximum exists, the number of days where<br />
the predicted e. coli concentration exceeded 126/100 ml (the value for the 30 day<br />
geometric mean) was calculated. In order to bracket the range, the number of days<br />
\\Gh-wash\ENG 1160\LTCP\LTCP Final\Sec 9.doc 9-2 FINAL - July 2002
Selection of Draft LTCP<br />
exceeding the upper limit on the single sample maximum of 576/100 ml was also<br />
evaluated.<br />
o Number of days of CSO impact – In order to assess the effect of CSO controls on<br />
their own, other load sources were set to zero, and the number of days that CSOs<br />
would cause the e. coli concentration in the receiving water to exceed 126/100 ml and<br />
576/100 ml was calculated.<br />
Dissolved Oxygen<br />
Number of Days less than 5.0 mg/L, 4.0 mg/L and 2.0 mg/L – The water quality standards<br />
require a minimum dissolved oxygen level of 5.0 mg/L. The number of days where the<br />
average daily dissolved oxygen level was predicted to be less than this value was calculated.<br />
In addition, discussions with DOH indicate that dissolved oxygen levels less than 4.0 mg/L<br />
can produce stress for certain fish species. DOH has identified 2.0 mg/L as the threshold<br />
below which fish kills become a significant risk. For the Anacostia River, which experiences<br />
low dissolved oxygen levels, the number of days where the dissolved oxygen is predicted to<br />
be below 4.0 mg/L and 2.0 mg/L were also calculated.<br />
Minimum Day Dissolved Oxygen – The value of the minimum day dissolved oxygen level<br />
was calculated for each alternative in order to assess the degree of deviation from the<br />
standard.<br />
Non-CSO Loads<br />
Load sources other than CSOs were found to have a significant impact on water quality, particularly<br />
in the Anacostia River and Rock Creek. Analyses conclusively demonstrated that CSO control alone<br />
could not improve the water quality in the receiving waters to a level that would meet the existing<br />
water quality standards. As a result, CSO control was coupled with reductions in loads from other<br />
sources to establish the combined benefit to the receiving waters. The load reductions were applied<br />
as follows:<br />
<br />
<br />
Separate Storm <strong>Water</strong> – A 40% reduction in D.C. storm water pollutant loads was tested.<br />
The storm water volume was left unchanged. There is little information in the literature on<br />
the degree to which storm water controls can achieve pollutant reductions on a city-wide<br />
basis. A study in Seneca, Maryland suggested that reductions in the 40% range might be<br />
achievable if controls were integrated with development. As such this would represent an<br />
extremely aggressive storm water program and probably is an optimistic assessment of what<br />
might be achievable in the District.<br />
Upstream Boundary Loads – Upstream nutrients (CBOD5, nitrogen and phosphorus) were<br />
reduced by 40%. In addition the upstream fecal coliform and e. coli concentration were<br />
reduced to 80% of the current water quality standards. This resulted in a fecal coliform<br />
concentration entering the District of 160/100ml or 80% of the Class A standard. This<br />
\\Gh-wash\ENG 1160\LTCP\LTCP Final\Sec 9.doc 9-3 FINAL - July 2002
Selection of Draft LTCP<br />
concentration was selected to allow the District some allowance for storm and CSO<br />
discharges.<br />
9.3 LOW IMPACT DEVELOPMENT RETROFIT<br />
Public comments indicated a strong preference for consideration and inclusion of Low Impact<br />
Development Retrofit (LID-R) in the final alternatives. LID-R consists of retrofitting existing<br />
development in the District with micro-scale storage and treatment facilities. Examples of such<br />
facilities are biofilters, tree planting, rain gardens, sand filters, porous pavement, storm water<br />
detention, rooftop greening and others. These facilities have the potential to reduce CSOs by<br />
offloading storm water run off. In addition, they can reduce the concentration of pollutants in storm<br />
water.<br />
Analyses indicate that LID-R on its own or coupled with Real Time <strong>Control</strong> (RTC) cannot reduce the<br />
frequency of CSO overflows from current levels to the range of zero to 12 per year on their own.<br />
However, LID-R can be coupled with structural controls to reduce CSOs. In this capacity, LID-R<br />
has the potential to reduce the size of capital facilities. In addition, LID-R can provide ancillary<br />
benefits such as reduced cooling costs, aesthetic value and reduction in pollutants from the separate<br />
storm water system (SSWS).<br />
There are several institutional and implementation issues associated with LID-R. Each is described<br />
below:<br />
<br />
<br />
<br />
<br />
WASA does not control development or redevelopment in the District. As a result, WASA is<br />
not able to mandate application of LID-R. Laws and building codes in the District would<br />
need to be changed in order for this to occur. WASA can, however, recommend these types<br />
of changes to the District and provide technical assistance in their development.<br />
Application of LID-R on the scale of the entire District (44,000 acres) for the purpose of<br />
CSO control has not been implemented before. As a result, there is some uncertainty as to<br />
the practicality and benefits to CSO control.<br />
The most practical and cost-effective way to implement LID-R would be in conjunction with<br />
redevelopment and reconstruction within the District. It would be much more costly to<br />
implement LID-R separate from reconstruction that was already planned. As a result, the<br />
implementation time associated with LID-R would be a function of the rate and magnitude of<br />
redevelopment. This may make the implementation time for LID-R very long, on the order<br />
of 30 years or more. The CSO policy requires development of a schedule for implementing<br />
CSO controls. EPA guidance discusses implementation time frames on the order of 15 years.<br />
It may be very difficult to effectively implement a large degree of LID within that time<br />
frame.<br />
After the LTCP is implemented, WASA’s discharge permit will require a specified degree of<br />
performance for the CSO controls. Violations of the permit are subject to penalties by law.<br />
\\Gh-wash\ENG 1160\LTCP\LTCP Final\Sec 9.doc 9-4 FINAL - July 2002
Selection of Draft LTCP<br />
If LID-R is relied on to provide the degree of control specified in the permit, this could place<br />
WASA in an impractical situation of having to meet a permit but being unable to control<br />
LID-R, which is relied upon to meet the permit. One way to avoid this would be to construct<br />
the long term controls assuming LID-R was not in place. Once LID-R measures were<br />
constructed, the structural control measures would yield a higher degree of control.<br />
LID-R can have a significant cost to society. Preliminary estimates indicate that applying<br />
LID-R over 15% of the impervious land area in the District would cost about $453 million.<br />
This cost could be reduced if the construction is coupled with existing redevelopment. In<br />
addition, costs could decrease as LID-R measures become more common and contractors and<br />
developers become more experienced in their application.<br />
Some LID-R measures may experience challenges in gaining public acceptance. In 2000,<br />
WASA conducted a rain barrel demonstration project by installing 16 rain barrels at 10<br />
residences in the District. The barrels were monitoring for approximately seven months and<br />
the homeowners were interviewed at the end of the demonstration. The survey found that<br />
40% of the homeowners did not want to keep the rain barrels at the end of the demonstration<br />
period because of maintenance needs, lack of need of water, or insufficient yard area. This<br />
indicates that LID-R measures directed toward individual homeowners may experience some<br />
difficulty unless they are unobtrusive and very low maintenance.<br />
Most LID-R technologies have a limit on how much rain can be treated. Once this limit is exceeded,<br />
runoff is discharged normally. This limit is typically 0.5” and this value was used in the analysis. As<br />
a result of this, LID-R is very effective in eliminating or reducing runoff from small storms. The<br />
combined sewer system has a significant wet weather capacity and can usually accommodate these<br />
smaller storms without overflows. The level of CSO control required in the CSO Policy is in the<br />
range of zero to 12 events per year. The storms that cause these events are typically the extreme,<br />
intense events that can overwhelm LID-R systems. In these large storms, LID-R systems can offload<br />
some of the water which would otherwise appear as runoff. Assuming the application of LID-R over<br />
15% of the impervious land in the District, and assuming that the technologies capture the first 0.5”<br />
of rainfall, the required storage volumes for CSO control could be reduced by about 6 million gallons<br />
for Anacostia CSOs, 2 million gallons for the Potomac CSOs and about 0.5 million gallons for Piney<br />
Branch along Rock Creek. If LID-R were implemented more or less intensely, the required CSO<br />
storage volume would increase or decrease accordingly. Because the separate storm water system<br />
discharges practically every time it rains, LID-R can have a more significant benefit in reducing<br />
pollutants from this source.<br />
Even though LID-R has significant implementation and institutional issues associated with its<br />
application, that does not mean it should not be implemented. In addition to assisting with CSO<br />
control, LID-R has significant benefits to storm water controls, quality of life and other<br />
environmental benefits. It is good public policy. The approach taken in this section is to evaluate the<br />
\\Gh-wash\ENG 1160\LTCP\LTCP Final\Sec 9.doc 9-5 FINAL - July 2002
Selection of Draft LTCP<br />
sizing and cost of structural CSO controls with and without LID-R so that a sound decision can be<br />
made as to the final sizing of the structural control measures.<br />
9.4 REAL TIME CONTROL<br />
The real time control (RTC) alternative discussed in Section 8 can be divided into two categories as<br />
follows:<br />
<br />
<br />
Operational changes in pumping stations<br />
Additional in-system storage<br />
The operational changes at the pump stations consist of operating the facilities delivering flow to<br />
BPWWTP at capacity so as to minimize overflows to local waters of the Anacostia and the Potomac.<br />
Under certain conditions, the pumping capacity will exceed the treatment capacity of BPWWTP. In<br />
these events, overflows will occur at CSO 003, Bolling Air Force Base to the Potomac River. The<br />
river at this location is much better able to accommodate overflows. This operational scheme is<br />
appropriate until the structural CSO storage facilities (i.e. tunnels) described in this section are<br />
constructed. Once the tunnel storage is constructed, it would be better to allow CSOs to fill the<br />
storage tunnel first rather than allowing overflows at CSO 003.<br />
The second element of RTC involves additional in-system storage. In Rock Creek, significant insystem<br />
storage was not available, mostly due to the steepness of the watershed. Dams were tested at<br />
several locations, but they did not reduce overflows. In the Potomac, several potential in-system<br />
storage locations were identified. However, the storage did not significantly reduce overflow<br />
volumes, mostly because the storage was normally filled under existing conditions. Additional<br />
storage beyond the existing inflatable dams is thus not proposed for the Potomac and Rock Creek<br />
systems.<br />
In the Anacostia, two potential sites were identified for additional in-system storage. One site is in<br />
the Northeast Boundary Trunk <strong>Sewer</strong> (NEBTS) near Florida St. and H St. NE to take advantage of<br />
additional storage in the 20’ span of sewer. The second site is also in the NEBTS, between the Swirl<br />
Facility and the river. The second site takes advantage of storage capacity in the triple span of the<br />
NEBTS downstream of the existing swirl facility. As described in Section 8, the in-system storage in<br />
the Anacostia system was not able to reduce overflows to the level required by the CSO Policy, but<br />
was able to measurably reduce the annual CSO overflow volume. The approach taken in this section<br />
is to evaluate the sizing and cost of structural CSO controls with and without RTC in the Anacostia<br />
system to enable making a decision as to the final sizing of the structural control measures.<br />
\\Gh-wash\ENG 1160\LTCP\LTCP Final\Sec 9.doc 9-6 FINAL - July 2002
Selection of Draft LTCP<br />
9.5 ANACOSTIA RIVER ALTERNATIVES<br />
9.5.1 Description<br />
Based on the preliminary alternatives evaluation, the final alternatives for the Anacostia River CSOs<br />
are summarized in Table 9-1.<br />
Table 9-1<br />
Anacostia River Final Alternatives<br />
Name No. Description<br />
D27-1 Retain Main and ‘O’ Pumping Stations at Present Location<br />
Tunnel From Poplar Point to<br />
Northeast Boundary<br />
Tunnel from BPWWTP to<br />
Northeast Boundary<br />
D27-2 Add Low Impact Development Retrofit<br />
D27-3 Add Real Time <strong>Control</strong><br />
D27-4 Add Low Impact Development Retrofit and Real Time <strong>Control</strong><br />
D28 Relocate Main and ‘O’ Pumping Stations to Poplar Point<br />
D29-1 Retain Main and ‘O’ Pumping Stations at Present Location<br />
D29-2 Add Low Impact Development Retrofit<br />
D29-3 Add Real Time <strong>Control</strong><br />
D29-4 Add Low Impact Development Retrofit and Real Time <strong>Control</strong><br />
D30 Relocate Main and ‘O’ Pumping Stations to Poplar Point and<br />
BPWWTP<br />
The alternatives are described below:<br />
<br />
Alternative D27: Tunnel from Poplar Point to Northeast Boundary (Retain Main and ‘O’<br />
Pumping Stations at Present Location)<br />
This alternative is shown on Figure 9-1 and consists of a storage tunnel from Poplar Point to<br />
the Main and O Street Pumping Station site, then continuing to the Northeast Boundary<br />
outfall. From the Northeast Boundary outfall, the tunnel would parallel the existing<br />
Northeast Boundary <strong>Sewer</strong> to relieve street flooding in the Northeast Boundary Area. The<br />
following are key features of this alternative:<br />
o The low point of the tunnel would be at Poplar Point. A new Poplar Point pumping<br />
station would be required with two levels. The low level would dewater the tunnel<br />
after rain events, while the upper level would replace the function of the existing<br />
station, which is lifting sewage from the area east of the Anacostia into the outfall<br />
sewers.<br />
o A new conveyance pipeline from Fort Stanton to Poplar Point is required to pick up<br />
CSO 005, 006 and 007.<br />
o The Navy Yard and M Street CSOs would drop into the tunnel as it travels from<br />
Main and ‘O’ to Northeast Boundary.<br />
\\Gh-wash\ENG 1160\LTCP\LTCP Final\Sec 9.doc 9-7 FINAL - July 2002
Selection of Draft LTCP<br />
o The tunnel parallel to the Northeast Boundary <strong>Sewer</strong> would be designed to provide<br />
relief to the Northeast Boundary <strong>Sewer</strong> to provide flooding protection at the 15-year<br />
storm. Two side tunnels from the main tunnel to West Virginia and Mt. Olive, NE<br />
and to Rhode Island and 4 th St. NE are required to relieve these local flood areas.<br />
o The existing Northeast Boundary <strong>Sewer</strong> outfall does not have adequate capacity to<br />
convey the 15 year storm. A new outfall from the tunnel to the river is required to<br />
provide the necessary flooding protection.<br />
o No changes would be made at BPWWTP.<br />
<br />
Alternative D27-2: Alternative D27-1 Plus Low Impact Development Retrofit<br />
Alternative D27-3: Alternative D27-1 Plus Real Time <strong>Control</strong><br />
Alternative D27-4: Alternative D27-1 Plus Low Impact Development Retrofit and Real Time<br />
<strong>Control</strong><br />
These alternatives are identical to Alternative D27-1 except the features of LID-R and Real<br />
Time <strong>Control</strong> (RTC) are added separately and in combination with each other. Adding LID-<br />
R and/or RTC have the ability to reduce CSO overflows, thereby reducing the sizing and cost<br />
of capital facilities. The main feature of this additional features are presented below:<br />
o LID–R - Micro scale urban storage and treatment devices were assumed to have been<br />
installed throughout the District. Based on review of the technologies and their<br />
application, approximately 15% of the impervious acres in the District were assumed<br />
to have been connected to LID-R that captures up to 0.5” of rainfall. Because LID-R<br />
technologies also can remove pollutants, the pollutant concentration in storm water<br />
was also reduced.<br />
o RTC – In the Anacostia system, RTC consisted of the following modifications to the<br />
system:<br />
<br />
<br />
<br />
<br />
Two existing dams in the west and middle conduits of the triple span of the<br />
Northeast Boundary Trunk <strong>Sewer</strong> (NEBTS) in the vicinity of the Swirl<br />
Facility were removed and replaced with two new dams which were placed<br />
further downstream. This was done to take advantage of additional unused<br />
storage volume in the triple span of the NEBTS. The stored CSO would drain<br />
by gravity to East Side Pump Station and then be pumped to BPWWTP.<br />
An additional dam was added to the east conduit of the triple span of the<br />
NEBTS in the vicinity of the Swirl Facility to allow upstream storage before<br />
flow needed to be diverted to the Swirl Facility.<br />
An additional dam was added to the NEBTS near Florida St. and H St. NE to<br />
take advantage of additional storage in the 20’ span of sewer.<br />
The Main, “O” Street, Poplar Point, and Eastside pump stations were<br />
operated so as to minimize overflows to the Anacostia and instead to allow<br />
them to occur to the Potomac River at Bolling, CSO 003.<br />
\\Gh-wash\ENG 1160\LTCP\LTCP Final\Sec 9.doc 9-9 FINAL - July 2002
Selection of Draft LTCP<br />
Alternative D28: Tunnel from Poplar Point to Northeast Boundary (Relocate Main and ‘O’<br />
Pumping Stations to Poplar Point)<br />
This is identical to alternative D27-1, except that the pumping facilities associated with the<br />
Main and ‘O’ Street site would be abandoned and a single replacement pumping station<br />
would be constructed in the Poplar Point area. The new facility would provide both sanitary,<br />
storm, and tunnel dewatering pumping capabilities. The sanitary pumping would lift<br />
combined sewage to the outfall sewers, replacing the sanitary portion of the existing Main,<br />
‘O’ Street and Poplar Point Pumping stations. In order to prevent flooding downtown, the<br />
combined pump station would need a storm pumping capability to discharge CSO and storm<br />
water to the river via a new outfall. The pump station would also dewater CSO stored in the<br />
tunnel to the existing outfall sewer for treatment at BPWWTP.<br />
<br />
Alternative D29-1: Tunnel from BPWWTP to Northeast Boundary (Retain Main and ‘O’<br />
Pumping Stations at Present Location)<br />
This alternative is shown on Figure 9-2. The alternative is similar to Alternative D27 except<br />
the tunnel extends from BPWWTP to Northeast Boundary. The low point of the tunnel<br />
would be at BPWWTP and a tunnel dewatering pump station would be constructed there.<br />
The existing Poplar Point Pumping Station would be replaced at its existing 45 mgd capacity.<br />
Flooding protection of Northeast Boundary is provided by the Northeast Boundary tunnel.<br />
Other features are identical to Alternative D27-1<br />
<br />
Alternative D29-2: Alternative D29 Plus Low Impact Development Retrofit<br />
Alternative D29-3: Alternative D29 Plus Real Time <strong>Control</strong><br />
Alternative D29-4: Alternative D29 Plus Low Impact Development Retrofit and Real Time<br />
<strong>Control</strong><br />
These alternatives are identical to Alternative D29-1 except the additional features of LID-R,<br />
RTC, and the combination of the two features added together. The LID-R and RTC<br />
components are identical to those described Alternative D27-2 through D27-4.<br />
\\Gh-wash\ENG 1160\LTCP\LTCP Final\Sec 9.doc 9-10 FINAL - July 2002
Selection of Draft LTCP<br />
<br />
Alternative D30: Tunnel from BPWWTP to Northeast Boundary (Relocate Main and ‘O’<br />
Pumping Stations to Poplar Point and BPWWTP)<br />
This alternative consists of a storage/conveyance tunnel from BPWWTP to Northeast<br />
Boundary. The pumping facilities associated with Main and ‘O’ Street Pumping Stations<br />
would be abandoned and replacement facilities would be constructed at Poplar Point and<br />
BPWWTP. The following are the primary features of the plan:<br />
o Since Main and ‘O’ pumping facilities would be abandoned, a replacement pumping<br />
facility would be required in the vicinity of Poplar Point. The new pumping station<br />
would replace the function of the existing sanitary pumps at Main, ‘O’ Street and<br />
Poplar Point facilities and handle the flow from the Fort Stanton Interceptor.<br />
o The existing Tiber Creek and B Street/New Jersey Avenue sewers are low compared<br />
to the elevation of the river. Depending on tidal level, these sewers cannot flow by<br />
gravity to the river without causing flooding downtown. As a result, the existing<br />
Main and ‘O’ Street Pumping Stations include storm pumps which lift water to the<br />
river to prevent flooding. With Main & ‘O’ Street Pumping Stations abandoned, a<br />
new storm water pumping station would need to be constructed at BPWWTP. High<br />
flows from the existing sewers at Main & O Street Pumping Stations would drop into<br />
the tunnel, travel down to BPWWTP via the tunnel, and be pumped to the Potomac<br />
River. Since the low point of the tunnel will also be at BPWWTP, the storm pump<br />
station could be integrated with a tunnel dewatering pump station into a single<br />
facility.<br />
o Currently flows receiving full treatment and those receiving excess flow treatment at<br />
BPWWTP are commingled. This causes a degree of operation difficulty at the plant.<br />
Under this alternative, the existing excess flow treatment train at BPWWTP would be<br />
eliminated and the plant influent would be limited to 740 mgd for the first 4 hours<br />
and 511 mgd after that. Flows in excess of 740/511 mgd would be handled by the<br />
tunnel. Flows in excess of the tunnel storage tunnel capacity would be pumped from<br />
the tunnel and be treated by a combination settling/disinfection basin. This<br />
configuration would separate excess flows from other flows and would simplify<br />
operations at the plant.<br />
o Other aspects of this alternative are identical to Alternative D27-1.<br />
The sizing of major facilities for each alternative is summarized in Table 9-2<br />
\\Gh-wash\ENG 1160\LTCP\LTCP Final\Sec 9.doc 9-12 FINAL - July 2002
Selection of Draft LTCP<br />
Table 9-2<br />
Facility Sizing: Anacostia River Final Alternatives<br />
# CSO Overflows per Average Year<br />
0 1 2 4 8 12<br />
Annual CSO Overflow Volume per Average Year<br />
No. Facility Sizes for Indicated Level of CSO <strong>Control</strong> 0 mg 54 mg 93 mg 262 mg 515 mg<br />
D27<br />
Tunnel From Poplar Point to Northeast Boundary<br />
D27-1 Retain Main & ‘O’ Street Pumping Stations at Present Location<br />
Tunnel From Poplar Point to BPWWTP<br />
Length, (ft)<br />
Diameter, (ft)<br />
Tunnel From Poplar Point to Northeast Boundary Outfall<br />
Length, (ft)<br />
Diameter, (ft)<br />
Tunnel Parallel to Northeast Boundary <strong>Sewer</strong><br />
Length, (ft)<br />
Diameter, (ft)<br />
Tunnel from NEB <strong>Sewer</strong> to Rhode Island & 4 th NE<br />
Length, (ft)<br />
Diameter, (ft)<br />
Tunnel from NEB <strong>Sewer</strong> to West Virginia & Mt. Olivet, NE<br />
Length, (ft)<br />
Diameter, (ft)<br />
Total <strong>System</strong> Storage Volume, (mg)<br />
Fort Stanton Interceptor<br />
Length, (ft)<br />
Diameter, (ft)<br />
Firm Pumping 2 and Treatment Capacities<br />
Main – Sanitary Capacity/ Storm Capacity, (mgd)<br />
‘O’ St. – Sanitary Capacity/ Storm Capacity, (mgd)<br />
New Poplar Point – Tunnel Dewatering Side, (mgd)<br />
New Poplar Point – Low Lift Sanitary Side, (mgd)<br />
Eastside, (mgd)<br />
Northeast Boundary Swirl<br />
BPWWTP Treatment (mgd)<br />
BPWWTP Excess Flow Treatment (mgd)<br />
D27-2 D27-1 Plus Low Impact Development Retrofit<br />
Same as D27-1 with Following Changes:<br />
Tunnel From BPWWTP to Poplar Point, Dia, (ft)<br />
Tunnel From Poplar Point to Northeast Boundary Outfall Dia, (ft)<br />
Tunnel Parallel to Northeast Boundary <strong>Sewer</strong>, Dia, (ft)<br />
Total <strong>System</strong> Storage Volume, (mg)<br />
D27-3 D27-1 Plus Real Time <strong>Control</strong><br />
D27-4<br />
Same as D27-1 with Following Changes:<br />
Tunnel From BPWWTP to Poplar Point, Dia, (ft)<br />
Tunnel From Poplar Point to Northeast Boundary Outfall Dia, (ft)<br />
Tunnel Parallel to Northeast Boundary <strong>Sewer</strong>, Dia, (ft)<br />
Total <strong>System</strong> Storage Volume, (mg)<br />
D27-1 Plus Low Impact Development Retrofit and Real Time<br />
<strong>Control</strong><br />
Same as D27-1 with Following Changes:<br />
20,695’<br />
28.5’<br />
13,785’<br />
28.5’<br />
20,230’<br />
28.5’<br />
5,915’<br />
12’<br />
3,935’<br />
8’<br />
-<br />
-<br />
13,785’<br />
24.5’<br />
20,230’<br />
24.5’<br />
5,915’<br />
12’<br />
3,935’<br />
8’<br />
-<br />
-<br />
13,785’<br />
22.5’<br />
20,230’<br />
22.5’<br />
5,915’<br />
12’<br />
3,935’<br />
8’<br />
-<br />
-<br />
13,785’<br />
12’<br />
20,230’<br />
18’<br />
5,915’<br />
12’<br />
3,935’<br />
8’<br />
-<br />
-<br />
13,785’<br />
10’<br />
20,230’<br />
18’<br />
5,915’<br />
12’<br />
3,935’<br />
8’<br />
267 126 108 57 53<br />
4,900’<br />
7’<br />
240/400<br />
45/500<br />
250<br />
45<br />
45<br />
Abandon<br />
740/511<br />
336<br />
28’<br />
28’<br />
28’<br />
258<br />
28’<br />
28’<br />
28’<br />
258<br />
4,900’<br />
6’<br />
240/400<br />
45/500<br />
125<br />
45<br />
45<br />
Abandon<br />
740/511<br />
336<br />
-<br />
24’<br />
24’<br />
122<br />
-<br />
23.5’<br />
23.5’<br />
117<br />
4,900’<br />
5.5’<br />
240/400<br />
45/500<br />
95<br />
45<br />
45<br />
Abandon<br />
740/511<br />
336<br />
-<br />
22’<br />
22’<br />
103<br />
-<br />
21.5’<br />
21.5’<br />
99<br />
4,900’<br />
4.5’<br />
240/400<br />
45/500<br />
60<br />
45<br />
45<br />
Abandon<br />
740/511<br />
336<br />
-<br />
12’<br />
18’<br />
57<br />
-<br />
12’<br />
18’<br />
57<br />
4,900’<br />
4’<br />
240/400<br />
45/500<br />
60<br />
45<br />
45<br />
Abandon<br />
740/511<br />
336<br />
-<br />
10’<br />
18’<br />
53<br />
-<br />
10’<br />
18’<br />
53<br />
\\Gh-wash\ENG 1160\LTCP\LTCP Final\Sec 9.doc 9-13 FINAL - July 2002
Selection of Draft LTCP<br />
# CSO Overflows per Average Year<br />
0 1 2 4 8 12<br />
Annual CSO Overflow Volume per Average Year<br />
No. Facility Sizes for Indicated Level of CSO <strong>Control</strong> 0 mg 54 mg 93 mg 262 mg 515 mg<br />
D28<br />
Tunnel From Poplar Point to BPWWTP, Dia, (ft)<br />
Tunnel From Poplar Point to Northeast Boundary Outfall Dia, (ft)<br />
Tunnel Parallel to Northeast Boundary <strong>Sewer</strong>, Dia, (ft)<br />
Total <strong>System</strong> Storage Volume, (mg)<br />
Relocate Main & ‘O’ Street Pumping Stations to Poplar Point<br />
Same as D27-1, with the following revisions:<br />
Firm Pumping 2 and Treatment Capacities<br />
Main – Sanitary Capacity/ Storm Capacity, (mgd)<br />
‘O’ St. – Sanitary Capacity/ Storm Capacity, (mgd)<br />
New Poplar Point – Low Lift Sanitary Side, (mgd)<br />
New Poplar Point – Storm Side, (mgd)<br />
D29 Tunnel From BPWWTP to Northeast Boundary<br />
D29-1 Retain Main & ‘O’ Street Pumping Stations at Present Location<br />
Tunnel From BPWWTP to Main & ‘O’<br />
Length, (ft)<br />
Diameter, (ft)<br />
Tunnel from Main & ‘O’ to Northeast Boundary Outfall<br />
Length ,(ft)<br />
Diameter, (ft)<br />
Tunnel Parallel to Northeast Boundary <strong>Sewer</strong><br />
Length, (ft)<br />
Diameter, (ft)<br />
Tunnel from NEB <strong>Sewer</strong> to Rhode Island & 4 th NE<br />
Length, (ft)<br />
Diameter, (ft)<br />
Tunnel from NEB <strong>Sewer</strong> to West Virginia & Mt. Olivet, NE<br />
Length, (ft)<br />
Diameter, (ft)<br />
27.5’<br />
27.5’<br />
27.5’<br />
249<br />
Relocate<br />
Relocate<br />
320<br />
1000<br />
20,695’<br />
29’<br />
11,227’<br />
29’<br />
20,230’<br />
29’<br />
-<br />
23’<br />
23’<br />
112<br />
Relocate<br />
Relocate<br />
320<br />
1000<br />
20,695’<br />
20’<br />
11,227’<br />
20’<br />
20,230’<br />
20’<br />
-<br />
20.75’<br />
20.75’<br />
92<br />
Relocate<br />
Relocate<br />
320<br />
1000<br />
20,695’<br />
18.25’<br />
11,227’<br />
18.25’<br />
20,230’<br />
18.25’<br />
-<br />
12’<br />
18’<br />
57<br />
Relocate<br />
Relocate<br />
320<br />
1000<br />
20,695’<br />
6’<br />
11,227’<br />
12’<br />
20,230’<br />
18’<br />
Total <strong>System</strong> Storage Volume 264 129 109 59 56<br />
Firm Pumping 2 and Treatment Capacities<br />
Main – Sanitary Capacity/ Storm Capacity, (mgd)<br />
‘O’ St. – Sanitary Capacity/ Storm Capacity, (mgd)<br />
Replace Poplar Point, (mgd)<br />
Eastside, (mgd)<br />
Northeast Boundary Swirl<br />
Tunnel Dewatering Pump Sta. at BPWWTP, (mgd)<br />
BPWWTP Treatment (mgd)<br />
BPWWTP Excess Flow Treatment (mgd)<br />
D29-2 D29-1 Plus Low Impact Development Retrofit<br />
Same as D29-1 with Following Changes:<br />
Tunnel From BPWWTP to Main & ‘O’ Street, Diameter, (ft)<br />
Tunnel from Main & O to Northeast Boundary Outfall, Dia, (ft)<br />
Tunnel Parallel to Northeast Boundary <strong>Sewer</strong>, Diameter, (ft)<br />
Total <strong>System</strong> Storage Volume, (mg)<br />
D29-3 D29-1 Plus Real Time <strong>Control</strong><br />
Same as D29-1 with Following Changes:<br />
Tunnel From BPWWTP to Main & ‘O’ Street, Diameter, (ft)<br />
Tunnel from Main & O to Northeast Boundary Outfall, Dia, (ft)<br />
Tunnel Parallel to Northeast Boundary <strong>Sewer</strong>, Diameter, (ft)<br />
Total <strong>System</strong> Storage Volume, (mg)<br />
5,915’<br />
12’<br />
3,935’<br />
8’<br />
240/400<br />
45/500<br />
45<br />
45<br />
Abandon<br />
250<br />
740/511<br />
336<br />
28.75’<br />
28.75’<br />
28.75’<br />
260<br />
27.25’<br />
27.25’<br />
27.25’<br />
234<br />
5,915’<br />
12’<br />
3,935’<br />
8’<br />
240/400<br />
45/500<br />
45<br />
45<br />
Abandon<br />
125<br />
740/511<br />
336<br />
19.25’<br />
19.25’<br />
19.25’<br />
120<br />
19’<br />
19’<br />
19’<br />
117<br />
5,915’<br />
12’<br />
3,935’<br />
8’<br />
240/400<br />
45/500<br />
45<br />
45<br />
Abandon<br />
95<br />
740/511<br />
336<br />
17.5’<br />
17.5’<br />
18’<br />
102<br />
16.75’<br />
16.75’<br />
18’<br />
98<br />
5,915’<br />
12’<br />
3,935’<br />
8’<br />
240/400<br />
45/500<br />
45<br />
45<br />
Abandon<br />
60<br />
740/511<br />
336<br />
6’<br />
12’<br />
18’<br />
59<br />
6’<br />
12’<br />
18’<br />
59<br />
-<br />
10’<br />
18’<br />
53<br />
Relocate<br />
Relocate<br />
320<br />
1000<br />
20,695’<br />
6’<br />
11,227’<br />
10’<br />
20,230’<br />
18’<br />
5,915’<br />
12’<br />
3,935’<br />
8’<br />
240/400<br />
45/500<br />
45<br />
45<br />
Abandon<br />
60<br />
740/511<br />
336<br />
6’<br />
10’<br />
18’<br />
56<br />
6’<br />
10’<br />
18’<br />
56<br />
\\Gh-wash\ENG 1160\LTCP\LTCP Final\Sec 9.doc 9-14 FINAL - July 2002
Selection of Draft LTCP<br />
# CSO Overflows per Average Year<br />
0 1 2 4 8 12<br />
Annual CSO Overflow Volume per Average Year<br />
No. Facility Sizes for Indicated Level of CSO <strong>Control</strong> 0 mg 54 mg 93 mg 262 mg 515 mg<br />
D29-4<br />
D30<br />
D29-1 Plus Low Impact Development Retrofit and Real Time<br />
<strong>Control</strong><br />
Same as D29-1 with Following Changes:<br />
Tunnel From BPWWTP to Main & ‘O’ Street, Diameter, (ft)<br />
Tunnel from Main & O to Northeast Boundary Outfall, Dia, (ft)<br />
Tunnel Parallel to Northeast Boundary <strong>Sewer</strong>, Diameter, (ft)<br />
Total <strong>System</strong> Storage Volume, (mg)<br />
Relocate Main & ‘O’ Street Pumping Stations to Poplar Point<br />
and BPWWTP<br />
Tunnel From BPWWTP to Main & ‘O’<br />
Length, (ft)<br />
Diameter, (ft)<br />
Tunnel from Main & ‘O’ to Northeast Boundary Outfall<br />
Length, (ft)<br />
Diameter, (ft)<br />
Tunnel Parallel to Northeast Boundary <strong>Sewer</strong><br />
Length, (ft)<br />
Diameter, (ft)<br />
Tunnel from NEB <strong>Sewer</strong> to Rhode Island & 4 th NE<br />
Length, (ft)<br />
Diameter, (ft)<br />
Tunnel from NEB <strong>Sewer</strong> to West Virginia & Mt. Olivet, NE<br />
Length, (ft)<br />
Diameter, (ft)<br />
27’<br />
27’<br />
27’<br />
230<br />
20,695’<br />
29’<br />
11,227’<br />
29’<br />
20,230’<br />
29’<br />
18.5’<br />
18.5’<br />
18.5’<br />
111<br />
20,695’<br />
20’<br />
11,227’<br />
20’<br />
20,230’<br />
20’<br />
15.75’<br />
15.75’<br />
18’<br />
92<br />
20,695’<br />
18.25’<br />
11,227’<br />
18.25’<br />
20,230’<br />
18.25’<br />
6’<br />
12’<br />
18’<br />
59<br />
20,695’<br />
16’<br />
11,227’<br />
12’<br />
20,230’<br />
18’<br />
Total <strong>System</strong> Storage Volume 263 129 108 85 85<br />
Firm Pumping 2 and Treatment Capacities<br />
Main – Sanitary Capacity/ Storm Capacity, (mgd)<br />
‘O’ St. – Sanitary Capacity/ Storm Capacity, (mgd)<br />
Replace Poplar Point, (mgd)<br />
Eastside, (mgd)<br />
Northeast Boundary Swirl<br />
Tunnel Dewatering Pump Sta. at BPWWTP, (mgd)<br />
Storm Pump Station at BPWWTP, (mgd)<br />
BPWWTP Treatment (mgd)<br />
Existing BPWWTP Excess Flow Treatment (mgd)<br />
New Disinfection Facility for Excess Flow (mgd)<br />
5,915’<br />
12’<br />
3,935’<br />
8’<br />
Relocate<br />
Relocate<br />
320<br />
45<br />
Abandon<br />
250<br />
1000<br />
740/511<br />
Abandon<br />
1,000<br />
5,915’<br />
12’<br />
3,935’<br />
8’<br />
Relocate<br />
Relocate<br />
320<br />
45<br />
Abandon<br />
125<br />
1000<br />
740/511<br />
Abandon<br />
1,000<br />
5,915’<br />
12’<br />
3,935’<br />
8’<br />
Relocate<br />
Relocate<br />
320<br />
45<br />
Abandon<br />
95<br />
1000<br />
740/511<br />
Abandon<br />
1,000<br />
5,915’<br />
12’<br />
3,935’<br />
8’<br />
Relocate<br />
Relocate<br />
320<br />
45<br />
Abandon<br />
90<br />
1000<br />
740/511<br />
Abandon<br />
1,000<br />
Notes:<br />
1. Zero overflows for all storms during analysis period 1988-1990. There will still be overflows under other climatic<br />
conditions<br />
2. Capacity with largest pump out of service.<br />
6’<br />
10’<br />
18’<br />
56<br />
20,695’<br />
16’<br />
11,227’<br />
12’<br />
20,230’<br />
18’<br />
5,915’<br />
12’<br />
3,935’<br />
8’<br />
Relocate<br />
Relocate<br />
320<br />
45<br />
Abandon<br />
90<br />
1000<br />
740/511<br />
Abandon<br />
1,000<br />
In many cases, the need for conveyance capacity set the minimum size of tunnel facilities rather than<br />
the CSO storage volume needed. These instances are as follows:<br />
<br />
In order to provide the Northeast Boundary with flooding protection, the minimum size of<br />
tunnel was determined to be 18’ diameter based on conveyance capacity required at the 15<br />
year storm.<br />
\\Gh-wash\ENG 1160\LTCP\LTCP Final\Sec 9.doc 9-15 FINAL - July 2002
Selection of Draft LTCP<br />
The minimum size of tunnel between Main and O Street and Northeast Boundary is 12’<br />
diameter for 8 overflows/year and 10’ diameter for 12 overflows/year based on conveyance<br />
capacity.<br />
<br />
<br />
The minimum size of tunnel between Main and O Street and BPWWTP is 6’ diameter for<br />
Alternative D29. This is based on the need to convey flows to the plant for tunnel<br />
dewatering.<br />
The minimum size of tunnel between Main and O Street and BPWWTP is 16’ diameter for<br />
Alternative D30. This is based on the need to convey flows to the storm water pumping<br />
station at BPWWTP to prevent flooding downtown.<br />
In several cases, the minimum conveyance sizes for facilities resulted in providing more storage<br />
volume than that needed strictly for CSO control. This was particularly true for 8 and 12 overflows<br />
per year.<br />
9.5.2 Remaining Overflows<br />
The overflows predicted to remain after implementation of controls designed to reduce CSO<br />
overflows to between zero and 12 per average year are summarized in Table 9-3.<br />
Table 9-3<br />
Remaining CSO Overflows - Anacostia River (Average of 1988-1990)<br />
CSO<br />
No.<br />
#<br />
Events<br />
# CSO Events/Average Year<br />
0 1 2 4 8 12<br />
Vol. # Vol. # Vol. # Vol. #<br />
(mg) Events (mg) Events (mg) Events (mg) Events<br />
Description<br />
004 Poplar Point P.S.<br />
Emergency<br />
Bypass - - - - - - - - - -<br />
005 - - - - - - - - - -<br />
006 Ft. Stanton<br />
- - - - - - - - - -<br />
007<br />
- - - - - - - - - -<br />
008 AMI Relief - - - - - - - - - -<br />
009 - - - - - - - - - -<br />
010 B St /NJ Ave at - - 1 21 3 40 6 105 9 191<br />
011 Main & O Street - - - - - - - - 1 2<br />
011a<br />
- - - - - - - - - -<br />
012 Tiber Creek at<br />
Main & O Street - - - - - - - - - -<br />
013 Canal St. <strong>Sewer</strong> - - - - - - - - - -<br />
014 - - - - - - - - 1 0.13<br />
015 - - - - - - - - - -<br />
016<br />
Navy Yard/ M St<br />
- - - - - - - - 1 0.05<br />
017<br />
- - - - - - - - -<br />
018 Barney Circle - - - - - - - - 1 0.14<br />
019 Northeast<br />
Boundary - - 2 33 4 53 7 157 11 322<br />
Total - 54 93 262 515<br />
1. Zero overflows for all storms during analysis period 1988-1990. There will still be overflows under other climatic conditions.<br />
Vol.<br />
(mg)<br />
\\Gh-wash\ENG 1160\LTCP\LTCP Final\Sec 9.doc 9-16 FINAL - July 2002
Selection of Draft LTCP<br />
Note that, in accordance with the CSO Policy, one CSO overflow is defined as one or more CSOs<br />
discharging during a single rain event. The frequency of overflows is thus calculated on a rain event<br />
basis. When multiple CSOs are predicted to overflow during a single rain event, this is counted as<br />
one CSO overflow. Similarly, there are some rain events that cause some CSOs to discharge but not<br />
others. As an example, for the 8 overflow per year level of control, CSO 010 and CSO 019 are each<br />
predicted to overflow less than 8 times per year. However, on a rain event basis, there are 8 times<br />
when at least one of the CSOs is predicted to overflow.<br />
9.5.3 Ability to Meet <strong>Water</strong> Quality Standards<br />
9.5.3.1 Fecal Coliform<br />
The effect of varying levels of CSO control on fecal coliform levels was evaluated for the entire<br />
calendar year as well as for the period May through September. May through September is the<br />
period of most likely primary contact recreation since the ambient and water temperatures rise to<br />
levels for comfortable recreation. In this period of time, the water temperature is above 60-65<br />
degrees Fahrenheit.<br />
In addition to evaluating the effects of CSO control, the upstream and separate storm water loads<br />
were also reduced as described earlier in this section.<br />
Complete results are included in Appendix B. Selected results are shown in Table 9-4.<br />
\\Gh-wash\ENG 1160\LTCP\LTCP Final\Sec 9.doc 9-17 FINAL - July 2002
Selection of Draft LTCP<br />
Table 9-4<br />
Effect of CSO <strong>Control</strong> On Fecal Coliform in Anacostia River<br />
South Capital St. RFK Stadium <strong>DC</strong>/MD Boundary<br />
Existing SSWS<br />
and Upstream<br />
Loads<br />
All<br />
Year<br />
May to<br />
Sept.<br />
Reduced SSWS<br />
and Upstream<br />
Loads 1<br />
All<br />
Year<br />
May to<br />
Sept.<br />
Existing SSWS<br />
and Upstream<br />
Loads<br />
All<br />
Year<br />
May to<br />
Sept.<br />
Reduced SSWS<br />
and Upstream<br />
Loads 1<br />
All<br />
Year<br />
May to<br />
Sept.<br />
Existing SSWS<br />
and Upstream<br />
Loads<br />
All<br />
Year<br />
May to<br />
Sept.<br />
Reduced SSWS<br />
and Upstream<br />
Loads 1<br />
All<br />
Year<br />
May to<br />
Sept.<br />
Parameter<br />
# Months Exceeding Class<br />
A Fecal Coliform Standard<br />
No Phase 1 <strong>Control</strong>s 9 3 9 3 12 5 11 4 12 5 3 1<br />
Phase 1 <strong>Control</strong>s 8 2 5 2 10 3 7 2 12 5 3 1<br />
Pump Sta. Rehab. 6 2 2 1 10 3 7 2 12 5 3 1<br />
12 Overflows/yr 5 2 1 1 8 2 3 1 12 5 3 1<br />
8 Overflows/yr 4 1 0 0 8 2 3 1 12 5 3 1<br />
4 Overflows/yr 4 1 0 0 8 2 3 1 12 5 3 1<br />
2 Overflows/yr 4 1 0 0 8 2 3 1 12 5 3 1<br />
0 Overflows/yr 2 4 1 0 0 8 2 3 1 12 5 3 1<br />
Separation 6 1 3 1 8 2 7 1 12 5 3 1<br />
# Days Fecal Coliform ><br />
200/100 ml<br />
No Phase 1 <strong>Control</strong>s 215 78 202 75 260 101 234 95 270 92 137 56<br />
Phase 1 <strong>Control</strong>s 172 66 138 59 230 84 167 63 269 91 132 53<br />
Pump Sta. Rehab. 170 64 134 58 229 84 166 63 269 91 132 53<br />
12 Overflows/yr 143 47 78 32 226 81 151 55 269 91 133 53<br />
8 Overflows/yr 137 45 66 26 225 81 147 54 269 91 132 53<br />
4 Overflows/yr 134 43 58 23 223 80 144 52 269 91 132 53<br />
2 Overflows/yr 131 42 52 20 223 80 142 52 268 91 131 53<br />
0 Overflows/yr 2 130 41 50 18 223 80 141 51 268 91 131 52<br />
Separation 182 61 151 54 238 87 194 72 268 91 136 54<br />
# Days Fecal CSO Impact<br />
No Phase 1 <strong>Control</strong>s 192 74 N/A N/A 216 90 N/A N/A 8 6 N/A N/A<br />
Phase 1 <strong>Control</strong>s 121 56 N/A N/A 92 43 N/A N/A 3 2 N/A N/A<br />
Pump Sta. Rehab. 115 53 N/A N/A 89 43 N/A N/A 2 1 N/A N/A<br />
12 Overflows/yr 51 24 N/A N/A 39 19 N/A N/A 3 2 N/A N/A<br />
8 Overflows/yr 32 15 N/A N/A 24 12 N/A N/A 2 2 N/A N/A<br />
4 Overflows/yr 15 9 N/A N/A 14 8 N/A N/A 1 1 N/A N/A<br />
2 Overflows/yr 4 4 N/A N/A 4 4 N/A N/A 0 0 N/A N/A<br />
0 Overflows/yr 2 0 0 N/A N/A 0 0 N/A N/A 0 0 N/A N/A<br />
Separation 0 0 N/A N/A 0 0 N/A N/A 0 0 N/A N/A<br />
Notes:<br />
1. Separate storm water load reduced by 40%. Upstream nutrients reduced by 40%. Upstream fecal coliform reduced to<br />
80% of water quality standards or 160 organism/100ml.<br />
2. Zero overflows for all storms during analysis period 1988-1990. There will still be overflows under other climatic<br />
conditions<br />
The following observations are made:<br />
<br />
CSO control alone reduces the number of months exceeding the fecal water quality standard<br />
at South Capitol Street by approximately one half when compared to no CSO control.<br />
\\Gh-wash\ENG 1160\LTCP\LTCP Final\Sec 9.doc 9-18 FINAL - July 2002
Selection of Draft LTCP<br />
<br />
<br />
<br />
<br />
High levels of CSO control (i.e. between 0 and 12 overflows per year) provide better water<br />
quality than separation alone due to the capture and treatment of storm water in the combined<br />
sewer system.<br />
The monthly fecal coliform geometric mean is most affected by the coliform concentrations<br />
at the upstream boundary. Transient wet weather pollution sources like CSOs and storm<br />
water have less impact on the geometric mean.<br />
Each CSO event appears to affect fecal coliform concentrations in the river for a period of<br />
between 2-4 days per event.<br />
At four overflow events per average year, there are an estimated 14 to 15 days per year where<br />
CSOs are impacting fecal levels in the river. During the contact period (May- Sept.), there<br />
are 8 to 9 days or about 1.6 to 1.8 days per month. For two overflow events per year, the<br />
number of days of estimated CSO impact is reduced to 4 days per calendar year, all of which<br />
occur between May and September.<br />
CSO control alone reduces the frequency and magnitude of fecal coliform exceedances of the Class<br />
A standard, but cannot enable the river to meet the standard all months. <strong>Control</strong> of other sources is<br />
required to meet the bacteria standard in terms of a geometric mean during all months. High levels<br />
of CSO control in the range of 2-4 overflows per average year can reduce the time that CSOs impact<br />
bacteria levels in the river to between 4 to 15 days per calendar year and between 4 to 9 days during<br />
May through September.<br />
9.5.3.2 E. Coli<br />
As with fecal coliform, the effect of varying levels of CSO control on e. coli concentrations was<br />
analyzed. Complete data is presented in Appendix B, while selected results are shown in Table 9-5.<br />
\\Gh-wash\ENG 1160\LTCP\LTCP Final\Sec 9.doc 9-19 FINAL - July 2002
Selection of Draft LTCP<br />
Table 9-5<br />
Effect of CSO <strong>Control</strong> On E. Coli in Anacostia River<br />
South Capital St. RFK Stadium <strong>DC</strong>/MD Boundary<br />
Reduced SSWS Existing SSWS Reduced SSWS Existing SSWS<br />
and Upstream and Upstream and Upstream and Upstream<br />
Loads 1 Loads Loads 1 Loads<br />
Existing SSWS<br />
and Upstream<br />
Loads<br />
All<br />
Year<br />
May to<br />
Sept.<br />
All<br />
Year<br />
May to<br />
Sept.<br />
All<br />
Year<br />
May to<br />
Sept.<br />
All<br />
Year<br />
May to<br />
Sept.<br />
All<br />
Year<br />
May to<br />
Sept.<br />
Reduced SSWS<br />
and Upstream<br />
Loads 1<br />
All<br />
Year<br />
May to<br />
Sept.<br />
Parameter<br />
# Months Exceeding 126/100 ml Geometric Mean<br />
No Phase 1 <strong>Control</strong>s 10 3 9 3 12 5 12 5 12 5 2 1<br />
Phase 1 <strong>Control</strong>s 7 2 4 2 9 3 6 2 12 5 2 1<br />
Pump Sta. Rehab. 5 2 2 1 9 3 6 2 12 5 2 1<br />
12 Overflows/yr 4 1 1 1 8 2 3 1 12 5 2 1<br />
8 Overflows/yr 3 1 0 0 8 2 3 1 12 5 2 1<br />
4 Overflows/yr 3 1 0 0 8 2 3 1 12 5 2 1<br />
2 Overflows/yr 3 1 0 0 8 2 3 1 12 5 2 1<br />
0 Overflows/yr 2 3 1 0 0 8 2 3 1 12 5 2 1<br />
Separation 4 1 3 1 8 2 6 1 12 5 3 1<br />
# Days E. Coli > 126/100 ml<br />
No Phase 1 <strong>Control</strong>s 216 79 205 77 259 101 237 95 234 87 133 54<br />
Phase 1 <strong>Control</strong>s 167 65 140 60 222 82 164 62 232 87 128 52<br />
Pump Sta. Rehab. 165 64 136 59 221 82 163 61 232 87 128 52<br />
12 Overflows/yr 132 45 75 32 216 78 145 53 232 87 128 52<br />
8 Overflows/yr 125 42 63 26 215 78 140 52 232 86 128 52<br />
4 Overflows/yr 121 39 54 22 213 77 137 50 232 86 128 52<br />
2 Overflows/yr 116 37 46 18 212 76 134 50 232 86 127 52<br />
0 Overflows/yr 2 116 37 43 15 212 76 134 49 232 86 127 51<br />
Separation 173 59 146 51 231 85 188 70 232 86 131 53<br />
# Days E. Coli CSO Impact (>126/100 ml)<br />
No Phase 1 <strong>Control</strong>s 197 75 N/A N/A 222 93 N/A N/A 9 6 N/A N/A<br />
Phase 1 <strong>Control</strong>s 127 57 N/A N/A 94 44 N/A N/A 3 2 N/A N/A<br />
Pump Sta. Rehab. 120 54 N/A N/A 90 44 N/A N/A 2 1 N/A N/A<br />
12 Overflows/yr 52 25 N/A N/A 40 19 N/A N/A 3 2 N/A N/A<br />
8 Overflows/yr 33 16 N/A N/A 25 12 N/A N/A 2 2 N/A N/A<br />
4 Overflows/yr 15 9 N/A N/A 15 8 N/A N/A 1 1 N/A N/A<br />
2 Overflows/yr 4 4 N/A N/A 4 4 N/A N/A 0 0 N/A N/A<br />
0 Overflows/yr 2 0 0 N/A N/A 0 0 N/A N/A 0 0 N/A N/A<br />
Separation 0 0 N/A N/A 0 0 N/A N/A 0 0 N/A N/A<br />
# Days E. Coli CSO Impact (>576/100 ml)<br />
No Phase 1 <strong>Control</strong>s 123 53 N/A N/A 154 68 N/A N/A 2 2 N/A N/A<br />
Phase 1 <strong>Control</strong>s 75 38 N/A N/A 62 32 N/A N/A 0 0 N/A N/A<br />
Pump Sta. Rehab. 68 34 N/A N/A 61 32 N/A N/A 0 0 N/A N/A<br />
12 Overflows/yr 37 17 N/A N/A 30 15 N/A N/A 0 0 N/A N/A<br />
8 Overflows/yr 21 10 N/A N/A 16 10 N/A N/A 0 0 N/A N/A<br />
4 Overflows/yr 11 7 N/A N/A 11 7 N/A N/A 0 0 N/A N/A<br />
2 Overflows/yr 1 1 N/A N/A 3 3 N/A N/A 0 0 N/A N/A<br />
0 Overflows/yr 2 0 0 N/A N/A 0 0 N/A N/A 0 0 N/A N/A<br />
Separation 0 0 N/A N/A 0 0 N/A N/A 0 0 N/A N/A<br />
Notes:<br />
1. Separate storm water load reduced by 40%. Upstream nutrients reduced by 40%. Upstream fecal coliform reduced to<br />
80% of water quality standards or 160 organism/100ml.<br />
2. Zero overflows for all storms during analysis period 1988-1990. There will still be overflows under other climatic<br />
conditions.<br />
\\Gh-wash\ENG 1160\LTCP\LTCP Final\Sec 9.doc 9-20 FINAL - July 2002
Selection of Draft LTCP<br />
The e. coli and fecal coliform results track each other very closely. The number of months and days<br />
are typically equal or within less than 5% of each other. This suggests that there is no significant<br />
difference between using e. coli or fecal coliform as an bacteriological indicator.<br />
9.5.3.3 Dissolved Oxygen<br />
Low dissolved oxygen levels in the Anacostia typically occur in the summer months of June to<br />
August and typically follow a significant local or upstream wet weather event. The low dissolved<br />
oxygen is driven by the naturally low saturation level of oxygen in the water due to the high water<br />
temperature and the influx of pollutant loads from wet weather events. The sluggish nature of the<br />
Anacostia River does not allow effective re-aeration of the river, contributing to the low dissolved<br />
oxygen. Dissolved oxygen levels below 2.0 mg/L can occur several times per summer month, with<br />
each episode lasting 1 to 2 days. Fish kills have been observed in the past.<br />
In addition to direct loads of oxygen consuming pollutants from CSO, storm water, and the upstream<br />
boundary, the sediments in the Anacostia River are known to exert a substantial oxygen demand.<br />
This sediment oxygen demand (SOD) and the change in the SOD in response to pollutant loads were<br />
included in the receiving water modeling. The SOD in the model is driven by the particulate fraction<br />
of carbonaceous biochemical oxygen demand (CBOD). Testing with the model indicated that<br />
reducing pollutant loads from any source (CSO, SSWS, or upstream) reduced the deposition of<br />
settleable matter and produced a corresponding reduction in SOD. The reduction in SOD was<br />
approximately proportional to the amount of particulate CBOD removed. In addition, the reduction<br />
in SOD was found to lag the load reduction in the pollutant source by approximately three to six<br />
years. Thus, the effects of pollutant load reduction will not be immediately realized in the SOD and<br />
may take on the order of five to ten years to be fully realized.<br />
The effects of varying levels of CSO control on dissolved oxygen were evaluated alone and in<br />
conjunction with control of SSWS and upstream sources. The dissolved oxygen numbers in the table<br />
represent the predicted concentration after the SOD has equilibrated to the loading condition of the<br />
scenario. Complete results are shown in Appendix B, while summary results are shown in Table 9-6.<br />
\\Gh-wash\ENG 1160\LTCP\LTCP Final\Sec 9.doc 9-21 FINAL - July 2002
Selection of Draft LTCP<br />
Table 9-6<br />
Effect of CSO <strong>Control</strong> On Dissolved Oxygen in the Anacostia River<br />
Existing<br />
SSWS and<br />
Upstream<br />
Loads<br />
South Capital St. RFK Stadium <strong>DC</strong>/MD Boundary<br />
Reduced SSWS Existing SSWS Reduced SSWS Existing SSWS<br />
and Upstream and Upstream and Upstream and Upstream<br />
Loads 1 Loads Loads 1 Loads<br />
Reduced SSWS<br />
and Upstream<br />
Loads 1<br />
Parameter<br />
# Days Dissolved Oxygen
Selection of Draft LTCP<br />
The following observations are made:<br />
CSO control alone cannot meet the minimum dissolved oxygen standard in the Anacostia<br />
River. Reduction of other sources beyond the 40% level shown in the table is required to<br />
meet the standard during all months.<br />
CSO control alone can reduce the number of days where the dissolved oxygen is less than 5<br />
mg/L from about 93 to a range of 65 to 71 days per year.<br />
In terms of effect on dissolved oxygen, there is minimal difference between 12 and 2<br />
overflows per year. It appears that once CSO loads to the river are reduced to the 12 per year<br />
level, that additional controls do not have a significant benefit in terms of dissolved oxygen.<br />
<br />
<br />
CSO control alone can prevent the dissolved oxygen from dropping below 2.0 mg/L at South<br />
Capitol Street, but cannot at RFK Stadium.<br />
CSO control in the range of 2 to 12 overflows per year increases the minimum day dissolved<br />
oxygen by about 0.5 mg/L at RFK Stadium and about 1.0 mg/L at South Capital Street.<br />
In addition to meeting the water quality standard, there exists a draft Total Maximum Daily Load<br />
(TMDL) for dissolved oxygen in the Anacostia River. The TMDL has proposed load limits for each<br />
load source, including CSO. The TMDL load limits for CSO are compared against the projected<br />
CBOD 5 loads for various levels of CSO control in Table 9-7.<br />
Table 9-7<br />
CSO <strong>Control</strong>s vs. Draft TMDL for Dissolved Oxygen (Anacostia River)<br />
Scenario<br />
Projected Annual<br />
CBOD 5 load (lb/yr)<br />
Draft TMDL Annual<br />
Load Limit for CSO<br />
(CBOD 5 lb/yr)<br />
Is TMDL met on<br />
Annual and River<br />
Wide Basis<br />
No CSO <strong>Control</strong> 754,965 152,906 No<br />
Phase 1 <strong>Control</strong>s 526,050 152,906 No<br />
Pump Sta. Rehab. 442,985 152,906 No<br />
12 Overflows/yr 173,504 152,906 No<br />
8 Overflows/yr 89,097 152,906 Yes<br />
4 Overflows/yr 33,135 152,906 Yes<br />
2 Overflows/yr 18,391 152,906 Yes<br />
0 Overflows/yr 0 152,906 Yes<br />
Separation 0 152,906 Yes<br />
<strong>Control</strong> programs that reduce overflows to at least 8 times per year are projected to meet the annual<br />
load allocation for CSO. The method by which the TMDL will be applied is not clear as of the<br />
writing of this report. If the TMDL is applied on a daily basis, then it is unlikely that any program<br />
short of complete separation could meet such a TMDL. This is because CSOs are short, intense,<br />
episodic events. For example, if the 152,906 lbs of allowable CBOD5 in the draft TMDL were<br />
converted to a daily value, it would equal about 418.9 lbs per day of allowable load for CSOs. For<br />
\\Gh-wash\ENG 1160\LTCP\LTCP Final\Sec 9.doc 9-23 FINAL - July 2002
Selection of Draft LTCP<br />
the 2 overflows per year option, the entire BOD load for CSOs occurs in two discrete days of the<br />
year, or at least 5,126 lbs/day. As result, any CSO plan short of separation would need for the<br />
TMDL to be applied on an annual average basis.<br />
Another important point is that the projected pounds of CBOD5 for various levels of CSO control are<br />
based on average year conditions in accordance with the CSO Policy. Intense rain events outside the<br />
average year condition will overwhelm any control measure, resulting in substantially more CBOD5<br />
discharges from CSO. A TMDL would need to make allowance for events which were outside of the<br />
average year condition.<br />
9.5.4 Non-Monetary Factors<br />
The following non-monetary factors were evaluated for each of the alternatives:<br />
<br />
<br />
<br />
<br />
<br />
<br />
<br />
Ability to relieve Northeast Boundary Flooding<br />
Public Acceptance<br />
Ability to Implement<br />
Reliability<br />
Ease of Operation<br />
Ease of Maintenance<br />
Ability to Upgrade<br />
Table 9-8 summarizes the non-monetary evaluations for each alternative.<br />
Table 9-8<br />
Non-Monetary Evaluation Factors: Anacostia River Final Alternatives<br />
Northeast<br />
No.<br />
Alternative<br />
Boundary<br />
Flooding<br />
Public<br />
Acceptance<br />
Tunnel From Poplar Point to Northeast Boundary<br />
D27-1 Retain Main & O Pumping<br />
Stations at Present Location<br />
D27-2 D27-1 and Low Impact<br />
Development Retrofit<br />
D27-3 D27-1 and Real Time<br />
<strong>Control</strong><br />
D27-4 D27-1, Real Time <strong>Control</strong><br />
and Low Impact<br />
Development Retrofit<br />
D28<br />
Relocate Main & O<br />
Pumping Stations to Poplar<br />
Point<br />
Ability to<br />
Implement<br />
Reliability<br />
Ease of<br />
Operation<br />
Ease of<br />
Maintenance<br />
Ability to<br />
Upgrade<br />
Excellent Good Excellent Excellent Moderate Good Good<br />
Excellent Good Uncertain Uncertain Moderate Uncertain Good<br />
Excellent Good Excellent Moderate Poor Good Good<br />
Excellent Good Uncertain Uncertain Poor Uncertain Good<br />
Excellent Uncertain Excellent Excellent Very<br />
Good<br />
Good<br />
Good<br />
\\Gh-wash\ENG 1160\LTCP\LTCP Final\Sec 9.doc 9-24 FINAL - July 2002
Selection of Draft LTCP<br />
Northeast<br />
No.<br />
Alternative<br />
Boundary<br />
Flooding<br />
Public<br />
Acceptance<br />
Tunnel From BPWWTP to Northeast Boundary<br />
D29-1 Retain Main & O Pumping<br />
Stations at Present Location<br />
D29-2 D29A and Low Impact<br />
Development Retrofit<br />
D29-3 D29A and Real Time<br />
<strong>Control</strong><br />
D29-4 D29A, Real Time <strong>Control</strong><br />
and Low Impact<br />
Development Retrofit<br />
D30- Relocate Main & O<br />
Pumping Stations to Poplar<br />
Point and BPWWTP<br />
Ability to<br />
Implement<br />
Reliability<br />
Ease of<br />
Operation<br />
Ease of<br />
Maintenance<br />
Ability to<br />
Upgrade<br />
Excellent Good Excellent Excellent Moderate Good Good<br />
Excellent Good Uncertain Uncertain Moderate Uncertain Good<br />
Excellent Good Excellent Moderate Poor Good Good<br />
Excellent Good Uncertain Uncertain Poor Uncertain Good<br />
Excellent Excellent Excellent Excellent Excellent Good Good<br />
Principle points are described below:<br />
<br />
<br />
<br />
<br />
<br />
Northeast Boundary Flooding - All of the alternatives have been developed to provide flooding<br />
protection at the 15 year storm to the Northeast Boundary <strong>Sewer</strong> and known local flooding areas.<br />
Public Acceptance - Public comments indicated a low acceptability of storage facilities in<br />
neighborhoods and of disruption associated with construction. The vast majority of CSOs cross<br />
National Park Service land to reach the receiving waters. In many cases, the park land is the only<br />
land available for treatment or storage facilities. The National Park Service has also expressed a<br />
strong reluctance to supporting use of parkland for storage or treatment facilities. The tunnel<br />
options will minimize disruption and the need for significant land when compared to other<br />
options. These options are thus responsive to public comment. The public also expressed a<br />
strong preference for LID-R and inclusion of this is thus responsive to public comments. Due to<br />
the institutional and technical issues associated with LID-R described previously, the ability to<br />
implement it is uncertain.<br />
Ability to implement – Tunnels and pumping stations have been constructed by other CSO<br />
communities and are practical. In addition, Metro has constructed many miles of tunnels as part<br />
of the subway system and has demonstrated the feasibility of this technology in the Washington<br />
area. Because of the institutional issues associated with LID-R described previously, the ability<br />
to implement this option has been classified as uncertain.<br />
Reliability – Deep tunnels for storage can be designed to fill by gravity and their dewatering can<br />
be automated. Because the application of LID-R on a large scale for CSO control has not been<br />
attempted before, the long term reliability of these types of controls is unknown and has been<br />
assessed as uncertain.<br />
Ease of operation – Since deep tunnels can be designed to fill by gravity, they are relatively easy<br />
to operate. Real time control requires making adjustments to the system in response to changing<br />
conditions. This type of system requires reliance on sensors in the sewer system and on<br />
\\Gh-wash\ENG 1160\LTCP\LTCP Final\Sec 9.doc 9-25 FINAL - July 2002
Selection of Draft LTCP<br />
<br />
<br />
compressors, gates and other mechanical equipment to respond to changing conditions in the<br />
system. The ease of operation has thus been classified as poor.<br />
Ease of Maintenance – Since deep tunnels have few mechanical components, they are relatively<br />
easy to maintain. Pumping facilities associated with the tunnel will require maintenance which is<br />
of comparable complexity to that already experienced by WASA. For LID-R, the micro scale<br />
measures themselves are relatively simple to maintain. However this item has been assessed as<br />
uncertain since the responsibility for maintenance of dispersed facilities is unclear. If LID-R<br />
facilities are necessary for satisfactory functioning of a control plan, there would need to be an<br />
institutional system with the power to inspect and issue notices requiring corrective maintenance.<br />
Ability to Upgrade – Each of the structural CSO control plans can be upgraded if required. The<br />
tunnel from Poplar Point to Main and ‘O’ Street Pumping Stations could be upgraded by<br />
extending the tunnel to BPWWTP to provide additional storage. The tunnel from BPWWTP to<br />
Main and ‘O’ Street Pumping Stations can be upgraded by increasing the pumping and treatment<br />
capacity of the disinfection system at the plant.<br />
9.5.5 Cost Opinions<br />
The capital and operating and maintenance costs for each alternative were estimated and the net<br />
present worth was calculated in order to compare options. The net present worth was calculated<br />
using the following assumptions:<br />
<br />
<br />
<br />
20 year return period<br />
Inflation rate of 3% per year<br />
Interest rate of 6.5 % per year<br />
For LID-R, there is a significant cost associated with its implementation that would be borne by<br />
others. Preliminary estimates indicate that applying LID-R over 15% of the impervious land area in<br />
the District would cost about $453 million. This cost could be reduced if the construction is coupled<br />
with existing redevelopment. In addition, costs could decrease as LID-R measures become more<br />
common and contractors and developers become more experienced in their application. Cost<br />
opinions for each alternative are summarized in Table 9-9.<br />
\\Gh-wash\ENG 1160\LTCP\LTCP Final\Sec 9.doc 9-26 FINAL - July 2002
Selection of Draft LTCP<br />
Table 9-9<br />
Cost Opinion: Anacostia River Final Alternatives (ENR = 6383)<br />
Cost to WASA<br />
No.<br />
Alternative<br />
# of<br />
Overflows/<br />
yr<br />
Capital<br />
Cost ($M)<br />
Annual O &M<br />
($M/yr)<br />
20 Year Net<br />
Present Worth<br />
($M)<br />
Cost to<br />
Others<br />
D27-1<br />
D27-2<br />
Tunnel From Poplar Point to Northeast Boundary<br />
Retain Main & O Pumping<br />
Stations<br />
D27-1 and Low Impact<br />
Development Retrofit<br />
D27-3 D27-1 and Real Time <strong>Control</strong><br />
D27-4<br />
D28<br />
D27-1, Real Time <strong>Control</strong><br />
and Low Impact<br />
Development Retrofit<br />
Relocate Main & O Pumping<br />
Stations to Poplar Point<br />
0 $1,578 $17.80 $1,833 -<br />
2 $911 $8.10 $1,027 -<br />
4 $855 $7.30 $960 -<br />
8 $771 $6.40 $863 -<br />
12 $759 $6.00 $845 -<br />
0 $1,553 $17.52 $1,804<br />
2 $903 $8.03 $1,018<br />
Significant,<br />
4 $850 $7.25 $954<br />
see text<br />
8 $771 $6.40 $863<br />
12 $759 $6.00 $845<br />
0 $1,586 $17.89 $1,843 -<br />
2 $918 $8.16 $1,035 -<br />
4 $865 $7.38 $971 -<br />
8 $794 $6.59 $888 -<br />
12 $781 $6.18 $870 -<br />
0 $1,571 $17.72 $1,825<br />
2 $911 $8.10 $1,027<br />
Significant,<br />
4 $855 $7.30 $960<br />
see text<br />
8 $794 $6.59 $888<br />
12 $781 $6.18 $870<br />
0 $1,945 $21.94 $2,260 -<br />
2 $1,278 $11.36 $1,441 -<br />
4 $1,222 $10.43 $1,372 -<br />
8 $1,138 $9.44 $1,273 -<br />
12 $1,127 $8.91 $1,255 -<br />
D29-1<br />
D29-2<br />
Tunnel From BPWWTP to Northeast Boundary<br />
Retain Main & O Pumping<br />
Stations<br />
D29-1 and Low Impact<br />
Development Retrofit<br />
0 $1,590 $17.94 $1,847 -<br />
2 $1,061 $9.43 $1,196 -<br />
4 $1,022 $8.72 $1,147 -<br />
8 $953 $7.91 $1,066 -<br />
12 $946 $7.48 $1,053 -<br />
0 $1,583 $17.86 $1,839<br />
2 $1,049 $9.32 $1,183<br />
4 $1,014 $8.65 $1,138<br />
8 $953 $7.91 $1,066<br />
12 $946 $7.48 $1,053<br />
Significant,<br />
see text<br />
\\Gh-wash\ENG 1160\LTCP\LTCP Final\Sec 9.doc 9-27 FINAL - July 2002
Selection of Draft LTCP<br />
No.<br />
Alternative<br />
D29-3 D29-1 and Real Time <strong>Control</strong><br />
D29-4<br />
D30<br />
D29-1, Real Time <strong>Control</strong><br />
and Low Impact<br />
Development Retrofit<br />
Relocate Main & O Pumping<br />
Stations to Poplar Point and<br />
BPWWTP<br />
# of<br />
Overflows/<br />
yr<br />
Capital<br />
Cost ($M)<br />
Cost to WASA<br />
Annual O &M<br />
($M/yr)<br />
20 Year Net<br />
Present Worth<br />
($M)<br />
Cost to<br />
Others<br />
0 $1,564 $17.64 $1,817 -<br />
2 $1,067 $9.48 $1,203 -<br />
4 $1,030 $8.79 $1,156 -<br />
8 $976 $8.10 $1,092 -<br />
12 $969 $7.66 $1,079 -<br />
0 $1,557 $17.56 $1,809<br />
2 $1,058 $9.41 $1,193<br />
Significant,<br />
4 $1,022 $8.72 $1,147<br />
see text<br />
8 $976 $8.10 $1,092<br />
12 $969 $7.66 $1,079<br />
0 $1,945 $21.94 $2,260 -<br />
2 $1,417 $12.59 $1,598 -<br />
4 $1,376 $11.74 $1,544 -<br />
8 $1,331 $11.05 $1,489 -<br />
12 $1,327 $10.49 $1,478 -<br />
Separation<br />
Complete Separation 0 $2,113 $7.60 $2,221<br />
9.5.6 Selection of Recommended Anacostia <strong>Control</strong> <strong>Plan</strong><br />
Alternatives D28 and D30 involve relocating Main and ‘O’ Street Pumping Stations. The cost of<br />
relocating these stations and constructing replacement infrastructure at Poplar Point or BPWWTP<br />
ranges from approximately $300 to $375 million. While relocating the stations offers significant<br />
development benefits to the District, its cost makes it prohibitively expensive without outside<br />
funding assistance. These alternatives have thus been eliminated from further consideration.<br />
Alternatives D29-1 through D29-4 involve constructing a tunnel to BPWWTP. Because of the long<br />
length of that tunnel, these alternatives are approximately $170 million more expensive than stopping<br />
the tunnel at Poplar Point. As a result, these alternatives have been eliminated from further<br />
consideration.<br />
LID-R is predicted to decrease the cost of the capital program by about 1.7%. This is primarily due<br />
to the nature of tunneling and not the benefit provided by LID-R. There is not much cost difference<br />
between tunnels which are within 1 to 2 feet of each other in diameter. Because of the uncertainty as<br />
to the ability to implement LID and because of the relatively low cost difference in the tunnel costs, it<br />
is recommended that LID-R be implemented but that the tunnel size be selected without taking<br />
advantage of the benefits of LID-R. When LID-R is implemented, the CSO controls will perform<br />
more effectively.<br />
\\Gh-wash\ENG 1160\LTCP\LTCP Final\Sec 9.doc 9-28 FINAL - July 2002
Selection of Draft LTCP<br />
RTC does reduce the CSO storage volume required. However, the cost of installing the dams is more<br />
than the reduction in cost achieved by reducing tunnel size. Again, this is due to the nature of<br />
tunneling costs. In addition to being more expensive on a capital cost basis, the additional inflatable<br />
dams will be difficult to reliably operate and maintain. The dam in the Northeast Boundary Trunk<br />
<strong>Sewer</strong> (NEBTS) near Florida St. and H St. NE would be located in a pipe continuously exposed to<br />
dry weather flow in the NEBTS. This would make the dam much more difficult to maintain than the<br />
existing dams and could potentially make it more unreliable. The additional dams in the NEBTS<br />
downstream of the swirl facility would be located in a section of conduit that is flat and does not<br />
frequently see substantial flows. Storage of CSO in this line may cause significant deposition<br />
making cleaning and long term reliability difficult. The fundamental reason why additional dams<br />
will not provide cost effective and reliable CSO control is that the existing dams are already installed<br />
at the optimum locations based on CSO control and reliability considerations. For this reason,<br />
installation of additional dams is not recommended.<br />
Based on this evaluation, the tunnel from Poplar Point to Northeast Boundary is the recommended<br />
alternative for the Anacostia CSOs. This alternative may be sized to limit overflows to between zero<br />
and 12 per average year. An evaluation of the cost effectiveness of this alternative has been<br />
performed to enable selection of the proposed level of CSO control. Figure 9-3 presents the cost<br />
effectiveness of the tunnel from Poplar Point to Northeast Boundary. In terms of the percent of CSO<br />
volume reduced, Phase I CSO controls (inflatable dams and Northeast Boundary Swirl) swirl reduced<br />
the CSO volume by 31%. Rehabilitation of the pumping stations reduces overflows by another 9<br />
percent. The costs associated with reducing overflows to between 12 and zero per year are also<br />
plotted. Based on CSO volume reduced, there appears to be a point of lessening returns (‘knee of the<br />
curve’) at about two overflows per year. At that point, the cost curve begins to turn vertical, which<br />
implies increasing costs for less benefit. Two overflows per year appears to be the approximate knee<br />
of the curve for CSO overflow volume.<br />
In Figure 9-3, the cost of CSO control is also plotted against the number of days that CSOs have an<br />
impact on fecal coliform levels between May and September, the period of most likely contact<br />
recreation. Again, the ‘knee of the curve’ appears to be at approximately the two overflows per year<br />
range. For controls beyond two overflows per year, a significant increase in cost occurs for a<br />
marginal number of days gained per year.<br />
In Figure 9-3, the number of days the dissolved oxygen is less than 5 mg/l, 4 mg/l and 2 mg/L is also<br />
plotted versus cost. For this parameter, 12 overflows per year appears to be the threshold beyond<br />
which marginal benefits in terms of number of days occur.<br />
Based on this evaluation, the recommended control for the Anacostia CSOs is LID-R, with a tunnel<br />
from Poplar Point to Northeast Boundary sized for two overflows per year.<br />
\\Gh-wash\ENG 1160\LTCP\LTCP Final\Sec 9.doc 9-29 FINAL - July 2002
100%<br />
0 Overflows/yr (0 mg)<br />
2 Overflows/yr (54 mg)<br />
District of Columbia <strong>Water</strong> and <strong>Sewer</strong> Authority<br />
<strong>Combined</strong> <strong>Sewer</strong> <strong>System</strong> <strong>Long</strong> <strong>Term</strong> <strong>Control</strong> <strong>Plan</strong><br />
Figure 9-3<br />
Anacostia River: Cost Benefit Analysis<br />
Cost vs. CSO Overflow Volume Reduction<br />
4 Overflows/yr (93 mg)<br />
8 Overflows/yr (262 mg)<br />
12 Overflows/yr (515 mg)<br />
$1,800<br />
$1,600<br />
$1,400<br />
$1,200<br />
$1,000<br />
97% 96%<br />
88% 76%<br />
No Phase I <strong>Control</strong>s (2142 mg) $800<br />
Pump Sta Rehab (1282 mg)<br />
$600<br />
$400<br />
Phase I <strong>Control</strong>s (1485 mg)<br />
40%<br />
31%<br />
0%<br />
$200<br />
$-<br />
100% 90% 80% 70% 60% 50% 40% 30% 20% 10% 0%<br />
% CSO Overflow Volume Reduction<br />
Capital Cost ($M)<br />
Capital Cost ($M)<br />
10 85 88 83 55 7<br />
10 82 87 82 55 7<br />
Cost vs. Days of CSO Impact on Fecal Coliforms (May-Sept.)<br />
7 71 77 76 55 7<br />
70 Overflows/yr 69 75 South 73 Capital St. 55 RFK 7Stadium<br />
$1,800<br />
6 67 73 72 55 7<br />
$1,600<br />
$1,400<br />
0<br />
6 2 Overflows/yr 66 72 71 55 7<br />
11<br />
6<br />
4 Overflows/yr 89 91<br />
65<br />
86<br />
72<br />
55<br />
71<br />
7<br />
55 7<br />
8 Overflows/yr<br />
$1,200<br />
2 49 57 1243 Overflows/yr25 3<br />
$1,000<br />
2 42 51 41 24 3<br />
4 1 40 50 40 24 3<br />
9<br />
$800<br />
15<br />
8 12<br />
1 31 24 40 34 23 3<br />
1 19 30 36 32 23 3<br />
$600<br />
0 29 35 31 Pump 23 Sta Rehab<br />
No Phase I <strong>Control</strong>s<br />
3<br />
0 28 34 31 23 3<br />
$400<br />
0 28 34 31 23 3<br />
$200<br />
1 Phase 43 I <strong>Control</strong>s 55 43 25 3<br />
43<br />
56 53<br />
43<br />
$0<br />
74<br />
90<br />
0 10 0 20 6 30 10 407 50 2 60 0<br />
0 4 8 6 1 0<br />
70 80 90 100<br />
0 4 7 # 6Days of 1Impact<br />
0<br />
0 2 4 4 1 0<br />
Cost vs. Days Dissolved Oxygen Less than Indicated Value at<br />
RFK Stadium<br />
# Days D.O. < 2.0 mg/L # Days D.O. < 4.0 mg/L # Days D.O.< 5.0 mg/L<br />
Capital Cost ($M)<br />
$1,800<br />
$1,600<br />
$1,400<br />
$1,200<br />
$1,000<br />
$800<br />
$600<br />
$400<br />
$200<br />
$0<br />
3<br />
3<br />
4<br />
4<br />
67<br />
6<br />
8 Overflows/yr<br />
32<br />
31<br />
31<br />
31<br />
34<br />
0 Overflows/yr<br />
2 Overflows/yr<br />
4 Overflows/yr<br />
12 Overflows/yr Pump Sta Rehab<br />
Phase I <strong>Control</strong>s<br />
41 4043<br />
0 10 20 30 40 50 60 70 80 90 100<br />
# Days/yr<br />
73<br />
No Phase I <strong>Control</strong>s<br />
71<br />
71<br />
72<br />
76<br />
82 83<br />
88<br />
\\Gh-wash\ENG 1160\LTCP\LTCP Final\[LTCP_9_Graphs.xls]Pot-Graph<br />
9-30
Selection of Draft LTCP<br />
9.6 ROCK CREEK ALTERNATIVES<br />
9.6.1 Sensitive Areas<br />
9.6.1.1 Background<br />
As described in Section 2, portions of Rock Creek area may be classified as sensitive areas due to the<br />
presence of the endangered Hay’s Spring Amphipod. The Hay’s Spring Amphipod (Stygobromus<br />
hayi) is a federally listed endangered species which is reported to occur in Rock Creek at two<br />
locations: south of Military Road approximately between Nicholson and Emerson Streets, NW and<br />
approximately between the National Zoo and the Connecticut Avenue Bridge (See Figure 9-4).<br />
These are the only known locations of the amphipod in the country. The amphipod is a small<br />
crustacean (resembling a tiny shrimp) about one-quarter inch long that lives in decaying deciduous<br />
leaf litter and mud at the exit of springs and groundwater seeps. The springs in Rock Creek are<br />
reported to issue forth from crevices in rocks. The species is believed to feed on decaying leaves,<br />
organic matter and decomposer bacteria and fungi found on organic matter. The species was first<br />
discovered in 1938, and was listed in 1982. One of the reasons for its listing was reportedly its<br />
vulnerability to extinction due to its extremely restricted distribution. Little is known about the<br />
species, but it is reported to be adversely affected by high water flows/flooding in Rock Creek,<br />
pollution of the groundwater and surface water, and siltation (USFWS, 2000a, 2000b).<br />
At the reported location in the vicinity of the Zoo, the amphipod is reportedly located above the<br />
normal flow level in Rock Creek. At this location, the amphipod may only be exposed to the creek<br />
during flooding conditions. In the area south of Military Road , the amphipod is reportedly located in<br />
several locations, some of which are exposed to slightly elevated creek flows.<br />
For areas classified as sensitive, the CSO policy indicates the LTCP should:<br />
Prohibit new or significantly increased overflows; Eliminate or relocate overflows wherever<br />
physically possible and economically achievable, except where elimination or relocation<br />
would provide less environmental protection than additional treatment;or, where elimination<br />
or relocation is not physically possible and economically achievable, or would provide less<br />
environmental protection than additional treatment, provide the level of treatment for<br />
remaining overflows deemed necessary to meet WQS for full protection of existing and<br />
designated uses. (EPA, 1994)<br />
9.6.1.2 Amphipod Locations Near Military Road<br />
The only CSO upstream of the reported amphipod location near the zoo is CSO 059, Luzon Valley.<br />
This CSO drainage area has been almost completely separated (over 99%). It is believed that there<br />
may be a few remaining connections at Walter Reed Army Medical Center. Whether or not the<br />
amphipod’s habitat is classified as a sensitive area, the most practical and economical control is to<br />
complete separation. Investigation of possible connections at Walter Reed Army Medical Center and<br />
\\Gh-wash\ENG 1160\LTCP\LTCP Final\Sec 9.doc 9-31 FINAL - July 2002
completion of separation as required is recommended for CSO 059.<br />
Selection of Draft LTCP<br />
9.6.1.3 Amphipod Location Near National Zoo<br />
The discharge frequency and volume in the average year, for Scenario C3 (Phase I <strong>Control</strong>s and<br />
Pump Station Rehabilitation) for CSOs located upstream of the reported amphipod location at the<br />
Zoo are listed in Table 9-10.<br />
Table 9-10<br />
Predicted CSO Overflow Volume and Frequency for CSOs Upstream of Amphipod at Zoo<br />
(Average Year - Average of 1988-1990)<br />
CSO NPDES No. Description No. Overflows /yr CSO Overflow Volume (mg/yr)<br />
041 Ontario Rd 0 0.00<br />
042 Quarry Rd 0 0.00<br />
043 Irving St. 1 0.15<br />
044 Kenyon St. 0 0.00<br />
045 Lamont St. 2 0.03<br />
046 Park Road 2 0.01<br />
047 Ingleside Terr. 3 0.25<br />
048 Oak St-Mt Pleasant 2 0.08<br />
049 Piney Branch 25 39.73<br />
Total 40.25<br />
Piney Branch is the only CSO with a discharge frequency more than four times per year and with a<br />
discharge volume of more than 0.3 million gallons per year. In accordance with the CSO Policy, the<br />
following alternatives are considered:<br />
Separation – Separation of CSOs 041 through 049 would entail separating approximately<br />
2,662 acres of combined sewer area. The estimated capital cost is $515 million (Year 2001,<br />
ENR = 6383). Section 12 addresses WASA's financial capability. Considering the<br />
conclusion of that section and the relatively small overflow volume, separation is not<br />
economically achievable or practical.<br />
Relocation – The only feasible places to relocate the CSOs are to Rock Creek downstream of<br />
the reported amphipod location, or all the way to the Potomac River. Both Rock Creek and<br />
the Potomac are designated as Class A waters with primary contact recreation. Thus<br />
relocation of the outfalls would shift the problem away from the amphipods but cause<br />
additional problems due to potential human contact. In addition, preliminary sizing indicates<br />
a 25’ to 30’ diameter conveyance system would be needed to convey the 15 year storm<br />
downstream. Conveyance facilities of this size would consist of a tunnel. Because of its<br />
depth, the tunnel would not dewater by gravity and would require a pump station. The<br />
\\Gh-wash\ENG 1160\LTCP\LTCP Final\Sec 9.doc 9-33 FINAL - July 2002
Selection of Draft LTCP<br />
<br />
capital cost of such a project is estimated to be approximately $277 million (Year 2001, ENR<br />
= 6383). This project would provide more environmental disruption and is not economically<br />
viable for the benefits obtained.<br />
Treatment – the outfalls are located at the bottom of a steep valley formed by Rock Creek.<br />
The adjacent land is limited and owned by the National Park Service. Treatment is not a<br />
viable alternative.<br />
Given that separation, relocation and treatment are not feasible, the remaining alternative under the<br />
policy is to provide the level of control necessary to meet water quality standards and protect<br />
designated uses. This is addressed in the following sections with the alternatives for Rock Creek.<br />
9.6.2 Description<br />
There are 29 CSO outfalls to Rock Creek. Of these, 13 are predicted to overflow in the average year,<br />
under Scenario C3 (Phase I <strong>Control</strong>s and Pump Station Rehabilitation), as shown in Table 9-11.<br />
Table 9-11<br />
Rock Creek CSO Outfalls with Predicted Discharges During Average Year<br />
CSO NPDES No. Description No. Overflows No. /yr CSO Overflow Volume (mg)<br />
031 Penn Ave 9 0.22<br />
033 N St. - 25th St 6 4.48<br />
036 Mass Ave & 24 th 29 1.64<br />
037 Kalorama Circle West 3 0.05<br />
040 Biltmore St 1 0.03<br />
043 Irving St. 1 0.15<br />
045 Lamont St. 2 0.03<br />
046 Park Road 2 0.01<br />
047 Ingleside Terr. 3 0.25<br />
048 Oak St-Mt Pleasant 2 0.08<br />
049 Piney Branch 25 39.73<br />
057 Cleveland – 28th St & Conn. Ave 15 2.33<br />
059 Luzon Valley 87 171.56 1<br />
Rock Creek Subtotal (Including Luzon Valley) 221<br />
Rock Creek Subtotal (Excluding Luzon Valley) 49<br />
Notes: 1. Luzon Valley is almost completely separated (over 99%). This discharge volume is thus essentially storm<br />
water.<br />
Each of the CSOs that have discharge frequencies of more than 4 per year are addressed below. In a<br />
subsequent section, the rationale for the selection of the 4 per year threshold is addressed.<br />
<br />
CSO 059 (CSO 059) - as indicated above, completion of separation is recommended for<br />
Luzon Valley.<br />
\\Gh-wash\ENG 1160\LTCP\LTCP Final\Sec 9.doc 9-34 FINAL - July 2002
Selection of Draft LTCP<br />
<br />
<br />
<br />
<br />
CSO 049 (Piney Branch) - the reason Piney Branch overflows is inadequate conveyance<br />
capacity between the outfall and the Potomac Pumping Station. Improvement of this<br />
conveyance capacity is impractical for two reasons: 1). the long distance to Potomac<br />
Pumping Station, and 2) if the conveyance capacity were improved, the transfer of flow<br />
would increase the overflow at Potomac Pumping Station. Because of the relatively small<br />
storage volume required, local storage in the form a tunnel is practical. The tunnel could be<br />
constructed between the outfall and Rock Creek in the embankment north of Piney Branch<br />
parkway. Because the grade of the embankment is high, the tunnel can dewater by gravity to<br />
existing sewer after overflow conditions cease.<br />
CSO 036 and CSO 057- these outfalls are predicted to overflow because of inadequate<br />
diversion capacity. Revisions to the regulator settings are predicted to reduce overflows to<br />
the four per year level.<br />
CSO 037 and 047 – While these outfalls are predicted to overflow at a frequency of less than<br />
4 per year, it was determined that it was necessary to reduce overflows even further to reduce<br />
the frequency of overflows to Rock Creek as a system to the 4 per year level. Regulator<br />
improvements can accomplish this.<br />
CSO 031 and 033 – these outfalls are located south of N Street NW in the flat section of<br />
Rock Creek. The outfalls are predicted to overflow because of surcharging in the Rock<br />
Creek Main Interceptor (RCMI) and because of low dam settings in the regulators. Options<br />
for reducing these overflows include:<br />
o Providing an overflow connection from the RCMI to the proposed Potomac Storage<br />
Tunnel. This would serve to limit the hydraulic grade line in the RCMI and limit<br />
overflows.<br />
o Constructing a relief sewer parallel to the RCMI. A large part of this sewer would<br />
likely be in tunnel due to the topography.<br />
The alternative controls for each CSO have been assembled into the control plan options for Rock<br />
Creek listed below. Figure 9-5 shows the major features of the alternatives.<br />
<br />
Alternative A-1: this consists of the following:<br />
o Complete separation of CSO 059, Luzon Valley<br />
o Storage tunnel at CSO 049, Piney Branch<br />
o Regulator revisions for CSO 036, 037, 047, and 057<br />
o Relief of Rock Creek Main Interceptor via overflow to proposed Potomac storage<br />
tunnel and regulator reconstruction for CSO 031 and CSO 033<br />
\\Gh-wash\ENG 1160\LTCP\LTCP Final\Sec 9.doc 9-35 FINAL - July 2002
Selection of Draft LTCP<br />
<br />
Alternative A-2: same as Alternative A-1, with LID-R<br />
<br />
Alternative B-1: this is identical to A-1, except that the relief of the Rock Creek Main<br />
interceptor is achieved by constructing a relief sewer parallel to the RCMI.<br />
<br />
Alternative B-2: same as Alternative B-1, with LID-R<br />
The sizing of major facilities for each alternative is summarized in Table 9-12<br />
Table 9-12<br />
Facility Sizing: Rock Creek Final Alternatives<br />
# CSO Overflows per Average Year<br />
0 1 2 4 8 12<br />
Annual CSO Overflow Volume per Average Year<br />
No. Facility Sizes for Indicated Level of CSO <strong>Control</strong> 0 mg 9 mg 13 mg 22 mg 28 mg<br />
A-1 Piney Branch Storage Tunnel<br />
Length, (ft)<br />
Diameter, (ft)<br />
Storage Volume, (mg)<br />
Separate CSO 059; Reconstruct Regulators for CSO<br />
031, 033, 036, 037, 047 and 057; Relieve RCMI to<br />
proposed Potomac Tunnel,<br />
A-2<br />
B-1<br />
B-2<br />
Same as A-1, but with LID-R<br />
Piney Branch Storage Tunnel,<br />
Length, (ft)<br />
Diameter, (ft)<br />
Storage Volume, (mg)<br />
Same as A-1, but with Relief <strong>Sewer</strong> for Rock Creek<br />
Main Interceptor<br />
Diameter, (ft)<br />
Length, (in)<br />
Same as B-1, but with LID-R<br />
10,000’<br />
28’<br />
46.0<br />
10,000’<br />
27.75’<br />
45.2<br />
3,200’<br />
108”<br />
Same as<br />
A-2<br />
2,900’<br />
16.5’<br />
4.6<br />
2,900’<br />
14.75’<br />
3.7<br />
3,200’<br />
84”<br />
Same as<br />
A-2<br />
2,900’<br />
14’<br />
3.3<br />
2,900’<br />
11.75’<br />
2.4<br />
3,200’<br />
72”<br />
Same as<br />
A-2<br />
2,900’<br />
7.5’<br />
1.0<br />
2,900’<br />
5.25’<br />
0.5<br />
3,200’<br />
60”<br />
Same as<br />
A-2<br />
2,900’<br />
4.75’<br />
0.4<br />
2,900’<br />
3.25’<br />
0.2<br />
3,200’<br />
48”<br />
Same as<br />
A-2<br />
Notes:<br />
1. Zero overflows for all storms during analysis period 1988-1990. There will still be overflows under other climatic conditions<br />
9.6.3 Remaining Overflows<br />
The overflows predicted to remain after implementation of controls designed to reduce CSO<br />
overflows to between zero and 12 events per average year are summarized in Table 9-13. The<br />
procedure that was applied to the Anacostia River CSOs was used for the Rock Creek CSOs.<br />
\\Gh-wash\ENG 1160\LTCP\LTCP Final\Sec 9.doc 9-37 FINAL - July 2002
Selection of Draft LTCP<br />
Table 9-13<br />
Remaining CSO Overflows - Rock Creek (Average of 1988-1990)<br />
# CSO Events/Average Year<br />
0 1 2 4 8 12<br />
CSO<br />
No. Description<br />
#<br />
Events<br />
Vol.<br />
(mg)<br />
#<br />
Events<br />
Vol.<br />
(mg)<br />
#<br />
Events<br />
Vol.<br />
(mg)<br />
#<br />
Events<br />
Vol.<br />
(mg)<br />
#<br />
Events<br />
Vol.<br />
(mg)<br />
031 Penn Ave - - 2 0.02 3 0.02 3 0.03 3 0.03<br />
033 N St. - 25th St - - 2 1.18 3 1.18 3 1.32 3 1.37<br />
036 Mass Ave & 24 th<br />
St. 2 0.27 3 0.29 3 0.3 3 0.31<br />
037 Kalorama Cir W. - - 4 0.36 - - - -<br />
039 Conn. Ave - - 1 0.02 1 0.02 1 0.03 1 0.03<br />
040 Biltmore St - - 1 0.05 1 0.05 1 0.06 1 0.06<br />
043 Irving St. 1 0.29 1 0.26 1 0.31 1 0.31<br />
044 Kenyon St &<br />
Beach Dr. 1 0.01 1 0.01 1 0.02 1 0.01<br />
045 Lamont St. 2 0.03 4 0.76 2 0.03 2 0.03<br />
046 Park Road 2 0.01 2 0.01 2 0.01 2 0.01<br />
047 Ingleside Terr. - - 1 0.02 1 0.01 1 0.02 1 0.02<br />
048 Oak St-Mt<br />
Pleasant 2 0.15 2 0.14 2 0.16 2 0.16<br />
049 Piney Branch 2 6.3 4 9.1 8 19.1 12 25.5<br />
057 Cleveland - 28th<br />
St & Conn. Ave - - 2 0.38 2 0.38 2 0.39 2 0.39<br />
Total - 9 13 22 28<br />
1. Zero overflows for all storms during analysis period 1988-1990. There will still be overflows under other climatic conditions<br />
9.6.4 Ability to Meet <strong>Water</strong> Quality Standards<br />
9.6.4.1 Fecal Coliform<br />
Rock Creek is a free-flowing stream that is unaffected by the tide for the majority of its length. The<br />
stream is naturally aerated by turbulence as it flows over the irregular bottom of the creek bed. There<br />
is no evidence of dissolved oxygen problems in Rock Creek. Bacteriological concentrations are the<br />
primary concerns in Rock Creek.<br />
Rock Creek is shallow and its banks are not very steep in many places. Parks, trails and walking<br />
paths parallel the creek for its entire length in the District. While primary contact recreation is<br />
prohibited in Rock Creek by District law, occasional wading in the creek has been observed,<br />
particularly in the summer.<br />
Fecal coliform concentrations in Rock Creek are predicted to be above the Class A monthly<br />
geometric mean standard of 200/100ml every month in the average year. Concentrations are<br />
predicted to be above the Class B standard of 1,000/100ml three to six months out of the year. The<br />
majority of the load comes from District storm water and the upstream sources. The volume of water<br />
in Rock Creek in any particular reach is relatively small. As a result, it is not able to absorb<br />
significant wet weather loads without causing relatively high concentrations in the creek. The free<br />
flowing nature of the creek causes relatively short residence time of wet weather pollution. Even<br />
under small rain storms, the creek can flush itself in 8 to 12 hours after a wet weather event.<br />
\\Gh-wash\ENG 1160\LTCP\LTCP Final\Sec 9.doc 9-38 FINAL - July 2002
Selection of Draft LTCP<br />
The effect of varying levels of CSO control on fecal coliform levels was evaluated for the entire<br />
calendar year as well as for the period of most likely contact, May through September. In addition to<br />
evaluating the effects of CSO control, the upstream and separate storm water loads were also reduced<br />
as described earlier in this section. Complete results are included in Appendix D. Selected results<br />
are shown in Table 9-14.<br />
Table 9-14<br />
Effect of CSO <strong>Control</strong> On Fecal Coliform in Rock Creek<br />
M Street Zoo <strong>DC</strong>/MD Boundary<br />
Existing SSWS<br />
and Upstream<br />
Loads<br />
Reduced SSWS<br />
and Upstream<br />
Loads 1<br />
Existing SSWS<br />
and Upstream<br />
Loads<br />
Reduced SSWS<br />
and Upstream<br />
Loads 1<br />
Existing SSWS<br />
and Upstream<br />
Loads<br />
Reduced SSWS<br />
and Upstream<br />
Loads 1<br />
Parameter<br />
All<br />
Year<br />
May to<br />
Sept.<br />
All<br />
Year<br />
May to<br />
Sept.<br />
All<br />
Year<br />
May to<br />
Sept.<br />
All<br />
Year<br />
May to<br />
Sept.<br />
All<br />
Year<br />
May to<br />
Sept.<br />
All<br />
Year<br />
May to<br />
Sept.<br />
# Months Exceeding Class A Fecal Coliform Standard<br />
No CSO <strong>Control</strong> 12 5 12 5 12 5 12 5 12 5 0 0<br />
Phase 1 <strong>Control</strong>s 12 5 12 5 12 5 12 5 12 5 0 0<br />
Pump Sta. Rehab. 12 5 12 5 12 5 12 5 12 5 0 0<br />
12 Overflows/yr 12 5 12 5 12 5 12 5 12 5 0 0<br />
8 Overflows/yr 12 5 12 5 12 5 12 5 12 5 0 0<br />
4 Overflows/yr 12 5 12 5 12 5 12 5 12 5 0 0<br />
2 Overflows/yr 12 5 12 5 12 5 12 5 12 5 0 0<br />
0 Overflows/yr 2 12 5 12 5 12 5 12 5 12 5 0 0<br />
Separation 12 5 12 5 12 5 12 5 12 5 0 0<br />
# Days Fecal Coliform > 200/100 ml<br />
No CSO <strong>Control</strong> 264 108 171 75 294 119 174 77 365 153 4 2<br />
Phase 1 <strong>Control</strong>s 264 108 171 75 294 119 174 77 365 153 4 2<br />
Pump Sta. Rehab. 264 108 171 75 294 119 174 77 365 153 4 2<br />
12 Overflows/yr 264 108 170 75 294 119 173 77 365 153 4 2<br />
8 Overflows/yr 264 108 170 75 294 119 173 77 365 153 4 2<br />
4 Overflows/yr 264 108 170 75 294 119 173 77 365 153 4 2<br />
2 Overflows/yr 264 108 170 75 294 119 173 77 365 153 4 2<br />
0 Overflows/yr 2 264 108 170 75 294 119 173 77 365 153 4 2<br />
Separation 295 120 234 99 312 125 224 97 365 153 1 1<br />
# Days Fecal CSO Impact<br />
No CSO <strong>Control</strong> 26 17 N/A N/A 22 14 N/A N/A 0 0 N/A N/A<br />
Phase 1 <strong>Control</strong>s 26 17 N/A N/A 22 14 N/A N/A 0 0 N/A N/A<br />
Pump Sta. Rehab. 26 17 N/A N/A 22 14 N/A N/A 0 0 N/A N/A<br />
12 Overflows/yr 10 7 N/A N/A 11 8 N/A N/A 0 0 N/A N/A<br />
8 Overflows/yr 7 5 N/A N/A 7 5 N/A N/A 0 0 N/A N/A<br />
4 Overflows/yr 4 3 N/A N/A 3 2 N/A N/A 0 0 N/A N/A<br />
2 Overflows/yr 3 2 N/A N/A 2 1 N/A N/A 0 0 N/A N/A<br />
0 Overflows/yr 2 0 0 N/A N/A 0 0 N/A N/A 0 0 N/A N/A<br />
Separation 0 0 N/A N/A 0 0 N/A N/A 0 0 N/A N/A<br />
Notes:<br />
1. Separate storm water load reduced by 40%. Upstream nutrients reduced by 40%. Upstream fecal coliform<br />
reduced to 80% of water quality standards or 160 organism/100ml.<br />
2. Zero overflows for all storms during analysis period 1988-1990. There will still be overflows under other<br />
climatic conditions.<br />
The following observations are made:<br />
\\Gh-wash\ENG 1160\LTCP\LTCP Final\Sec 9.doc 9-39 FINAL - July 2002
Selection of Draft LTCP<br />
<br />
<br />
<br />
<br />
<br />
The monthly fecal coliform geometric mean is most affected by the boundary conditions.<br />
Transient wet weather pollution sources like CSOs have less impact on the geometric mean.<br />
This is particularly true because the magnitude of CSO discharges to Rock Creek is small.<br />
Rock Creek is predicted to exceed the Class A standard every month of the year. Providing a<br />
high degree of CSO control of between zero and 12 overflows per year still will not enable<br />
the standard to be met.<br />
CSO control does not have a large effect on the geometric mean. In May (the wet month),<br />
the predicted fecal geometric mean at the zoo is 1313. Reducing overflows to 12 and 2 per<br />
year change the predicted geometric mean to 1,276 and 1,233, respectively.<br />
CSOs can affect the hourly or daily concentrations of fecal coliform in Rock Creek. Because<br />
the travel time in Rock Creek is so short, the number of days CSOs impact the Creek is a<br />
function of the number of overflows. As shown in the table, reducing overflows to 4 per<br />
year, reduces the number of days of impact to 3 days. Reducing overflows to 2 per year,<br />
reduces the days of impact to 2 days per year.<br />
Separation produces worse water quality than a high degree of CSO control because a large<br />
amount of storm water is treated in the combined sewer system.<br />
9.6.4.2 E. Coli<br />
As with fecal coliform, the effect of varying levels of CSO control on e. coli concentrations was<br />
analyzed. Complete data is presented in Appendix D, while selected results are shown in Table 9-15.<br />
The e. coli and fecal coliform results track each other very closely and the observations made for<br />
fecal coliform apply to e. coli.<br />
\\Gh-wash\ENG 1160\LTCP\LTCP Final\Sec 9.doc 9-40 FINAL - July 2002
Table 9-15<br />
Effect of CSO <strong>Control</strong> On E. Coli in Rock Creek<br />
Existing SSWS<br />
and Upstream<br />
Loads<br />
Selection of Draft LTCP<br />
M Street Zoo <strong>DC</strong>/MD Boundary<br />
Reduced SSWS<br />
and Upstream<br />
Loads 1<br />
Existing SSWS<br />
and Upstream<br />
Loads<br />
Reduced SSWS<br />
and Upstream<br />
Loads 1<br />
Existing SSWS<br />
and Upstream<br />
Loads<br />
Reduced SSWS<br />
and Upstream<br />
Loads 1<br />
All<br />
Year<br />
May to<br />
Sept.<br />
All<br />
Year<br />
May to<br />
Sept.<br />
All<br />
Year<br />
May to<br />
Sept.<br />
All<br />
Year<br />
May to<br />
Sept.<br />
All<br />
Year<br />
May to<br />
Sept.<br />
All<br />
Year<br />
May to<br />
Sept.<br />
Parameter<br />
# Months Exceeding 126/100 ml Geometric Mean<br />
No Phase 1 <strong>Control</strong>s 12 5 12 2 12 5 12 3 12 5 0 0<br />
Phase 1 <strong>Control</strong>s 12 5 12 2 12 5 12 3 12 5 0 0<br />
Pump Sta. Rehab. 12 5 12 2 12 5 12 3 12 5 0 0<br />
12 Overflows/yr 12 5 12 2 12 5 12 3 12 5 0 0<br />
8 Overflows/yr 12 5 12 2 12 5 12 3 12 5 0 0<br />
4 Overflows/yr 12 5 12 2 12 5 12 2 12 5 0 0<br />
2 Overflows/yr 12 5 12 2 12 5 12 2 12 5 0 0<br />
0 Overflows/yr 2 12 5 12 2 12 5 12 2 12 5 0 0<br />
Separation 12 5 12 5 12 5 12 5 12 5 0 0<br />
# Days E. Coli > 126/100 ml<br />
No Phase 1 <strong>Control</strong>s 331 132 169 75 362 153 171 75 365 153 4 2<br />
Phase 1 <strong>Control</strong>s 331 132 169 75 362 153 171 75 365 153 4 2<br />
Pump Sta. Rehab. 331 132 169 75 362 153 171 75 365 153 4 2<br />
12 Overflows/yr 331 132 168 75 362 153 170 75 365 153 4 2<br />
8 Overflows/yr 331 132 168 75 362 153 170 75 365 153 4 2<br />
4 Overflows/yr 331 132 168 75 362 153 170 75 365 153 4 2<br />
2 Overflows/yr 331 132 168 75 362 153 170 75 365 153 4 2<br />
0 Overflows/yr 2 331 132 168 75 362 153 170 75 365 153 4 2<br />
Separation 337 135 232 99 363 153 220 95 365 153 1 1<br />
# Days E. Coli CSO Impact (>126/100 ml)<br />
No Phase 1 <strong>Control</strong>s 26 18 N/A N/A 23 14 N/A N/A 0 0 N/A N/A<br />
Phase 1 <strong>Control</strong>s 26 18 N/A N/A 23 14 N/A N/A 0 0 N/A N/A<br />
Pump Sta. Rehab. 26 18 N/A N/A 23 14 N/A N/A 0 0 N/A N/A<br />
12 Overflows/yr 10 7 N/A N/A 12 8 N/A N/A 0 0 N/A N/A<br />
8 Overflows/yr 7 5 N/A N/A 7 5 N/A N/A 0 0 N/A N/A<br />
4 Overflows/yr 4 3 N/A N/A 4 2 N/A N/A 0 0 N/A N/A<br />
2 Overflows/yr 3 2 N/A N/A 2 1 N/A N/A 0 0 N/A N/A<br />
0 Overflows/yr 2 0 0 N/A N/A 0 0 N/A N/A 0 0 N/A N/A<br />
Separation 0 0 N/A N/A 0 0 N/A N/A 0 0 N/A N/A<br />
# Days E. Coli CSO Impact (>576/100 ml)<br />
No Phase 1 <strong>Control</strong>s 16 11 N/A N/A 14 9 N/A N/A 0 0 N/A N/A<br />
Phase 1 <strong>Control</strong>s 16 11 N/A N/A 14 9 N/A N/A 0 0 N/A N/A<br />
Pump Sta. Rehab. 16 11 N/A N/A 14 9 N/A N/A 0 0 N/A N/A<br />
12 Overflows/yr 9 6 N/A N/A 10 7 N/A N/A 0 0 N/A N/A<br />
8 Overflows/yr 6 4 N/A N/A 6 4 N/A N/A 0 0 N/A N/A<br />
4 Overflows/yr 2 1 N/A N/A 2 1 N/A N/A 0 0 N/A N/A<br />
2 Overflows/yr 2 1 N/A N/A 2 1 N/A N/A 0 0 N/A N/A<br />
0 Overflows/yr 2 0 0 N/A N/A 0 0 N/A N/A 0 0 N/A N/A<br />
Separation 0 0 N/A N/A 0 0 N/A N/A 0 0 N/A N/A<br />
Notes:<br />
1. Separate storm water load reduced by 40%. Upstream nutrients reduced by 40%. Upstream fecal coliform reduced to<br />
80% of water quality standards or 160 organism/100ml.<br />
2. Zero overflows for all storms during analysis period 1988-1990. There will still be overflows under other climatic<br />
conditions.<br />
\\Gh-wash\ENG 1160\LTCP\LTCP Final\Sec 9.doc 9-41 FINAL - July 2002
Selection of Draft LTCP<br />
9.6.5 Non-Monetary Factors<br />
With the exception of Northeast Boundary Flooding, the same non-monetary factors that were<br />
evaluated for the Anacostia River were assessed for Rock Creek<br />
Table 9-16 summarizes the non-monetary evaluations for each alternative.<br />
Table 9-16<br />
Non-Monetary Evaluation Factors: Rock Creek River Final Alternatives<br />
No.<br />
Alternative<br />
A-1 Piney Branch Storage Tunnel; Separate<br />
CSO 059; Reconstruct Regulators for<br />
CSO 031, 033, 036 and 057; Relieve<br />
RCMI to proposed Potomac Tunnel<br />
Public<br />
Acceptance<br />
Ability to<br />
Implement<br />
Reliability<br />
Ease of<br />
Operation<br />
Ease of<br />
Maintenance<br />
Ability to<br />
Upgrade<br />
Good Excellent Excellent Excellent Good Moderate<br />
A-2 Same as A-1, but with LID-R Good Uncertain Uncertain Excellent Uncertain Moderate<br />
B-1<br />
Same as A-1, but with Relief <strong>Sewer</strong> for<br />
Rock Creek Main Interceptor<br />
Moderate Good Excellent Excellent Good Moderate<br />
B-2 Same as B-2, but with LID-R Good Uncertain Uncertain Excellent Uncertain Moderate<br />
Principle points are described below:<br />
<br />
<br />
<br />
Public Acceptance – Rock Creek Parkway and Piney Branch Parkway are major commuter<br />
thoroughfares. In addition, the walking and biking trails are heavily used throughout the year.<br />
Disruption caused by construction was an important issue for the public. The storage tunnel at<br />
Piney Branch and the regulator reconstructions will minimize disruption. Alternative B-1 entails<br />
constructing a relief sewer parallel to the Rock Creek Main Interceptor. This has the potential to<br />
cause significant disruption and it would have moderate public acceptance. For both the relief a<br />
sewer and the storage tunnel options, issues associated with right of way, construction access,<br />
disruption, and environmental impact would need to be addressed with the National Park Service.<br />
The public also expressed a strong preference for LID-R and inclusion of this is responsive to<br />
public comments.<br />
Ability to implement – Tunnels and regulators have been constructed by WASA and other CSO<br />
communities and are practical. Because of the institutional issues associated with LID-R, the<br />
ability to implement this option has been classified as uncertain.<br />
Reliability – Tunnels for storage can be designed to fill by gravity and their dewatering can be<br />
automated. The Piney Branch storage tunnel can dewater by gravity, eliminating the need for a<br />
pump station making it more reliable. Because the application of LID-R on a large scale for CSO<br />
control has not been attempted before, the long term reliability of these types of controls is<br />
unknown and has been assessed as uncertain.<br />
\\Gh-wash\ENG 1160\LTCP\LTCP Final\Sec 9.doc 9-42 FINAL - July 2002
Selection of Draft LTCP<br />
<br />
<br />
<br />
Ease of operation – The storage tunnel, regulator reconstructions and relief sewer projects<br />
operate by gravity and require practically no operation.<br />
Ease of Maintenance – Since the storage tunnel has few mechanical components and no pumping<br />
station, it is relatively easy to maintain. Reconstructed regulators would be designed to facilitate<br />
inspection and maintenance. For LID-R, the micro scale measures themselves are relatively<br />
simple to maintain. However, this item has been assessed as uncertain since the responsibility for<br />
maintenance of dispersed facilities is unclear. If those facilities are necessary for satisfactory<br />
functioning of a control plan, there would need to be an institutional system with the power to<br />
inspect and issue notices requiring corrective maintenance.<br />
Ability to Upgrade – Upgrade of the Piney Branch tunnel will be challenging. A possible<br />
solution is to extend the tunnel upstream of Piney branch. This would preserve the ability to<br />
dewater the tunnel by gravity.<br />
9.6.6 Cost Opinion<br />
The capital and operating and maintenance costs for each alternative were estimated and the net<br />
present worth was calculated in order to compare options. The net present worth was calculated<br />
using the same assumptions used for the Anacostia evaluations.<br />
For LID-R, there is a significant cost associated with its implementation that would be borne by<br />
others. Preliminary estimates indicate that applying LID-R over 15% of the impervious land area in<br />
the District would cost about $453 million. This cost could be reduced if the construction is coupled<br />
with existing redevelopment. In addition, costs could decrease as LID-R measures become more<br />
common and contractors and developers become more experienced in their application. Cost<br />
opinions for each alternative are summarized in Table 9-17.<br />
Table 9-17<br />
Cost Opinion: Rock Creek Final Alternatives (ENR = 6383)<br />
Cost to WASA<br />
No.<br />
Alternative<br />
# of<br />
Overflows<br />
/yr<br />
Capital Cost<br />
($M)<br />
Annual O &M<br />
($M/yr)<br />
20 Year Net<br />
Present Worth<br />
($M)<br />
A-1 0 $138 $1.80 $164 -<br />
Piney Branch Storage Tunnel;<br />
Separate CSO 059; Reconstruct 2 $40 $0.70 $50 -<br />
Regulators for CSO 031, 033, 036, 4 $38 $0.70 $48 -<br />
037, 047 and 057; Relieve RCMI 8 $34 $0.70 $44 -<br />
to proposed Potomac Tunnel 12 $34 $0.70 $44 -<br />
A-2 0 $137 $1.79 $163<br />
Same as A-1, but with LID-R<br />
2 $39 $0.68 $49<br />
4 $37 $0.68 $47<br />
8 $33 $0.68 $43<br />
12 $33 $0.68 $43<br />
Cost to<br />
Others<br />
Significant,<br />
see text<br />
\\Gh-wash\ENG 1160\LTCP\LTCP Final\Sec 9.doc 9-43 FINAL - July 2002
Selection of Draft LTCP<br />
Cost to WASA<br />
No.<br />
Alternative<br />
# of<br />
Overflows<br />
/yr<br />
Capital Cost<br />
($M)<br />
Annual O &M<br />
($M/yr)<br />
20 Year Net<br />
Present Worth<br />
($M)<br />
Cost to<br />
Others<br />
B-1 0 $159 $2.07 $189 -<br />
Same as A-1, but with Relief<br />
<strong>Sewer</strong> for Rock Creek Main<br />
Interceptor<br />
2 $61 $1.06 $76 -<br />
4 $57 $1.05 $72 -<br />
8 $50 $1.03 $65 -<br />
12 $47 $0.98 $61 -<br />
B-2 0 $158 $2.06 $187<br />
Same as B-2, but with LID-R<br />
2 $60 $1.04 $75<br />
4 $56 $1.03 $71<br />
8 $49 $1.01 $63<br />
Significant,<br />
see text<br />
12 $47 $0.97 $61<br />
Separation 0 $958 $3.42 $1,007 -<br />
9.6.7 Selection of Recommended Rock Creek <strong>Control</strong> <strong>Plan</strong><br />
Aside from Piney Branch, the overflows predicted for Rock Creek CSO are very small and relatively<br />
infrequent compared to other receiving waters. Modeling these infrequent and minor overflows is<br />
difficult and monitoring is recommended at these locations to confirm that overflows are actually<br />
occurring. Monitoring should be performed prior to construction of regulator improvements.<br />
Because of the uncertainty as to the ability to implement LID-R and because of the relatively low<br />
cost difference in the tunnel costs, it is recommended that LID-R be implemented but that the Piney<br />
Branch tunnel size be selected without taking advantage of the benefits of LID-R. When LID-R is<br />
implemented, the CSO controls will perform more effectively.<br />
Alternative A-1 is much more cost effective and less disruptive that Alternative B-1. If the results of<br />
the monitoring recommended above confirm the hydraulic grade line predictions in the model, then<br />
Alternative A-1 is recommended and a relief sewer parallel to the RCMI is not required. If the<br />
monitoring determines that hydraulic grade lines are higher or otherwise different than the model<br />
results, then the relief sewer proposed in Alternative B-1 may be required. Pending the results of the<br />
monitoring Alternative A-1 is recommended.<br />
Alternative A-1 may be sized to limit overflows to between zero and 12 per average year. An<br />
evaluation of the cost effectiveness of this alternative has been performed to enable selection of the<br />
proposed level of CSO control. Figure 9-6 presents the cost effectiveness of Alternative A-1. The<br />
costs associated with reducing overflows to between 12 and zero per year are plotted. Based on CSO<br />
volume reduced, the knee of the curve appears to be between zero and two overflows per year. At<br />
that point, the cost curve turns vertical, which implies increasing costs for less benefit. One overflow<br />
per year appears to be the approximate knee of the curve for CSO overflow volume.<br />
\\Gh-wash\ENG 1160\LTCP\LTCP Final\Sec 9.doc 9-44 FINAL - July 2002
District of Columbia <strong>Water</strong> and <strong>Sewer</strong> Authority<br />
<strong>Combined</strong> <strong>Sewer</strong> <strong>System</strong> <strong>Long</strong> <strong>Term</strong> <strong>Control</strong> <strong>Plan</strong><br />
Figure 9-6<br />
Rock Creek: Cost Benefit Analysis<br />
Cost vs. CSO Overflow Volume Reduction<br />
0 Overflows/yr (0 mg)<br />
100%<br />
2 Overflows/yr (9 mg)<br />
4 Overflows/yr (13 mg)<br />
8 Overflows/yr (22 mg)<br />
82% 73%<br />
12 Overflows/yr (28 mg)<br />
55%<br />
No Phase I <strong>Control</strong>s (49 mg)<br />
Phase I <strong>Control</strong>s (49 mg)<br />
Pump Sta Rehab (49 mg)<br />
43%<br />
$160<br />
$140<br />
$120<br />
$100<br />
$80<br />
$60<br />
$40<br />
$20<br />
Capital Cost ($M)<br />
100%<br />
90%<br />
80%<br />
70%<br />
60%<br />
50%<br />
40%<br />
30%<br />
20%<br />
10%<br />
$0<br />
0%<br />
0%<br />
% CSO Overflow Volume Reduction<br />
Cost vs. Days of CSO Impact on Fecal Coliforms<br />
(May - Sept)<br />
Capital Cost ($M)<br />
$160.00<br />
$140.00<br />
$120.00<br />
$100.00<br />
$80.00<br />
$60.00<br />
$40.00<br />
$20.00<br />
$-<br />
0<br />
0 Overflows/yr<br />
1<br />
1<br />
2 3 5 6 7<br />
8<br />
14<br />
M Street Zoo After Piney Branch<br />
2 Overflows/yr<br />
4 Overflows/yr<br />
8 Overflows/yr<br />
12 Overflows/yr<br />
17<br />
No Phase I <strong>Control</strong>s,<br />
Phase I <strong>Control</strong>s, and<br />
Pump Sta. Rehab<br />
0 5 10 15 20 25 30 35 40 45<br />
# Days of Impact<br />
\\Gh-wash\ENG 1160\LTCP\LTCP Final\[LTCP_9_Graphs.xls]Pot-Graph<br />
9-45
Selection of Draft LTCP<br />
In terms of fecal coliform, the ‘knee of the curve’ appears to be at approximately the two overflows<br />
per year range. For controls beyond the two overflows per year range, significant increases in cost<br />
occur for a marginal number of days gained per year.<br />
The recommended alternative for the Rock Creek <strong>System</strong> is LID-R and Alternative A-1 sized for one<br />
overflow per year.<br />
9.7 POTOMAC RIVER ALTERNATIVES<br />
9.7.1 Description<br />
Based on the preliminary alternatives evaluation, four alternatives were selected for further<br />
evaluation. They are shown on Figure 9-7 and are described below:<br />
<br />
Storage Tunnel from Georgetown to Potomac Pumping Station<br />
This consists of rehabilitating the Potomac Pumping Station to a firm capacity of 460 mgd<br />
and constructing a CSO storage tunnel. The tunnel would begin at CSO 029 west of the Key<br />
Bridge, run parallel to Georgetown, and terminate in Potomac Pumping Station. The low<br />
point of the tunnel would be at the existing Potomac Pumping Station. A new tunnel<br />
dewatering pump station would be constructed at Potomac Pump Station to dewater the<br />
tunnel. The Georgetown CSOs would overflow into the tunnel and a short pipeline would be<br />
required from Easby Point to convey CSO flow to the tunnel.<br />
For the zero overflow per year option, the storage volume becomes so large, that the diameter<br />
of the tunnel becomes too large to practically construct to obtain the necessary volume in the<br />
short length available. As a result, this option consists of extending the storage tunnel to the<br />
Main and O Street pumping station site to allow obtaining the necessary volume within a<br />
range of diameters that can practically be constructed.<br />
<br />
Low Impact Development Retrofit:<br />
As with the Anacostia CSOs, LID-R as a stand alone CSO option was not able to reduce<br />
overflows to the 2 to 12 per year range. As a result, this option consists of combining LID<br />
with the storage tunnel alternative described above.<br />
The sizing of major facilities for each alternative is summarized in Table 9-18.<br />
\\Gh-wash\ENG 1160\LTCP\LTCP Final\Sec 9.doc 9-46 FINAL - July 2002
Selection of Draft LTCP<br />
Table 9-18<br />
Facility Sizing: Potomac River Final Alternatives<br />
# CSO Overflows per Average Year<br />
0 2 4 8 12<br />
Annual CSO Overflow Volume per Average Year<br />
Facility Sizes for Indicated Level of CSO <strong>Control</strong> 0 mg 35 mg 79 mg 152 mg 256 mg<br />
Tunnel From Georgetown to Potomac<br />
Pumping Station<br />
Storage Tunnel Length and Diameter, (ft) 26,500’@ 28’ 8,500’ @ 39.25’ 8,500’ @ 34’ 8500’ @ 27’ 8500’ @ 22.5’<br />
Total <strong>System</strong> Storage Volume, (mg) 122 77 58 36 25<br />
Firm Pumping Capacities 1<br />
Existing Potomac Pumping Station (mgd)<br />
New Tunnel Dewatering Pumping Station (mgd)<br />
460<br />
Note 2<br />
460<br />
80<br />
460<br />
65<br />
460<br />
50<br />
460<br />
50<br />
Tunnel Plus Low Impact Development Retrofit<br />
Same as Tunnel from Georgetown to Potomac<br />
Pumping Station with Following Changes:<br />
Storage Tunnel Length and Diameter, (ft)<br />
Total <strong>System</strong> Storage Volume, (mg)<br />
26,500’@ 28’<br />
122<br />
8,500’ @ 38.75’<br />
75<br />
8,500’ @ 33.5’<br />
56<br />
8,500’ @ 26.25’<br />
34<br />
Notes:<br />
1. Zero overflows for all storms during analysis period 1988-1990. There will still be overflows under other climatic conditions.<br />
2. For zero overflows per year, there will be one tunnel dewatering pump station that will be part of the Anacostia system.<br />
8,500’ @ 21.5’<br />
23<br />
9.7.2 Remaining Overflows<br />
The overflows predicted to remain after implementation of controls designed to reduce CSO<br />
overflows to between zero and 12 events per average year are summarized in Table 9-19. The<br />
procedure that was applied to the Anacostia River CSOs was used for the Potomac CSOs.<br />
CSO<br />
No.<br />
Table 9-19<br />
Remaining CSO Overflows - Potomac River (Average of 1988-1990)<br />
#<br />
Events<br />
# CSO Events/Average Year<br />
0 1 2 4 8 12<br />
Vol. # Vol. # Vol. # Vol. #<br />
(mg) Events (mg) Events (mg) Events (mg) Events<br />
Description<br />
003 Bolling Air Force<br />
Base - - 1 2.0 2 9.8 2 10.1 1 2.2<br />
020 Easby Point - - 2 9.0 3 20.7 7 43.7 11 77.1<br />
021 Potomac P.S. –<br />
Slash Run - - 2 6.7 3 14.8 7 28.6 11 54.1<br />
022 I St-22 nd St NW - - 2 13.0 3 28.5 7 60.6 11 105.7<br />
023/0<br />
24<br />
West Rock Creek<br />
Diversion <strong>Sewer</strong><br />
at Georgetown - - 1 1.5 1 2.1 3 3.3 6 6.0<br />
025 - - 1 0.1 1 0.2 3 0.3 6 0.5<br />
026 - - 1 0.1 2 0.2 3 0.4 7 0.7<br />
027 Georgetown - - 1 1.3 1 2.0 3 3.2 8 6.2<br />
028 - - - - - - - - - -<br />
029<br />
- - 1 0.8 1 1.0 2 1.7 5 3.4<br />
030 Abandoned - - - - - - - - - -<br />
060 Little Falls<br />
Branch - - - - - - - - - -<br />
Total - 35 79 152 256<br />
1. Zero overflows for all storms during analysis period 1988-1990. There will still be overflows under other climatic conditions<br />
Vol.<br />
(mg)<br />
\\Gh-wash\ENG 1160\LTCP\LTCP Final\Sec 9.doc 9-48 FINAL - July 2002
Selection of Draft LTCP<br />
9.7.3 Ability to Meet <strong>Water</strong> Quality Standards<br />
9.7.3.1 Fecal Coliform<br />
The water quality of the Potomac River is much better than that in the Anacostia or Rock Creek. In<br />
the upstream reaches of the river from the Memorial Bridge to Georgetown, the class A fecal<br />
coliform geometric mean is only exceeded 1 month out of the year after rehabilitation of Potomac<br />
Pumping Station. The exceedance is by a relatively small amount. Downstream of the Memorial<br />
Bridge, no exceedances are predicted on a monthly basis. This is due both to the low pollutant loads<br />
and the size and absorption capacity of the river. Elevated levels of fecal coliform can occur on a<br />
daily basis in response to wet weather events. The sources of pollutant loads are CSOs, separate<br />
storm water and the upstream loads.<br />
The effect of varying levels of CSO control on fecal coliform levels was evaluated for the entire<br />
calendar year as well as for the period May through September. May through September is the<br />
period of most likely primary contact recreation based on ambient and water temperature. In<br />
addition to evaluating the effects of CSO control, the upstream and separate storm water loads were<br />
also reduced as described earlier in this section.<br />
Complete results are included in tabular and graphic form in Appendix C. Selected results are shown<br />
in Table 9-20.<br />
\\Gh-wash\ENG 1160\LTCP\LTCP Final\Sec 9.doc 9-49 FINAL - July 2002
Selection of Draft LTCP<br />
Table 9-20<br />
Effect of CSO <strong>Control</strong> On Fecal Coliform in Potomac River<br />
BPWWTP. Memorial Bridge <strong>DC</strong>/MD Boundary<br />
Existing SSWS<br />
and Upstream<br />
Loads<br />
Reduced SSWS<br />
and Upstream<br />
Loads 1<br />
Existing SSWS<br />
and Upstream<br />
Loads<br />
Reduced SSWS<br />
and Upstream<br />
Loads 1<br />
Existing SSWS<br />
and Upstream<br />
Loads<br />
Reduced SSWS<br />
and Upstream<br />
Loads 1<br />
All<br />
Year<br />
May to<br />
Sept.<br />
All<br />
Year<br />
May to<br />
Sept.<br />
All<br />
Year<br />
May to<br />
Sept.<br />
All<br />
Year<br />
May to<br />
Sept.<br />
All<br />
Year<br />
May to<br />
Sept.<br />
All<br />
Year<br />
May to<br />
Sept.<br />
Parameter<br />
# Months Exceeding Class A Fecal Coliform Standard<br />
No CSO <strong>Control</strong> 0 0 0 0 3 3 1 1 8 5 0 0<br />
Phase 1 <strong>Control</strong>s 0 0 0 0 2 2 1 1 8 5 0 0<br />
Pump Sta. Rehab. 0 0 0 0 1 1 0 0 8 5 0 0<br />
12 Overflows/yr 0 0 0 0 1 1 0 0 8 5 0 0<br />
8 Overflows/yr 0 0 0 0 1 1 0 0 8 5 0 0<br />
4 Overflows/yr 0 0 0 0 1 1 0 0 8 5 0 0<br />
2 Overflows/yr 0 0 0 0 1 1 0 0 8 5 0 0<br />
0 Overflows/yr 2 0 0 0 0 0 0 0 0 8 5 0 0<br />
Separation 0 0 0 0 1 1 0 0 8 5 0 0<br />
# Days Fecal Coliform > 200/100 ml<br />
No CSO <strong>Control</strong> 52 30 39 21 142 64 68 37 219 98 19 10<br />
Phase 1 <strong>Control</strong>s 48 28 39 21 138 61 61 33 219 98 19 10<br />
Pump Sta. Rehab. 48 28 38 21 133 59 54 32 219 98 19 10<br />
12 Overflows/yr 36 23 23 14 112 45 19 11 219 98 19 9<br />
8 Overflows/yr 29 20 17 10 110 44 13 8 219 98 19 9<br />
4 Overflows/yr 27 19 14 8 109 44 8 6 219 98 19 9<br />
2 Overflows/yr 26 18 12 7 109 44 5 4 219 98 19 9<br />
0 Overflows/yr 2 21 11 6 3 109 34 3 2 219 98 19 9<br />
Separation 12 7 0 0 126 42 20 11 219 98 19 9<br />
# Days Fecal CSO Impact<br />
No CSO <strong>Control</strong> 34 19 N/A N/A 57 33 N/A N/A 0 0 N/A N/A<br />
Phase 1 <strong>Control</strong>s 33 18 N/A N/A 51 30 N/A N/A 0 0 N/A N/A<br />
Pump Sta. Rehab. 31 18 N/A N/A 44 27 N/A N/A 0 0 N/A N/A<br />
12 Overflows/yr 17 11 N/A N/A 16 10 N/A N/A 0 0 N/A N/A<br />
8 Overflows/yr 12 7 N/A N/A 10 6 N/A N/A 0 0 N/A N/A<br />
4 Overflows/yr 9 6 N/A N/A 6 4 N/A N/A 0 0 N/A N/A<br />
2 Overflows/yr 7 5 N/A N/A 2 2 N/A N/A 0 0 N/A N/A<br />
0 Overflows/yr 2 0 0 N/A N/A 0 0 N/A N/A 0 0 N/A N/A<br />
Separation 0 0 N/A N/A 0 0 N/A N/A 0 0 N/A N/A<br />
Notes:<br />
1. Separate storm water load reduced by 40%. Upstream nutrients reduced by 40%. Upstream fecal coliform reduced to<br />
80% of water quality standards or 160 organism/100ml.<br />
2. Zero overflows for all storms during analysis period 1988-1990. There will still be overflows under other climatic<br />
conditions.<br />
The following observations are made:<br />
<br />
CSO control has a very small effect on the monthly geometric mean. At Georgetown, the<br />
predicted geometric mean for May (wettest month) is 221, slightly above the Class A<br />
standard. Reducing the number of CSO events from 74 per year to 12 per year reduces the<br />
\\Gh-wash\ENG 1160\LTCP\LTCP Final\Sec 9.doc 9-50 FINAL - July 2002
Selection of Draft LTCP<br />
<br />
<br />
<br />
<br />
<br />
geometric mean to 204. Reducing the number of overflows to zero per year decreases the<br />
geometric mean to 203. This is more a function of the nature of the geometric mean than of<br />
the benefit provided by CSO control.<br />
The monthly fecal coliform geometric mean is most affected by the boundary conditions.<br />
Transient wet weather pollution sources like CSOs and storm water have less impact on the<br />
geometric mean.<br />
At Georgetown and the Memorial Bridge, the monthly geometric mean is exceeded for one<br />
month for the 12 overflows per year option. The amount of the exceedance is very small. At<br />
Georgetown, the predicted concentration is 205/100ml, slightly above the standard of<br />
200/100ml. At Memorial Bridge, the exceedance is 220/100ml. The amount by which the<br />
Potomac River is exceeding the Class A Standard during this one month is small.<br />
Each CSO event appears to affect fecal coliform concentrations in the river about 1.5 days,<br />
depending on location.<br />
At twelve overflow events per average year, there are an estimated 16 days per year where<br />
CSOs are impacting fecal levels in the river at the Memorial Bridge. During the contact<br />
period (May- Sept.), there are 10 days or about 2 days per month. For eight overflow events<br />
per year, the number of days of estimated CSO impact is reduced to 10 days per calendar<br />
year and 6 days between May and September.<br />
Because the CSOs in Georgetown are very small, they have a minimal impact on the river.<br />
In the Potomac River, CSOs mostly cause transient elevations of fecal coliform levels in river<br />
reaches immediate downstream of outfalls. There is a very small impact on the geometric mean.<br />
9.7.3.2 E. Coli<br />
As with fecal coliform, the effect of varying levels of CSO control on e. coli concentrations was<br />
analyzed. Complete data is presented in Appendix C, while selected results are shown in Table 9-21.<br />
The e. coli and fecal coliform results track each other very closely and the observations made for<br />
fecal coliform apply to e. coli.<br />
\\Gh-wash\ENG 1160\LTCP\LTCP Final\Sec 9.doc 9-51 FINAL - July 2002
Selection of Draft LTCP<br />
Table 9-21<br />
Effect of CSO <strong>Control</strong> On E. Coli in Potomac River<br />
Existing SSWS and<br />
Upstream Loads<br />
BPWWTP. Memorial Bridge <strong>DC</strong>/MD Boundary<br />
Reduced SSWS Existing SSWS Reduced SSWS Existing SSWS<br />
and Upstream and Upstream and Upstream and Upstream<br />
Loads 1 Loads Loads 1 Loads<br />
Reduced SSWS<br />
and Upstream<br />
Loads 1<br />
May to All May to All May to All May to All May to All May to<br />
All Year<br />
Parameter<br />
Sept. Year Sept. Year Sept. Year Sept. Year Sept. Year Sept.<br />
# Months Exceeding 126/100 ml Geometric Mean<br />
No CSO <strong>Control</strong> 0 0 0 0 2 2 1 1 1 1 0 0<br />
Phase 1 <strong>Control</strong>s 0 0 0 0 1 1 1 1 1 1 0 0<br />
Pump Sta. Rehab. 0 0 0 0 1 1 0 0 1 1 0 0<br />
12 Overflows/yr 0 0 0 0 0 0 0 0 1 1 0 0<br />
8 Overflows/yr 0 0 0 0 0 0 0 0 1 1 0 0<br />
4 Overflows/yr 0 0 0 0 0 0 0 0 1 1 0 0<br />
2 Overflows/yr 0 0 0 0 0 0 0 0 1 1 0 0<br />
0 Overflows/yr 1 0 0 0 0 0 0 0 0 1 1 0 0<br />
Separation 0 0 0 0 0 0 0 0 1 1 0 0<br />
# Days E. Coli> 126/100 ml<br />
No CSO <strong>Control</strong> 52 29 44 23 118 57 69 39 218 98 16 8<br />
Phase 1 <strong>Control</strong>s 48 27 41 22 112 54 62 33 218 98 17 8<br />
Pump Sta. Rehab. 48 27 40 22 108 52 55 32 218 98 16 8<br />
12 Overflows/yr 34 21 26 15 82 37 20 11 218 98 16 8<br />
8 Overflows/yr 28 19 18 11 79 36 13 8 218 98 16 8<br />
4 Overflows/yr 25 16 15 9 77 36 7 6 218 98 16 8<br />
2 Overflows/yr 23 15 13 8 77 35 4 3 218 98 16 8<br />
0 Overflows/yr 1 17 11 7 4 76 34 3 2 218 98 16 8<br />
Separation 8 7 0 0 98 42 16 8 218 98 16 8<br />
# Days E. Coli CSO Impact (>126/100 ml)<br />
No CSO <strong>Control</strong> 38 21 N/A N/A 60 35 N/A N/A 0 0 N/A N/A<br />
Phase 1 <strong>Control</strong>s 38 21 N/A N/A 52 31 N/A N/A 0 0 N/A N/A<br />
Pump Sta. Rehab. 35 19 N/A N/A 46 29 N/A N/A 0 0 N/A N/A<br />
12 Overflows/yr 20 12 N/A N/A 17 10 N/A N/A 0 0 N/A N/A<br />
8 Overflows/yr 14 8 N/A N/A 10 7 N/A N/A 0 0 N/A N/A<br />
4 Overflows/yr 12 7 N/A N/A 6 5 N/A N/A 0 0 N/A N/A<br />
2 Overflows/yr 9 6 N/A N/A 3 2 N/A N/A 0 0 N/A N/A<br />
0 Overflows/yr 1 0 0 N/A N/A 0 0 N/A N/A 0 0 N/A N/A<br />
Separation 0 0 N/A N/A 0 0 N/A N/A 0 0 N/A N/A<br />
# Days E. Coli CSO Impact (>576/100 ml)<br />
No CSO <strong>Control</strong> 8 6 N/A N/A 39 24 N/A N/A 0 0 N/A N/A<br />
Phase 1 <strong>Control</strong>s 7 5 N/A N/A 36 23 N/A N/A 0 0 N/A N/A<br />
Pump Sta. Rehab. 4 3 N/A N/A 31 20 N/A N/A 0 0 N/A N/A<br />
12 Overflows/yr 1 0 N/A N/A 10 6 N/A N/A 0 0 N/A N/A<br />
8 Overflows/yr 0 0 N/A N/A 6 4 N/A N/A 0 0 N/A N/A<br />
4 Overflows/yr 0 0 N/A N/A 3 3 N/A N/A 0 0 N/A N/A<br />
2 Overflows/yr 0 0 N/A N/A 0 0 N/A N/A 0 0 N/A N/A<br />
0 Overflows/yr 1 0 0 N/A N/A 0 0 N/A N/A 0 0 N/A N/A<br />
Separation 0 0 N/A N/A 0 0 N/A N/A 0 0 N/A N/A<br />
Notes:<br />
1. Separate storm water load reduced by 40%. Upstream nutrients reduced by 40%. Upstream fecal coliform reduced to<br />
80% of water quality standards or 160 organism/100ml.<br />
2. Zero overflows for all storms during analysis period 1988-1990. There will still be overflows under other climatic<br />
conditions.<br />
\\Gh-wash\ENG 1160\LTCP\LTCP Final\Sec 9.doc 9-52 FINAL - July 2002
Selection of Draft LTCP<br />
9.7.3.3 Dissolved Oxygen<br />
The dissolved oxygen level in the Potomac River is generally very good. Fish kills have not been<br />
recently reported. The effects of varying levels of CSO control on dissolved oxygen were evaluated<br />
alone and in conjunction with control of SSWS and upstream sources. Complete results are shown<br />
in Appendix C, while summary results are shown in Table 9-22.<br />
Table 9-22<br />
Effect of CSO <strong>Control</strong> On Dissolved Oxygen in the Potomac River<br />
Existing<br />
SSWS and<br />
Upstream<br />
Loads<br />
BPWWTP Memorial Bridge <strong>DC</strong>/MD Boundary<br />
Reduced SSWS Existing SSWS Reduced SSWS Existing SSWS<br />
and Upstream and Upstream and Upstream and Upstream<br />
Loads 1 Loads Loads 1 Loads<br />
Reduced SSWS<br />
and Upstream<br />
Loads 1<br />
Parameter<br />
# Days Dissolved Oxygen
Selection of Draft LTCP<br />
<br />
<br />
<br />
For zero to 12 overflows per year, the dissolved oxygen is not predicted to be below 4 mg/L,<br />
the level at which stress in some fish begins.<br />
CSO control has a 0.2 mg/l or less effect on the minimum day dissolved oxygen.<br />
CSO control has little effect on the number of days that the predicted dissolved oxygen is less<br />
than 5.0 mg/L.<br />
9.7.4 Non-Monetary Factors<br />
With the exception of Northeast Boundary Flooding, the same non-monetary factors that were<br />
evaluated for the Anacostia River were assessed for the Potomac<br />
Table 9-23 summarizes the non-monetary evaluations for each alternative.<br />
Table 9-23<br />
Non-Monetary Evaluation Factors: Potomac River Final Alternatives<br />
No.<br />
Alternative<br />
Tunnel form Georgetown to<br />
Potomac pumping Station<br />
Low Impact Development<br />
Retrofit<br />
Public<br />
Acceptance<br />
Ability to<br />
Implement<br />
Reliability<br />
Ease of<br />
Operation<br />
Ease of<br />
Maintenance<br />
Ability to<br />
Upgrade<br />
Good Excellent Excellent Moderate Good Good<br />
Good Uncertain Uncertain Moderate Uncertain Good<br />
Principal points are described below:<br />
<br />
<br />
<br />
Public Acceptance – The Georgetown waterfront is highly developed and has a high intensity of<br />
use. No land was identified with adequate space to accommodate treatment or surface –type<br />
storage facilities. In addition, many of the roads such as Rock Creek Parkway are high traveled<br />
during rush hour. Limiting adverse impacts associated with construction and with the location of<br />
wastewater facilities is a top public priority. The tunnel options will minimize disruption and<br />
the need for significant land when compared to other options. The public also expressed a strong<br />
preference for LID-R and inclusion of this is thus responsive to public comments.<br />
Ability to implement – Tunnels and pumping stations have been constructed by other CSO<br />
communities and are practical. In addition, Metro has constructed many miles of tunnels as part<br />
of the subway system and has demonstrated the feasibility of this technology in the Washington<br />
area. Because of the institutional issues associated with LID-R described previously, the ability<br />
to implement this option has been classified as uncertain.<br />
Reliability – Deep tunnels for storage can be designed to fill by gravity and their dewatering can<br />
be automated. Because the application of LID-R on a large scale for CSO control has not been<br />
attempted before, the long term reliability of these types of controls is unknown and has been<br />
assessed as uncertain.<br />
\\Gh-wash\ENG 1160\LTCP\LTCP Final\Sec 9.doc 9-54 FINAL - July 2002
Selection of Draft LTCP<br />
<br />
<br />
<br />
Ease of operation – Since deep tunnels can be designed to fill by gravity, they are relatively easy<br />
to operate.<br />
Ease of Maintenance – Since deep tunnels have few mechanical components, they are relatively<br />
easy to maintain. Pumping facilities associated with the tunnel will require maintenance which is<br />
of comparable complexity to that already experienced by WASA. For LID-R, the micro scale<br />
measures themselves are relatively simple to maintain. However this item has been assessed as<br />
uncertain since the responsibility for maintenance of dispersed facilities is unclear. If those<br />
facilities are necessary for satisfactory functioning of a control plan, there would need to be an<br />
institutional system with the power to inspect and issue notices requiring corrective maintenance.<br />
Ability to Upgrade – Upgrade of the Potomac tunnel system could be accomplished by extending<br />
the tunnel to Main and ‘O’ Street Pumping stations to provide additional storage.<br />
9.7.5 Cost Opinion<br />
The capital and operating and maintenance costs for each alternative were estimated and the net<br />
present worth was calculated in order to compare options. The net present worth was calculated<br />
using the same assumptions used for the Anacostia and Rock Creek evaluations.<br />
For LID-R, there is a significant cost associated with its implementation that would be borne by<br />
others. Preliminary estimates indicate that applying LID-R over 15% of the impervious land area in<br />
the District would cost about $453 million. This cost could be reduced if the construction is coupled<br />
with existing redevelopment. In addition, costs could decrease as LID-R measures become more<br />
common and contractors and developers become more experienced in their application. Cost<br />
opinions for each alternative are summarized in Table 9-24. The cost of separation for the Potomac<br />
River includes the cost of separation for Rock Creek, as all Rock Creek CSO’s eventually enter the<br />
Potomac River.<br />
Table 9-24<br />
Cost Opinion: Potomac River Final Alternatives (ENR = 6383)<br />
Alternative<br />
Tunnel from<br />
Georgetown to<br />
Potomac<br />
Pumping Station<br />
With Low Impact<br />
Development<br />
Retrofit<br />
# of<br />
Overflows/<br />
yr<br />
Capital Cost<br />
($M)<br />
Cost to WASA<br />
Annual O &M<br />
($M/yr)<br />
20 Year Net<br />
Present<br />
Worth ($M)<br />
Cost to Others<br />
0 $451 $3.70 $504 -<br />
2 $279 $3.50 $329 -<br />
4 $237 $3.00 $280 -<br />
8 $185 $2.50 $221 -<br />
12 $171 $2.30 $204 -<br />
0 $451 $3.70 $504<br />
2 $274 $3.45 $323<br />
4 $234 $2.96 $277<br />
8 $182 $2.46 $217<br />
Significant, see text<br />
\\Gh-wash\ENG 1160\LTCP\LTCP Final\Sec 9.doc 9-55 FINAL - July 2002
Selection of Draft LTCP<br />
Alternative<br />
# of<br />
Overflows/<br />
yr<br />
Capital Cost<br />
($M)<br />
Cost to WASA<br />
Annual O &M<br />
($M/yr)<br />
20 Year Net<br />
Present<br />
Worth ($M)<br />
12 $167 $2.24 $199<br />
Separation 0 $1,397 $4.99 $1,469<br />
Cost to Others<br />
9.7.6 Selection of Recommended Potomac River <strong>Control</strong> <strong>Plan</strong><br />
The tunnel from Georgetown to Potomac Pumping Station is the recommended control plan for the<br />
Potomac River. As with the Anacostia River alternatives, LID-R can provide some reduction in the<br />
size of storage necessary. However, because of the uncertainty as to the ability to implement LID<br />
and because of the relatively low cost difference in the capital structures required, it is recommended<br />
that LID-R be implemented but that the storage facility be constructed without counting on the<br />
implementation of LID. When LID-R is implemented, the CSO controls will perform more<br />
effectively.<br />
The recommended storage tunnel can be sized to limit overflows to between zero and 12 per average<br />
year. An evaluation of the cost effectiveness of this alternative has been performed to enable<br />
selection of the recommended level of CSO control. Figure 9-8 presents the cost effectiveness<br />
evaluation. In terms of the percentage of CSO volume reduced, rehabilitation of Potomac Pumping<br />
Station can reduce CSOs by 30%. The costs associated with reducing overflows to between 12 and<br />
2 per year are also plotted. Based on CSO volume reduced, there appears to be a point of lessening<br />
returns (‘knee of the curve’) at about four overflows per year. At that point, the cost curve turns<br />
vertical, which implies increasing costs for less benefit.<br />
In Figure 9-8, the cost of CSO control is also plotted against the number of days that CSOs have an<br />
impact on fecal coliform levels between May and September, the period of most likely contact<br />
recreation. For controls beyond four overflows per year, a significant increase in cost occurs for a<br />
marginal number of days gained per year.<br />
The recommended alternative for the Potomac <strong>System</strong> is LID-R and the Potomac Storage Tunnel<br />
sized for four overflows per year.<br />
\\Gh-wash\ENG 1160\LTCP\LTCP Final\Sec 9.doc 9-56 FINAL - July 2002
District of Columbia <strong>Water</strong> and <strong>Sewer</strong> Authority<br />
<strong>Combined</strong> <strong>Sewer</strong> <strong>System</strong> <strong>Long</strong> <strong>Term</strong> <strong>Control</strong> <strong>Plan</strong><br />
Figure 9-8<br />
Potomac River: Cost Benefit Analysis<br />
Cost vs. CSO Overflow Volume Reduction<br />
100%<br />
0 Overflows/yr (0 mg)<br />
2 Overflows/yr (35 mg)<br />
$500<br />
$450<br />
$400<br />
97%<br />
93%<br />
86%<br />
4 Overflows/yr (79 mg)<br />
8 Overflows/yr (152 mg)<br />
76%<br />
12 Overflows/yr (256 mg)<br />
Pump Sta Rehab<br />
(639 mg)<br />
No Phase I <strong>Control</strong>s<br />
(1,063 mg)<br />
Phase I <strong>Control</strong>s<br />
(953 mg)<br />
$350<br />
$300<br />
$250<br />
$200<br />
$150<br />
$100<br />
Capital Cost ($M)<br />
40%<br />
10%<br />
0%<br />
$50<br />
$0<br />
100%<br />
90%<br />
80%<br />
70%<br />
60%<br />
50%<br />
40%<br />
30%<br />
20%<br />
10%<br />
0%<br />
% CSO Overflow Volume Reduction<br />
Cost vs. Days of CSO Impact on Fecal Coliforms (May -Sept.)<br />
Memorial Bridge<br />
Georgetown<br />
$500<br />
$450<br />
0<br />
0 Overflows/yr<br />
$400<br />
Capital Cost ($M)<br />
$350<br />
$300<br />
$250<br />
$200<br />
$150<br />
$100<br />
0<br />
0<br />
0<br />
2<br />
2<br />
2 Overflows/yr<br />
4 Overflows/yr<br />
8 Overflows/yr<br />
4<br />
6<br />
10<br />
12 Overflows/yr<br />
Phase I <strong>Control</strong>s<br />
Pump Sta Rehab<br />
No Phase I <strong>Control</strong>s<br />
$50<br />
$0<br />
4 7 8<br />
27<br />
30 33<br />
0 5 10 15 20 25 30 35<br />
# Days of Impact<br />
Cost vs. Days Dissolved Oxygen Less than Indicated Value at<br />
Confluence with Anacostia<br />
Confluence w/ Anacostia<br />
Capital Cost ($M)<br />
$500<br />
$450<br />
$400<br />
$350<br />
$300<br />
$250<br />
$200<br />
$150<br />
$100<br />
$50<br />
$0<br />
10<br />
11<br />
12<br />
12<br />
12<br />
0 Overflows/yr<br />
2 Overflows/yr<br />
4 Overflows/yr<br />
8 Overflows/yr<br />
12 Overflows/yr<br />
Pump Sta Rehab<br />
Phase I <strong>Control</strong>s<br />
No Phase I <strong>Control</strong>s<br />
14<br />
15<br />
0 5 10 15 20 25 30 35 40 45<br />
# Days of Impact<br />
\\Gh-wash\ENG 1160\LTCP\LTCP Final\[LTCP_9_Graphs.xls]Pot-Graph<br />
9-57
Selection of Draft LTCP<br />
9.8 DESCRIPTION OF DRAFT LTCP<br />
In June 2001, after extensive study, WASA released a Draft LTCP to regulatory agencies and the<br />
public for review and comment. The plan provided for reducing CSOs in the average year to 4 per<br />
year in the Anacostia, 12 per year on the Potomac and 4 per year on Rock Creek. The plan provided<br />
for a 92% overall reduction in CSO volume with the highest reduction of 95.5% for the Anacostia<br />
River. The cost of the plan was estimated to be $1.05 billion (year 2001 dollars), with an<br />
implementation schedule of 20 years. Elements of the plan benefiting the Anacostia River were<br />
accelerated in the schedule for completion in 14 years.<br />
The following summarizes the major components of the Draft LTCP:<br />
<br />
<strong>System</strong> Wide <strong>Control</strong>s - WASA recommended the implementation of Low Impact<br />
Development Retrofit (LID-R) in the District. Since WASA does not control development or<br />
redevelopment in the District, WASA could mandate application of LID-R. As a result,<br />
WASA committed to incorporating LID-R techniques into new construction or reconstruction<br />
on WASA facilities, where applicable. In addition, WASA recommended that the District<br />
Government develop and adopt the necessary laws and regulations to enable implementation<br />
of LID-R.<br />
<br />
Anacostia River Components - The control measures selected for the Anacostia River were<br />
predicted to limit overflows to four events per average year. During the three year analysis<br />
period (1988-1990), the frequency of overflow ranged from two per year to six per year for<br />
dry and wet years, respectively. The controls were selected to make maximum use of<br />
existing facilities and to provide supplemental storage via a tunnel to control overflows.<br />
Major elements of the controls included the rehabilitation of Main, ‘O’ Street, and Eastside<br />
pumping stations, construction of a storage/conveyance tunnel from Poplar Point to Northeast<br />
Boundary and construction of a pipeline from Fort Stanton to Poplar Point to address the<br />
CSOs on the east side of the Anacostia. An additional leg of the tunnel was proposed to be<br />
constructed parallel to the Northeast Boundary <strong>Sewer</strong> and to several low lying areas to<br />
provide additional storage for CSO and to relieve street and basement flooding in the<br />
Northeast Boundary area. The existing Poplar Point Pumping Station was proposed to be<br />
replaced by a new facility located at the end of the tunnel that both dewaters the tunnel and<br />
replaces the function of the existing pumping station. Once the tunnel was operational, the<br />
Northeast Boundary Swirl Facility was proposed to be abandoned.<br />
<br />
Rock Creek Components - The control measures selected for Rock Creek were also predicted<br />
to limit overflows to four events per average year. The frequency of overflow ranged from<br />
one per year to six per year for dry and wet years, respectively, during the three year analysis<br />
period. The principal control measures included completion of the separation of Luzon<br />
\\Gh-wash\ENG 1160\LTCP\LTCP Final\Sec 9.doc 9-58 FINAL - July 2002
Selection of Draft LTCP<br />
Valley (CSO 059), construction of a storage tunnel at Piney Branch, and monitoring and<br />
regulator improvements to several small CSOs south of Piney Branch.<br />
<br />
Potomac River Components - The control measures selected for the Potomac River were<br />
predicted to limit overflows to 12 events per average year. During the three year analysis<br />
period, the frequency of overflow ranged from seven per year to 15 per year for dry and wet<br />
years, respectively. The principal control measures included rehabilitation of the Potomac<br />
Pumping Station and construction of a storage tunnel from west of the Key Bridge, along the<br />
Potomac River waterfront parallel to Georgetown, and terminating at Potomac Pumping<br />
Station. The tunnel would intercept the Georgetown CSOs and the large CSOs downstream<br />
of Rock Creek. A new pumping station was proposed to be constructed at Potomac Pump<br />
Station to dewater the tunnel.<br />
<br />
Blue Plains Wastewater Treatment <strong>Plan</strong>t (BPWWTP) Components – BPWWTP has an<br />
existing excess flow treatment system designed to provide screening, grit removal, primary<br />
treatment, and disinfection to storm flows up to 336 mgd. Improvements to the excess flow<br />
treatment train were recommended to improve performance and reliability. These<br />
improvements consist of the addition of four new clarifiers and appurtenant weir and control<br />
system improvements.<br />
The selected CSO control program was predicted to greatly reduce the frequency and volume of<br />
CSO overflows. Table 9-25 illustrates the reduction in overflows.<br />
Table 9-25<br />
CSO Overflow Reduction of Draft LTCP (June 2001)<br />
Anacostia<br />
River<br />
Potomac<br />
River<br />
Rock<br />
Creek<br />
Total<br />
<strong>System</strong><br />
% Capture of<br />
<strong>Combined</strong> Sewage<br />
per CSO Policy<br />
Item<br />
CSO Overflow Volume (mg/yr)<br />
No Phase I <strong>Control</strong>s<br />
2,142 1,063 49 3,254 76%<br />
With Phase I <strong>Control</strong>s<br />
1,485 953 52 2,490 82%<br />
Recommended <strong>Plan</strong><br />
96 157 11 264 98%<br />
% Reduction from No Phase I <strong>Control</strong>s 95.5% 85% 78% 92%<br />
-<br />
Number of Overflows/yr<br />
No Phase I <strong>Control</strong>s<br />
75 74 30 -<br />
-<br />
With Phase I <strong>Control</strong>s<br />
75 74 30 -<br />
-<br />
Recommended <strong>Plan</strong><br />
4 12 4 -<br />
-<br />
Notes: 1. The Phase I CSO controls consisted of the inflatable dams and Northeast Boundary Swirl Facility. These controls<br />
were completed in 1991.<br />
\\Gh-wash\ENG 1160\LTCP\LTCP Final\Sec 9.doc 9-59 FINAL - July 2002
Selection of Draft LTCP<br />
The major elements of the Draft LTCP are summarized in Table 9-26, and are shown on Figure 9-9.<br />
The following sections describe the comments received on the Draft LTCP, the additional<br />
evaluations conducted, and the selection of the Final LTCP.<br />
Table 9-26<br />
Draft LTCP Elements and Estimated Costs<br />
<strong>System</strong> Wide<br />
Component<br />
Low Impact Development – Retrofit (LID-R)– advocate implementation of LID-R<br />
throughout entire District. Provide technical and regulatory assistance to District<br />
Government. Implement LID-R projects on WASA facilities where feasible.<br />
Anacostia River<br />
Rehabilitate Pumping Stations – Rehabilitate existing pumping stations as follows:<br />
Interim improvements at Main and ‘O’ Street Pumping Stations necessary for<br />
reliable operation until rehabilitation of stations is performed.<br />
Rehabilitate Main Pumping Station to 240 mgd firm sanitary capacity.<br />
Screening facilities for firm sanitary pumping capacity only.<br />
Rehabilitate Eastside and ‘O’ Street Pumping stations to 45 mgd firm sanitary<br />
capacity<br />
Interim improvements at existing Poplar Point Pumping Station necessary for<br />
reliable operation until replacement pumping station is constructed as part of<br />
storage tunnel<br />
Storage Tunnel from Poplar Point to Northeast Boundary Outfall – 36 million gallon<br />
storage tunnel between Poplar Point and Northeast Boundary. Tunnel will intercept CSOs<br />
009 through 019 on the west side of the Anacostia. Project includes new tunnel<br />
dewatering pump station and low lift pumping station at Poplar Point.<br />
Storage/Conveyance Tunnel Parallel to Northeast Boundary <strong>Sewer</strong> – 59 million gallon<br />
storage/conveyance tunnel parallel to the Northeast Boundary <strong>Sewer</strong>. Also includes side<br />
tunnels from main tunnel along West Virginia and Mt. Olivet Avenues, NE and Rhode<br />
Island and 4 th St NE to relieve flooding. Abandon Northeast Boundary Swirl Facility<br />
upon completion of main tunnel.<br />
Ft Stanton Interceptor – 66” pipeline from Fort Stanton to Poplar Point to convey CSO<br />
005, 006 and 007 on the east side of the Anacostia to the storage tunnel.<br />
Rock Creek<br />
Capital Cost<br />
Opinion<br />
(Millions,<br />
ENR=6383)<br />
Annual Operation<br />
and Maintenance<br />
(Millions,<br />
ENR=6383)<br />
$3 $0.15<br />
$115 $0 1<br />
$276<br />
$414<br />
$9.05<br />
$11 $0.05<br />
Anacostia Subtotal $816 $9.10<br />
Separate Luzon Valley (CSO 059) – Complete separation of this drainage area. $2 $0<br />
Storage Tunnel for Piney Branch (CSO 049) – 3.8 million gallon storage tunnel $32 $0.45<br />
Monitoring at CSO 031, 033, 036, 037, 047 and 057 – Conduct monitoring to confirm<br />
prediction of overflows. If overflows confirmed, then perform the following:<br />
Regulator Improvements: Improve regulators for CSO 031, 033, 036, 037, 047<br />
$5 $0.05<br />
\\Gh-wash\ENG 1160\LTCP\LTCP Final\Sec 9.doc 9-60 FINAL - July 2002
Selection of Draft LTCP<br />
<br />
and 057<br />
Potomac River<br />
Component<br />
Connection to Potomac Storage Tunnel: Relieve Rock Creek Main Interceptor to<br />
proposed Potomac Storage Tunnel when it is constructed<br />
Rehabilitate Potomac Pumping Station –<br />
Rehabilitate station to firm 460 mgd pumping capacity<br />
Potomac Storage Tunnel – 28 million gallon storage tunnel from Georgetown to Potomac<br />
Pumping Station. Includes new tunnel dewatering pumping station.<br />
Blue Plains Wastewater Treatment <strong>Plan</strong>t<br />
Excess Flow Treatment Improvements – four new primary clarifiers, improvements to<br />
excess flow treatment control and operations<br />
Capital Cost<br />
Opinion<br />
(Millions,<br />
ENR=6383)<br />
Annual Operation<br />
and Maintenance<br />
(Millions,<br />
ENR=6383)<br />
Rock Creek Subtotal $39 $0.50<br />
$12 $0 1<br />
$158 $2.70<br />
Potomac River Subtotal $170 $2.70<br />
$22 $0.4<br />
Grand Total $1,050 $12.85<br />
\\Gh-wash\ENG 1160\LTCP\LTCP Final\Sec 9.doc 9-61 FINAL - July 2002
Public Participation<br />
Section 10<br />
Public Participation<br />
10.1 INTRODUCTION<br />
A public participation program and associated activities were conducted as part of the development<br />
of the LTCP. The goals of the program were to foster public awareness, and to facilitate public<br />
involvement in the decision-making process to develop and select the final LTCP. This section<br />
describes public input during development of the LTCP and comments received on the Draft LTCP.<br />
10.2 PUBLIC INVOLVEMENT DURING DEVELOPMENT OF DRAFT LTCP<br />
10.2.1 Public Meetings<br />
Notifications and advertisements for the public meetings were disseminated via the following media:<br />
<br />
Newspapers: Advance notices of public meetings were published in at least four local<br />
newspapers between 30 and 45 days before each public meeting or hearing. Public meetings<br />
no. 1 and 2 were advertised in the following newspapers:<br />
o Alexandria Gazette<br />
o La Nación<br />
o The Washington Afro-American<br />
o The Washington Post<br />
o The Washington Times<br />
An expanded notification effort was initiated for public meeting no. 3, which was advertised<br />
in the following newspapers as well as the aforementioned ones:<br />
o The Common Denominator<br />
o El Tiempo Latino<br />
o The Northwest Current<br />
o The Washington Informer<br />
<br />
Radio: Public service announcements were broadcast on WAMU National Public Radio<br />
<br />
Internet Websites: Notices of the public meetings were also placed on the following websites:<br />
o WASA’s CSO Website<br />
o <strong>DC</strong> Watch Website<br />
<br />
Notice by Mail: A list of over 500 citizens and representatives of businesses, interest groups,<br />
federal government, local government, regulatory agencies, neighboring jurisdictions, and<br />
interjurisdictional agencies was developed and accumulated as the study progressed. Any<br />
J:\1160\LTCP\LTCP Final\Sec 10.doc 10-1 FINAL – July 2002
Public Participation<br />
person or group who provided a name and address was added to the list. Persons on the<br />
mailing list were sent special notices of upcoming public meetings, as well as the<br />
responsiveness summaries for each meeting.<br />
<br />
Public Information Depository: An Information Document was prepared and placed on<br />
reserve at a public library in each District Ward to provide background information for public<br />
review. These libraries are listed below:<br />
o Martin Luther King, Jr.: 901 G St, NW, Washingtoniana Room<br />
o Capitol View: 5001 Central Avenue, SE<br />
o Mount Pleasant: 31 16 th Street, NW<br />
o Woodridge: 18 th and Rhode Island Avenue, NE<br />
o Northeast: 330 7 th Street, NE<br />
o Southeast: 403 7 th Street, SE<br />
o Shepherd Park: 7420 Georgia Avenue, NW<br />
o Tenley-Friendship: 4450 Wisconsin Avenue, NW<br />
o Washington Highlands: 115 Atlantic Street, SE<br />
Public meetings were held over the course of the LTCP development effort to facilitate the exchange<br />
of information with the general public, to present findings and to obtain their views. Meetings were<br />
held on the following dates:<br />
Public Meeting No. 1: June 7, 1999<br />
Public Meeting No. 2: April 5, 2000<br />
Public Meeting No. 3: May 8, 2001<br />
The first public meeting was used to brief the public on the scope and purpose of the study and to<br />
obtain their general views on the study. The second public meeting focused on updating the public<br />
on the development of the LTCP and the Nine Minimum <strong>Control</strong> Program and to obtain public input<br />
and comments. At the third public meeting, the “short-list” of feasible alternatives and their<br />
associated water quality benefits and costs were discussed. Concerns raised by the public at these<br />
meetings are listed in Table 10-1.<br />
J:\1160\LTCP\LTCP Final\Sec 10.doc 10-2 FINAL - July 2002
Public Participation<br />
Public<br />
Meeting<br />
No.<br />
Table 10-1<br />
Summary of Public Meetings<br />
No. of<br />
Attendees 1 Presentation Topics Public Concerns/Comments<br />
1 44 (13) CSO issues in the District<br />
WASA’s past CSO control efforts<br />
<strong>Water</strong> quality as a watershed issue<br />
<br />
<br />
<br />
Introduction to <strong>Combined</strong> <strong>Sewer</strong> <strong>System</strong> <strong>Long</strong><br />
<strong>Term</strong> <strong>Control</strong> <strong>Plan</strong> (CSS LTCP) planning<br />
approach<br />
Public participation opportunities<br />
Ongoing Nine Minimum <strong>Control</strong>s (NMC)<br />
Program<br />
2 31 (9) WASA’s present NMC program<br />
Short-term projects: Eastside Interceptor<br />
cleaning, netting system installation, Swirl<br />
Facility evaluation, Rain barrel demonstration<br />
program, planned siphon inspection<br />
Major capital projects: Dam replacement,<br />
pump station rehab.<br />
Monitoring program update<br />
CSO control alternatives<br />
3 40 (14) Criteria for evaluating alternatives<br />
Description of range of alternatives considered<br />
Final alternatives for Anacostia CSOs, Rock<br />
Creek CSOs and Potomac CSOs.<br />
Financial capabilty assessment<br />
The goal should be zero discharge of<br />
combined sewage overflow to the<br />
Anacostia River.<br />
A stakeholders group that actively<br />
participates in the decision-making<br />
process should be formed.<br />
Signs at CSO outfalls on National Park<br />
Service property must be posted.<br />
Silt buildup in the Anacostia is affecting<br />
navigation in the waterway.<br />
The financial cost of the CSS LTCP must<br />
be considered.<br />
WASA should study how other cities<br />
addressed their CSO problems.<br />
The problem of water quality in the<br />
District is a watershed issue that<br />
comprises several jurisdictions, not just<br />
the District.<br />
Litter entering the sewer system is a<br />
serious problem and requires public<br />
education.<br />
<strong>Sewer</strong> separation is not a preferred<br />
method of addressing CSO’s.<br />
WASA should contact Office of <strong>Plan</strong>ning<br />
and coordinate LTCP efforts with<br />
redevelopment along the Anacopstia<br />
Consider the benefits afforded by flow<br />
and pollutant reduction technologies in<br />
the LTCP<br />
Consider alternate locations for siting<br />
possible Equiflow system<br />
Maryland pollutant loads are significantly<br />
affecting water quality and should be<br />
quantified as part of the LTCP.<br />
Storm water loads must be addressed<br />
Invite the Department of Public Works to<br />
stakeholder meetings.<br />
Show the combined effect of structural<br />
CSO controls with diffuse controls such<br />
as Low Impact Development Retrofit and<br />
and Real Time <strong>Control</strong>.<br />
Show the effect on water quality of<br />
upstream and storm water reductions in<br />
pollutant loads combined with CSO<br />
control<br />
The federal government constructed the<br />
sewer system and should bear a portion of<br />
the costs of CSO control.<br />
Show the effect of CSO control on rates<br />
both with and without outside financial<br />
assistance.<br />
1 Number in parentheses indicate number of staff associated with development of LTCP (WASA, Greeley and Hansen LLP and<br />
subconsultants, and in some cases, MWCOG employees)<br />
For each public meeting, handouts were prepared regarding information presented. These handouts<br />
were made available to everyone who attended. After each of the public meetings, a responsiveness<br />
J:\1160\LTCP\LTCP Final\Sec 10.doc 10-3 FINAL – July 2002
Public Participation<br />
summary was prepared describing the presentations made, the issues raised by the public and the<br />
responses to those issues. The responsiveness summaries were mailed to all those who provided<br />
their address at the meeting and to all members of the Stakeholder Advisory Panel.<br />
10.2.2 Stakeholder Advisory Panel<br />
At the request of the public during the first public meeting, a stakeholder advisory panel was formed.<br />
Panel meetings were held over the course of the study to provide an opportunity for public input and<br />
consultation on the LTCP development process at more frequent intervals than that afforded by the<br />
general public meetings.<br />
The panel consisted of representatives from government agencies, regulatory agencies, citizens’<br />
groups, and environmental advocacy groups that are concerned about water quality issues within the<br />
District. The panel meetings were typically held every six to eight weeks, and all the meetings were<br />
open to the public. The organizations that were represented by each type of group are listed in Table<br />
10-2.<br />
Table 10-2<br />
Stakeholder Advisory Panel Members<br />
Group<br />
Organization<br />
Business PEPCO<br />
Citizen Groups ANC 3F04<br />
Chesapeake Bay Project Office Citizen’s Advisory Committee<br />
Kingman Park Civic Association<br />
Federal Government U.S. Army Corps of Engineers<br />
General Services Administration (GSA)<br />
National Park Service (NPS)<br />
National Zoological Park<br />
Naval District- Washington<br />
U.S. Soldiers’ and Airmens’ Home<br />
Interest Groups Anacostia <strong>Water</strong>shed Society<br />
Audubon Naturalist Society<br />
Earth Conservation Corps<br />
Sierra Club<br />
Natural Resources Defense Council<br />
Earth Justice Legal Defense Fund<br />
District Yacht Club<br />
Local/Multijurisdictional<br />
Montgomery County Dept. of Environmental Services<br />
Government Agencies<br />
D.C. Office of <strong>Plan</strong>ning<br />
Interstate Commission on the Potomac River Basin (ICPRB)<br />
Metropolitan Washington Council of Governments (MWCOG)<br />
Regulatory Agencies U.S. Environmental Protection Agency (EPA)<br />
D.C. Department of Health<br />
Panel meetings were held on the following dates:<br />
J:\1160\LTCP\LTCP Final\Sec 10.doc 10-4 FINAL - July 2002
Public Participation<br />
Panel Meeting No. 1: October 28, 1999<br />
Panel Meeting No. 2: December 9, 1999<br />
Panel Meeting No. 3: February 24, 2000<br />
Panel Meeting No. 4: April 4, 2000<br />
Panel Meeting No. 5: June 8, 2000<br />
Panel Meeting No. 6: August 3, 2000<br />
Panel Meeting No. 7: October 26, 2000<br />
Panel Meeting No. 8: February 7, 2001<br />
Panel Meeting No. 9: March 29, 2001<br />
Panel Meeting No. 10: April 26, 2001<br />
The presentation topics and comments received from stakeholders are presented in Table 10-3.<br />
Table 10-3<br />
Summary of Stakeholder Advisory Panel Meetings<br />
Panel<br />
Meeting<br />
No.<br />
No. of<br />
Attendees 1 Presentation Topics Stakeholder Feedback<br />
1 31 (9) What is a CSO<br />
WASA’s <strong>Combined</strong> <strong>Sewer</strong> <strong>System</strong><br />
EPA’s CSO Policy<br />
<strong>Water</strong> quality is watershed issue<br />
Progress on developing a long term<br />
control plan<br />
Rain barrel demonstration program<br />
2 32 (10) Update on Nine Minimum <strong>Control</strong><br />
projects, particularly BMP demonstration<br />
projects<br />
Monitoring program update<br />
Equiflow system evaluation<br />
Review of CSO programs in other cities<br />
3 32 (10) Preliminary monitoring program results<br />
CSO control technologies<br />
Examples of CSO controls from<br />
Richmond, VA<br />
Anacostia Restoration - Indicators of<br />
Progress<br />
Rain Barrel Program<br />
<br />
<br />
<br />
<br />
<br />
<br />
<br />
<br />
<br />
<br />
<br />
<br />
<br />
The panel requested a field trip to view<br />
WASA’s CSO facilities<br />
Public must be educated concerning litter and<br />
trash entering sewers<br />
Invite representative from Maryland to attend<br />
meetings on a regular basis<br />
Consider the experience of other CSO cities<br />
when evaluating controls<br />
Consider and quantify the pollutant<br />
contribution from upstream sources<br />
Trash and floatable debris in the Anacostia are<br />
important considerations<br />
The Equiflow system is aesthetically<br />
unattractive and does not seem to provide<br />
major benefits.<br />
Consider expanding the pumping capacity at<br />
Main and O Street Pumping Stations<br />
Investigate how other utilities work with the<br />
National Park Service.<br />
Present data on location and type of samples<br />
being collected in combined sewer overflows<br />
Make a Nine Minimum <strong>Control</strong>s update a<br />
standard part of the stakeholder agenda<br />
DOT should act to control solids and floatabels<br />
in storm water and CSO. Each agency needs to<br />
do their fair share.<br />
Look at what other CSO cities are doing in<br />
terms of public education<br />
J:\1160\LTCP\LTCP Final\Sec 10.doc 10-5 FINAL – July 2002
Public Participation<br />
Panel<br />
Meeting<br />
No.<br />
No. of<br />
Attendees 1 Presentation Topics Stakeholder Feedback<br />
4 31 (9) Stakeholder Panel Draft Work <strong>Plan</strong><br />
Receiving water monitoring update<br />
Preliminary storm water and CSO<br />
analytical data<br />
Update on Eastside Interceptor cleaning<br />
and end-of-pipe netting system<br />
installation<br />
5 24 (9) Rain barrel demonstration project update<br />
Presentation of overflow volumes and<br />
rainfall depths from monitoring program<br />
Preliminary observations concerning<br />
monitoring data<br />
CSO control options and degree of control<br />
Nine Minimum <strong>Control</strong> program update<br />
6 25 (8) Nine Minimum <strong>Control</strong> program update<br />
Presentation of overflow volumes and<br />
rainfall depths August 99 – June 00<br />
How monitoring data will be input into the<br />
computer model<br />
Preliminary list of CSO control<br />
alternatives<br />
7 28 (11) Final CSO and storm water monitoring<br />
results<br />
Proposed CSO and Storm water event<br />
mean concentrations<br />
Receiving water monitoring results<br />
Feasibility of tunnels<br />
Nine Minimum <strong>Control</strong> program update<br />
8 27 (9) Model calibration results<br />
Results of model runs for Year 1990<br />
conditions: flow and water quality<br />
Sensitivity analysis on effect of load<br />
reductions on receiving waters<br />
Review of CSO control technologies<br />
Stream diversion<br />
Nine Minimum <strong>Control</strong> program update<br />
9 35 (8) Description of alternatives<br />
Preliminary results of the alternatives<br />
evaluations<br />
Procedure for stakeholders to present their<br />
opinion on the proposed LTCP<br />
<br />
<br />
<br />
<br />
<br />
<br />
<br />
<br />
<br />
<br />
<br />
<br />
<br />
<br />
<br />
<br />
<br />
<br />
<br />
<br />
<br />
<br />
<br />
<br />
<br />
Consider the impact of tide on the Anacostia<br />
River.<br />
Assess the impact of the sediments on oxygen<br />
demand in the Anacostia River<br />
Significant rate increases to fund CSO controls<br />
would be viewed unfavorably<br />
Estimate the maximum amount that rate payers<br />
can afford for CSO control<br />
Consider the non-monetary benefits of CSO<br />
control<br />
Consider how other municipalities controlled<br />
CSOs and obtained federal funding.<br />
Consider coordinating with the Mayor’s<br />
appointee on CSO control issues<br />
Consider the potential negative impacts of<br />
CSO storage including impacts on<br />
groundwater, aesthetics and public health<br />
Look into relocating the “O” Street pump<br />
station<br />
Make sure signs at CSO outfalls are visible<br />
from both land and water.<br />
In the modeling, take into account the effect of<br />
existing CSO controls.<br />
Describe the performance of the floating end of<br />
pipe netting system.<br />
Show the locations of Federal Facilities in the<br />
CSO area<br />
Consider Low Impact Development Retrofit as<br />
a CSO control<br />
Consider a tunnel between Main and O and<br />
BPWWTP for CSO control.<br />
Effect of groundwater and street sweeping on<br />
CSO’s<br />
When separation is evaluated, make sure the<br />
pollutants in the new storm water are included.<br />
Flow reduction and pollutant management<br />
technologies are of interest to stakeholders<br />
Evaluate Anacostia River conditions with<br />
Maryland meeting water quality standards at<br />
the District Boundary<br />
Evaluate Anacostia River conditions with load<br />
reductions for both the <strong>DC</strong>/Maryland<br />
Boundary and District storm water.<br />
Compare costs and benefits for CSO control<br />
alternatives<br />
Consider Low Impact Development Retrofit<br />
Projects such as aeration of the Anacostia and<br />
flow augmentation of the Anacostia will not<br />
reduce CSOs . If they are considered further,<br />
they must be coupled with CSO controls<br />
Stakeholders concerned about reliability of<br />
inflatable dams<br />
Consider storage upstream in the system such<br />
as at Soldier’s Home or McMillan Reservoir<br />
J:\1160\LTCP\LTCP Final\Sec 10.doc 10-6 FINAL - July 2002
Public Participation<br />
Panel<br />
Meeting<br />
No.<br />
No. of<br />
Attendees 1 Presentation Topics Stakeholder Feedback<br />
10 30 (17) Description of final alternatives<br />
Preliminary results of final alternatives<br />
evaluations<br />
A survey to obtain comments was<br />
distributed<br />
<br />
<br />
<br />
<br />
<br />
Look at some other measure of receiving water<br />
quality other than the geometric mean for fecal<br />
coliform<br />
Present information by water body to allow<br />
them to select various alternatives<br />
Fecal coliform impacts during the warm season<br />
are more important than year round. Present<br />
results in this manner<br />
In the LTCP, include a discussion about the<br />
degree of storm water and upstream load<br />
reductions required to meet water quality<br />
standards<br />
Consider alternatives that combine structural<br />
projects with Low Impact Development<br />
Retrofit, real time control and others<br />
1 Number in parentheses indicate number of staff associated with development of LTCP (WASA, Greeley and Hansen LLP<br />
and subconsultants, and in some cases, MWCOG employees)<br />
As requested by the stakeholders, WASA arranged for a field trip to visit key WASA facilities on<br />
May 18, 2000. The Main Pumping Station, “O” Street Pumping Station, NEBSF, and the end-ofpipe<br />
netting system at CSO 018 were visited. In addition, the stakeholders also went on a field trip to<br />
Richmond, VA, on June 30, 2000. The stakeholders and members of the Mayor’s Environmental<br />
Council were briefed on the specifics of the Richmond program to control CSO’s into the James<br />
River. Presentations were made by representatives of the City of Richmond, representatives from the<br />
Virginia State <strong>Water</strong> <strong>Control</strong> Board, environmental groups that were involved as stakeholders, and<br />
Greeley and Hansen staff. The group also toured several of the CSO control facilities located along<br />
the James River.<br />
10.2.3 <strong>DC</strong> DOH/WASA Model Workshops<br />
As part of DOH’s effort to develop a BOD TMDL for the Anacostia River and WASA’s effort to<br />
develop the LTCP, model workshop meetings were started in 1998 and continue to be regularly held<br />
as of the writing of this report (May 2001). Model workshop meetings were held to keep all parties<br />
informed of issues associated with the development and use of the Anacostia model for the tidal<br />
Anacostia. DOH with the assistance of ICPRB modified the Anacostia computer model for use in<br />
developing the BOD TMDL. DOH then turned the model over to WASA for use in developing the<br />
LTCP. WASA subsequently updated and improved the model for the LTCP. WASA has turned the<br />
updated model back to DOH for work related to the anticipated fecal coliform TMDL.<br />
The parties that were regularly in attendance include the following:<br />
DOH<br />
EPA Region III<br />
Montgomery County<br />
Princes Georges County<br />
J:\1160\LTCP\LTCP Final\Sec 10.doc 10-7 FINAL – July 2002
Public Participation<br />
<br />
<br />
<br />
<br />
Maryland Dept. of the Environment<br />
MWCOG<br />
ICPRB<br />
WASA and its consultants<br />
10.2.4 Public Information<br />
A concerted effort was made to make the public aware of the CSS LTCP development process and to<br />
actively involve and educate them about CSO issues through the following media:<br />
<br />
Educational Mailer in <strong>Water</strong> and <strong>Sewer</strong> Bills – A program of periodic education mailers to<br />
WASA customers was initiated in the Autumn of 1999 and was broadened to include<br />
recreational water activity groups in Autumn 2000. Mailing inserts were prepared and<br />
included in 133,000 sewer and water bills mailed out to WASA customers during Autumn<br />
1999 and Autumn 2000. During the Autumn of 2000, copies of the mailer were provided to<br />
various recreational water activity groups for distribution to their members.<br />
The topics discussed in the Autumn 1999 mailing insert were as follows:<br />
o Definition of combined sewers and how they function<br />
o Explanation of the LTCP development effort<br />
o Invitation for the public to become involved and provide input<br />
o Illustration of how a combined sewer system functions<br />
The topics discussed in the Autumn 2000 mailing insert were as follows:<br />
o Reporting of dry weather overflows<br />
o The role of littering in causing dry weather overflows<br />
o Illustrations of how a CSO regulator structure functions during dry and wet weather<br />
<br />
CSO Website – WASA created a special section of its Internet website devoted exclusively to<br />
CSO issues. The website included information on the nature of CSOs, maps showing the<br />
location of outfalls, descriptions of the LTCP development process, CSO monitoring results,<br />
information on pollution prevention, ways for the public to get involved and stay informed,<br />
and other items. Notices for public meetings were also posted on the website.<br />
<br />
Public Information Depositories - Copies of information documents containing background<br />
information and other information relative to the LTCP were available throughout the<br />
duration of the study at eight public libraries in each District Ward. Documents directly<br />
related to public meetings and the planned public hearing were placed in the information<br />
depository at least 30 days prior to the respective meeting or hearing.<br />
J:\1160\LTCP\LTCP Final\Sec 10.doc 10-8 FINAL - July 2002
Public Participation<br />
<br />
CSO Newsletters – Two newsletters were sent out to the mailing list of 500 parties<br />
mentioned in Section 10.2 in June 1999 and March 2000. The topics discussed in these<br />
newsletters included the following:<br />
o Explanation of combined sewers, CSO’s, and the LTCP process<br />
o Schedule for public meetings<br />
o Netting system demonstration project<br />
o Monitoring program update and illustration<br />
o Meeting schedule for Stakeholder Advisory Panel<br />
<br />
Handouts - For each public meeting, public hearing, and Stakeholder Advisory Panel (Panel)<br />
meeting, handouts were prepared regarding information presented. These handouts were<br />
made available to everyone who attended.<br />
<br />
Literature and Documentation – Responsiveness summaries as described for the public<br />
meetings in Section 10.2.1 were prepared for each stakeholders’ meeting.<br />
<br />
Presentations to Other Groups – Presentations were also made to other citizens’, government,<br />
and environmental groups, including:<br />
o Mayor’s Environmental Council<br />
o The Summit Fund of Washington<br />
o Anacostia Trash Management Group<br />
o Women Like Us (2 presentations)<br />
o U.S. EPA Special Panel to Address <strong>Combined</strong> <strong>Sewer</strong> Overflow and Storm <strong>Water</strong><br />
Issues in the District of Columbia<br />
o Anacostia <strong>Water</strong>shed Toxics Alliance<br />
o Anacostia River Forum<br />
o Various EPA and D.C. Department of Health briefings and presentations<br />
o D.C. Office of <strong>Plan</strong>ning<br />
10.2.5 Publicity Received From Media<br />
During the course of the LTCP development effort, WASA’s sewer system and combined sewer<br />
overflow issues were covered in the local media, as described below:<br />
<br />
WAMU National Public Radio aired a segment on February 13, 2001 on the CSO problem in<br />
the District. The segment contained a explanation of what CSO’s are and how they occur,<br />
WASA’s present control measures for CSO’s, and the District government’s plans for<br />
addressing CSO’s.<br />
<br />
Newspaper articles<br />
J:\1160\LTCP\LTCP Final\Sec 10.doc 10-9 FINAL – July 2002
Public Participation<br />
<br />
o “Cleaning Up and Celebrating the Anacostia”, Washington Post, 4/15/2000: An<br />
editorial article concerning water quality problems in the Anacostia River.<br />
o “A Toast to D.C. <strong>Water</strong>: How WASA Works for District Residents”, Washington<br />
Times, 6/19/2000: An overview of the services, resources, finances, and community<br />
activities of WASA.<br />
o “Rooftop Trees”, Washington Post, 12/11/1999: A letter to the editor encouraging<br />
rooftop greening projects for the District<br />
o “Leaders Seek Cleanup of Anacoatia”, Washington Times, December 4, 2001<br />
.<br />
Journal Articles<br />
o “District of Columbia has Big <strong>Plan</strong> to Limit <strong>Combined</strong> <strong>Sewer</strong> Discharge”,<br />
Engineering News Record, July 9, 2001.<br />
10.3 RELEASE OF DRAFT LTCP<br />
10.3.1 Distribution of Information<br />
The Draft LTCP was officially released at a press conference on June 29, 2001 at the Main and O<br />
Street Pumping Stations. The public was invited and the television and print media covered the<br />
event.<br />
The Draft LTCP and summaries of the plan were extensively distributed to the public for comments.<br />
This included the following:<br />
<br />
Distribution of Draft LTCP - In early July 2001, more than 150 copies of the complete Draft<br />
LTCP were distributed to individuals associated with local government agencies, regulatory<br />
agencies, environmental interest groups, citizens groups, WASA, and consultants.<br />
<br />
Public Information Depositories - Two copies of the complete Draft LTCP were placed on<br />
reserve in each of nine public libraries in the District that served as Public Information<br />
Depositories for the program. These copies were made available to the general public in the<br />
reference section of each library.<br />
<br />
Web Site - An electronic version of the complete Draft LTCP and the Executive Summary<br />
were placed on WASA’s web site for download and viewing.<br />
<br />
Washington Post Insert – A four-page insert was placed in the Sunday Washington Post on<br />
August 19, 2001. Over 292,000 copies were distributed. Spanish language versions were<br />
also distributed to Spanish speaking households by the Post. The insert described the Draft<br />
LTCP and provided information on opportunities for comment.<br />
J:\1160\LTCP\LTCP Final\Sec 10.doc 10-10 FINAL - July 2002
Public Participation<br />
<br />
Abbreviated Summaries for the Public – abbreviated summaries of the Draft LTCP were<br />
prepared and made available. These were titled “<strong>Control</strong> <strong>Plan</strong> Highlights” and “WASA’s<br />
Recommended <strong>Combined</strong> <strong>Sewer</strong> <strong>System</strong> Draft <strong>Long</strong> <strong>Term</strong> <strong>Control</strong> <strong>Plan</strong> - Executive<br />
Summary”.<br />
10.3.2 Media Publicity<br />
After the Draft LTCP was released, considerable coverage occurred in local media. The following is<br />
a list of the coverage:<br />
“$1 Billion Remedy For <strong>Sewer</strong> Spills”, The Washington Post, June 25, 2001.<br />
“D.C. Region: City to Propose $1B <strong>Plan</strong> to Fix <strong>Sewer</strong> <strong>System</strong>”, Environment and Energy<br />
Publishing, LLC, June 26, 2001.<br />
“News Conference- <strong>DC</strong> <strong>Water</strong> and <strong>Sewer</strong> Authority”, Federal News Service, Inc., June 29,<br />
2001.<br />
“News Conference”, Federal Information and News Dispatch, Inc. June 29, 2001.<br />
“District of Columbia <strong>Water</strong> and <strong>Sewer</strong> Authority Releases Recommended $1.05 billion<br />
Draft <strong>Combined</strong> <strong>Sewer</strong> <strong>System</strong> <strong>Long</strong> <strong>Term</strong> <strong>Control</strong> <strong>Plan</strong>”, PR Newswire Association, Inc.<br />
June 29, 2001.<br />
“D.C. Agency to Ask Congress to Fund Billion-Dollar <strong>Sewer</strong> Project”, The Bond Buyer, Inc.,<br />
July 2, 2001.<br />
‘District of Columbia Has Big <strong>Plan</strong> to Limit <strong>Combined</strong> <strong>Sewer</strong> Discharge”, Engineering<br />
News-Record, July 9, 2001.<br />
“Community Members, D.C. Council Member Call for an End to Dumping of Raw Sewage<br />
Into D.C.’s Rivers”, U.S. Newswire, Inc., July 20, 2001.<br />
“Groups, Citizens, D.C. Council Member Call for End to Raw Sewage Discharge in <strong>DC</strong><br />
Rivers”, U.S. Newswire, Inc., July 24, 2001.<br />
Mendelson, Environmentalists say WASA’s <strong>Sewer</strong> Solution Falls Short”, Common<br />
Denominator, July 30, 2001.<br />
“Reviving the Forgotten River”, Environmental Citizenship, www.envirocitizen.org, August<br />
24, 2001.<br />
10.4 OPPORTUNITIES FOR PUBLIC COMMENT ON DRAFT LTCP<br />
Many forums and opportunities were made available for public comment. An overview of the major<br />
opportunities is summarized below:<br />
<br />
Public Meetings - Three public meetings were held prior to release of the Draft LTCP.<br />
Public Meeting No. 4 was held on July 24, 2001 after release of the Draft LTCP. The<br />
J:\1160\LTCP\LTCP Final\Sec 10.doc 10-11 FINAL – July 2002
Public Participation<br />
purpose of the meeting was to explain the Draft LTCP and to begin the process of obtaining<br />
public comments.<br />
<br />
Stakeholder Advisory Panel Meetings - Ten Stakeholder Advisory Panel meetings were held<br />
prior to release of the Draft LTCP. Two meetings were held after release of the Draft LTCP.<br />
<br />
Neighborhood Meetings - Neighborhood Meetings were held in each of the eight wards of<br />
the District to explain the Draft LTCP and to provide an opportunity for comment.<br />
Questionnaires were distributed at these Neighborhood Meetings. The purpose of the<br />
questionnaires was to poll citizens on what degree of CSO control they would be willing to<br />
pay for through water/sewer bill rate increase, and to gauge support for wet weather<br />
provisions for water quality standards. In addition, citizens were encouraged to write other<br />
comments or concerns on the questionnaires as well. Neighborhood Meetings are<br />
summarized in Table 10-4 below.<br />
Table 10-4<br />
Neighborhood Meeting Summary<br />
Ward<br />
No. of<br />
Attendees 1 Date Location<br />
1 17 (6) Tues., August 7, 2001<br />
Mt. Pleasant Library<br />
3160 16 th Street, NW<br />
2 23 (7) Wed., August 22, 2001<br />
Georgetown Library<br />
3260 R Street NW<br />
3 21 (5) Tues., August 28, 2001<br />
Tenley-Friendship Library<br />
4450 Wisconsin Ave, NW<br />
4 18 (6) Wed., August 15, 2001<br />
Shepard Park Library<br />
7420 Georgia Avenue, NW<br />
5 12 (5) Wed., August 1, 2001<br />
Gallaudet University<br />
800 Florida Ave, NE<br />
6 13 (6) Thurs., August 9, 2001<br />
Southeast Library<br />
403 7 th Street, SE<br />
6 26 (5) Tues., August 14, 2001<br />
Anacostia Branch Library<br />
1800 Good Hope Road, SE<br />
7 16 (4) Wed., August 29, 2001<br />
Capitol View Library<br />
5001 Central Ave, SE<br />
8 9 (6) Thurs., August 23, 2001<br />
Washington Highlands Library<br />
115 Atlantic Street SW<br />
1 Number in parentheses indicate number of staff associated with development of LTCP (WASA,<br />
Greeley and Hansen LLP and subconsultants, and in some cases, MWCOG employees)<br />
<br />
D.C. Council Public Hearing - The Council of the District of Columbia Committee on Public<br />
Works and the Environment held a public hearing on October 4, 2001. Due to time<br />
constraints, the hearing was continued on October 22, 2001. Public testimony was received<br />
a record of the hearing was made.<br />
J:\1160\LTCP\LTCP Final\Sec 10.doc 10-12 FINAL - July 2002
Public Participation<br />
<br />
Briefing at National Building Museum - On October 16, 2001, WASA made a presentation<br />
and participated in a panel discussion on the LTCP at the National Building Museum. The<br />
forum was titled “the Anacostia River Cleanup” and was part of the Museum’s ongoing “<strong>DC</strong><br />
Builds” series.<br />
<br />
WASA Public Hearing - WASA held a public hearing on October 22, 2001. The public was<br />
invited in advertisements to sign up in advance for oral testimony time during the hearing.<br />
Oral testimony received from the public was included as part of the official written transcript<br />
for the public hearing. In addition, written comments from the public were accepted until<br />
November 21, 2001.<br />
<br />
Citizens Forum - On November 7, 2001, a community forum to review the Draft LTCP was<br />
held at the Sumner School in the District. The forum was sponsored by the D.C. Federation<br />
of Civic Associations, the D.C. Citizens Association, and the Consumer Utility Board.<br />
WASA made a presentation on the Draft LTCP and five invited panel members made brief<br />
oral statements. The audience then made comments and directed questions to selected panel<br />
members.<br />
<br />
Letters, Faxes and E-mail - Letters, faxes and e-mail comments were received throughout the<br />
process.<br />
10.5 PUBLIC COMMENTS ON DRAFT LTCP<br />
10.5.1 Number and Types of Comments<br />
WASA received two types of comments: form letters and unique comments. The number of<br />
commenters is summarized in Table 10-5 and described below.<br />
Comment Type<br />
Table 10-5<br />
Number of Commenters<br />
Number of Commenters<br />
Form Letter #1 216<br />
Form Letter #2 2,017<br />
Other Comments 132<br />
Total 2,365<br />
J:\1160\LTCP\LTCP Final\Sec 10.doc 10-13 FINAL – July 2002
Public Participation<br />
<br />
Form Letters<br />
Two types of form letters were received. The majority of commenters were not from the<br />
District or the greater Washington Metropolitan area. Some of the commenters were<br />
from Canada. Figure 10-1 illustrates the origins of the form letters.<br />
Figure 10-1: Origins of Form Letter Comments<br />
Wash.<br />
Metro Area<br />
1%<br />
District<br />
10%<br />
No<br />
Address<br />
1%<br />
Other<br />
88%<br />
<br />
Other Comments<br />
More than 130 other commenters provided over 430 comments on the Draft LTCP.<br />
Comments were received from a variety of sources including the following:<br />
o Regulatory Agencies – Comments from EPA and the D.C. Department of Health.<br />
o Others, such as the following<br />
Citizens<br />
<strong>DC</strong> Office of <strong>Plan</strong>ning<br />
Washington Suburban Sanitary Commission<br />
Prince George’s County<br />
Environmental groups<br />
U.S. Fish & Wildlife Service<br />
U.S. Geological Survey<br />
Others<br />
Copies of these comments are included in separate report titled “Comments on Draft <strong>Long</strong><br />
<strong>Term</strong> <strong>Control</strong> <strong>Plan</strong>”.<br />
10.5.2 Approach to Addressing Comments<br />
An extremely large number of comments were received. In addition, there are significant degrees of<br />
overlap and common themes in many of the comments. As a result, comments were grouped by type<br />
J:\1160\LTCP\LTCP Final\Sec 10.doc 10-14 FINAL - July 2002
Public Participation<br />
and subject matter and addressed together in a commentary type response. The goal of this approach<br />
is to produce a commentary that is both readable and comprehensive. The comments were grouped<br />
as being related to the following topics:<br />
<br />
<br />
<br />
<br />
<br />
<br />
<br />
<br />
<br />
<br />
<br />
<br />
<br />
<br />
<br />
Nine Minimum <strong>Control</strong>s<br />
Alternatives Evaluation<br />
Separation<br />
Low Impact Development Source <strong>Control</strong>, Pollution Prevention<br />
Blue Plains Wastewater Treatment <strong>Plan</strong>t<br />
CSO Location<br />
Flooding<br />
Implementability<br />
Tunneling<br />
Regulatory Compliance<br />
Public Participation<br />
Financial Capability<br />
Schedule<br />
<strong>Water</strong> Quality Standards Revisions<br />
Miscellaneous Comments<br />
Appendix F provides a response to each type of comment received.<br />
10.6 FUTURE PUBLIC PARTICIPATION<br />
WASA is committed to active public participation and consultation during the planning, design and<br />
construction of CSO control projects. Future public participation will be designed to educate the<br />
public about the status of the program; progress in implementing the program; to inform<br />
neighborhood residents before, during and after construction; and to report on progress in reducing<br />
CSOs and improving water quality as a result of the program.<br />
J:\1160\LTCP\LTCP Final\Sec 10.doc 10-15 FINAL – July 2002
Section 11<br />
Selection of Final LTCP<br />
Selection of Final LTCP<br />
11.1 INTRODUCTION<br />
Based on the comments received, the new TMDL for TSS for the Anacostia River and on additional<br />
CSO Policy considerations, WASA developed additional CSO control alternatives for selection of a<br />
Final LTCP. This section describes the development of the alternatives and the selection of the Final<br />
LTCP.<br />
11.2 BASES FOR EVALUATIONS<br />
11.2.1 Design Storms<br />
The selection of the Draft LTCP was made based on average year conditions as required by the CSO<br />
Policy. Several commenters requested additional evaluations of the quantity of CSO overflow and<br />
the performance of various control plans for design storms such as the 1-year, 2-year, 5-year, 10-<br />
year, 15-year, 25-year and 50-year return frequency storms. Several sources of data were reviewed<br />
to develop design storm characteristics. They are:<br />
<br />
USDA Approach – These are synthetic storms developed based on rainfall data collected<br />
throughout the US by the National Weather Service (NWS). Maps of regional rainfall for<br />
various design storms are presented in Technical Paper No. 40 (Hershfield, 1961). This<br />
rainfall is then apportioned in time using a distribution created by the USDA (1986). This<br />
distribution is appropriate for design storms over small areas less than 10 square miles.<br />
<br />
Huff Approach – These are also synthetic storms developed based on design storms<br />
presented in NWS Technical Paper No. 40. The approach differs from the USDA method<br />
when apportioning the rainfall over time. The Huff Approach was developed for large<br />
drainage areas, ranging from 50 to 400 square miles (Huff, 1990).<br />
<br />
National Airport Data – hourly rainfall data is available at National Airport from 1949 to the<br />
present. This data was used to calculate return frequencies based on actual data.<br />
The procedure for determining design storms is to first select a storm duration. Common durations<br />
are 6-hour, 12-hour and 24-hour storms. <strong>Long</strong>er storms produce larger rainfall volumes. For each<br />
duration, storms are ranked from largest to smallest based on total rainfall volume. Note that when<br />
using actual rainfall data, intensities may or may not increase with rainfall volume. For example, it is<br />
possible to have a 25-year storm where it rained steadily for the entire 24 hours thereby producing a<br />
lot of rain but having a low intensity. Similarly, a lower return frequency storm such as a 10-year<br />
storm may have rained intensely for a short period of time and then drizzled for the remainder of the<br />
24 hours. These are the types of complexities encountered when dealing with natural phenomena.<br />
\\Gh-wash\eng 1160\LTCP\LTCP Final\Sec 11.doc 11-1 FINAL - July 2002
Selection of Final LTCP<br />
Table 11-1 summarizes the characteristics of the design storms for the three approaches and three<br />
durations evaluated. The 15-year design storm developed as part of the 1983 O’Brien & Gere CSO<br />
study is also shown (O’Brien & Gere, 1983). Figures 11-1 and 11-2 compare the total rainfall<br />
volumes and maximum hourly intensities, respectively, for the 24-hour designs storms.<br />
Table 11-1<br />
Summary of Design Storms<br />
National Airport USDA NRCS Huff Approach<br />
Max Hourly<br />
Max Hourly Rainfall<br />
Intensity (in/hr) Rainfall (in) Intensity (in/hr) (in)<br />
Rainfall (in)<br />
24 Hr Storm<br />
1 yr storm 1.59 0.23 2.70 1.15 2.70 0.26<br />
2 yr storm 2.57 0.85 3.50 1.49 3.50 0.33<br />
5 yr storm 4.03 0.86 4.50 1.92 4.50 0.43<br />
10 yr storm 5.13 1.35 5.50 2.35 5.50 0.52<br />
17 yr storm 6.23 2.90 5.70 2.43 5.70 0.54<br />
25 yr storm 6.39 0.66 6.00 2.56 6.00 0.57<br />
50 yr storm 7.19 1.25 7.00 2.99 7.00 0.67<br />
12 Hr Storm<br />
1 yr storm 1.25 0.40 2.40 1.16 2.40 0.46<br />
2 yr storm 2.43 1.29 3.00 1.45 3.00 0.57<br />
5 yr storm 3.65 0.86 3.80 1.83 3.80 0.72<br />
10 yr storm 4.16 1.45 4.50 2.17 4.50 0.86<br />
17 yr storm 4.69 1.44 4.70 2.27 4.70 0.89<br />
25 yr storm 4.87 0.66 5.10 2.46 5.10 0.97<br />
50 yr storm 6.22 1.25 6.00 2.89 6.00 1.14<br />
Max Hourly<br />
Intensity (in/hr) Rainfall (in)<br />
O’Brien & Gere<br />
1983 CSO Study<br />
Max Hourly<br />
Intensity (in/hr)<br />
6 Hr Storm<br />
1 yr storm 1.00 0.81 2.10 1.14 2.10 0.82<br />
2 yr storm 2.14 0.65 2.60 1.41 2.60 1.01<br />
5 yr storm 2.84 0.79 3.20 1.74 3.20 1.25<br />
10 yr storm 3.74 1.51 3.80 2.06 3.80 1.48<br />
17 yr storm 3.97 1.23 4.00 2.17 4.00 1.56 3.14 (5 hrs) 2.90<br />
25 yr storm 4.35 3.29 4.30 2.33 4.30 1.68<br />
50 yr storm 5.18 1.23 5.00 2.72 5.00 1.95<br />
As indicated in the table, the total rainfall volumes for the three different approaches (National<br />
Airport, USDA, and Huff approach) are similar for most of the storms. At the 1-year and 2-year<br />
storms, the National Airport volumes are about 1” less than the synthetic curves.<br />
In addition, the intensities for the Huff approach are extremely low, while those of the USDA<br />
approach are very high. This is not unexpected in that the Huff approach was developed for large<br />
watersheds where the overall watershed-wide intensity will typically be much less than the intensity<br />
predicted for smaller drainage areas based on the USDA approach. The intensities for National<br />
airport generally fall between the two.<br />
\\Gh-wash\eng 1160\LTCP\LTCP Final\Sec 11.doc 11-2 FINAL - July 2002
Selection of Final LTCP<br />
Figure 11-1 Rain Volume for 24 Hour Storms<br />
National Airport USDA NRCS Huff Approach<br />
8<br />
7<br />
Total Rainfall (in)<br />
6<br />
5<br />
4<br />
3<br />
2<br />
1<br />
0<br />
1 yr storm 2 yr storm 5 yr storm 10 yr<br />
storm<br />
17 yr<br />
storm<br />
25 yr<br />
storm<br />
50 yr<br />
storm<br />
Figure 11-2 Maximum Hourly Intensity for 24 Hour Storms<br />
National Airport USDA NRCS Huff Approach<br />
3.5<br />
Max. Hourly Intensity (in/hr)<br />
3.0<br />
2.5<br />
2.0<br />
1.5<br />
1.0<br />
0.5<br />
0.0<br />
1 yr<br />
storm<br />
2 yr<br />
storm<br />
5 yr<br />
storm<br />
10 yr<br />
storm<br />
17 yr<br />
storm<br />
25 yr<br />
storm<br />
50 yr<br />
storm<br />
Design storms developed using National Airport data were selected as the basis for the LTCP<br />
evaluations. This is because it provides site-specific information, particularly at the lower level<br />
storms and because the intensities generally fall between the two synthetic approaches. Testing of<br />
\\Gh-wash\eng 1160\LTCP\LTCP Final\Sec 11.doc 11-3 FINAL - July 2002
Selection of Final LTCP<br />
the model indicated that the largest overflow volumes were produced by 24 hour storms. These were<br />
thus selected as the basis for this analysis.<br />
The combined sewer system model was run to predict overflows associated with each of the 24-hour<br />
design storms. The results are summarized in Table 11-2.<br />
Table 11-2<br />
Predicted CSO Overflow Volumes for 24-Hour Design Storms<br />
(National Airport Data)<br />
CSO Overflow Volume (mg)<br />
Event Anacostia Potomac Rock Creek Total<br />
No Phase I <strong>Control</strong>s (Scenario B1)<br />
1-yr storm 176 106 10 292<br />
2-r storm 272 209 39 519<br />
5-yr storm 558 334 71 963<br />
10-yr storm 656 328 87 1,071<br />
17-yr storm 960 389 235 1,584<br />
25-yr storm 920 509 70 1,499<br />
50-yr storm 1,229 605 312 2,145<br />
Phase I <strong>Control</strong>s and Pump Station<br />
Rehabilitation (Scenario C3)<br />
1-yr storm 127 57 10 194<br />
2-yr storm 219 146 39 404<br />
5-yr storm 500 246 72 818<br />
10-yr storm 564 252 88 904<br />
17-yr storm 894 323 236 1,453<br />
25-yr storm 827 377 72 1,276<br />
50-yr storm 1,160 489 313 1,962<br />
Draft LTCP (Scenario D70A)<br />
1-yr storm 0 15 5 20<br />
2-yr storm 106 142 28 275<br />
5-yr storm 385 261 60 706<br />
10-yr storm 438 271 66 775<br />
17-yr storm 777 303 200 1,281<br />
25-yr storm 726 490 50 1,266<br />
50-yr storm 1,047 589 299 1,934<br />
Note that there is a limit to the capacity of any sewer system. Typically, storm and combined sewer<br />
systems in the United States are designed to accommodate the 5, 10 or 15-year storms. <strong>System</strong>s are<br />
not usually designed to accommodate larger storms. This is an acknowledgment of the great cost<br />
associated with conveying these larger storms and their low frequency of occurrence.<br />
The subsequent section will address developing alternatives designed to control specified design<br />
storms.<br />
\\Gh-wash\eng 1160\LTCP\LTCP Final\Sec 11.doc 11-4 FINAL - July 2002
Selection of Final LTCP<br />
11.2.2 Targeted Separation<br />
Several commenters indicated that targeted separation should be given further consideration. The<br />
commenters recommended considering areas to be separated based on capital cost, water quality<br />
impacts, unit costs, and other factors.<br />
A review of the drainage areas was conducted to determine which might be most suitable for targeted<br />
separation. The drainage areas were evaluated with preference given to drainage areas with the<br />
following:<br />
<br />
<br />
<br />
<br />
<br />
Proximity to public use areas<br />
Low total capital cost<br />
Favorable cost per impervious area removed<br />
Favorable cost per gallon of CSO overflow volume removed<br />
Areas with a high percentage of drainage area already separated or with a high degree of<br />
orphaned storm sewers<br />
Table 11-3 summarizes the results of the analysis.<br />
CSO<br />
NPDES<br />
No.<br />
Overflow<br />
Volume<br />
(mg/yr)<br />
Table 11-3<br />
Evaluation of Targeted Separation Options<br />
Imperv.<br />
Area<br />
(ac)<br />
% Area<br />
Already<br />
Separated<br />
Capital<br />
Cost<br />
($M)<br />
$/Imp<br />
Acre<br />
(x $1000)<br />
$/mg<br />
overflow<br />
($M)<br />
By<br />
Cap<br />
Cost<br />
By<br />
$/Imp<br />
Area<br />
By $/<br />
OF<br />
Vol<br />
Near<br />
Public<br />
Use<br />
Area<br />
Consider<br />
for<br />
Targeted<br />
Separation<br />
Drainage<br />
No.<br />
Description<br />
Area (ac)<br />
1 005 Fort Stanton 16.54 65.51 29.0 28% $ 12.5 $431 $ 0.8 Y Y Y<br />
2 006 Fort Stanton 0.11 13.56 6.6 $ 3.2 $ 488 $ 29.5 Y Y Y<br />
3 007 Fort Stanton 36.97 188.13 68.0 28% $ 33.4 $ 492 $ 0.9 Y Y<br />
4 013<br />
Canal Street<br />
<strong>Sewer</strong> 9.78 20.10 1.1 $ 5.3 $ 4,978 $ 0.5 Y Y<br />
Navy Yard/M St:<br />
5 014 6th St - 7th St 38.98 128.06 41.8 $ 31.5 $ 754,935 $ 0.8 Y Y Y<br />
Navy Yard/M St:<br />
6 015 9th St. - M St 0.72 30.82 4.1 $ 8.2 $ 2,008 $ 11.4 Y Y Y<br />
7 016<br />
Navy Yard/M St:<br />
12th St. - 9th St. 13.3 152.58 75.1 $ 38.9 $ 518 $ 2.9 Y Y Y<br />
8 017<br />
Navy Yard/M St:<br />
14th St. - Penn<br />
Ave. 20.05 259.91 114.5 $ 69.6 $ 608 $ 3.5 Y Y<br />
9 018 Barney Circle 4.7 48.93 20.1 $ 10.7 $ 532 $ 2.3 Y Y Y Y<br />
West Rock Creek<br />
Diversion <strong>Sewer</strong>:<br />
10<br />
023,<br />
024<br />
K St.- Wisconsin<br />
Ave 16.23 41.66 16.1 $ 8.2 $ 512 $ 0.5 Y Y Y Y<br />
11 025 31st & K St NW 0.16 9.89 6.0 $ 2.6 $ 437 $ 16.3 Y Y Y Y<br />
<strong>Water</strong> St District<br />
12 026 (WRC) 0 13.88 4.3 $ 2.8 $ 666 N/A Y Y Y<br />
13 028<br />
37th St-<br />
Georgetown 0.49 21.06 6.4 $ 5.6 $ 871 $ 11.4 Y Y Y<br />
Penn Ave -<br />
Middle E. Rock<br />
14 031 Creek 0.22 1.11 0.3 $ 0.28 $ 906 $ 1.3 Y Y Y<br />
\\Gh-wash\eng 1160\LTCP\LTCP Final\Sec 11.doc 11-5 FINAL - July 2002
Selection of Final LTCP<br />
No.<br />
CSO<br />
NPDES<br />
No. Description<br />
26th - M St -<br />
Middle E. Rock<br />
15 032<br />
N St. - 25th St -<br />
Middle E. Rock<br />
16 033<br />
Kalorama Circle<br />
West - E. Rock<br />
17 037<br />
Kalorama Circle<br />
East - E. Rock<br />
18 038<br />
Biltmore St - East<br />
19 040<br />
Ontario Rd -<br />
Upper E. Rock<br />
20 041<br />
Quarry Rd -<br />
Upper E. Rock<br />
21 042<br />
Kenyon St. -<br />
Upper E. Rock<br />
22 044<br />
Lamont St. -<br />
Upper E. Rock<br />
23 045<br />
Park Road -<br />
Upper E. Rock<br />
24 046<br />
Ingleside Terr. -<br />
Upper E. Rock<br />
25 047<br />
Oak St-Mt<br />
Pleasant Upper E<br />
26 048<br />
M St -27th St -<br />
27 050<br />
Olive - 29th St. -<br />
28 051<br />
Q St - West Rock<br />
29 053<br />
Overflow<br />
Volume<br />
(mg/yr)<br />
Drainage<br />
Area (ac)<br />
Imperv.<br />
Area<br />
(ac)<br />
% Area<br />
Already<br />
Separated<br />
Capital<br />
Cost<br />
($M)<br />
$/Imp<br />
Acre<br />
(x $1000)<br />
$/mg<br />
overflow<br />
($M)<br />
By<br />
Cap<br />
Cost<br />
By<br />
$/Imp<br />
Area<br />
By $/<br />
OF<br />
Vol<br />
Near<br />
Public<br />
Use<br />
Area<br />
Consider<br />
for<br />
Targeted<br />
Separation<br />
Creek 0 10.83 6.8 $ 4.6 $ 678 N/A Y Y<br />
Crk. 4.48 13.08 6.5 $ 5.1 $ 793 $ 1.1 Y Y Y<br />
Crk. 0.05 16.61 3.7 $ 2.6 $ 687 $ 51.4 Y Y<br />
Crk. 0 9.54 2.1 $ 1.5 $ 690 N/A Y Y<br />
Rock Creek 0.03 24.52 10.5 $ 6.3 $ 605 $ 211.2 Y Y Y<br />
N/A<br />
Crk. 0 27.17 7.1 $ 6.7 $ 936<br />
Crk. 0 36.22 10.9 $ 9.3 $ 854<br />
Crk. 0 17.07 7.1 $ 4.5 $ 631<br />
N/A<br />
N/A<br />
Y Y Y<br />
Y Y Y<br />
Creek 0.03 17.17 7.4 $ 4.6 $ 620 $ 152.6 Y Y<br />
Creek 0.01 17.38 7.1 $ 4.5 $ 634 $ 452.9 Y Y<br />
Crk. 0.25 18.16 7.2 $ 4.9 $ 694 $ 19.9 Y Y<br />
Rock C. 0.08 26.06 9.6 $ 7.0 $ 733 $ 87.6 Y Y<br />
N/A<br />
West Rock Creek 0 36.41 16.0 $ 8.3 $ 516<br />
Y Y Y<br />
N/A<br />
West Rock Creek 0 11.87 5.2 $ 3.2 $ 614<br />
Y<br />
Y<br />
N/A<br />
Creek 0 5.50 0.4 $ 0.9 $ 1,934<br />
Y<br />
Y<br />
30 058 Connecticut Ave. 0 5.24 1.6 $ 0.9 $ 595 N/A Y Y Y<br />
Subtotal 1,288 $325<br />
31 009 B St./N.J. Ave 16.84 41.27 23.6 $ 17.1 $ 723 $ 1.0 Y<br />
010,<br />
011, B St./N.J. Ave - O<br />
32 011a St. pumped 247.21 732.72 175.2 $ 198.9 $ 1,135 $ 0.8<br />
33 012 Tiber Creek 21.74 1,153.83 459.0 6% $ 414.6 $ 903 $ 19.1<br />
Northeast<br />
$<br />
34 019 Boundary 854.81 4,242.39 1,565.8<br />
1,224.1 $ 782 $ 1.4<br />
35 020 Easby Point 54.81 573.14 343.2 10% $ 215.9 $ 629 $ 3.9<br />
36 022<br />
I St. - 22nd St,<br />
NW 30.04 125.23 36.0 $ 46.9 $ 1,300 $ 1.6<br />
37 027 Georgetown 52.5 179.38 77.8 $ 47.3 $ 608 $ 0.9 Y<br />
38 029 College Pond 26 300.79 90.4 11% $ 77.2 $ 854 $ 2.9<br />
39<br />
034,<br />
021<br />
Slash Run Trunk<br />
<strong>Sewer</strong> 458.43 473.78 252.7 23% $ 134.8 $ 534 $ 0.3<br />
40 035<br />
Northwest<br />
Boundary 0 546.69 193.5 $ 154.2 $ 797 N/A<br />
41 036<br />
Mass Ave & 24th<br />
- E. Rock Crk. 1.64 69.76 19.8 $ 12.3 $ 621 $ 7.5<br />
42 039<br />
Belmont Rd - East<br />
Rock Creek 0 54.25 13.1 $ 12.8 $ 981 N/A<br />
Y<br />
Y<br />
\\Gh-wash\eng 1160\LTCP\LTCP Final\Sec 11.doc 11-6 FINAL - July 2002
Selection of Final LTCP<br />
CSO<br />
NPDES<br />
No.<br />
Overflow<br />
Volume<br />
(mg/yr)<br />
Drainage<br />
Area (ac)<br />
Imperv.<br />
Area<br />
(ac)<br />
% Area<br />
Already<br />
Separated<br />
Capital<br />
Cost<br />
($M)<br />
$/Imp<br />
Acre<br />
(x $1000)<br />
$/mg<br />
overflow<br />
($M)<br />
By<br />
Cap<br />
Cost<br />
No.<br />
Description<br />
Irving St. - Upper<br />
43 043 E. Rock Crk 0.15 70.31 28.7 $ 18.6 $ 649 $ 124.1<br />
44 049 Piney Branch 39.73 2,433.20 675.3 4% $ 437.2 $ 647 $ 11.0<br />
45 052 O St.-31st St, NW 0 108.50 47.4 $ 28.5 $ 601 N/A Y<br />
Cleveland - 28th<br />
46 057 St & Conn. Ave 2.33 84.50 16.6 $ 19.4 $ 1,175 $ 8.3<br />
By<br />
$/Imp<br />
Area<br />
By $/<br />
OF<br />
Vol<br />
Near<br />
Public<br />
Use<br />
Area<br />
Consider<br />
for<br />
Targeted<br />
Separation<br />
Based on this analysis, the top 30 outfalls in the table above were considered for targeted separation.<br />
They comprise a drainage area of 1,288 acres and the capital cost of separation is estimated to be<br />
$325 million. Figure 11-3 shows the locations of the targeted separation areas. The results of the<br />
further assessment of targeted separation are discussed later in this chapter.<br />
11.2.3 Outfall Consolidation<br />
Reducing the number of outfalls has been a concern to WASA. A number of commenters also<br />
expressed interest in this matter. Consolidation refers to eliminating outfalls by routing the discharge<br />
so that it is joined with one or more other outfalls. While consolidation does not reduce the<br />
overflow, it allows it to occur at a place that may cause less of an impact. In addition to targeted<br />
separation, commenters requested that consideration be given to eliminating outfalls via<br />
consolidation. Commenters suggested that emphasis be placed on outfalls near public access areas<br />
such as the Anacostia Marinas and the boathouses along the Georgetown waterfront.<br />
An evaluation of the feasibility of consolidation was conducted. The premise of consolidation was<br />
that the existing outfalls would be conveyed to the tunnel. Flow beyond the capacity of the tunnel<br />
would be conveyed through the tunnel to a discharge point. The tunnel must be in place before the<br />
outfalls can be consolidated since its carrying capacity is necessary to prevent upstream flooding.<br />
Outfalls in the Georgetown waterfront and in the Anacostia Marinas areas were determined to be<br />
feasible for consolidation. These outfalls are summarized in Table 11-4 and are shown on Figure 11-<br />
4. The peak flow rates from these drainage areas that must be conveyed through the tunnel system to<br />
the discharge points are also shown.<br />
\\Gh-wash\eng 1160\LTCP\LTCP Final\Sec 11.doc 11-7 FINAL - July 2002
Selection of Final LTCP<br />
Table 11-4<br />
Outfalls Feasible for Consolidation<br />
CSO Outfall<br />
Peak Flow Rate to be Diverted<br />
to New Location (mgd)<br />
Anacostia CSOs<br />
CSO 016 497<br />
CSO 017 588<br />
CSO 018 575<br />
Potomac CSOs<br />
CSO 023/024 470<br />
CSO 025 24<br />
CSO 026 30<br />
CSO 027 360<br />
CSO 028 70<br />
Conceptually, the relief for the consolidated Anacostia CSOs was envisioned to occur at Main and O<br />
Street Pumping Stations. Similarly, the relief for the consolidated Potomac CSOs was envisioned to<br />
occur near the Memorial Bridge at CSO 021.<br />
11.2.4 Low Impact Development-Retrofit<br />
General<br />
In the draft LTCP, LID–R was assumed to be applied over 15% of the impervious areas in the entire<br />
District (not just the CSS area). Many comments were received indicating that a higher degree of<br />
LID-R could be applied, that LID-R should focus on the combined sewer area, and that LID-R was<br />
more effective and less costly than indicated in the draft LTCP. In response to these comments, a<br />
range of LID-R application rates was analyzed and the costs and benefits were reassessed.<br />
Modeling Approach<br />
The overall goal of LID is to mimic the natural environment and the infiltration that occurs in natural<br />
surfaces. Natural surfaces are limited in how fast they can take water (i.e. max infiltration rate) and<br />
in how much water they can absorb before saturation. A modeling technique was thus sought that<br />
would reflect these complexities.<br />
In addition, there are many LID-R technologies and each has a different applicability, effectiveness<br />
and cost. Since the LTCP must assess CSO control benefits on a CSO outfall and city-wide basis, it<br />
was not possible to identify which technology would be applied on each street, alley or lot. Instead, a<br />
more general modeling approach was needed.<br />
Given these factors, LID-R was modeled by converting impervious area in the model to pervious<br />
area. Converting impervious area to pervious area has the benefits of decreasing runoff as would<br />
occur with LID-R, and increasing the overall travel time of runoff to reduce flow peaks. A range of<br />
\\Gh-wash\eng 1160\LTCP\LTCP Final\Sec 11.doc 11-10 FINAL - July 2002
Selection of Final LTCP<br />
conversions of existing impervious area to pervious areas was modeled as follows: 0% (existing<br />
conditions), 10%, 50%, and 100%. The 100% conversion is the fairly unrealistic condition where all<br />
impervious area is converted to pervious.<br />
There is a practical interpretation of this modeling approach. To achieve the performance of the 10%<br />
conversion scenario, enough LID-R would need to be installed such that 10% of the impervious area<br />
acts like pervious area. It would not be necessary to eliminate 10% of the impervious area. Instead,<br />
enough LID-R measures could be installed so that 10% of the impervious area drains to the LID-R<br />
measures and the measures are sized large enough to act like pervious areas. The same applies for<br />
the higher degrees of impervious area conversion.<br />
The results of the CSS model indicated that about 20% of the rain in an average year runs off from<br />
pervious areas, whereas 80% runs off from impervious areas. To determine the number of LID-R<br />
facilities required to achieve a specified reduction in effective imperviousness, this relationship was<br />
used. To mimic pervious conditions, the quantity and sizing of LID facilities was determined by<br />
using enough of them and sizing them large enough to capture all but 20% of the runoff in the<br />
average year. By reviewing all storms in the 1988-1990 average year evaluation period selected for<br />
the LTCP (1988-1990), it was determined that if the first 1.25” of rain could be captured, then 80%<br />
of the runoff would be captured and 20% would be runoff. This was used as the basis for<br />
determining the number and sizes of LID-R measures.<br />
Type and Cost of LID-R Facilities Required<br />
Based on a literature review, the performance and cost of more than 20 LID-R technologies were<br />
determined. The costs were converted to a dollars per impervious acre treated at 1.25” of rain for<br />
comparison purposes. In addition, layouts and sizing were performed for technologies which appear<br />
to have good potential for applicability in built-up urban areas: infiltrating curbs, street tree filters<br />
and infiltrating catch basins. Detailed information on the literature review and cost estimation is<br />
included in Appendix E.<br />
Some of the most economical technologies in the literature such as detention basins and filter strips<br />
were based on excavating earthen basins in undeveloped areas. These types of facilities are not<br />
applicable to built-up areas like the District and were not included in the analysis.<br />
A mix of LID technologies was selected to generate a unit cost per acre for LID-R. The mix was<br />
selected as identified in Table 11-5.<br />
\\Gh-wash\eng 1160\LTCP\LTCP Final\Sec 11.doc 11-11 FINAL - July 2002
Selection of Final LTCP<br />
Table 11-5<br />
Unit Costs for LID Application<br />
Base<br />
Construction<br />
Cost<br />
Construction<br />
Cost with 30%<br />
Contingency<br />
LID-R Technology<br />
$/Imp Ac % Applied<br />
Capital Cost<br />
Bioretention $ 26,000 25% $ 6,500 $ 8,450 $ 9,100<br />
Sand Filters $ 55,000 15% $ 8,250 $ 10,725 $ 11,550<br />
Porous Pavement on Sidewalks $ 90,000 15% $ 13,500 $ 17,550 $ 18,900<br />
Infiltrating catch basins $370,000 15% $ 55,500 $ 72,150 $ 77,700<br />
Infiltrating curbs $ 77,000 20% $ 15,400 $ 20,020 $ 21,560<br />
Street Tree Filters $423,000 10% $ 42,300 $ 54,990 $ 59,220<br />
Total $/Imp ac(rounded) 100% $142,000 $ 184,000 $ 198,000<br />
Total $/acre @ 25% Impervious (rounded) $ 35,363 $ 46,000 $ 50,000<br />
Total $/acre @ 65% Impervious (rounded) $ 92,000 $ 120,000 $ 129,000<br />
Results<br />
The CSS model was used to predict the effect on CSO overflow volumes of converting impervious<br />
area to pervious through the application of LID-R. The model was run for two scenarios: Phase I<br />
<strong>Control</strong>s and Pump Station Rehabilitations and the Draft LTCP. The results are summarized in Table<br />
11-6. The results show that CSO overflows can be reduced substantially by the application of high<br />
levels of LID-R. In addition, the analyses suggest that runoff from pervious areas can cause some<br />
CSOs, particularly during the most extreme events.<br />
Table 11-6<br />
Effect of LID-R on CSO Overflow Volumes- Summary<br />
% Impervious Area Converted to Pervious<br />
Parameter 0% (Exist.) 10% 50% 100%<br />
Drainage Area Characteristics<br />
Total Drainage Area (ac) 1 12,477 12,477 12,477 12,477<br />
Acres of Impervious Area in CSO Area (ac) 5,070 4,563 2,535 0<br />
Acres of Impervious Area in CSO Area Treated by LID-R (ac) 0 507 2,535 5,070<br />
Total Runoff from CSS (mg/yr) 7,839 7,353 5,397 2,929<br />
% of Rain Appearing as Runoff (%) 56% 53% 39% 21%<br />
CSO Overflow Volume (mg/average yr)<br />
Phase I <strong>Control</strong>s and Pump Station Rehabilitation (Scenario C3) 1,969 1,814 1,305 810<br />
Draft LTCP (Scenario D70A) 259 217 102 In<br />
progress<br />
Added Capital Cost for LID-R ($ Millions) $0 $129 $646 $1,292<br />
Notes:<br />
1. Excluding CSO 059, Luzon Valley. This CSO has been separated.<br />
The effect of varying levels of LID on an outfall by outfall basis is shown in Table 11-7.<br />
\\Gh-wash\eng 1160\LTCP\LTCP Final\Sec 11.doc 11-12 FINAL - July 2002
NPDES<br />
No.<br />
Table 11-7<br />
Effect of LID-R on CSO Overflow Volumes- By Outfall<br />
# of<br />
Overflows<br />
Selection of Final LTCP<br />
% Impervious Land Converted to Pervious Land<br />
0% 10% 50% 100%<br />
CSO<br />
CSO<br />
CSO<br />
Overflow<br />
Overflow<br />
Overflow<br />
Volume # of Volume # of Volume # of<br />
(mg/yr) Overflows (mg/yr) Overflows (mg/yr) Overflows<br />
CSO<br />
Overflow<br />
Volume<br />
(mg/yr)<br />
Description<br />
Anacostia CSOs<br />
004 Poplar Pt. Bypass 0 0.00 0 0.00 0 0.00 0 0.00<br />
005 Fort Stanton 73 16.54 71 15.08 55 9.96 23 6.34<br />
006 Fort Stanton 5 0.11 4 0.10 3 0.07 2 0.04<br />
007 Fort Stanton 64 36.97 63 34.07 45 23.96 23 16.18<br />
008 AMI 0 0.00 0 0.00 0 0.00 0 0.00<br />
009 B St./N.J. Ave 54 16.84 51 15.55 39 11.02 25 7.01<br />
010 B St./N.J. Ave - O St. pumped 18 247.21 16 229.33 13 170.06 10 87.47<br />
011 B St./N.J. Ave - Main pumped 0 0.00 0 0.00 0 0.00 0 0.00<br />
011a B St./N.J. Ave - Main gravity 0 0.00 0 0.00 0 0.00 0 0.00<br />
012 Tiber Creek 6 21.74 6 15.87 4 12.51 4 5.42<br />
013 Canal Street <strong>Sewer</strong> 28 9.78 27 9.04 24 6.58 20 3.93<br />
014 Navy Yard 49 38.98 46 36.18 33 26.05 28 16.83<br />
015 Navy Yard 12 0.72 11 0.69 11 0.58 9 0.47<br />
016 Navy Yard 24 13.30 24 12.59 21 9.97 17 7.40<br />
017 Navy Yard 32 20.05 30 18.37 20 12.76 13 7.99<br />
018 Navy Yard 35 4.70 32 4.20 14 2.61 11 1.43<br />
019 Northeast Bound. - Swirl Effluent 36 645.64 33 587.48 25 392.09 15 235.38<br />
019 Northeast Bound. - Swirl Bypass 13 209.17 13 189.14 11 133.47 8 73.06<br />
Anacostia Subtotal 75 1,282 74 1,168 56 812 29 469<br />
Potomac CSOs<br />
003 Bolling AFB 0 0.00 0 0.00 0 0.00 0 0.00<br />
020 Easby Point 21 54.81 21 53.02 19 45.88 18 36.46<br />
021 Slash Run 30 458.43 29 432.45 25 335.93 23 235.40<br />
022 I St. - 22nd St, NW 30 30.04 29 28.03 26 21.06 22 14.13<br />
023/024 West Rock Creek Diversion <strong>Sewer</strong> 17 16.23 16 14.73 14 10.21 9 5.80<br />
025 31st & K St NW 14 0.16 12 0.15 9 0.09 5 0.05<br />
026 <strong>Water</strong> St District (WRC) 0 0.00 0 0.00 0 0.00 0 0.00<br />
027 Georgetown 72 52.50 71 46.85 57 26.37 21 11.27<br />
028 37th St- Georgetown 13 0.49 12 0.45 8 0.31 5 0.19<br />
029 College Pond 56 26.00 53 23.98 38 17.03 24 11.13<br />
030 Abandoned -- -- -- -- -- -- -- --<br />
060 Little Falls Branch Emerg. Bypass 0 0.00 0 0.00 0 0.00 0 0.00<br />
Potomac Subtotal 74 639 72 600 58 457 26 314<br />
Rock Creek CSOs<br />
031 Penn Ave - Middle E. Rock Creek 9 0.22 9 0.20 8 0.16 6 0.11<br />
032 26th - M St - Middle E. Rock Creek 0 0.00 0 0.00 0 0.00 0 0.00<br />
033 N St. - 25th St - Middle E. Rock Crk. 6 4.48 6 4.16 5 2.99 3 1.89<br />
034 Slash Run Trunk <strong>Sewer</strong> 0 0.00 0 0.00 0 0.00 0 0.00<br />
035 Northwest Boundary 0 0.00 0 0.00 0 0.00 0 0.00<br />
036 Mass Ave & 24th - E. Rock Crk. 29 1.64 28 1.55 25 1.23 22 0.87<br />
037 Kalorama Circle West - E. Rock Crk. 3 0.05 3 0.05 3 0.04 3 0.03<br />
038 Kalorama Circle East - E. Rock Crk. 0 0.00 0 0.00 0 0.00 0 0.00<br />
039 Belmont Rd - East Rock Creek 0 0.00 0 0.00 0 0.00 0 0.00<br />
040 Biltmore St - East Rock Creek 1 0.03 1 0.03 1 0.02 1 0.01<br />
041 Ontario Rd - Upper E. Rock Crk. 0 0.00 0 0.00 0 0.00 0 0.00<br />
042 Quarry Rd - Upper E. Rock Crk. 0 0.00 0 0.00 0 0.00 0 0.00<br />
043 Irving St. - Upper E. Rock Crk 1 0.15 1 0.13 1 0.06 1 0.01<br />
044 Kenyon St. - Upper E. Rock Crk. 0 0.00 0 0.00 0 0.00 0 0.00<br />
045 Lamont St. - Upper E. Rock Creek 2 0.03 2 0.03 2 0.02 2 0.01<br />
\\Gh-wash\eng 1160\LTCP\LTCP Final\Sec 11.doc 11-13 FINAL - July 2002
Selection of Final LTCP<br />
% Impervious Land Converted to Pervious Land<br />
0% 10% 50% 100%<br />
CSO<br />
CSO<br />
CSO<br />
Overflow<br />
Overflow<br />
Overflow<br />
Volume # of Volume # of Volume # of<br />
(mg/yr) Overflows (mg/yr) Overflows (mg/yr) Overflows<br />
CSO<br />
Overflow<br />
Volume<br />
(mg/yr)<br />
NPDES<br />
No.<br />
Description<br />
# of<br />
Overflows<br />
046 Park Road - Upper E. Rock Creek 2 0.01 2 0.01 1 0.00 1 0.00<br />
047 Ingleside Terr. - Upper E. Rock Crk. 3 0.25 3 0.23 1 0.16 1 0.10<br />
048 Oak St-Mt Pleasant Upper E Rock C. 2 0.08 2 0.07 2 0.05 2 0.03<br />
049 Piney Branch 25 39.73 25 37.70 22 30.22 19 22.51<br />
050 M St -27th St - West Rock Creek 0 0.00 0 0.00 0 0.00 0 0.00<br />
051 Olive - 29th St. - West Rock Creek 0 0.00 0 0.00 0 0.00 0 0.00<br />
052 O St.-31st St, NW 0 0.00 0 0.00 0 0.00 0 0.00<br />
053 Q St - West Rock Creek 0 0.00 0 0.00 0 0.00 0 0.00<br />
054 West Rock Creek Diversion <strong>Sewer</strong> 0 0.00 0 0.00 0 0.00 0 0.00<br />
055 Aband (Mass Ave & Whitehaven) 0 0.00 0 0.00 0 0.00 0 0.00<br />
056 Normanstone Dr.-relief for WRCDS 0 0.00 0 0.00 0 0.00 0 0.00<br />
057 Cleveland - 28 th St & Conn. Ave 15 2.33 14 2.13 11 1.46 7 0.90<br />
058 Connecticut Ave. 0 0.00 0 0.00 0 0.00 0 0.00<br />
Rock Creek Subtotal 30 49 30 46 27 36 24 26<br />
TOTAL 1,969 1,814 1,305 810<br />
Varying degrees of LID-R are combined with other CSO controls in subsequent sections to develop<br />
complete control plans.<br />
11.2.5 Limits On Blue Plains<br />
Blue Plains Wastewater Treatment <strong>Plan</strong>t (BPWWTP) is rated for an annual average flow of 370 mgd.<br />
During wet weather events, flows up to 740 mgd can receive treatment for up to 4 hours. After the<br />
first 4 hours, the treatment capacity is reduced to 511 mgd to protect the biological process.<br />
Additional flows of up to 336 mgd that exceed the treatment capacity of the plant receive excess flow<br />
treatment, which consists of screening, grit removal, primary treatment and disinfection before<br />
discharge to the Potomac River. This results in an overall plant capacity of 1076 mgd for the first<br />
four hours and 847 mgd thereafter.<br />
The current NPDES permit has no limit on how long the treatment plant must operate at 511 mgd<br />
during wet weather events. During back to back storms or during sustained hurricanes, the plant<br />
could be called upon to operate at 511 mgd for extended periods. Experience indicates that operation<br />
at 511 mgd indefinitely is not practical. Such operation would cause process washouts and failure of<br />
the nitrification/denitrification processes. In order to prevent such occurrences, the alternatives for<br />
the LTCP have been based upon treating up to 740 mgd for four hours and up to 511 mgd for the<br />
next 20 hours (total time of 4 hours +20 hours = 24 hours). After 24 hours, the maximum flow<br />
treated by the plant would be 450 mgd. The flow rate of 450 mgd is the maximum sustained rate that<br />
the plant can accommodate for an extended period of time.<br />
\\Gh-wash\eng 1160\LTCP\LTCP Final\Sec 11.doc 11-14 FINAL - July 2002
Selection of Final LTCP<br />
11.2.6 Excess Flow Treatment at Blue Plains<br />
The CSO Policy recognizes that treatment plants may have primary treatment capacity in excess of<br />
secondary treatment capacity and that maximizing the use of this capacity can be an effective<br />
approach to CSO control. The CSO Policy considers CSO flows that enter the headworks of a plant<br />
but that do not receive secondary treatment to be a bypass, and indicates that such CSO bypasses<br />
may be permitted provided that:<br />
<br />
<br />
<br />
Justification for the flow rate at which CSO will be diverted from secondary treatment is<br />
made.<br />
A cost-benefit analysis demonstrates that this approach is more beneficial than other CSO<br />
abatement alternatives such as storage and pump back for secondary treatment, sewer<br />
separation and satellite treatment.<br />
The treatment approach is recognized in the NPDES Permit.<br />
At BPWWTP, excess flows up to 336 mgd receive excess flow treatment and are discharged at<br />
outfall 001. Excess flow treatment consists of screening, grit removal, primary clarification,<br />
disinfection and dechlorination. This subsection provides justification that outfall 001 is a CSO and<br />
that it meets the requirements of the CSO policy as specified above.<br />
Blue Plains was originally designed and constructed in the 1930s to provide only primary treatment.<br />
The discharge from the original plant was through the outfall now designated as 001. The plant was<br />
upgraded many times and the outfall now designated as 002 was added in the 1970s for the discharge<br />
of flow receiving advanced treatment. Two outfalls were needed because the secondary and new<br />
advanced treatment facilities were not designed with sufficient capacity to treat total peak wet<br />
weather flows for which the primary treatment facilities were designed.<br />
These two separate outfalls were incorporated into the first NPDES permit issued for Blue Plains in<br />
the 1970s. At that time, the original primary treatment outfall was designated outfall 001 for excess<br />
flow and the secondary outfall was designated as outfall 002 for complete treatment. This “twooutfall”<br />
concept has been retained since then through several plant upgrades and expansions as well<br />
as successive permit reissuances and amendments. Fact Sheets accompanying these permit<br />
reissuances and amendments have noted that outfall 001 is the excess flow conduit, used primarily to<br />
avoid hydraulic overloads at the plant.<br />
The cut-off point for diversion of excess flow from secondary treatment is 740 mgd for the first four<br />
hrs, 511 mgd for the next 20 hours and 450 mgd thereafter. The selection of the 740/511 mgd rates<br />
was made after the Blue Plains Feasibility Study in 1984. The flow and time limits were developed<br />
to avoid washing out secondary biological processes. The 450 mgd limit was developed based on<br />
operating experience.<br />
\\Gh-wash\eng 1160\LTCP\LTCP Final\Sec 11.doc 11-15 FINAL - July 2002
Selection of Final LTCP<br />
Cost-benefit analyses were made of other options for handling excess flows. The alternatives are<br />
described below:<br />
<br />
<br />
<br />
<br />
<br />
<br />
Alternative 1: Excess Flow <strong>System</strong> – maintain the current excess flow system, but improve<br />
its reliability by adding four additional primary clarifiers and making improvements to the<br />
excess flow control system<br />
Alternative 2: Add storage – abandon the existing excess flow treatment system, and<br />
increase the size of the proposed storage tunnels to provide the same degree of CSO control.<br />
Modeling indicates that 200 million gallons of additional storage would be required on top of<br />
the proposed 193 mg of storage in the LTCP, for a total of 393 million gallons. Because of<br />
the large storage volume required, BPWWTP would have inadequate capacity to dewater the<br />
tunnels before the next rain event (within 48-72 hours). As a result, this alternative includes<br />
a dedicated 200 mgd high rate treatment facility located at BPWWTP to dewater the tunnels.<br />
Alternative 3: Satellite Treatment – this involves constructing a remote high rate treatment<br />
facility. The facility has a capacity of 350 mgd (to replace the existing excess flow) and was<br />
sited for costing purposes on Federal property between Bolling Air Force Base and the Naval<br />
Air Station. Property would need to be acquired for this option. It may not be practical to<br />
obtain such property.<br />
Alternative 4: Replace Existing Excess Flow with High Rate Treatment – this involves<br />
replacing the existing excess flow system with a 350 mgd high rate treatment facility located<br />
at BPWWTP.<br />
Alternative 5 Separation – this alterative consists of separating approximately 60 % of the<br />
combined sewer area such that excess flow would no longer be required and CSO overflows<br />
would be reduced using the tunnels to the same degree of CSO control as proposed in the<br />
LTCP.<br />
Alternative 6 – Expand Secondary Treatment capacity of BPWWTP – this alternative<br />
consists of expanding the capacity of BPWWTP downstream of the primary facilies by 336<br />
mgd. Given the lack of land at the site and the large increase in capacity required compared<br />
to the capacity of the existing plant (336 mgd vs. 370 mgd average), this option has been<br />
deleted from further consideration.<br />
The alternatives are summarized in Table 11-8.<br />
Table 11-8<br />
Comparison of Alternatives to Excess Flow<br />
Capital Cost ($millions,<br />
ENR = 6383)<br />
% Above<br />
Lowest Cost<br />
Alternative<br />
Sizing<br />
336 mgd, modifications to<br />
1. Excess Flow <strong>System</strong> improve reliability $22 0 %<br />
2. Add Storage Add 200 mg tunnel storage, $784 3,464 %<br />
\\Gh-wash\eng 1160\LTCP\LTCP Final\Sec 11.doc 11-16 FINAL - July 2002
Selection of Final LTCP<br />
Alternative<br />
Sizing<br />
Capital Cost ($millions,<br />
ENR = 6383)<br />
% Above<br />
Lowest Cost<br />
and 200 mgd high rate<br />
treatment to dewater tunnel<br />
3. Satellite Treatment 350 mgd high rate treatment $363 1,550 %<br />
4. Replace Existing<br />
Excess Flow with High<br />
Rate Treatment<br />
Add 350 mgd High Rate<br />
Treatment<br />
$279 1,168 %<br />
5. Separation Separate 60% of CSO area $2,125 8,400 %<br />
6. Expansion of BPWWTP Not feasible Not feasible --<br />
Alternatives 2 through 5 are an order of magnitude more expensive than retaining the excess flow<br />
system with improvements.<br />
The water quality benefits of Alternatives 2 through 5 were estimated using the Potomac receiving<br />
water model. The results are shown in Table 11-9. The results indicate that even with the existing<br />
storm water and upstream loads present, the Potomac River is predicted to meet the Class A fecal<br />
coliform standard every month in the average year. Given the high cost of the alternatives to excess<br />
flow and the lack of substantive water quality benefit, the recommended approach is to retain the<br />
excess flow treatment system, with modifications to improve its reliability.<br />
Table 11-9<br />
<strong>Water</strong> Quality Benefits of Alternatives to Excess Flow<br />
No. of Months/avg year Fecal Coliform Geometric<br />
Mean >200/100ml<br />
Alternative<br />
All Loads<br />
Present<br />
CSO Loads Only<br />
(no upstream or storm water loads)<br />
1. Excess Flow <strong>System</strong> 0 0<br />
2. Eliminate Excess flow or provide<br />
High Rate Treatment (Alternatives<br />
2 through 5) 0 0<br />
11.2.7 Effect of B Street/ New Jersey Avenue <strong>Sewer</strong><br />
The Rock Creek Main Interceptor starts in upper Rock Creek and conveys flows south to the<br />
Potomac area sewers. Near lower Rock Creek, the Rock Creek Main Interceptor turns into the B<br />
Street/New Jersey Avenue sewer, which conveys flows through the Potomac area to the Main<br />
Pumping Station along the bank of the Anacostia River. The B Street/New Jersey Avenue sewer acts<br />
to transfer flows from the Rock Creek and Potomac areas to the Anacostia River.<br />
Modeling was performed to determine the effect of terminating this connection in an attempt to<br />
reduce CSO to the Anacostia River. The results are summarized in Table 11-10.<br />
\\Gh-wash\eng 1160\LTCP\LTCP Final\Sec 11.doc 11-17 FINAL - July 2002
Selection of Final LTCP<br />
Table 11-10<br />
Effect of Shutting off Inter-basin Transfer at B St/ New Jersey Ave <strong>Combined</strong> <strong>Sewer</strong><br />
(Average Year 1988-1990)<br />
Anacostia<br />
River<br />
Potomac<br />
River<br />
Rock<br />
Creek<br />
Total<br />
<strong>System</strong><br />
Item<br />
CSO Overflow Volume (mg/yr)<br />
Phase I <strong>Control</strong>s & Pump Station Rehabilitation 1,282 639 49 1,969<br />
As above with B St/ NJ Ave connection shut off 1,142 664 50 1,857<br />
% Change -11 % + 4% + 2% -6%<br />
Number of Overflows/yr<br />
Phase I <strong>Control</strong>s and Pump Station Rehabilitation 75 74 30 -<br />
As above with B St/ NJ Ave connection shut off 75 74 29 -<br />
% Change 0% 0% 3% -<br />
Preventing the transfer of flow from the Potomac area to the Anacostia has the effect of decreasing<br />
Anacostia CSOs, but increasing Potomac and Rock Creek CSOs. This is consistent with the<br />
operation of the sewer. During extreme storm events, the inter-basin transfer would need to be<br />
maintained to prevent flooding in upstream areas. As a result, some type of automatically operated<br />
gate would likely be required. Such a system would be difficult to operate and maintain give the<br />
constant flows in the interceptor.<br />
Due to the detrimental effect on the Potomac River and since Potomac controls are proposed to be<br />
constructed later in the schedule, terminating eth inter-basin transfer is not proposed as part of the<br />
LTCP.<br />
11.3 DESCRIPTION OF ALTERNATIVES<br />
11.3.1 General<br />
In response to comments and upon further evaluation of the Draft plan, additional CSO control<br />
alternatives were developed and evaluated. Alternatives that combined multiple technologies such as<br />
tunnel storage, targeted separation, LID-R and other features were also developed. Some alternatives<br />
were developed to provide higher degrees of control than the Draft LTCP, while others were<br />
developed to provide equivalent performance though the use of alternative technologies. As an<br />
example, alternatives were developed where targeted separation and LID-R were included and the<br />
tunnels proposed in the Draft LTCP were downsized to provide performance equivalent to the Draft<br />
LTCP. Equivalent performance has been defined as providing the same number of overflows in the<br />
average year, not necessarily the same overflow volume. This is because some alternatives such as<br />
LID-R fundamentally change the relationship between overflow volume and number of overflows.<br />
The number of overflows was selected as an indicator of equivalent performance because it related to<br />
the number of times the use of the waterway may be affected by CSO discharges.<br />
\\Gh-wash\eng 1160\LTCP\LTCP Final\Sec 11.doc 11-18 FINAL - July 2002
Selection of Final LTCP<br />
When considering the alternatives, it was useful to group them into categories based on the amount<br />
of CSO storage volume required. The required storage volume can be changed by the application of<br />
LID-R or separation, but the description of plans based on this criteria provides a comparison of the<br />
relative magnitude of control. The required storage volumes are summarized in Table 11-11, and the<br />
alternatives are summarized below.<br />
Table 11-11<br />
Range of CSO Storage Volumes Required for Alternatives<br />
Required CSO<br />
Alternative<br />
Storage Volume (mg)<br />
Based on Draft LTCP<br />
~150 mg<br />
1-Year Storm and DOH <strong>Plan</strong><br />
~200-250 mg<br />
2-Year Storm and Zero Overflows in 1988-1990 ~430 mg<br />
5 Year Storm 775+ mg<br />
Except for the Draft LTCP, all alternatives include consolidation of CSOs 016, 017, and 018 on the<br />
Anacostia and CSO 023/024, 025, 026, 027, and 028 on the Potomac. Except for the Draft LTCP, all<br />
alternatives also include either one of the following:<br />
<br />
<br />
Targeted separation of the 30 CSO outfalls identified earlier in this section or<br />
Limited separation of the following outfalls:<br />
o CSO 006 on the Anacostia<br />
o CSOs 031, 037, 053, and 058 on Rock Creek<br />
Limited separation was included as another option because of the high cost of the targeted separation<br />
outfalls.<br />
11.3.2 Alternatives Based on Draft LTCP<br />
One group of alternatives was based on the Draft LTCP with variations in targeted separation, LID-<br />
R, sanitary flow rates, wet weather peaking factors, and facility sizes. The alternatives can be<br />
grouped in the following categories:<br />
<br />
Addition of LID-R and Targeted Separation – these alternatives consist of the program<br />
outlined in the Draft LTCP with the addition of LID-R, targeted separation, and changes in<br />
the size of the tunnels to achieve different levels of control.<br />
<br />
Changes in District and Suburban Dry Weather Flow- Comments were received suggesting<br />
that WASA should reduce the base sanitary flow in the District by water conservation,<br />
infiltration control and other measures. In the Draft LTCP, the dry weather flow in the<br />
District was set at 158 mgd, equal to the IMA allowance. In 2002, The Metropolitan<br />
\\Gh-wash\eng 1160\LTCP\LTCP Final\Sec 11.doc 11-19 FINAL - July 2002
Selection of Final LTCP<br />
Washington Council of Governments (MWCOG) completed wastewater flow projections for<br />
the BPWWTP, with a planning horizon of about 25 years. MWCOG uses the Regional<br />
Wastewater Flow Forecast Model (RWFFM) to project flows. The RWFFM is a computer<br />
model that links a GIS sewer shed layer with population projections to compute wastewater<br />
flows. The RWFFM develops a base year flow based on regression analysis of historical<br />
data. This is done to dampen the effects of short-term flow fluctuations. From the base year<br />
flow, the model then projects future flows based on population changes, infiltration and<br />
inflow allowances, and changes in wastewater management such as flow diversions to other<br />
treatment facilities.<br />
MWCOG indicates that the year 2000 wastewater flow to the District was 160 mgd. The<br />
population in the District is projected to increase from about 518,000 in 2000 to about<br />
648,000 in 2025. The unadjusted year 2025 wastewater flow from the District is projected to<br />
average 180 mgd. The term ‘unadjusted’ means it does not account for other changes in the<br />
sewer system. WASA plans a Wastewater Flow Reduction Program, a <strong>Water</strong> Conservation<br />
Program, and a <strong>Sewer</strong> <strong>System</strong> Assessment Program that are expected to achieve a total 20<br />
mgd reduction in District Wastewater Flows. Considering these adjustments, MWCOG<br />
projects the flow from the District in 2025 to be 160 mgd. The year 2025 wastewater flow of<br />
160 mgd is extremely close to the 158 mgd used in draft LTCP. As a result, the Draft LTCP<br />
does allow for substantial population growth in the District without an increase in overflows.<br />
In order to demonstrate the impact of changes in sanitary flow on overflows, the following<br />
two alternatives were developed:<br />
o Alternative D70F- Draft LTCP with District dry weather flow reduced to 138<br />
mgd<br />
o Alternative D70G - Draft LTCP with District DWF increased to 180 mgd<br />
<br />
Changes in Suburban Peaking Factors – Comments were received indicating that the wet<br />
weather peaking factors of the large suburban jurisdictions should be reduced as a form<br />
of CSO control. This was modeled by setting the peaking factors equal to 1 for the<br />
following large suburban flows: Potomac Interceptor, Rock Creek and WSSC Anacostia<br />
Pumping Stations which have IMA average flows of 54.6 mgd, 33.5 mgd, and 83.2 mgd,<br />
respectively. The total IMA average flow from these sources is 171.3 mgd or 81 % of the<br />
total flow of 212 mgd allocated to the suburbs. The large flows were selected because<br />
control of them would have a greater impact on CSOs and because they might be more<br />
cost effective to control than many small flows. For costing purposes, it was assumed<br />
that flow equalization basins would be constructed near the District Boundary to reduce<br />
the peaking factors.<br />
\\Gh-wash\eng 1160\LTCP\LTCP Final\Sec 11.doc 11-20 FINAL - July 2002
Selection of Final LTCP<br />
11.3.3 Alternatives Based on 1-Year 24-Hour Storm<br />
An alternative was developed that was sized to accommodate the 1-year storm. This alternative was<br />
then run for the 3-year evaluation period to determine its CSO performance in the average year. The<br />
analyses indicated that a CSO storage volume of 193 mg was required to control to the 1-year 24-<br />
hour storm. The tunnels in the Draft LTCP can be upsized to accommodate this requirement.<br />
With BPWWTP operating at 450 mgd and with average flows of 370 mgd, it would take about 58<br />
hours to dewater the tunnels if they were full. This is longer than the goal of 48 hours for<br />
dewatering. However, an evaluation of the frequency of the large events that would produce enough<br />
overflow to fill the tunnel was made. The analyses indicated that there are relatively few events in<br />
the year that will fill the tunnel to capacity. Given the low frequency with which this occurs,<br />
BPWWTP can accommodate the infrequent need to dewater the tunnels longer than 48 hours.<br />
11.3.4 Alternatives Based on D.C. Department of Health Proposal<br />
The D.C. Department of Health (DOH) proposed that the CSO controls for the Anacostia and Rock<br />
Creek be sized for no overflows in the dry and average year with 1 to 2 overflows in the wet year.<br />
DOH indicated the level of control proposed in the Draft LTCP was acceptable for the Potomac (9<br />
overflows per year). In the three year analysis period, 1988 was the dry year with 31.74” of rain,<br />
1990 was the average year with 40.94” of rain, and 1989 was the wet year with 50.32 “ of rain.<br />
The analyses indicated that the Anacostia and Rock Creek tunnel volumes would need to be<br />
increased and that the tunnels proposed in the Draft LTCP could be upsized to accommodate this<br />
increase. The total CSO storage volume required was determined to be slightly larger than that<br />
required for the the1-year storm 24-hour storm.<br />
Figure 11-5 presents the major components of plans based on the Draft LTCP, the 1-year 24-hour<br />
storm and the DOH <strong>Plan</strong>.<br />
11.3.5 Expanded <strong>Plan</strong><br />
An alternative was developed that provided the following level of CSO control:<br />
<br />
<br />
No overflows in the dry and average years, and 1 overflow in the wet year in the<br />
Anacostia and Rock Creek<br />
4 overflows per year on the Potomac<br />
The plan includes the tunnels proposed in the Draft LTCP upsized to accommodate the higher degree<br />
of control. Due to the large storage volume, BPWWTP has an inadequate capacity to dewater the<br />
tunnels in a reasonable amount of time. As a result, alternate means of treating the tunnel contents<br />
were required. This was accomplished by constructing a 350 mgd high rate physical chemical (High<br />
\\Gh-wash\eng 1160\LTCP\LTCP Final\Sec 11.doc 11-21 FINAL - July 2002
Selection of Final LTCP<br />
Rate) treatment facility at BPWWTP. A dedicated force main would be constructed from the<br />
proposed tunnel dewatering pumping station at Poplar Point to the high rate facility. The tunnel<br />
contents would be dewatered through the high rate facility, disinfected, dechlorinated and discharged.<br />
During wet weather events, it was envisioned that the new high rate facility would be used in place of<br />
the existing excess flow treatment system at BPWWTP, and would treat up to 350 mgd of excess<br />
flow during rain events. This would provide a higher quality effluent than the existing excess flow<br />
treatment system. Figure 11-6 presents the major components of the expanded plan.<br />
11.3.6 Alternatives Based on Zero Overflows in the Period 1988-1990<br />
An alternative was developed to provide zero overflows in each of the three analysis years. Due to<br />
the large CSO storage volumes required, it was not feasible to simply increase the diameter of the<br />
tunnels proposed in the Draft LTCP. Instead, it was necessary to extend the tunnels as follows:<br />
<br />
<br />
<br />
<br />
Anacostia – extend the Anacostia tunnel from Poplar Point to BPWWTP<br />
Potomac – Extend the Potomac tunnel from the Potomac Pumping Station to connect with the<br />
Anacostia Tunnel near Main and O Street Pumping Stations<br />
Piney Branch- Delete the Piney Branch storage tunnel proposed in the Draft LTCP. Instead,<br />
extend the Anacostia tunnel along Florida Avenue up to Piney Branch to capture this<br />
overflow.<br />
Blue Plains – construct a 350 mgd high rate treatment facility and a central tunnel dewatering<br />
pump station at the plant. Dewater the tunnels through the high rate facility.<br />
11.3.7 Alternatives Sized for 5-Year 24-Hour Storm<br />
This alternative was sized for the 5-year 24-hour storm. The tunnels were configured as above for<br />
the zero overflow in three years option. Due to the large storage volume required, it was not feasible<br />
to capture all of the CSO in the tunnel. Instead, the first 773 mg is captured in the tunnel and the<br />
remainder is conveyed by the tunnel to Blue Plains where it treated by a 1,725 mgd sedimentation/<br />
disinfection facility.<br />
Figure 11-7 presents the major components of plans based on zero overflows in 1988-1990 and based<br />
on the 5-year 24-hour storm. A summary of the alternatives is included in Table 11-12.<br />
\\Gh-wash\eng 1160\LTCP\LTCP Final\Sec 11.doc 11-22 FINAL - July 2002
Selection of Final LTCP<br />
LID @<br />
WASA<br />
Facilities<br />
Other<br />
LID<br />
Table 11-12<br />
Description of Alternatives<br />
Target<br />
Separation<br />
Limited<br />
Separation Consolidation Notes<br />
Alternative<br />
No.<br />
Alternative<br />
Based on Draft<br />
LTCP<br />
Draft LTCP Yes -- -- -- -- D70A<br />
Draft LTCP + 10%<br />
LID-R Yes 10% -- Yes Yes D70B<br />
Draft LTCP + 50%<br />
LID-R Yes 50% -- Yes Yes D70C<br />
Draft LTCP + 10%<br />
LID-R (Equal<br />
Performance) Yes 10% -- Yes Yes<br />
Draft LTCP + 50%<br />
LID-R (Equal<br />
Performance) Yes 50% -- Yes Yes<br />
Draft LTCP + Target<br />
Separation (Equal<br />
Performance) Yes -- Yes -- Yes<br />
Tunnels downsized to<br />
provide performance<br />
equivalent to Draft LTCP<br />
Tunnels downsized to<br />
provide performance<br />
equivalent to Draft LTCP<br />
Tunnels downsized to<br />
provide performance<br />
equivalent to Draft LTCP<br />
D70K<br />
Draft LTCP + 10%<br />
LID-R + Targeted<br />
Separation Yes 10% Yes -- Yes D70D<br />
Draft LTCP + 50%<br />
LID-R + Targeted<br />
Separation Yes 50% Yes -- Yes D70E<br />
Draft LTCP + 10%<br />
LID-R + Targeted<br />
Separation (Equal<br />
Performance) Yes 10% Yes -- Yes<br />
Draft LTCP + No<br />
Peaking Factors for<br />
Large suburbs Yes -- -- Yes Yes<br />
Draft LTCP with<br />
District DWF<br />
Reduced to 138 mgd Yes -- -- Yes Yes<br />
Draft LTCP with<br />
District DWF<br />
Increased to 180 mgd Yes -- -- Yes Yes<br />
D70J<br />
D70M<br />
Tunnels downsized to<br />
provide performance<br />
equivalent to Draft LTCP D70I<br />
Wet weather peaking<br />
factors for the following<br />
suburban flows reduced<br />
to 1.0 (i.e. no wet weather<br />
peak): Potomac<br />
Interceptor, Rock Creek,<br />
WSSC Anacostia<br />
Pumping Stations<br />
D70F<br />
District dry weather flow<br />
reduced from 158 mgd to<br />
138 mgd D70G<br />
District dry weather flow<br />
increased from 158 mgd<br />
to 180 mgd<br />
D70L<br />
1-Year Storm<br />
1 Year Storm Yes -- -- Yes Yes D70P<br />
DOH <strong>Plan</strong><br />
DOH <strong>Plan</strong> Yes -- -- Yes Yes D71A<br />
DOH <strong>Plan</strong>+10% LID<br />
+ Targeted<br />
Separation Yes 10% Yes -- Yes D71D<br />
DOH <strong>Plan</strong>+10% LID<br />
+ Targeted<br />
Separation (Equal<br />
Performance) Yes 10% Yes -- Yes<br />
Tunnels downsized to<br />
provide performance<br />
equivalent to Draft LTCP<br />
Enhanced LTCP<br />
Enhanced LTCP Yes -- -- Yes Yes D75A<br />
D71F<br />
\\Gh-wash\eng 1160\LTCP\LTCP Final\Sec 11.doc 11-26 FINAL - July 2002
Selection of Final LTCP<br />
Alternative<br />
LID @<br />
WASA<br />
Facilities<br />
Other<br />
LID<br />
Target<br />
Separation<br />
Limited<br />
Separation Consolidation Notes<br />
Enhanced LTCP<br />
Tunnels downsized to<br />
+10% LID (Equal<br />
provide performance<br />
Performance) Yes 10% -- Yes Yes equivalent to Draft LTCP<br />
Enhanced LTCP<br />
Tunnels downsized to<br />
+10% LID +<br />
provide performance<br />
Targeted Separation<br />
equivalent to Enhanced<br />
(Equal Performance) Yes 10% Yes -- Yes LTCP<br />
Alternative<br />
No.<br />
D75I<br />
Zero Overflows in 3<br />
Years (~2-Year<br />
storm)<br />
Zero Overflows in 3<br />
Years (~2-Year<br />
storm) Yes -- -- Yes Yes D72A<br />
5-Year Storm<br />
Base <strong>Plan</strong> Yes -- -- Yes Yes D73C-5yr<br />
Base <strong>Plan</strong> + 10%<br />
LID + Targeted<br />
Separation (Equal<br />
Performance) Yes 10% Yes -- Yes<br />
Tunnels downsized to<br />
provide performance<br />
equivalent to base <strong>Plan</strong><br />
D75J<br />
D73E<br />
11.4 EVALUATION OF ALTERNATIVES<br />
Alternative control plans were evaluated against many criteria and were assembled into a matrix for<br />
comparison. The criteria were as follows:<br />
<br />
<br />
<br />
<br />
<br />
CSO <strong>Control</strong> Performance – the number of overflows and overflow volume in the average<br />
year was tabulated based on the combined sewer system model for each alternative.<br />
Cost - the capital cost, operation and maintenance cost and the 20-year net present worth was<br />
estimated for each plan.<br />
<strong>Water</strong> quality performance – using the receiving water models, the number of days in the<br />
calendar year when the fecal coliform concentration was predicted to exceed 200 per 100 ml<br />
was predicted. The prediction was made with background loads (storm water and upstream<br />
loads) at their existing levels, and with background loads set to zero. The scenarios with<br />
background loads set to zero accentuates the impact of CSOs and makes it possible to<br />
distinguish between alternative control plans. It also indicates the number of days per<br />
average year that CSOs will have an impact on the receiving waters.<br />
Impact on Blue Plains – The method of dewatering the storage and the handling of excess<br />
flows at Blue Plains was considered for each alternative.<br />
Impact on IMA Flows – increasing the amount of CSO captured and treated at Blue Plains<br />
will increase the annual average flows attributed to the District under the IMA. The relative<br />
impact of each of the alternatives was calculated using the scenario of No Phase I <strong>Control</strong>s<br />
(no inflatable dams or swirl facility) as a baseline.<br />
The alternatives are tabulated in Table 11-13.<br />
\\Gh-wash\eng 1160\LTCP\LTCP Final\Sec 11.doc 11-27 FINAL - July 2002
Selection of Final LTCP<br />
Parameter<br />
Table 11-13<br />
Final Alternatives Comparison (ENR= 6383)<br />
Existing<br />
Phase I +<br />
P.S. Rehab<br />
Draft LTCP<br />
B1 C3 D70A D70B D70C D70J D70M<br />
Phase I<br />
+ 10% LID + 50% LID<br />
No Phase I <strong>Control</strong>s & Draft + 10%<br />
(Equal (Equal<br />
<strong>Control</strong>s P.S. Rehab LTCP LID + 50% LID Performance) Performance)<br />
Tunnel Storage Volume (mg)<br />
Anacostia 0 0 108 108 108 99 71<br />
Potomac 0 0 35 35 35 30 24<br />
Rock Creek 0 0 4 4 4 3 2.5<br />
Total 0 0 147 147 147 132 98<br />
No. Overflow/Avg. Yr.<br />
Anacostia 82 75 4 3 1 4 4<br />
Potomac 74 74 9 7 4 9 9<br />
Rock Creek (Piney Branch/Others) 30 30 4 / 4 3 / 4 2 / 3 4 / 4 4 / 4<br />
CSO Overflow Vol. (mg/avg yr.)<br />
Anacostia 2,142 1,282 93 71 16 102 110<br />
Potomac 1,063 639 153 134 78 162 149<br />
Rock Creek 49 49 13 12 8 12 10<br />
Total 3,254 1,970 259 217 102 276 269<br />
Capital Cost ($M)<br />
LID-R $0 $0 $3 $129 $646 $129 $646<br />
Anacostia $0 $115 $856 $886 $886 $873 $834<br />
Potomac $0 $12 $189 $209 $209 $199 $190<br />
Rock Creek $0 $0 $38 $42 $42 $42 $41<br />
Blue Plains $0 $0 $22 $22 $22 $22 $220<br />
Total $0 $127 $1,108 $1,288 $1,805 $1,265 $1,931<br />
Operation & Maintenance ($M/yr) $0 $0 $12 $16 $35 $16 $35<br />
20 Yr. Net Present Worth $0 $0 $1,275 $1,524 $2,311 $1,498 $2,430<br />
% Above Draft LTCP - - 0 20% 81% 17% 91%<br />
$M/day gained compared to Draft<br />
LTCP - - - $45 $44 >$100 >$100<br />
<strong>Water</strong> Quality Performance<br />
(Avg. Yr.)<br />
# days FC>200 (CSO Only)<br />
Anacostia @ Navy Yard 212 120 11 9 2 12 13<br />
Potomac @ Memorial Bridge 57 44 10 9 5 10 11<br />
Rock Creek @ Zoo 22 22 4 3 2 4 4<br />
# days FC>200 (All Loads)<br />
Anacostia @ Navy Yard 239 200 183 183 182 183 183<br />
Potomac @ Memorial Bridge 142 133 107 107 107 108 108<br />
Rock Creek @ Zoo 294 294 294 294 294 294 294<br />
Blue Plains<br />
Excess Flow Existing Existing Existing Existing Existing Existing Existing<br />
Tunnel Dewatering - - BP 002 BP 002 BP 002 BP 002 BP 002<br />
BP002 Dewatering Rate (mgd) - - 450 450 450 450 450<br />
Dewatering Time (hrs) - - 44 44 44 40 29<br />
IMA Impacts - Increase in Avg.<br />
Flow (mgd) Baseline +3.5 +8.2 +6.5 +0.1 +6.3 -0.4<br />
\\Gh-wash\eng 1160\LTCP\LTCP Final\Sec 11.doc 11-28 FINAL - July 2002
Parameter<br />
Table 11-13 (continued)<br />
Final Alternatives Comparison (ENR= 6383)<br />
Draft LTCP<br />
+ Target<br />
Separation<br />
(Equal Perf.)<br />
Selection of Final LTCP<br />
D70K D70D D70E D70I D70F D70G D70L<br />
+ 10% LID + + No Peak<br />
+ 10% LID + + 50% LID Target Factor for +District<br />
Target + Target Separation Large DWF=138<br />
Separation Separation (Equal Perf) Suburbs mgd<br />
+District<br />
DWF=180<br />
mgd<br />
(Equal Perf)<br />
Tunnel Storage Volume (mg)<br />
Anacostia 93 108 108 84 108 108 115<br />
Potomac 25 35 35 21 35 35 35<br />
Rock Creek 3 4 4 3 4 4 4<br />
Total 121 147 147 108 147 147 154<br />
No. Overflow/Avg. Yr.<br />
Anacostia 4 2 1 4 4 3 4<br />
Potomac 9 5 3 9 7 7 9<br />
Rock Creek (Piney Branch/Others) 4 / 4 3 / 3 2 / 2 4 / 4 4 / 4 4 / 4 4 / 4<br />
CSO Overflow Vol. (mg/avg yr.)<br />
Anacostia 71 25 7 86 78 78 88<br />
Potomac 137 76 49 150 129 132 171<br />
Rock Creek 10 10 7 11 12 12 12<br />
Total 218 111 63 247 219 222 271<br />
Capital Cost ($M)<br />
LID-R $3 $129 $646 $129 $3 $3 $3<br />
Anacostia $1,026 $1,046 $1,046 $1,011 $975 $1,007 $897<br />
Potomac $195 $211 211 $189 $280 $330 $209<br />
Rock Creek $110 $110 110 $110 $59 $163 $42<br />
Blue Plains $22 $22 22 $22 $22 $22 $22<br />
Total $1,356 $1,518 $2,035 $1,461 $1,339 $1,526 $1,173<br />
Operation & Maintenance ($M/yr) $13 $18 $36 $17 $15 $12 $12<br />
20 Yr. Net Present Worth $1,535 $1,768 $2,554 $1,704 $1,549 $1,700 $1,345<br />
% Above Draft LTCP 20% 39% 100% 34% 21% 33% 5%<br />
$M/day gained compared to Draft<br />
LTCP $248 $32 $55 >$100 $231 $139 $3<br />
<strong>Water</strong> Quality Performance<br />
(Avg. Yr.)<br />
# days FC>200 (CSO Only)<br />
Anacostia @ Navy Yard 10 4 2 12 11 10 11<br />
Potomac @ Memorial Bridge 10 5 4 11 9 9 9<br />
Rock Creek @ Zoo 4 3 2 4 4 3 4<br />
# days FC>200 (All Loads)<br />
Anacostia @ Navy Yard 147 190 190 147 183 183 183<br />
Potomac @ Memorial Bridge 110 118 117 110 107 107 107<br />
Rock Creek @ Zoo 293 299 299 293 294 294 294<br />
Blue Plains<br />
Excess Flow Existing Existing Existing Existing Existing Existing Existing<br />
Tunnel Dewatering BP 002 BP 002 BP 002 BP 002 BP 002 BP 002 BP 002<br />
BP002 Dewatering Rate (mgd) 450 450 450 450 450 450 450<br />
Dewatering Time (hrs) 36 44 44 32 44 44 46<br />
IMA Impacts - Increase in Avg.<br />
Flow (mgd) +5.6 +3.9 -1.8 +3.5 +8.3 +8.3 +8.3<br />
\\Gh-wash\eng 1160\LTCP\LTCP Final\Sec 11.doc 11-29 FINAL - July 2002
Selection of Final LTCP<br />
Parameter<br />
Table 11-13 (continued)<br />
Final Alternatives Comparison (ENR= 6383)<br />
1-Year<br />
Storm<br />
DOH <strong>Plan</strong><br />
D70P D71A D71D D71F<br />
+10% LID +10% LID +Target<br />
1-Year, 24-<br />
+Target Separation (Equal<br />
Hour Storm Base <strong>Plan</strong> Separation Perf.)<br />
Tunnel Storage Volume (mg)<br />
Anacostia 126 160 160 119<br />
Potomac 58 35 35 25<br />
Rock Creek 9.1 9.4 9.4 7<br />
Total 193 204 204 151<br />
No. Overflow/Avg. Yr.<br />
Anacostia 2 0.33 0.33 2<br />
Potomac 4 8 4 8<br />
Rock Creek (Piney Branch/Others) 1 / 4 0.33 / 3 0.33 / 3 2 / 4<br />
CSO Overflow Vol. (mg/avg yr.)<br />
Anacostia 54 15 3 33<br />
Potomac 79 152 47 139<br />
Rock Creek 5 5 3 4<br />
Total 138 172 53 176<br />
Capital Cost ($M)<br />
LID-R $3 $3 $129 $129<br />
Anacostia $940 $985 $1,169 $1,107<br />
Potomac $250 $224 $246 $194<br />
Rock Creek $50 $74 $141 $104<br />
Blue Plains $22 $22 $22 $22<br />
Total $1,265 $1,308 $1,707 $1,556<br />
Operation & Maintenance ($M/yr) $13 $13 $19 $18<br />
20 Yr. Net Present Worth $1,456 $1,501 $1,973 $1,808<br />
% Above Draft LTCP 14% 18% 55% 42%<br />
$M/day gained compared to Draft<br />
LTCP $12 $15 $32 $37<br />
<strong>Water</strong> Quality Performance<br />
(Avg. Yr.)<br />
# days FC>200 (CSO Only)<br />
Anacostia @ Navy Yard 7 1 1 2<br />
Potomac @ Memorial Bridge 4 10 5 9<br />
Rock Creek @ Zoo 1 1 0 2<br />
# days FC>200 (All Loads)<br />
Anacostia @ Navy Yard 182 182 190 142<br />
Potomac @ Memorial Bridge 106 107 118 110<br />
Rock Creek @ Zoo 294 294 299 293<br />
Blue Plains<br />
Excess Flow Existing Existing Existing Existing<br />
Tunnel Dewatering BP 002 BP 002 BP 002 BP 002<br />
BP002 Dewatering Rate (mgd) 450 450 450 450<br />
Dewatering Time (hrs) 58 61 61 45<br />
IMA Impacts - Increase in Avg.<br />
Flow (mgd) +8.5 +8.5 +6.9 +6.6<br />
\\Gh-wash\eng 1160\LTCP\LTCP Final\Sec 11.doc 11-30 FINAL - July 2002
Parameter<br />
Table 11-13 (continued)<br />
Final Alternatives Comparison (ENR= 6383)<br />
Selection of Final LTCP<br />
Expanded<br />
LTCP<br />
No Overflows<br />
in 3 Years 5 Year Storm<br />
D75A D75J D75I D72A D73C<br />
+10% LID<br />
+ target<br />
+10% LID Separation<br />
Base <strong>Plan</strong> (Equal Perf.) (Equal Perf.) Base <strong>Plan</strong> Base <strong>Plan</strong><br />
Tunnel Storage Volume (mg)<br />
Anacostia 160 148 127 Integrated Integrated<br />
Potomac 53 47 36 Tunnel Tunnel<br />
Rock Creek 9.7 9.4 8.5 <strong>System</strong> <strong>System</strong><br />
Total 223 204 172 433 773<br />
No. Overflow/Avg. Yr.<br />
Anacostia 0.33 0.33 0.33 0 0<br />
Potomac 4 4 4 0 0<br />
Rock Creek (Piney Branch/Others) 0.33 / 3 0.33 / 3 0.33 / 3 0 / 3 0 / 3<br />
CSO Overflow Vol. (mg/avg yr.)<br />
Anacostia 15 15 14 0 0<br />
Potomac 94 85 72 0 0<br />
Rock Creek 5 4 3 2 2<br />
Total 114 104 89 2 2<br />
Capital Cost ($M)<br />
LID-R $3 $129 $129 $3 $3<br />
Anacostia $985 $963 $1,122 $929 $1,067<br />
Potomac $261 $184 $184 $473 $601<br />
Rock Creek $74 $73 $141 $162 $298<br />
Blue Plains $359 $359 $359 $677 $1,161<br />
Total $1,682 $1,708 $1,935 $2,244 $3,130<br />
Operation & Maintenance ($M/yr) $21 $25 $25 $25 $39<br />
20 Yr. Net Present Worth $1,976 $2,059 $2,296 $2,600 $3,684<br />
% Above Draft LTCP 55% 61% 80% 104% 189%<br />
$M/day gained compared to Draft<br />
LTCP $34 $35 $44 $45 $81<br />
<strong>Water</strong> Quality Performance<br />
(Avg. Yr.)<br />
# days FC>200 (CSO Only)<br />
Anacostia @ Navy Yard 1 1 1 0 0<br />
Potomac @ Memorial Bridge 6 6 4 0 0<br />
Rock Creek @ Zoo 1 1 1 0 0<br />
# days FC>200 (All Loads)<br />
Anacostia @ Navy Yard 182 182 182 182 182<br />
Potomac @ Memorial Bridge 107 107 107 107 107<br />
Rock Creek @ Zoo 294 294 294 94 94<br />
Blue Plains<br />
Excess Flow<br />
350 MGD<br />
High Rate<br />
350 MGD<br />
High Rate<br />
350 MGD<br />
High Rate<br />
350 MGD High<br />
Rate<br />
350 MGD<br />
High Rate<br />
Tunnel Dewatering<br />
BP 002 &<br />
High Rate<br />
BP 002 &<br />
High Rate<br />
BP 002 &<br />
High Rate High Rate High Rate<br />
BP002 Dewatering Rate (mgd) 450 450 450 None None<br />
Dewatering Time (hrs) 19 17 13 None None<br />
IMA Impacts - Increase in Avg.<br />
Flow (mgd) +8.6 +6.8 +6.8 +8.9 +8.9<br />
\\Gh-wash\eng 1160\LTCP\LTCP Final\Sec 11.doc 11-31 FINAL - July 2002
Selection of Final LTCP<br />
11.5 ABILITY TO MEET NUMERIC WATER QUALITY STANDARDS<br />
In the Anacostia River, both bacteria and dissolved oxygen are of concern. In the Potomac and Rock<br />
Creek, dissolved oxygen is predicted to meet standards and bacteria is the parameter of concern.<br />
For the Anacostia River, the analyses in Section 9 demonstrated that once CSOs are controlled to 8<br />
overflows per average year or less, increased levels of CSO control have minimal effect on dissolved<br />
oxygen. In summary, meeting the bacteria standard is the driving factor in terms of CSO control.<br />
In addition to the analyses presented previously, evaluation of the ability of various levels of CSO<br />
control to meet the current bacteria water quality standard were performed. The current standard is a<br />
fecal coliform 30-day geometric mean of 200/100 ml. Without any other loads present, all CSO<br />
plans with controls equal to or grater than the Draft LTCP will meet the geometric mean standard.<br />
With upstream and storm water loads at existing levels, the geomean standard will not be met much<br />
of the time. As a result, analyses were conducted to determine how much of a reduction in other<br />
loads would be required for the geomean standard to be met in the District. These were conducted<br />
for various levels of CSO control to determine if increased levels of control provided a significant<br />
benefit. The analyses were conducted for three conditions:<br />
<br />
<br />
<br />
Average year, monthly basis – the model generates a daily prediction for fecal coliform<br />
concentration. Using each day in the month, a geometric mean is calculated for the month.<br />
Other sources were reduced enough so that the standard was not exceeded in any month for<br />
the average year<br />
1988, 1989, 1990; monthly basis – Geometric means were calculated on a monthly basis as<br />
above. However, other loads were reduced such that the standard would be met each month<br />
in the entire three-year period. This is a more restrictive condition than in the average year<br />
and typically requires more control.<br />
1988, 1989, 1990; rolling 30-day geometric means – 30-day rolling geometric means were<br />
calculated for the entire three-year period. Other loads were reduced such that the standard<br />
would be met for all of the calculated geometric means in the three-year period. This is the<br />
most restrictive condition.<br />
The results are summarized in Table 11-14.<br />
\\Gh-wash\eng 1160\LTCP\LTCP Final\Sec 11.doc 11-32 FINAL - July 2002
Selection of Final LTCP<br />
Table 11-14<br />
Reduction in Other Loads Required to Meet Fecal Coliform Geometric Mean Standard 1<br />
CSO<br />
Overflows/<br />
Avg. Yr<br />
Based on Monthly<br />
Geometric Means<br />
Average<br />
Year<br />
Based on Rolling<br />
30 Day Geometric<br />
Means<br />
1988, 1989,<br />
1990 1988, 1989, 1990<br />
CSO <strong>Control</strong> by Receiving <strong>Water</strong><br />
Anacostia River<br />
Draft LTCP 4 85% 90% 90%<br />
1-Year 24-Hour Storm 2 85% 90% 90%<br />
DOH <strong>Plan</strong> 0.33 85% 90% 90%<br />
Potomac River<br />
Draft LTCP 9 20% 35% 50%<br />
1-Year 24-Hour Storm 4 20% 35% 50%<br />
Rock Creek (Including Piney Branch Stream)<br />
Draft LTCP 4 95% 95% 99%<br />
1-Year 24-Hour Storm 1 95% 95% 99%<br />
DOH <strong>Plan</strong> 0.33 95% 95% 99%<br />
Rock Creek (Excluding Piney Branch Stream)<br />
Draft LTCP 4 85% 90% 91%<br />
1-Year 24-Hour Storm 1 85% 90% 91%<br />
DOH <strong>Plan</strong> 0.33 85% 90% 91%<br />
Notes:<br />
1. Uniform percent reduction in District storm water and upstream loads required for fecal coliform geometric mean to be<br />
less than 200 MPN/100 ml<br />
As indicated in the table, high levels of load reduction in the Anacostia and Rock Creek are required<br />
to meet the geometric mean standard. Note that increasing levels of CSO control do not change the<br />
amount of reduction in other loads necessary to meet the standard. This suggests that the controls<br />
included in the Draft LTCP reduce CSOs enough so that they have minimal effect on the geometric<br />
mean. Additional control beyond the Draft LTCP does not have a significant benefit on meeting the<br />
geometric mean standard.<br />
For Rock Creek, the calculation was performed both including and excluding Piney Branch Stream.<br />
During dry weather conditions, Piney Branch has minimal flow in it. During wet weather, the flow<br />
in Piney Branch is almost entirely urban storm water and some amount of CSO from whatever<br />
discharges that are occurring. The bacteria concentrations in Piney Branch Stream are thus almost<br />
equal to the concentration in urban storm water. Extremely high reductions are thus required. This<br />
suggests that the stream has been so fundamentally altered by development that it may not be<br />
possible to achieve the current bacteria standard.<br />
11.6 SELECTION OF FINAL LTCP<br />
The following observations are made based on the alternatives evaluation:<br />
\\Gh-wash\eng 1160\LTCP\LTCP Final\Sec 11.doc 11-33 FINAL - July 2002
Selection of Final LTCP<br />
<br />
<br />
<br />
<br />
<br />
<br />
<br />
<br />
All plans meet the BOD TMDL for the Anacostia River.<br />
<strong>Plan</strong>s with CSO controls greater than or equal to the 1-year 24-hour storm meet the Anacostia<br />
TSS TMDL.<br />
Large-scale separation and LID-R are less cost effective than increasing the size of the capital<br />
facilities. However, separation and LID-R have flow reduction benefits in that they can assist<br />
the District in meeting its IMA limit.<br />
Large scale separation produces worse water quality than higher degrees of CSO control due<br />
to untreated storm water.<br />
Based on the affordability analysis in the following section, the zero overflow per year and<br />
the 5-year 24-hour storm alternatives are not affordable.<br />
All the plans can be cost-effectively expanded to zero overflow per year and the 5 year storm<br />
plans.<br />
All plans will meet the fecal coliform geometric means standard with commensurate storm<br />
water and upstream controls.<br />
The 1 year –24 hr storm plan brings CSOs in all receiving waters to high levels of controls at<br />
or above the presumptive approach outlined in the CSO Policy of 4 overflows per average<br />
year.<br />
The overall cost effectiveness of the alternatives is compared in Figure 11-8. For each alternative,<br />
the total capital cost divided by the million gallons of CSO removed in an average year compared to<br />
No Phase I <strong>Control</strong>s (Alternative B1) is plotted.<br />
Figure 11-8<br />
Cost Effectiveness of Alternatives Based on CSO Volume<br />
Reduction<br />
Capital Cost/CSO<br />
removed ($/mg-yr)<br />
$1.00<br />
$0.90<br />
$0.80<br />
$0.70<br />
$0.60<br />
$0.50<br />
$0.40<br />
$0.30<br />
$0.20<br />
$0.10<br />
$0.00<br />
B1<br />
C3<br />
D70A<br />
D70P<br />
D70B<br />
D71A<br />
D70J<br />
D70K<br />
D70D<br />
D70I<br />
D71D<br />
D75A<br />
D75J<br />
D70C<br />
D75I<br />
D70E<br />
D70M<br />
D72A<br />
D73C<br />
Alternative<br />
\\Gh-wash\eng 1160\LTCP\LTCP Final\Sec 11.doc 11-34 FINAL - July 2002
Selection of Final LTCP<br />
Pump Station Rehabilitation (C3) and the Draft LTCP (D70A) are the most cost effective. For plans<br />
with more control than the Draft LTCP, the plan sized for the 1-year 24-hour storm (D70P) is the<br />
next most cost effective.<br />
Among other factors, alternatives were evaluated based on the number of days per year that CSOs<br />
alone would cause the fecal coliform concentration to exceed 200/100 ml. The cost per day to reduce<br />
the number of days from that provided by the Draft LTCP is plotted on Figure 11-9. The most cost<br />
effective plan is the 1-year 24-hour storm alternative (D70P).<br />
Figure 11-9<br />
Cost Effectiveness of Alternatives Based on Bacteria Reduction<br />
$100<br />
$90<br />
$80<br />
$70<br />
$60<br />
$50<br />
$40<br />
$30<br />
$20<br />
$10<br />
$0<br />
D70P<br />
D71A<br />
D75J<br />
D71D<br />
D70D<br />
D75A<br />
D75I<br />
D70C<br />
D70B<br />
D72A<br />
D70E<br />
Million $/Day Bacteria<br />
Gained/yr<br />
D73C<br />
D70J<br />
D70K<br />
D70M<br />
D70I<br />
Alternative<br />
Based on the affordability analysis in the following section, the expanded plan alternatives (D75A,<br />
D75J, D75I), the zero overflow per year alternative (D72A), and the 5-year 24-hour storm alternative<br />
(D73C) are not affordable and have thus been eliminated from further consideration.<br />
Alternatives that include a large amount of targeted separation result in worse water quality in the<br />
receiving waters and are more costly than the other options. In addition to the costs presented,<br />
alternatives involving a large amount of targeted separation will require District residents to pay<br />
additional funds to address the resulting storm water, making these options even more expensive.<br />
The following alternatives have thus been eliminated: D70K, D70D, D70E, D70I, D71D and D71F.<br />
The three alternatives that involve reducing the dry weather flow in the District or the peaking factors<br />
for the suburbs do not significantly reduce CSO overflow volumes below that in the Draft LTCP and<br />
have thus been deleted (D70F, D70G, D70L).<br />
\\Gh-wash\eng 1160\LTCP\LTCP Final\Sec 11.doc 11-35 FINAL - July 2002
Selection of Final LTCP<br />
Alternatives based on the Draft LTCP and those that provide equal performance to the Draft LTCP<br />
will not meet the TSS TMDL for the Anacostia River. The following alternatives have thus been<br />
deleted: D70A, D70J and D70M.<br />
Alternative D70B and D70D include the capital facilities in the Draft LTCP and 10% and 50%<br />
application of LID-R, respectively. Since WASA does not control development in the District and<br />
cannot rely on others to meet its permit conditions, these alternatives have been deleted from further<br />
consideration. WASA hopes that extensive LID-R will occur in the District. Any degree of LID-R<br />
will assist in reducing CSO overflow volumes.<br />
Given the discussions above, two alternatives are left: the DOH <strong>Plan</strong> (D71A) and the 1-year 24-hour<br />
plan (D70P). Both have similar costs and storage capacities. However, the DOH plan provides more<br />
control for the Anacostia and Rock Creek but no additional control for the Potomac River. The 1-<br />
year 24-hour plan is responsive to the requirements of the CSO Policy, existing and prospective<br />
TMDLs, and public comments, regulatory agency concerns that called for increasing levels of control<br />
in all receiving waters. In addition, the 1-year 24-hour storm plan meets the levels of control in the<br />
presumptive approach in the CSO Policy for all receiving waters. Based on the cost effectiveness<br />
evaluation, and the above analyses, the plan sized for the 1-year 24-hour storm is the recommended<br />
Final LTCP.<br />
After implementation of the recommended Final LTCP, the remaining overflows predicted for the<br />
average year are summarized in Table 11-15.<br />
Table 11-15<br />
Remaining Overflows after Implementation of Recommended Final LTCP(Average Year)<br />
No. Events<br />
(No./yr)<br />
Overflow Volume<br />
(mg/yr)<br />
CSO NPDES No.<br />
Descrption<br />
Notes<br />
Anacostia<br />
004 Poplar Point P.S. Emergency Bypass - -<br />
005 Ft. Stanton - -<br />
006 Ft. Stanton - - Separated<br />
007 Ft. Stanton - -<br />
008 AMI Relief - -<br />
009 B St /NJ Ave at Main & ‘O’ Street - -<br />
010 B St /NJ Ave at Main & ‘O’ Street 1 21<br />
011 B St /NJ Ave at Main & ‘O’ Street - -<br />
011a B St /NJ Ave at Main & ‘O’ Street - -<br />
012 Tiber Creek at Main & O Street - -<br />
013 Canal St. <strong>Sewer</strong> - -<br />
014 Navy Yard/ M St - -<br />
015 Navy Yard/ M St - -<br />
016 Navy Yard/ M St - - Consolidated<br />
J:\1160\LTCP\LTCP Final\Sec 11.doc 11-36 FINAL - July 2002
Selection of Final LTCP<br />
CSO NPDES No.<br />
Descrption<br />
No. Events<br />
(No./yr)<br />
Overflow Volume<br />
(mg/yr)<br />
Notes<br />
017 Navy Yard/ M St - Consolidated<br />
018 Barney Circle - - Consolidated<br />
019 Northeast Boundary 2 33<br />
Anacostia Subtotal 54<br />
Potomac<br />
003 Bolling Air Force Base 2 9.8<br />
020 Easby Point 3 20.7<br />
021 Potomac P.S. – Slash Run 3 19.3<br />
022 I St-22 nd St NW 3 28.5<br />
023/024 West Rock Creek Diversion <strong>Sewer</strong> at<br />
Consolidated<br />
Georgetown - -<br />
025 Georgetown - - Consolidated<br />
026 Georgetown - - Consolidated<br />
027 Georgetown - - Consolidated<br />
028 Georgetown - - Consolidated<br />
029 Georgetown 1 1.0<br />
030 Abandoned - -<br />
060 Little Falls Branch - -<br />
Potomac Subtotal 79<br />
Rock Creek<br />
031 Penn Ave - - Separated<br />
032 26 th St- M St. - -<br />
033<br />
N St.-25 th 3 1.18<br />
034 Slash Run - -<br />
035 Northwest Boundary - -<br />
036 Mass Ave & 24 th ST. 3 0.29<br />
037 Kalorama Circle West - - Separate<br />
038 Kalorama Circle East - -<br />
039 Belmont Rd 1 0.02<br />
040 Biltmore St 1 0.05<br />
041 Ontario Rd - -<br />
042 Quarry Rd - -<br />
043 Irving St. 1 0.26<br />
044 Kenyon St. 1 0.01<br />
045 LamontSt. 4 0.76<br />
046 Park Road 2 0.01<br />
047 Ingleside Terrace 1 0.01<br />
048 Oak St-Mt. Pleasant 2 0.14<br />
049 Piney Branch 1 1.41<br />
050 M St. – 27 th St. - -<br />
051 Olive – 29 th St. - -<br />
052 O St.-31 st St. - -<br />
053 Q St. - - Separated<br />
054 West Rock Creek Diversion <strong>Sewer</strong> - -<br />
055 (Abandoned) - -<br />
056 Normanstone Drive - -<br />
057 Cleveland – 28 th St. & Conn. Ave. 2 0.38<br />
J:\1160\LTCP\LTCP Final\Sec 11.doc 11-37 FINAL - July 2002
Selection of Final LTCP<br />
CSO NPDES No.<br />
Descrption<br />
No. Events<br />
(No./yr)<br />
Overflow Volume<br />
(mg/yr)<br />
Notes<br />
058 Connecticut Avenue - - Separated<br />
059 Luzon Valley - - Separated<br />
Rock Creek Subtotal 5<br />
Grand Total 138<br />
J:\1160\LTCP\LTCP Final\Sec 11.doc 11-38 FINAL - July 2002
Financial Capability<br />
Section 12<br />
Financial Capability<br />
12.1 INTRODUCTION<br />
Financing CSO programs in a fair and equitable manner without placing an unreasonable burden on<br />
ratepayers is one of the most challenging aspects facing CSO communities. CSO control costs can<br />
be one of the largest single expenditures made on a public works project for many communities. No<br />
dedicated grant programs currently exist to fund CSO control programs. As a result, a detailed<br />
affordability analysis is necessary to assess the impact of CSO control costs on the fiscal health of a<br />
community. A procedure for assessing financial capability is described in EPA’s Guidance<br />
Document, Guidance for Financial Capability Assessment and Schedule Development (EPA, 1997).<br />
This procedure was used to perform the financial capability assessment for WASA.<br />
Regulatory agencies are allowed to consider other factors that will have an impact on the ability of a<br />
community to finance CSO controls. As a result, this evaluation also considers the District’s income<br />
distribution, the ability of the District to remain competitive in the greater Washington area, and the<br />
effect of WASA’s existing capital improvement program on the ability to finance CSO controls.<br />
12.2 METHODOLOGY<br />
In EPA’s guidance document, assessment of financial capability entails a two-phase approach. The<br />
first phase consists of the calculation of a “Residential Indicator”, which measures the financial<br />
impact of current and proposed CSO controls on residential users. The residential indicator is<br />
calculated by estimating the cost per household (CPH) for current and proposed wastewater treatment<br />
and CSO control costs. The CPH is used in conjunction with the median household income (MHI) to<br />
estimate residential impacts. Residential impacts are considered by EPA to be ‘low’ if the CPH is<br />
less than 1% of the MHI, ‘medium’ if the CPH is between 1% and 2% of the MHI, and ‘high’ if the<br />
CPH is greater than 2% of the MHI. Note that the CPH is not strictly equivalent to a monthly or<br />
annual sewer user fee. The CPH does not take into account all factors that are included when<br />
developing a sewer bill such as project scheduling, industrial vs. residential rates and other factors.<br />
The second phase of the assessment involves calculation of a “Financial Capability Indicator”, which<br />
assesses the overall financial health of the community. This indicator examines bond rating, debt<br />
burden, unemployment rate, property tax collection rates, MHI and other factors to develop a<br />
numerical score. The financial capability is considered by EPA to be low if the score is less than 1.5,<br />
medium if the score is between 1.5 and 2.5, and strong if the score is greater than 2.5. Figure 12-1<br />
summarizes the development and scoring of the residential and financial capability indicators.<br />
\\Gh-wash\ENG 1160\LTCP\LTCP Final\Sec 12.doc 12-1 FINAL - July 2002
Financial Capability<br />
Figure 12-1<br />
EPA’s Residential and Financial Capability Indicators<br />
“Residential<br />
Indicator”<br />
<br />
<br />
<br />
<br />
<br />
Considers<br />
Current wastewater treatment costs<br />
Projected wastewater treatment costs (due to<br />
CSO control & planned capital expenditures)<br />
Residential share of wastewater treatment and<br />
CSO costs<br />
Median household income (MHI)<br />
Cost per residential household (CPH) for WWT<br />
costs<br />
CPH as % of MHI<br />
< 1%<br />
1 to 2%<br />
> 2 %<br />
Impact<br />
Low<br />
Medium<br />
High<br />
“Financial<br />
Capability<br />
Indicator”<br />
<br />
<br />
<br />
<br />
<br />
<br />
Considers<br />
Bond Rating<br />
Net debt as % of full market property value<br />
Unemployment Rate<br />
Median Household Income<br />
Property Tax Revenue Collection Rate<br />
Property tax revenues as % of full market property<br />
value<br />
Score<br />
2.5<br />
Financial Indicator<br />
Weak<br />
Medium<br />
Strong<br />
Once the residential and financial capability indicators are calculated, they are combined into a<br />
financial capability matrix. The matrix provides EPA’s assessment of the overall burden associated<br />
with funding CSO controls. This is summarized in Table 12-1.<br />
Table 12-1<br />
EPA’s Financial Capability Matrix<br />
Financial Capability Indicator<br />
Residential Indicator<br />
(Cost per Household as % of Median Household Income)<br />
Low<br />
(Below 1.0%)<br />
Medium<br />
(Between 1.0% and 2.0%)<br />
High<br />
(Above 2.0%)<br />
Weak (Below 1.5) Medium Burden High Burden High Burden<br />
Medium (Between 1.5 and 2.5) Low Burden Medium Burden High Burden<br />
Strong (Above 2.5) Low Burden Low Burden Medium Burden<br />
12.3 RESIDENTIAL INDICATOR<br />
12.3.1 Median Incomes<br />
The CPH for wastewater treatment (WWT) and CSO controls was developed using a three-step<br />
process. First, WASA’s total WWT and CSO costs were calculated by adding current costs for<br />
existing wastewater treatment operations and projected costs for proposed WWT facilities and CSO<br />
\\Gh-wash\ENG 1160\LTCP\LTCP Final\Sec 12.doc 12-2 FINAL - July 2002
Financial Capability<br />
controls. Next, the residential share of total WWT and CSO costs was calculated. The final step<br />
consists of calculating the CPH by dividing the residential share of total WWT and CSO costs by the<br />
number of households in the District.<br />
Current WWT costs consist of current annual wastewater operating and maintenance (O & M)<br />
expenses, plus current annual debt service (principal and interest). <strong>Plan</strong>ned WWT capital costs were<br />
obtained from WASA’s ten year Capital Improvement Program (CIP) (WASA, 2000b). The CIP<br />
amounts to $1.6 billion for the ten-year period FY2000 through FY2009, of which about $564<br />
million are attributable to wastewater treatment for WASA customers within the District. The<br />
remainder of the CIP is attributable to water system improvements or to expenditures to be borne by<br />
others such as the surrounding counties whose wastewater is treated at Blue Plains.<br />
The affordability analysis was conducted for a range of CSO control plan capital costs between $100<br />
million and $2 billion in year 2001 dollars. Five cost levels were selected to compute the CPH: $0<br />
million, $100 million; $500 million; $1 billion; and $2 billion. Each of the foregoing CSO control<br />
cost levels was assumed to occur in FY2001 to establish a common implementation year for all<br />
assumed CSO control cost scenarios as a benchmark for their comparison.<br />
WASA’s Board of Directors has adopted financial policies that require maintenance of 140 percent<br />
debt service coverage, and maintenance of cash reserves of 180 days O&M expenses, currently<br />
approximately $91 million. The present analysis factored in WASA’s debt service coverage<br />
requirement. CSO control O&M costs will add substantially to the reserve requirement. An interest<br />
rate of 7% and a term of 30 years were used in the analysis to determine the capital recovery factor,<br />
which are consistent with WASA’s assumptions for debt issuance for the CIP (WASA, 2002a). An<br />
interest rate of 2.6% was used as a present value adjustment factor based on the past 5 year average<br />
annual increase in the Consumer Price Index (CPI) from the Bureau of Labor Statistics (U.S. Bureau<br />
of Labor, 2000).<br />
The residential share of total annual WWT and CSO costs is computed by multiplying the percent of<br />
total wastewater flow attributable to residential users by the total costs. For FY 1999, the residential<br />
share of wastewater flow within the District boundaries was 50% (WASA, 2000c).<br />
The latest median household income (MHI) for the District estimated by the Census Bureau for 2000<br />
is $38,752 (U.S. Census Bureau, 2002). This was adjusted upward to year 2001 using an inflation<br />
adjustment factor resulting in an adjusted MHI of $39,760. Dividing this amount by total annual<br />
WWT and CSO control costs per household (CPH) yields the Residential Indicator and the financial<br />
impact on residential customers.<br />
The annual cost per household and the residential indicator are summarized in Table 12-2.<br />
\\Gh-wash\ENG 1160\LTCP\LTCP Final\Sec 12.doc 12-3 FINAL - July 2002
Financial Capability<br />
Table 12-2<br />
Projected Cost Per Household and Residential Indicator<br />
Median Income Households<br />
CSO <strong>Control</strong> Costs in Year 2001 (ENR=6383)<br />
Line No.<br />
Category $0<br />
from EPA<br />
$100 Million $500 Million $1,000 Million $2,000 Million Worksheet<br />
Current WWT Costs:<br />
Annual O&M Expenses $88,059,582 $88,059,582 $88,059,582 $88,059,582 $88,059,582 100<br />
Annual Debt Service (P&I) $17,111,944 $17,111,944 $17,111,944 $17,111,944 $17,111,944 101<br />
Subtotal (Line 100 + Line 101) $105,171,526 $105,171,526 $105,171,526 $105,171,526 $105,171,526 102<br />
Projected WWT Costs: Annual O & M<br />
Expense $0 $0 $0 $0 $0 103a<br />
Projected CSO Costs: Annual O & M<br />
Expense $0 $1,500,000 $7,500,000 $15,000,000 $30,000,000 103b<br />
Projected WWT & CSO Costs: Annual<br />
Debt Service (P&I) $58,110,933 $69,107,129 $113,091,910 $168,072,887 $278,034,842 104<br />
Subtotal (Lines 103a + 103b+ 104) $58,110,933 $70,607,129 $120,591,910 $183,072,887 $308,034,842 105<br />
Total Current & Projected WWT &<br />
CSO Costs (Line 102 + Line 105): $163,282,459 $175,778,655 $225,763,436 $288,244,413 $413,206,368 106<br />
Residential Share of Total WWT &<br />
CSO Costs: $81,641,230 $87,889,327 $112,881,718 $144,122,207 $206,603,184 107<br />
Total No. of Households in District: 248,338 248,338 248,338 248,338 248,338 108<br />
Annual Cost per Household<br />
(Line 107 / Line 108): $329 $354 $455 $580 $832 109<br />
Median Household Income (MHI) for<br />
Census Year 2000 $38,752 $38,752 $38,752 $38,752 $38,752 201<br />
MHI Adjustment to Year 2001 1.026 1.026 1.026 1.026 1.026 202<br />
Adjusted MHI (Line 201 x Line 202) $39,760 $39,760 $39,760 $39,760 $39,760 203<br />
Annual WWT & CSO <strong>Control</strong> Costs<br />
per Household (CPH) (Line 109) $329 $354 $455 $580 $832 204<br />
Residential Indicator: CPH as % MHI)<br />
(Line 204 / Line 203 x 100) 0.83% 0.89% 1.14% 1.46% 2.09% 205<br />
Financial Impact: Low Low Mid-Range Mid-Range High<br />
12.3.2 Lower Incomes<br />
The financial impact of wastewater treatment and CSO control costs on residential customers in the<br />
District is not fully measured by the foregoing method. Because of the demographics of the District,<br />
income does not follow a normal statistical distribution, or bell curve, among households across the<br />
full range of incomes. In the District, there is a distinct clustering of household incomes at the lower<br />
and upper extremes of the income spectrum. This creates a ‘u’ shaped or upside down income<br />
distribution which is shown on Figure 11-2.<br />
\\Gh-wash\ENG 1160\LTCP\LTCP Final\Sec 12.doc 12-4 FINAL - July 2002
Financial Capability<br />
Percent of Households<br />
16<br />
14<br />
12<br />
10<br />
8<br />
6<br />
4<br />
2<br />
0<br />
Figure 12-2<br />
District of Columbia Income Distribution - 2001<br />
20.6% of<br />
Household<br />
Incomes =<br />
$18,000 or Less<br />
MEDIAN = $39,760<br />
District<br />
Maryland<br />
Virginia<br />
$179<br />
Income Ranges ($ Thousands)<br />
Because of the disproportionate number of low income households in the District, the impact of<br />
wastewater treatment and CSO control costs on the most well off households in the lowest 20% of<br />
income distribution in the District was calculated. The most well off households in this category have<br />
incomes of approximately $18,000 per year. The results are presented in Table 12-3, which shows a<br />
high impact on this segment of the population for all assumed levels of CSO control costs.<br />
Table 12-3<br />
Projected Cost Per Household and Residential Indicator<br />
Lower 20% of Household Incomes<br />
CSO <strong>Control</strong> Costs Year 2001 (ENR=6383)<br />
Line No.<br />
Category $0 $100 Million<br />
from EPA<br />
$500 Million $1,000 Million $2,000 Million Worksheet<br />
Highest Household Income of Lower<br />
20% of Income Range: $18,000 $18,000 $18,000 $18,000 $18,000 201a<br />
Annual WWT & CSO <strong>Control</strong> Costs<br />
per Household (CPH) (Line 109) $329 $354 $455 $580 $832 204<br />
Residential Indicator: CPH as % MHI)<br />
(Line 204 / Line 203 x 100) 1.83% 1.97% 2.53% 3.22% 4.62% 205a<br />
Financial Impact: Mid-Range Mid-Range High High High<br />
\\Gh-wash\ENG 1160\LTCP\LTCP Final\Sec 12.doc 12-5 FINAL - July 2002
Financial Capability<br />
12.4 FINANCIAL CAPABILITY INDICATORS<br />
12.4.1 General<br />
The permittee’s financial indicator score was determined by evaluation of selected factors that<br />
portray WASA’s and the District’s debt burden, socioeconomic conditions, and financial operations.<br />
WASA’s current debt burden was assessed as well as its ability to issue new debt to finance CSO<br />
controls by determining bond ratings and overall debt as a percentage of full market property value in<br />
the District. Socioeconomic conditions in the District were evaluated by assessing its unemployment<br />
rate and median household income (MHI). The District’s ability to manage financial operations were<br />
evaluated by determining the property tax collection rate and property tax revenues as a percentage<br />
of full market property value. A value range for each of these indicators characterizes whether<br />
WASA’s residential users are in a “Weak”, “Mid-Range” or “Strong” position to bear WASA’s<br />
WWT and CSO control costs relative to national benchmarks according to the EPA guidance<br />
document.<br />
12.4.2 Bond Ratings<br />
Ratings of WASA’s Public Utility Revenue Bonds, Series 1998, have been upgraded since their<br />
issuance by Moody’s, Standard & Poors and Fitch IBCA to A1, A, and A+, respectively. Continued<br />
compliance with the Board of Directors’ 140 percent debt service coverage and 180 day O&M<br />
expense cash reserves policies has been critical to these bond rating upgrades. This will ultimately<br />
result in lower interest rates on future WASA debt issuance.<br />
When WASA was first created in 1996, it was an unrated utility. WASA started operations with the<br />
negative cash position left by its predecessor agency, the <strong>Water</strong> and <strong>Sewer</strong> Utility Administration<br />
(WASUA). In barely two years WASA reached its 180 day O & M cash reserve goal, 11 months<br />
ahead of schedule. Without strong cash reserves and debt service coverage policies, WASA’s bond<br />
ratings would be significantly lower and its cost of capital significantly higher. WASA has worked<br />
hard to implement these policies and achieve their goals. They must be maintained in order to ensure<br />
WASA’s long-term financial viability and not be compromised by unaffordable new projects.<br />
According to criteria in the guidance document, the rating of the most recent bonds to be issued<br />
either by the District or WASA is to be used to determine a bond rating indicator for WASA.<br />
Consequently, a rating of Baa1 for the District’s General Obligation Bonds (Series 1999A) and<br />
General Obligation Bonds (Series 1999B) by Moody’s Investor Service has been used, corresponding<br />
to a “Mid-Range” indicator rating (WASA 2002a).<br />
12.4.3 Summary of Financial Capability Indicators<br />
An average score for the indicators determined in this phase of the financial capability assessment<br />
was calculated. The indicators are compared to national benchmarks to form an overall assessment<br />
\\Gh-wash\ENG 1160\LTCP\LTCP Final\Sec 12.doc 12-6 FINAL - July 2002
Financial Capability<br />
of the financial capability and its effect on implementation schedules in the long-term CSO control<br />
plan. Each indicator is scored using the following rating scale:<br />
Indicator Ratings Score<br />
Weak 1<br />
Mid-Range 2<br />
Strong 3<br />
The average score for the indicators was calculated by dividing the sum of the scores by the number<br />
of entries. The average score is given on line 907 of Table 12-4 and the overall financial capability<br />
rating is given at the bottom of the table. According to this procedure, WASA’s overall financial<br />
capability corresponds to a “Mid-Range” rating. However, because of the disproportionate number<br />
of lower income households in the District previously described, an alternative score is presented<br />
using the income of the most well off households in the lowest 20% of income distribution in the<br />
District instead of the MHI. This score results in a “Low” overall financial capability rating.<br />
Table 12-4<br />
Financial Capability Indicators<br />
Score Using<br />
Median Household<br />
Incomes<br />
Score Using<br />
Lower 24% of<br />
Household<br />
Incomes<br />
Line No.<br />
from EPA<br />
Worksheet<br />
Indicator(Line No. from EPA Worksheet) Value Indicator Rating<br />
Bond Rating (Line 303): Baa1 Mid-Range 2 2 901<br />
Overall Net Debt as a Percent of Full Market<br />
Property Value (Line 405): 7.30% Weak 1 1 902<br />
Unemployment Rate (Line 501): 5.1 Weak 1 1 903<br />
Median Household Income (Line 601): $39,760 Mid-Range 2 0 904<br />
Highest Household Income of Lower 20% of<br />
Income Range (Line 601a): $18,000 Weak 0 1 904a<br />
Property Tax Revenues as a Percent of Full<br />
Market Property Value (Line 703): 1.31% Strong 3 3 905<br />
Property Tax Revenue Collection Rate (Line<br />
803): 86.89% Weak 1 1 906<br />
Permittee Indicators Score (Sum of Scores/<br />
Number of Entries): 1.67 1.50 907<br />
Financial Capability: Mid-Range Low<br />
12.5 COMBINED RESIDENTIAL AND FINANCIAL INDICATORS<br />
The Residential Indicator and the Financial Capability Indicators were combined in the Financial<br />
Capability Matrix to evaluate the level of financial burden that CSO controls might impose on<br />
WASA. The Residential Indicator score is given on line 1001 and the Financial Capability Indicator<br />
score is given on line 1002 of Table 12-5.<br />
\\Gh-wash\ENG 1160\LTCP\LTCP Final\Sec 12.doc 12-7 FINAL - July 2002
Financial Capability<br />
Table 12-5<br />
Financial Capability Matrix Overall Score<br />
CSO <strong>Control</strong> Costs in Year 2001 (ENR-6383)<br />
$0 $100 Million $500 Million $1,000 Million $2,000 Million<br />
Line No.<br />
from EPA<br />
Worksheet<br />
For Median Incomes<br />
Residential Indicator Score (Line<br />
205): 0.83% 0.89% 1.14% 1.46% 2.09% 1001<br />
Financial Capability Indicators<br />
Score (Line 907 Column B): 1.67 1.67 1.67 1.67 1.67 1002<br />
Financial Capability Matrix<br />
Category:<br />
Low<br />
Burden Low Burden<br />
Medium<br />
Burden<br />
Medium<br />
Burden High Burden 1003<br />
Lower 20% of Household<br />
Incomes<br />
Residential Indicator Score (Line<br />
205a): 1.83% 1.97% 2.53% 3.22% 4.62% 1001a<br />
Financial Capability Indicators<br />
Score (Line 907 Column C): 1.50 1.50 1.50 1.50 1.50 1002a<br />
Financial Capability Matrix<br />
Category:<br />
Medium<br />
Burden<br />
Medium<br />
Burden High Burden High Burden High Burden 1003a<br />
Based on EPA’s approach, it would appear that CSO control programs costing between $500 million<br />
and $1 billion would impose a “Medium Burden” and a CSO control program costing $2 billion<br />
would impose a “High Burden” on WASA and its residential customers.<br />
This method of determining a Financial Capability Matrix category for WASA understates the<br />
impact of CSO controls on the disproportionately large number of low income households in the<br />
District. Therefore, the Financial Capability Matrix Score was also calculated for the most well off<br />
households in the lowest 20% of income distribution. This score presents a very different picture of<br />
the impact of CSO control costs, indicating that any program above approximately $100 million<br />
would impose a “High Burden” on this segment of the population.<br />
Additional analyses were performed to determine the CSO control cost levels that would trigger each<br />
of the financial burden categories established by EPA. The results suggest that for median income<br />
households, the threshold CSO capital cost for rising into EPA’s ‘high’ burden level is about $1.85<br />
billion. For the upper end of the lower 20% income range, this threshold is only $125 million. These<br />
results are summarized in Table 12-6 and on Figure 12-3.<br />
\\Gh-wash\ENG 1160\LTCP\LTCP Final\Sec 12.doc 12-8 FINAL - July 2002
Financial Capability<br />
Table 12-6<br />
Summary of CSO <strong>Control</strong> Cost Impacts on Residential Customers<br />
(Year 2001 Dollars)<br />
EPA’s Burden<br />
Assessment<br />
No Additional<br />
CSO <strong>Control</strong>s<br />
(Baseline<br />
Condition)<br />
Medium Burden<br />
Threshold<br />
High Burden<br />
Threshold<br />
CPH as a<br />
% of MHI<br />
Median Income Households Low Income Households (Income of 18,000)<br />
Wastewater<br />
& CSO CPH<br />
CSO <strong>Control</strong><br />
<strong>Plan</strong> Cost<br />
CPH as a % of<br />
Income<br />
Wastewater & CSO<br />
CPH<br />
CSO <strong>Control</strong><br />
<strong>Plan</strong> Cost<br />
0.83% $329 $0 1.83% $329 $0<br />
1.0% $399 $280 million 1.0% $180 $0<br />
2.0% $794 $1.85 billion 2.0% $360 $125 million<br />
Figure 12-3<br />
Impact of CSO <strong>Control</strong>s on Cost Per Household<br />
Median Incomes<br />
Lower 20% of Incomes<br />
Cost per Household as % of<br />
Income<br />
5.0%<br />
4.0%<br />
3.0%<br />
2.0%<br />
1.0%<br />
0.0%<br />
$0 $500 $1,000 $1,500 $2,000 $2,500<br />
Capital Cost of CSO <strong>Control</strong>s<br />
EPA's Burden<br />
Assessment<br />
High<br />
Medium<br />
Low<br />
\\Gh-wash\ENG 1160\LTCP\LTCP Final\Sec 12.doc 12-9 FINAL - July 2002
Financial Capability<br />
12.6 OTHER FACTORS<br />
12.6.1 Baseline Rate Impacts Facing WASA’s Rate Payers<br />
The financial assessment and affordability analysis presented in the previous sections uses EPA’s<br />
standard methodology to assess the financial capability of the Authority and its customers relative to<br />
the proposed LTCP. The assessment using EPA’s approach results in a finding of an overall<br />
“medium impact” on the Authority and its customers; the impact is high when applied to the over<br />
51,000 households that have incomes of less than $18,000. These households approach the medium<br />
impact with WASA’s existing capital program and financial plan; including CSO costs, their<br />
wastewater costs will fall in the very high range. A more accurate and complete picture of the<br />
financial capability of the Authority and its customers to fund the proposed LTCP must take into<br />
consideration the total cost of wastewater treatment and CSO controls, the rising cost of drinking<br />
water services, and, as pointed out earlier, the disparate impact on low income residents of the<br />
District of Columbia.<br />
This analysis reflects several important analytical conventions that differ from the analysis presented<br />
in earlier sections.<br />
<br />
This rate impact analysis focuses on a typical residential customer with metered water<br />
consumption of 100 ccf per year. The EPA approach documented in earlier sections uses the<br />
number of households and cost per household (CPH) to evaluate financial capability. Note<br />
the two methods are not strictly equivalent. The CPH does not take into account all factors<br />
that are included in retail rate making such as project scheduling, varying consumption<br />
levels, etc.<br />
<br />
The EPA approach uses cost estimates in current dollars. The plan reflects 2001 values for<br />
all cost estimates. This analysis of rate impacts uses “year-of-expenditure” values which<br />
reflect the inflationary impact of time on costs and rates.<br />
In January 2002, the Authority adopted a 10-year financial plan that provides for operations,<br />
maintenance and capital expenditures for the period of FY 2001 to FY 2010. This 10-year plan<br />
continues the Authority’s current $1.6 billion water and wastewater capital improvement program<br />
(CIP).<br />
Approximately 24 percent of the CIP is for mandated improvements that will enable the Authority to<br />
meet its current regulatory requirements. The balance of the program reflects the age and condition<br />
of the system and historical disinvestment in the system’s infrastructure by predecessor agencies.<br />
\\Gh-wash\ENG 1160\LTCP\LTCP Final\Sec 12.doc 12-10 FINAL - July 2002
Financial Capability<br />
Over half of WASA’s pumping stations were constructed before 1940 and are not operating<br />
at optimal capacity.<br />
Half of WASA’s pipes were built prior to 1930.<br />
Preventive maintenance expenditures were extremely low from 1980 to 1996.<br />
Virtually no technology existed in the Authority’s operations prior to 1997.<br />
<br />
Prior to WASA’s creation in 1997, annual capital spending averaged less than $40 million<br />
per year on total plant in service of over $1.3 billion.<br />
Between FY 2003 and FY 2007, in the peak years of this capital program, WASA’s annual capital<br />
investments in water and wastewater infrastructure (before consideration of the LTCP) exceed $200<br />
million, a fivefold increase from the average investment only five years ago.<br />
Even with significant capital funding from wholesale customers and grants – about 13% of the CIP’s<br />
funding will come from EPA grants and 28% from wholesale customers – WASA will need to issue<br />
approximately $775 million in new debt between FY 2001 and FY 2010 to finance 47% percent of<br />
the program. As a result debt service costs will increase by more than $50 million per year by 2010<br />
over current levels. This rising trend is equivalent to average annual increases of 11% in annual debt<br />
service costs.<br />
The majority of the burden of this capital investment falls on the District’s retail rate payers. Annual<br />
increases in retail rates of approximately 6.5% to 7.0% through FY 2008 followed by 6% annual<br />
increases from FY 2009 through FY 2012 will be required to finance the Authority’s existing capital<br />
program. This projection is consistent with the policy adopted by WASA’s Board of Directors to use<br />
steady rate increases as a way to mitigate the impacts of rising and mandated costs to customers. The<br />
Board established this policy after implementing a critically-needed 42% rate increase in 1997.<br />
Over the long-term, the Authority is projecting that future necessary infrastructure investment will<br />
continue to require steady rate increases of at least 5% per year. This longer-term outlook is<br />
consistent with national infrastructure studies that document the need for doubling of rates over 20<br />
years for infrastructure investment (see Clean and Safe <strong>Water</strong> for the 21 st Century, <strong>Water</strong><br />
Infrastructure Network, Washington, D.C.).<br />
Under this “baseline” scenario, in which customer rates are affected by the water and wastewater<br />
capital program and routine inflationary increases in the cost of doing business, the annual cost for<br />
water and wastewater costs for a typical residential customer with metered consumption of 100 CCF<br />
per year prior to consideration of the CSO LTCP will increase from $290 to $617, a 113% increase,<br />
in fifteen years.<br />
\\Gh-wash\ENG 1160\LTCP\LTCP Final\Sec 12.doc 12-11 FINAL - July 2002
Financial Capability<br />
12.6.2 Substantial Rate Increases Required to Fund LTCP<br />
Implementation of the LTCP will result in substantial additional rate increases and higher costs to the<br />
Authority’s customers over and above the increases needed to fund the baseline capital program.<br />
Through analysis of a range of LTCP implementation schedules WASA has determined that the only<br />
rates impacts that are feasible (without substantial outside funding) are those associated with the<br />
longest possible implementation schedules. Shorter implementation schedules create too high a<br />
burden on the Authority’s rate payers in terms of rapid escalation of the cost of wastewater services.<br />
If WASA implemented the proposed LTCP over a 40-year period, a typical residential customer with<br />
annual metered water consumption of 100 CCF will see their annual wastewater costs rise from $290<br />
to $722 in 15-years; an increase of 150%. This figure is $105 per year more than the annual bill in<br />
the baseline case without any CSO program.<br />
Any shortening of the implementation schedule to less than 40 years will significantly increase the<br />
impacts on WASA’s rate payers of the CSO controls. A fifteen-year LTCP implementation schedule<br />
would result in a more than tripling of wastewater bills to $1002 in fifteen years, and would require<br />
multiple peak increases within the next 5 to 10 years exceeding 15%, as described further below. A<br />
twenty-year program also has similar peaking impacts during the first 10 years.<br />
Table 12-7 displays the impacts for a 100 CCF customer over 15 years for the baseline and for<br />
several LTCP implementation schedules.<br />
Table 12-7<br />
Summary of Rate Impacts of the CSO LTCP on 100 CCF Residential Customer<br />
FY 2003<br />
Annual<br />
Bill<br />
Annual Bill<br />
in<br />
15 Years<br />
Average Annual<br />
Rate Increases<br />
Over 15 Years<br />
Baseline – No LTCP $290 $617 6.0%<br />
Baseline Plus LTCP – 40 Years $290 $722 7.2%<br />
Baseline Plus LTCP – 30 Years $290 $795 8.0%<br />
Baseline Plus LTCP – 20 Years $290 $942 9.4%<br />
Baseline Plus LTCP – 15 Years $290 $1,002 9.9%<br />
12.6.3 True Affordability Measure -- Impacts on Annual Household Budgets<br />
A key indicator of the affordability of the proposed LTCP is the impact on the annual household<br />
budgets for District ratepayers as measured by the timing and extent of the required annual rate<br />
increases.<br />
\\Gh-wash\ENG 1160\LTCP\LTCP Final\Sec 12.doc 12-12 FINAL - July 2002
Financial Capability<br />
The 15 and 20-year LTCP implementation schedules would require a large number of consecutive<br />
“double-digit” rate increases when the costs of those programs are added to the demands imposed by<br />
the baseline investment in water and wastewater infrastructure. The 15-year program is projected to<br />
require 8 consecutive increases over 10% per year. Such rate increases would outpace expected<br />
growth in household incomes by two to three times, therefore eroding household resources for other<br />
items .<br />
In addition to the extreme peaking of rate increases, the disparity between the rising costs that would<br />
be borne by District of Columbia residents and national experience is illustrated by the difference<br />
between 9.9% average annual increases associated with the 15-year program and the 3.6% annual<br />
rate of growth in consumer expenditures for water and sewer maintenance reported by the Bureau of<br />
Labor Statistics (BLS from January 1992 to January 2002.<br />
These burdens will make it increasingly difficult for the District to remain competitive on a “cost of<br />
living” or “cost of doing business basis” compared to neighboring jurisdictions or other major cities<br />
that are not faced with the same capital investment burden. Currently the Authority’s rates are<br />
generally competitive with the wastewater rates paid in neighboring jurisdictions in Maryland and<br />
Virginia but none of these jurisdictions is faced with the burden of an expensive CSO LTCP. The<br />
impact of this program will reduce the ability of the District to attract and retain residents and<br />
businesses relative to other locations in the area.<br />
Nationally, a survey conducted by Memphis Gas, Light and <strong>Water</strong> Division of residential wastewater<br />
bills for rates in effect in 2001 found the monthly wastewater bills for residential customers in the<br />
District were the sixth highest out of 28 cities surveyed. All of the future rate increases associated<br />
with the baseline infrastructure investment needs and the CSO will likely further reduce the District’s<br />
competitiveness on a cost of living and cost of doing business basis relative to other major cities that<br />
do not have the same burdens.<br />
Figure 12-4 shows the annual increase in wastewater rates required for the 15 and 20-year programs<br />
as well as the baseline case.<br />
\\Gh-wash\ENG 1160\LTCP\LTCP Final\Sec 12.doc 12-13 FINAL - July 2002
Financial Capability<br />
18%<br />
Figure 12–4<br />
Annual Rate Increases Required for 15 and 20-Year LTCP <strong>Plan</strong>s<br />
16%<br />
15-Year LTCP<br />
14%<br />
20-Year LTCP<br />
Annual Wastewater Rate Increase<br />
12%<br />
10%<br />
8%<br />
6%<br />
Baseline<br />
4%<br />
2%<br />
0%<br />
2 3 4 5 6 7 8 9 10111213141516171819202122232425262728293031323334353637383940<br />
Project Year<br />
Another important measure is the total increase in revenue requirement added in each fiscal year, as<br />
shown in Figure 12-5. This measure demonstrates the intense peaking requirements of the CSO<br />
program as well. A 15-year program would require approximately $20 million of annual rate<br />
increases solely for CSO in five out of six years at the height of the program. The highest annual<br />
increase in revenue requirement would be approximately $33 million when the total needs of the<br />
baseline infrastructure program and the CSO are taken together.<br />
<strong>Long</strong>er implementation schedules that range from 30 to 40 years greatly minimize peak rate<br />
increases: the 15-year schedule required eight consecutive annual increases in excess of 10 percent,<br />
while a 40 year schedule will only require one increase that is greater than 10 percent. Fewer peak<br />
increases under longer-term implementation schedules minimize the near-term impact on customers,<br />
particularly the 51,000 households with incomes less than $18,000 per year, allowing them to plan<br />
for more gradual rate increases that are in line with projected salary and other income increases.<br />
Figure 12-6 displays the annual rate increases required for 30- and 40-year implementation programs.<br />
\\Gh-wash\ENG 1160\LTCP\LTCP Final\Sec 12.doc 12-14 FINAL - July 2002
$35<br />
Financial Capability<br />
Figure 12-5<br />
Annual Increase in Revenue Requirement for 15-Year LTCP and Baseline Needs<br />
$30<br />
15-Year LTCP<br />
Annual Revenue Requirement Increase (millions)<br />
$25<br />
$20<br />
$15<br />
$10<br />
$5<br />
Baseline<br />
$0<br />
2 3 4 5 6 7 8 9 10 11 12 13 14 15 16 17 18 19 20<br />
-$5<br />
18%<br />
Project Year<br />
Figure 12-6<br />
Annual Rate Increases Required for 30 and 40-Year LTCP <strong>Plan</strong>s<br />
16%<br />
30-Year LTCP<br />
14%<br />
40-Year LTCP<br />
Annual Wastewater Rate Increase<br />
12%<br />
10%<br />
8%<br />
6%<br />
Baseline<br />
4%<br />
2%<br />
0%<br />
2 3 4 5 6 7 8 9 10 11 12 13 14 15 16 17 18 19 20 21 22 23 24 25 26 27 28 29 30 31 32 33 34 35 36 37 38 39 40<br />
Project Year<br />
\\Gh-wash\ENG 1160\LTCP\LTCP Final\Sec 12.doc 12-15 FINAL - July 2002
Financial Capability<br />
Although there are still burdensome peaks, in general the 40-year program requires less annual<br />
increases in rate revenues for CSO. As shown in Figure 12-5, a 15-year program will require annual<br />
rate revenue increases in excess of $20 million for five out of fifteen years. Figure 12-7 shows that a<br />
40-year schedule will require only one increase in excess of $20 million during the first fifteen years<br />
of implementation. This illustrates the minimizing effect of a longer term program on WASA’s<br />
customers, particularly low income customers.<br />
$35<br />
Figure 12-7<br />
Annual Increases in Revenue Requirements for 40-Year Program<br />
$30<br />
40-Year LTCP<br />
Annual Revenue Requirement Increase (millions)<br />
$25<br />
$20<br />
$15<br />
$10<br />
$5<br />
Baseline<br />
$0<br />
2 3 4 5 6 7 8 9 10 11 12 13 14 15 16 17 18 19 20<br />
-$5<br />
Project Year<br />
12.6.4 High Degree of Uncertainty in Rate Impacts Should Be Considered<br />
In formulating its rate impact analysis WASA focused on a “most probable” approach to key<br />
assumptions that represent the economic and demographic conditions during the foreseeable future in<br />
a manner appropriate for this planning document. Nevertheless, the economic and demographic<br />
conditions that actually materialize on a year-to-year basis may differ from those associated with the<br />
forecast. Some of these considerations are described below:<br />
<br />
<strong>Water</strong> Consumption - The analysis of rate impacts has assumed that metered water<br />
consumption is maintained at current levels over the long-term. <strong>Water</strong> consumption has<br />
declined over the past 2 decades due to technological improvements and shifts in consumer<br />
\\Gh-wash\ENG 1160\LTCP\LTCP Final\Sec 12.doc 12-16 FINAL - July 2002
Financial Capability<br />
behavior. Although WASA has taken steps to maintain a high level of meter accuracy and to<br />
reduce unbilled water, it is possible that water consumption will continue to decrease over the<br />
long-term, particularly in response to increasing rates. It is not unreasonable to expect that<br />
the 150% increase in rates over 15 years associated with the 40-year LTCP program will<br />
result in some level of reduced consumption. Any reduction in consumption will result in<br />
higher impacts have to be offset with further rate increases on the balance of the water sold<br />
by the Authority. There exists the potential to initiate a vicious cycle that would be<br />
particularly hard on low income households.<br />
<br />
Cost Estimates -The rate impact analysis reflects the cost estimates prepared for this planning<br />
document. These costs estimates have a level of confidence of minus-15% to plus-40%. It<br />
would be equally likely that the final cost estimates in today’s dollars are 40% greater or 15%<br />
less than the cost estimates included in this plan. These estimates reflect the level of<br />
planning and engineering completed to date on each alternative which is only a portion of the<br />
work needed to complete the project. It is very likely that the costs will be higher due to the<br />
complexity of the project and the unique risks involved with a mega-project. In recent<br />
months many high-profile mega-projects of this type have seen bid amounts far exceed<br />
preliminary estimates. Several examples within the Washington region are the Woodrow<br />
Wilson Bridge replacement and the I-495/I-395 interchange (the “Mixing Bowl”) project.<br />
Unlike those projects however, any cost increases or contract overruns would be borne by a<br />
relatively small population of wastewater rate payers in the District of Columbia. These are<br />
very real risks that should be considered as part of the financial capability assessment.<br />
<br />
Interest Rates - This rate impact analysis assumes that the Authority will be able to borrow<br />
for future CSO costs at the same interest rates as it currently pays for its utility revenue debt.<br />
Any increase in interest rates due to market conditions will need to be absorbed by WASA’s<br />
retail customers and will increase the financial burden of all LTCP schedule options. The<br />
Authority’s future credit rating and the structure of future bond issues could also have<br />
negative impacts on the revenue requirements. These risks should also be considered in the<br />
financial capability analysis.<br />
<br />
Future Regulatory Requirements - The rates impact analysis reflects the current regulatory<br />
horizon that the Authority has used to develop its current capital improvement program and<br />
the LTCP for its combined sewer system. The analysis does not provide for additional costs<br />
that may be mandated to cover future regulations such as Total Maximum Daily Loads<br />
(TMDLs) or additional nitrogen removal requirements at Blue Plains. While the baseline<br />
analysis provides substantial capital funding for future reinvestment in infrastructure, any<br />
extraordinary capital costs related to future regulation (e.g., disinfection by-products) or<br />
\\Gh-wash\ENG 1160\LTCP\LTCP Final\Sec 12.doc 12-17 FINAL - July 2002
Financial Capability<br />
critical infrastructure replacement needs would further increase rates for the Authority’s rate<br />
payers.<br />
12.6.5 Effect of Federal Funding on Rate Increases<br />
There are two ways to reduce the rate impacts of a shorter LTCP implementation schedule, external<br />
funding assistance and deferral of other water and wastewater capital expenditures.<br />
External assistance targeted at limiting peak rate increases can reduce the severe impacts of high<br />
annual rate increases associated with the shorter programs. External assistance of 62% of the capital<br />
cost of the program could keep rate increases to 8% per year as shown in the following chart. The<br />
additional annual revenue required would gradually increase to $11.2 million by year 15.<br />
Total external capital assistance under this scenario would be $960 million over 15 years. The<br />
external assistance in this case is targeted at the peaking impacts on wastewater rates and varies from<br />
year to year as necessary to limit rate increases to 8% or less. In any case, it is important for external<br />
assistance to reflect year-of-expenditure values or the actual “cost to complete” the project. If<br />
external assistance is determined on current dollars or on an amount per year, the cost to complete<br />
and inflation risks are shifted to ratepayers.<br />
16%<br />
Figure 12-8<br />
Rate Increases for a 15-Year LTCP <strong>Plan</strong> with External Assistance<br />
Targeted at Reducing Peak Impacts<br />
14%<br />
15-Year LTCP<br />
Annual Wastewater Rate Increase<br />
12%<br />
10%<br />
8%<br />
6%<br />
4%<br />
40-Year LTCP<br />
Baseline<br />
15-Year Peak Shaving Alternative<br />
2%<br />
0%<br />
2 3 4 5 6 7 8 9 10 11 12 13 14 15 16 17 18 19 20 21 22 23 24 25 26 27 28 29 30 31 32 33 34 35 36 37 38 39 40<br />
Project Year<br />
\\Gh-wash\ENG 1160\LTCP\LTCP Final\Sec 12.doc 12-18 FINAL - July 2002
Recommended <strong>Control</strong> <strong>Plan</strong><br />
Section 13<br />
Recommended <strong>Control</strong> <strong>Plan</strong><br />
13.1 INTRODUCTION<br />
This section describes the long-term control plan that WASA has selected. The purpose of the<br />
recommended plan is to improve water quality and it has been selected based on existing and new<br />
regulatory requirements, the alternatives evaluation, public input and consultation, and the financial<br />
capability analyses described in prior sections. In order to select the recommended plan, WASA<br />
considered the ability to meet water quality standards, cost effectiveness, and non-monetary factors<br />
such as reliability and ease of operation and maintenance. This section describes the recommended<br />
plan, the proposed implementation schedule, proposed revisions to water quality standards, and<br />
compliance monitoring.<br />
13.2 RECOMMENDED CONTROL PROGRAM<br />
WASA is committed to improving the quality of the Anacostia River, Rock Creek, and the Potomac<br />
River. The recommended LTCP has been selected to provide a significant improvement in the<br />
quality of each receiving water while balancing the affordability to ratepayers. The recommended<br />
LTCP consists of many elements and program components. Table 13-1 lists the components by<br />
receiving water. Figure 13-1 shows the location of the principal elements.<br />
<strong>System</strong> Wide<br />
Table 13-1<br />
Recommended <strong>Control</strong> Program Elements and Estimated Costs<br />
Component<br />
Low Impact Development – Retrofit (LID-R)– Advocate implementation of LID-R<br />
throughout entire District. Provide technical and regulatory assistance to District<br />
Government. Implement LID-R projects on WASA facilities where feasible.<br />
Anacostia River<br />
Rehabilitate Pumping Stations – Rehabilitate existing pumping stations as follows:<br />
Interim improvements at Main and ‘O’ Street Pumping Stations necessary<br />
for reliable operation until rehabilitation of stations is performed.<br />
Rehabilitate Main Pumping Station to 240 mgd firm sanitary capacity.<br />
Screening facilities for firm sanitary pumping capacity only.<br />
Rehabilitate Eastside and ‘O’ Street Pumping stations to 45 mgd firm<br />
sanitary capacity<br />
Interim improvements at existing Poplar Point Pumping Station necessary<br />
for reliable operation until replacement pumping station is constructed as<br />
part of storage tunnel<br />
Capital Cost<br />
Opinion<br />
(Millions,<br />
ENR=6383)<br />
Annual Operation<br />
and Maintenance<br />
(Millions,<br />
ENR=6383)<br />
$3 $0.11<br />
$115 $0 1<br />
\\Gh-wash\eng 1160\LTCP\LTCP Final\Sec 13.doc 13-1 FINAL - July 2002
Recommended <strong>Control</strong> <strong>Plan</strong><br />
Component<br />
Storage Tunnel from Poplar Point to Northeast Boundary Outfall – 49 million gallon<br />
storage tunnel between Poplar Point and Northeast Boundary. Tunnel will intercept<br />
CSOs 009 through 019 on the west side of the Anacostia. Project includes new tunnel<br />
dewatering pump station and low lift pumping station at Poplar Point.<br />
Storage/Conveyance Tunnel Parallel to Northeast Boundary <strong>Sewer</strong> – 77 million gallon<br />
storage/conveyance tunnel parallel to the Northeast Boundary <strong>Sewer</strong>. Also includes<br />
side tunnels from main tunnel along West Virginia and Mt. Olivet Avenues, NE and<br />
Rhode Island and 4 th St NE to relieve flooding. Abandon Northeast Boundary Swirl<br />
Facility upon completion of main tunnel.<br />
Outfall Consolidation – Consolidate the following CSOs in the Anacostia Marina area:<br />
CSO 016, 017 and 018<br />
Capital Cost<br />
Opinion<br />
(Millions,<br />
ENR=6383)<br />
$332<br />
$452<br />
Annual Operation<br />
and Maintenance<br />
(Millions,<br />
ENR=6383)<br />
$7.98<br />
$27 $0 1<br />
Separate CSO 006 – Separate this CSO in the Fort Stanton Drainage Area $3 $0.01<br />
Ft Stanton Interceptor – Pipeline from Fort Stanton to Poplar Point to convey CSO<br />
005, 006 and 007 on the east side of the Anacostia to the storage tunnel.<br />
Rock Creek<br />
$11 $0.04<br />
Anacostia Subtotal $940 $8.03<br />
Separate Luzon Valley – Completed in 2002. Completed $0<br />
Separation – Separate CSOs 031, 037, 053, and 058. $5 $0.02<br />
Monitoring at CSO 033, 036, 047 and 057 – Conduct monitoring to confirm prediction<br />
of overflows. If overflows confirmed, then perform the following:<br />
<br />
<br />
Regulator Improvements: Improve regulators for CSO 033, 036, 047 and<br />
057<br />
Connection to Potomac Storage Tunnel: Relieve Rock Creek Main<br />
Interceptor to proposed Potomac Storage Tunnel when it is constructed<br />
$3 $0.01<br />
Storage Tunnel for Piney Branch (CSO 049) – 9.5 million gallon storage tunnel $42 $0.60<br />
Potomac River<br />
Rehabilitate Potomac Pumping Station – Rehabilitate station to firm 460 mgd pumping<br />
capacity<br />
Outfall Consolidation – Consolidate CSOs 023 through 028 in the Georgetown<br />
<strong>Water</strong>front Area.<br />
Potomac Storage Tunnel – 58 million gallon storage tunnel from Georgetown to<br />
Potomac Pumping Station. Includes tunnel dewatering pumping station.<br />
Blue Plains Wastewater Treatment <strong>Plan</strong>t<br />
Excess Flow Treatment Improvements – Four new primary clarifiers, improvements to<br />
excess flow treatment control and operations<br />
Notes:<br />
1. No significant change from existing.<br />
Rock Creek Subtotal $50 $0.63<br />
$12 $0 1<br />
$20 $0 1<br />
$218 $2.78<br />
Potomac River Subtotal $250 $2.78<br />
$22 $1.81<br />
Grand Total $1,265 $13.36<br />
\\Gh-wash\eng 1160\LTCP\LTCP Final\Sec 13.doc 13-2 FINAL - July 2002
Recommended <strong>Control</strong> <strong>Plan</strong><br />
13.2.1 <strong>System</strong> Wide <strong>Control</strong>s: Low Impact Development - Retrofit<br />
The objective of low impact development (LID) is to mimic predevelopment site hydrology by using<br />
site design techniques that store, infiltrate, evaporate and detain runoff from rainfall events.<br />
Examples of such facilities include biofilters, tree planting, rain gardens, sand filters, porous<br />
pavement, storm water detention, rooftop greening and others. LID has the potential to reduce CSOs<br />
by diverting runoff into LID facilities and thereby preventing that runoff from reaching surface<br />
waters. Also, certain LID facilities (e.g. biofilters) can provide some treatment to runoff and reduce<br />
the pollutant load in discharges to surface waters.<br />
Low Impact Development Retrofit (LID-R) is the application of LID to the modification of an<br />
existing site. Since most of the District is developed, LID-R appears to offer the practicable<br />
approach for implementation of LID in the District. Public comments indicated a strong preference<br />
for LID-R, and this section describes the LID-R measures that have been included in the LTCP.<br />
Benefits of LID-R<br />
The analyses conducted as part of the LTCP indicate that LID-R can reduce the magnitude and<br />
frequency of CSOs. Generally, CSO reduction benefits of LID-R are in proportion to the quantity of<br />
storm water that would be diverted from the receiving waters (e.g. Anacostia River) by the LID-R<br />
measures. In order to achieve a high degree of CSO control, a large application rate for LID-R is<br />
required.<br />
In order to meet the requirements of the CSO Policy, the degree of CSO control proposed in the<br />
LTCP is extremely high in that the controls are sized for large and intense storms. As a result, the<br />
analyses indicate that application of LID-R by itself cannot be expected to provide the degree of CSO<br />
control proposed in the LTCP. However, LID-R can be coupled with structural controls to reduce<br />
CSOs or to reduce the size of capital facilities required for the degree of control proposed in the<br />
LTCP.<br />
In addition to CSO control, LID-R can provide other ancillary benefits. These include beautification<br />
and aesthetic improvements, reduced cooling costs and reduction in pollutants from the separate<br />
storm water system. Because LID diverts storm water from the collection system, it also has the<br />
potential to reduce the total amount of flow treated by the BPWWTP. This would potentially<br />
provide capacity to handle additional dry weather flow or increase treatment performance without<br />
constructing additional facilities at the plant.<br />
Challenges to Implementation<br />
There are several challenges associated with the implementation of LID-R. These have been divided<br />
into technical, institutional and regulatory issues below:<br />
\\Gh-wash\eng 1160\LTCP\LTCP Final\Sec 13.doc 13-4 FINAL - July 2002
Recommended <strong>Control</strong> <strong>Plan</strong><br />
<br />
Technical Issues - In the past, LID has been primarily applied in new developments. Little<br />
data are available on the application of LID in urban retrofit conditions on a mass scale the<br />
size of the District. The lack of data makes it difficult to predict the implementability,<br />
performance, cost and CSO reduction benefits of such measures. As a result, there is<br />
uncertainty as to the practicability of implementation of LID-R in heavily developed urban<br />
areas and its benefits and cost effectiveness.<br />
LID-R would typically be applied on a small scale, on a street by street and lot by lot<br />
approach. Models to predict the effectiveness of LID-R measures on a micro-scale are being<br />
developed but are not available for use in this study. In addition, CSO planning requires<br />
prediction of system wide CSO performance over an extended period of time. Even if such<br />
micro-scale models were available, they would most likely not be practical to apply over the<br />
entire District and for extended simulations necessary to develop a LTCP under the CSO<br />
Policy. Given these challenges, there is uncertainty as to the CSO performance of LID-R<br />
measures in the urban setting.<br />
If the degree of CSO control to be obtained by LID were to match the storage approach<br />
included in the LTCP, an LID-R program equivalent to complete separation might be<br />
required.<br />
Prediction of the benefits of LID-R can involve many complex phenomena and require sitespecific<br />
information that is not available at a planning level study. As an example, LID-R<br />
measures that infiltrate runoff into the ground may inadvertedly increase infiltration in<br />
adjacent combined sewers. This may negate some of the effectiveness of the LID-R<br />
measures. This is an example of the complexities that can be encountered when evaluating<br />
LID-R.<br />
Various efforts are underway to measure the effectiveness of LID-R and to improve LID-R<br />
technology. These may help make LID-R more practical, effective and attractive to citizens<br />
in the long run.<br />
<br />
Institutional Issues – LID-R would need to be applied in streets, sidewalks, parking lots and<br />
in public and private property in the District. One difficulty is that WASA does not control<br />
and cannot regulate development or redevelopment in the District. As a result, WASA is not<br />
able to mandate application of LID-R. Laws and building codes in the District would need to<br />
be changed in order for this to occur. WASA can, however, serve as an advocate for LID-R<br />
and recommend these types of changes to the District and provide technical assistance in<br />
their development. This is discussed further below.<br />
\\Gh-wash\eng 1160\LTCP\LTCP Final\Sec 13.doc 13-5 FINAL - July 2002
Recommended <strong>Control</strong> <strong>Plan</strong><br />
<br />
Regulatory Issues - The most practical and cost-effective way to implement LID-R would be<br />
in conjunction with redevelopment and reconstruction within the District. It would be much<br />
more costly to implement LID-R separate from reconstruction that was already planned. As<br />
a result, the implementation time associated with LID-R would be a function of the rate and<br />
magnitude of redevelopment. This may make the implementation time for LID-R very long<br />
and the benefits of LID-R may not be measurable for several decades.<br />
After the LTCP is implemented, WASA’s discharge permit will require a specified degree of<br />
performance for the CSO controls. Violations of the permit are subject to penalties by law.<br />
If LID-R is relied on to provide all or part of the control specified in the permit, this could<br />
place WASA in the situation of having to meet a permit condition without the means to<br />
control LID-R, which is relied upon to meet the permit.<br />
Incorporating LID-R in the LTCP<br />
The following are findings regarding the application of LID-R for CSO control in the District:<br />
<br />
Since application of LID-R on a mass scale for CSO control is unproven, LID-R<br />
demonstration projects geared toward CSO reduction are recommended.<br />
<br />
The storage tunnels on the Potomac and Rock Creek are scheduled to be constructed after the<br />
Anacostia projects. The sizes of these facilities will be re-evaluated based on the results of<br />
the demonstration projects and the actual degree of implementation of LID-R at the time of<br />
design. This allows the possibility of reducing the size of the capital facilities required based<br />
on the application of LID-R.<br />
<br />
Application of LID-R in the low–density Rock Creek drainage areas may be the most<br />
beneficial. The piping system in Rock Creek generally conveys wet weather flow out of<br />
Rock Creek to the Potomac River. At the Potomac, the flow is either pumped to the<br />
BPWWTP or overflows to the Potomac River. Some of this flow is also transferred to the<br />
Anacostia system. Reducing wet weather flows in Rock Creek not only reduces CSOs in<br />
Rock Creek, but also reduces CSOs in the Potomac River and offloads flow from the<br />
Anacostia. LID-R in Rock Creek may thus have a synergistic effect on the system as a<br />
whole. The relatively low density residential areas in Rock Creek are also more likely to<br />
allow cost effective implementation of LID-R than more densely developed areas.<br />
<br />
The consensus of the public and regulatory agencies is that CSO controls for the Anacostia<br />
River should be implemented first. This does not allow for development and evaluation of<br />
demonstration projects prior to design and construction. As a result, the CSO facilities on the<br />
Anacostia have been sized without taking credit for the potential benefits provided by LID-R.<br />
\\Gh-wash\eng 1160\LTCP\LTCP Final\Sec 13.doc 13-6 FINAL - July 2002
Recommended <strong>Control</strong> <strong>Plan</strong><br />
If LID-R is significantly implemented, CSO control will improve beyond that provided by<br />
the Anacostia control facilities.<br />
<br />
Institutional changes are required to allow and encourage application of LID-R<br />
The LID-R measures presented in Table 13-2 have been selected to be part of the LTCP implemented<br />
by WASA to support the findings identified above.<br />
Table 13-2<br />
LID-R Measures in LTCP – By WASA<br />
Opinion of Capital Cost<br />
Description<br />
(Millions, ENR = 6383)<br />
1. LID-R at WASA Facilities – Incorporate LID-R techniques into new<br />
construction or reconstruction on WASA facilities, where applicable $3<br />
2. Re-Evaluate the Sizes of the Potomac and Rock Creek Storage<br />
Tunnels – Based on the results of WASA demonstration projects,<br />
other current LID information, and on the actual application of LID-R<br />
in the District at the time, re-evaluate the sizing of the Rock Creek<br />
and Potomac Storage Tunnels. Modify the LTCP as appropriate. --<br />
3. Advocate for LID-R – As storm water administrator, be an advocate<br />
for the implementation for LID-R and provide technical and<br />
management guidance where feasible. --<br />
TOTAL $3<br />
Suggestions for institutional changes and programs to foster LID-R are presented in Table 13-3. The<br />
suggested agency for implementing each program is also included.<br />
Table 13-3<br />
Recommendations for Institutional Change to Foster LID-R<br />
Description<br />
Applicable<br />
Agencies<br />
Public Education<br />
1. Develop a public education program to encourage the use of LID-R in the District.<br />
District, Federal<br />
Government<br />
Change Development/Redevelopment Regulations<br />
2. Adopt building code provisions that allow and encourage LID-R. District<br />
3. Consider requiring LID-R for land disturbing activities greater than a threshold<br />
dollar amount for redevelopmnet. The LID–R requirement would be to reduce<br />
storm water runoff to levels that approach the natural environment prior to human District<br />
development. This is more stringent than the requirement of no net increase in<br />
storm water.<br />
\\Gh-wash\eng 1160\LTCP\LTCP Final\Sec 13.doc 13-7 FINAL - July 2002
Recommended <strong>Control</strong> <strong>Plan</strong><br />
Description<br />
4. Consider encouraging LID-R on a voluntary basis by associating it with the<br />
building permit process. To obtain a permit, the permittee would need to comply<br />
with the LID-R requirements adopted. A financial incentive could be provided in<br />
terms of a reduced building permit fee, tax incentives or a reduced storm water<br />
fee. Literature and approaches could be provided to permittees with the building<br />
permit application material handed out to each permittee.<br />
Change Government Practices<br />
5. Consider revising Department of Public Works standard details to include LID-R<br />
measures as part of transportation construction.<br />
6. Develop government construction guidelines used in redevelopment and new<br />
projects that incorporate LID-R. For example, some cities have policies requiring<br />
that ‘open’ designs be implemented to reduce the presence of hidden, out of the<br />
way places where crime is more likely. Others have development guidelines<br />
requiring historically correct façades on new buildings in historic neighborhoods.<br />
Similar voluntary guidelines incorporating LID-R could be adopted by the District<br />
government, federal government, military facilities and institutions.<br />
Provide Financial Incentives<br />
7. Consider a partial credit in the storm water fee to individuals/groups implementing<br />
LID-R.<br />
8. Consider a tax rebate to individuals/groups implementing LID-R.<br />
9. Consider a revolving loan fund for LID-R implementation.<br />
Applicable<br />
Agencies<br />
District<br />
District<br />
District, Federal<br />
Government<br />
District<br />
District, Federal<br />
Government<br />
District, Federal<br />
Government<br />
In 2001, the D.C. Council proposed the “Urban Forest Preservation Act of 2001”. The bill requires<br />
that mature trees removed or damaged during construction be replaced on the same property or at<br />
another location in the community. It also provides for establishment of a Tree Fund, paid for by<br />
those undertaking construction. The fund would be used to improve management of existing trees in<br />
the District. This type of legislation is consistent with LID-R measures and could help to reduce<br />
CSO in the long term.<br />
In addition to these, WASA looks forward to participating in a partnership with others to investigate<br />
the feasibility of apply LID-R in an urban setting. Possible goals of the partnership would be to<br />
demonstrate and evaluate LID-R effectiveness on a sewershed basis, establish design, construction<br />
and performance standards, assess capital, operating and maintenance costs, and determine<br />
practicality. Such a program might consist of demonstrating LID-R on approximately three sewer<br />
sheds with drainage areas in the five to ten acre range. The first year of the program might include<br />
monitoring of the baseline situation without LID-R. After that, LID facilities would be constructed<br />
and an additional phase of monitoring for approximately one year would be conducted to assess<br />
benefits. Given time for finding suitable sites, design, construction and monitoring, the overall<br />
duration of the program might be in the range of three to five years. Given the Federal Government’s<br />
\\Gh-wash\eng 1160\LTCP\LTCP Final\Sec 13.doc 13-8 FINAL - July 2002
Recommended <strong>Control</strong> <strong>Plan</strong><br />
role in the District and its interest is identifying techniques that could be applied elsewhere, a<br />
significant Federal participation in such a partnership would be appropriate.<br />
WASA would also be willing to participate in a watershed forum or planning group, with a Federal<br />
presence, to address pollution in the watershed. The LTCP has identified that storm water is one of<br />
the major pollution sources for all of the urban watersheds. Storm water pollution is a common<br />
concern of the District, Virginia and Maryland. This could serve as a catalyst to create the forum and<br />
to strive for solutions.<br />
13.2.2 Anacostia River Components<br />
The control measures selected for the Anacostia River are predicted to limit overflows to 2 events per<br />
average year. During the three year analysis period (1988-1990), the frequency of overflow ranged<br />
from one per year to three per year for dry and wet years, respectively. The controls were selected to<br />
make maximum use of existing facilities and to provide supplemental storage via a tunnel to control<br />
overflows. The controls include the following:<br />
<br />
<br />
<br />
<br />
<br />
<br />
Rehabilitating existing Pumping Stations – Main, ‘O’ Street and Eastside pumping stations<br />
will be rehabilitated to firm pumping capacities of 240 mgd, 45 mgd, and 45 mgd,<br />
respectively.<br />
Storage/Conveyance Tunnel – A storage/conveyance tunnel will be constructed from Poplar<br />
Point to Northeast Boundary. The tunnel will intercept the CSOs from the Main and O Street<br />
Pumping Station site, the CSOs along the Navy Yard and M Street, and the Northeast<br />
Boundary CSO. An additional leg of the tunnel will be constructed parallel to the Northeast<br />
Boundary <strong>Sewer</strong> and to several low lying areas to provide additional storage for CSO and to<br />
relieve street and basement flooding in the Northeast Boundary area.<br />
The existing Poplar Point Pumping station will be replaced. A tunnel dewatering pump<br />
station will be incorporated into the new facility, enabling this one facility to serve two<br />
functions. In the interim, improvements will be made at the facility to assure reliable<br />
operation until the new pumping station is completed. Construction of a new Poplar Point<br />
Pumping Station could be coordinated with other improvements envisioned as part of the<br />
Anacostia <strong>Water</strong>front Initiative, such as construction of a new South Capitol Street Bridge<br />
over the Anacostia. WASA will continue to meet with the D.C. Office of <strong>Plan</strong>ning to<br />
coordinate these improvements.<br />
Once the tunnel is completed, the Northeast Boundary Swirl Facility will be abandoned.<br />
Separate CSO 006 – Separate this CSO on the east side of the Anacostia River, eliminating it<br />
as a CSO outfall.<br />
Outfall Consolidation – consolidate outfalls 016, 107 and 018 in the Anacostia Marina area<br />
by connecting them to the tunnel. This will eliminate these outfalls from the system and<br />
remove these outfalls from the marina area.<br />
\\Gh-wash\eng 1160\LTCP\LTCP Final\Sec 13.doc 13-9 FINAL - July 2002
Recommended <strong>Control</strong> <strong>Plan</strong><br />
13.2.3 Rock Creek Components<br />
The control measures selected for Rock Creek are predicted to limit Piney Branch overflows to one<br />
per average year. At Piney Branch, the frequency of overflow ranged from zero per year to two per<br />
year for dry and wet years, respectively, during the three-year analysis period. The remaining<br />
overflows in Rock Creek will be controlled to 4 events per average year. For these overflows, the<br />
frequency of overflow ranged from one per year to six per year for dry and wet years, respectively,<br />
during the three year analysis period. The principal control measures are:<br />
Separate Luzon Valley (CSO 059) – Separation of this area was completed in early 2002.<br />
Separate CSOs 031, 037, 053, and 058 – separation of these four drainage areas comprising a<br />
total drainage area of about 28 acres. This will allow the elimination of these CSOs.<br />
Monitoring at CSOs 033, 036, 047, and 057- These CSOs are predicted to overflow relatively<br />
infrequently and in very small amounts. Monitoring will be conducted to confirm that<br />
overflows are indeed occurring. If the monitoring confirms the predictions of the model, then<br />
regulator improvements will be implemented on each of the CSOs and relief of the Rock<br />
Creek Main Interceptor will be provided by connecting the interceptor to the proposed<br />
Potomac Storage Tunnel. If the monitoring indicates that surcharge in the Rock Creek Main<br />
Interceptor is worse than predicted by the model, then a relief interceptor parallel to the Rock<br />
Creek Main Interceptor may be required. The capital cost of the relief interceptor is<br />
estimated to be about $17 million. This cost is not included in the recommended LTCP.<br />
Piney Branch Storage Tunnel – The largest CSO in Rock Creek is Piney Branch. A storage<br />
tunnel would be constructed to control overflows from this largest CSO. The tunnel would<br />
dewater by gravity, avoiding the need for a pumping station.<br />
13.2.4 Potomac River Components<br />
The control measures selected for the Potomac River are predicted to limit overflows to 4 events per<br />
average year. During the three-year analysis period, the frequency of overflow ranged from zero per<br />
year to five per year for dry and wet years, respectively. The principal control measures are:<br />
<br />
<br />
<br />
Rehabilitation of Potomac Pumping Station – rehabilitation of Potomac Pumping Station will<br />
enable more flow to be pumped to BPWWTP for treatment. The rehabilitation of the station<br />
is predicted to reduce CSOs in the Georgetown area by one half.<br />
Potomac Storage Tunnel – a storage tunnel would be constructed from west of the Key<br />
Bridge, parallel to Georgetown, and terminating at Potomac Pumping Station. The tunnel<br />
will intercept the Georgetown CSOs and the large CSOs downstream of Rock Creek. A new<br />
pumping station would be constructed at the Potomac Pump Station to dewater the tunnel.<br />
Outfall Consolidation – consolidate outfalls 023/024, 025, 026, 027 and 028 in the<br />
Georgetown waterfront area by connecting them to the tunnel. This would eliminate these<br />
\\Gh-wash\eng 1160\LTCP\LTCP Final\Sec 13.doc 13-10 FINAL - July 2002
Recommended <strong>Control</strong> <strong>Plan</strong><br />
five outfalls from the system and remove these outfalls from the most used portion of the<br />
waterfront.<br />
13.2.5 Blue Plains Wastewater Treatment <strong>Plan</strong>t Components<br />
The recommended LTCP reflects that the Blue Plains Wastewater Treatment <strong>Plan</strong>t (BPWWTP) will<br />
operate at its current permit limits. The facility is currently rated for 370 mgd on an annual average<br />
basis. During wet weather events, flows up to 740 mgd can receive treatment for up to 4 hours. After<br />
the first 4 hours, the treatment capacity is reduced to 511 mgd to protect the biological process.<br />
Additional flows of up to 336 mgd that exceed the treatment capacity of the plant receive excess flow<br />
treatment, which consists of screening, grit removal, primary treatment and disinfection before<br />
discharge to the Potomac River. For the first four hours, the combined treatment and excess flow<br />
capacity is 1076 mgd (740 + 336) and thereafter 847 mgd (511 + 336).<br />
In 1999, a review of the excess flow control strategy was conducted, and recommendations were<br />
developed in order to improve the reliability and performance of that treatment train. These<br />
improvements are needed as part of the LTCP and major elements are summarized below:<br />
<br />
<br />
<br />
<br />
Construct four additional primary clarifiers (or their equivalent) on the east side of the plant<br />
(“J House” primary tanks). These tanks will decrease the loading on the existing tanks and<br />
will improve reliability by providing redundancy.<br />
Lengthen the weir on the Excess Flow Chlorine Contact Tank and replace influent sluice<br />
gates with motor operated butterfly valves to reduce headloss through the system and<br />
improve control.<br />
Incorporate a control system and possibly variable speed drives into the rehabilitation of Raw<br />
Wastewater Pump Station No. 2 to improve control of wet well levels at the facility.<br />
Improve record keeping, time keeping and communications during excess flow events and<br />
provide automated controls to facilitate these functions.<br />
The BPWWTP was designed for nitrification, and these facilities were placed in operation in 1980.<br />
The plant was not originally designed to remove nitrogen (i.e. to denitrify). In 1987, the District of<br />
Columbia signed the Chesapeake Bay Agreement, which calls for voluntary reductions in nutrients to<br />
the Bay by 40 percent by 2000 using 1985 as a base year. In 1996, a Denitrification Demonstration<br />
Facility was constructed at BPWWTP. The facility uses the existing nitrification reactors and other<br />
nitrification capacity to conduct both nitrification and denitrification. Nitrification capacity was<br />
reduced to the first four stages of the reactor, to accommodate denitrification in the last stage. Full<br />
scale denitrification using this approach was later incorporated at the plant.<br />
This approach to denitrification utilizes one facility for two processes. There are difficulties in<br />
conducting denitrification under all conditions of flow, load and temperature. This was shown to be<br />
\\Gh-wash\eng 1160\LTCP\LTCP Final\Sec 13.doc 13-11 FINAL - July 2002
Recommended <strong>Control</strong> <strong>Plan</strong><br />
the case when implementation of nitrogen removal was negotiated with regulatory agencies.<br />
Experience with the full scale facility has shown that denitrification process produces poorly settling<br />
solids which contribute to solids washouts and blinding of the effluent filters at high flow rates. This<br />
is due to attempting to treat high flows during storm events simultaneously with nitrificationdenitrification<br />
using the same tankage, particularly during cold weather. Based on this experience, it<br />
appears that BPWWTP will not be able to reliable denitrify under high flow conditions.<br />
The frequency of this occurrence depends on rainfall conditions and water temperature. A<br />
preliminary estimate of the time denitrification might not be feasible is on the order of 100 days per<br />
average year. This will need to be refined when higher flows begin to be received at the plant after<br />
the pump station rehabilitations.<br />
Because the Chesapeake Bay Program is considering revised nitrogen limits for the Bay, future<br />
NPDES permits may require nitrogen removal at Blue Plains to an effluent concentration as low as 3<br />
mg/L. Chesapeake Bay Program Goals may thus dictate nitrogen removal requirements at the plant,<br />
and further measures should be based on the final outcome of the Bay Program. No costs for<br />
nitrogen removal are included in the LTCP.<br />
13.2.6 Permits and Land Requirements<br />
Permits and approvals from a myriad of agencies will be required to construct the recommended<br />
LTCP. Without performing detailed facility plans for each control measure, it is not possible to<br />
ascertain all of the required permits and approvals. It is, however, likely that permits may be<br />
required from the District Government including D.C. Department of Health, National Park Service,<br />
the U.S. Army Corps of Engineers, EPA and possibly easements from some private land owners.<br />
Because many of the CSO facilities cross National Park Service land to reach the receiving waters,<br />
extensive permitting and coordination with this agency will be required.<br />
Actual land and permitting requirements will depend on the alignment and configuration selected for<br />
the control facilities. Effort will be made to select alignments to minimize the need for easements<br />
and right of ways. Based on the preliminary concepts in the recommended plan, significant land and<br />
permitting requirements are summarized in Table 13-4.<br />
Anacostia Components<br />
Table 13-4<br />
Preliminary Assessment of Significant Land and Permitting Requirements<br />
Land/Permitting Activity<br />
Site for new Poplar Point Pumping Station<br />
Site for replacement East Side Pumping Station<br />
Easements/right of way for tunnel, pipelines and<br />
appurtenant facilities<br />
Probable Permitting Agency<br />
Depends on location, probably the National Park Service<br />
National Park Service<br />
National Park Service, various private property owners and<br />
government agencies, depending on selected alignment<br />
\\Gh-wash\eng 1160\LTCP\LTCP Final\Sec 13.doc 13-12 FINAL - July 2002
Recommended <strong>Control</strong> <strong>Plan</strong><br />
Land/Permitting Activity<br />
Right of way or easements for Fort Stanton Interceptor and<br />
appurtenant facilities<br />
Potomac Components<br />
Easements/right of way for tunnel, pipelines and<br />
appurtenant facilities<br />
Rock Creek Components<br />
Easements/right of way for Piney Branch Storage Tunnel,<br />
shafts and appurtenant facilities<br />
Easements/right of way for Rock Creek Regulator<br />
Improvements<br />
Probable Permitting Agency<br />
National Park Service, depending on alignment<br />
National Park Service, various private property owners and<br />
government agencies, depending on selected alignment<br />
National Park Service<br />
National Park Service<br />
13.2.7 Expandability<br />
The CSO Policy requires that control plans be expandable such that higher levels of control can be<br />
implemented if required in the future. The recommended plan can be expanded to a plan that would<br />
provide zero overflows in the three analysis years or to a plan that would provide zero overflows<br />
during a 5-year 24-hour design storm. There are many ways to do this including:<br />
<br />
<br />
<br />
<br />
<br />
<br />
Separate portions of the CSO area<br />
Implement additional LID in the District<br />
High Rate Treatment<br />
Expanding the tunnel system:<br />
o Anacostia <strong>System</strong> – extend the proposed tunnel which terminates at Poplar Point to<br />
BPWWTP, greatly increasing the storage volume.<br />
o Potomac <strong>System</strong> – extend the Potomac tunnel to join with the Anacostia Tunnel in<br />
the vicinity of the Main and O Street Pumping Stations.<br />
o Piney Branch – Extend the Anacostia Tunnel from Florida Avenue to intercept Piney<br />
Branch. The Piney Branch tunnel proposed in the LTCP would remain. Once the<br />
Piney Branch tunnel filled, it would overflow to the extension of the Anacostia<br />
Tunnel.<br />
o Blue Plains – Construct a tunnel dewatering pump station to empty the contents of<br />
the entire tunnel system. Construct a high rate treatment facility to treat the contents<br />
of the tunnel. This would be required since BPWWTP does not have adequate<br />
capacity to treat the large volume of stored CSO in a reasonable amount of time.<br />
Emergence of new technologies<br />
Combinations of the above<br />
The selection of a method of expansion would depend on the desired goal. This would need to be<br />
determined on a case by case basis.<br />
\\Gh-wash\eng 1160\LTCP\LTCP Final\Sec 13.doc 13-13 FINAL - July 2002
Recommended <strong>Control</strong> <strong>Plan</strong><br />
13.2.8 Other Activities Benefiting CSO <strong>Control</strong><br />
Activities by other governmental and private organizations could improve the degree of CSO control<br />
provided by the recommended plan. These activities are typically aimed at reducing storm water<br />
runoff, but include other flow reduction measures. They would reduce the load on the combined<br />
sewer system by reducing flows in the sewers and thereby reduce overflows.<br />
The recommended LTCP does not take credit for these activities being in place. This is because<br />
WASA may not control the activities or because there is no firm information as to when or to what<br />
degree the activities will be implemented or effective. As a result, any degree of implementation or<br />
effectiveness would serve to improve the level of CSO control provided by the recommended LTCP.<br />
The activities are described below:<br />
<br />
Trees in the District – trees can reduce runoff and slow down flow into the combined sewer<br />
system. :In a letter to WASA regarding the storm water retained by trees during storm<br />
events, James Urban, FASLA indicated that during a rain event the "above ground structure<br />
of the tree (leaves, branches and trunk) becomes coated with water held by surface tension<br />
and not released. Most of this water evaporates after the rain event. Additional water<br />
attaches to the tree and the surface friction of the tree slows its downward flow into the storm<br />
water system." Mr. Urban has examined the literature and found two sources to calculate the<br />
amount of water held in the tree: (1) "Urban Hydrology for Small <strong>Water</strong>sheds TR-55"<br />
published by the USDA Natural Resources Conservation Service in June 1986, while not<br />
specifically addressing the water held in canopy, is designed to look at large storm events and<br />
indicates an approximately 10% decrease in runoff resulting from the addition of tree canopy<br />
(derived by comparing runoff from forested and grazed pasture in poor soils). (2) A more<br />
recent study conducted at the Center for Urban Forest Research, USDA Forest Service,<br />
University of California, Davis [xiao@cstars.ucdavis.edu], indicates that trees hold between<br />
0.05 to 0.17 inches of water per square foot of canopy area, retaining about 10% of a oneinch<br />
rain event when in full leaf (and less in winter). Consequently, Mr. Urban concludes:<br />
"Trees, even when they are growing in environments that are mostly paved, have a significant<br />
impact on storm water flow rates and time of concentration. New technologies in the design<br />
for trees in urban areas allow us to grow significant tree canopies in areas that are mostly<br />
paved." (Urban, 2001)<br />
Some of the activities related to trees are summarized below<br />
o District’s Urban Forestry Administration – The Mayor and D.C. Council have<br />
improved the District’s street tree maintenance and planting programs under the<br />
Urban Forestry Administration in the Department of Transportation.<br />
\\Gh-wash\eng 1160\LTCP\LTCP Final\Sec 13.doc 13-14 FINAL - July 2002
Recommended <strong>Control</strong> <strong>Plan</strong><br />
o Urban Forestry Preservation Act - In 2001, the D.C. Council proposed the “Urban<br />
Forest Preservation Act of 2001”. The bill requires that mature trees removed or<br />
damaged during construction be replaced on the same property or at another location<br />
in the community. It also provides for establishment of a Tree Fund, paid for by<br />
those undertaking construction. The fund would be used to improve management of<br />
existing trees in the District.<br />
o Casey Trees Foundation – In 2001, Ms. Betty Brown Casey of the Eugene B. Casey<br />
Foundation gave $50 million to the Garden Club of America for the creation of a<br />
permanent endowment to restore the tree canopy of Washington, <strong>DC</strong>. The Casey<br />
trees Foundation was thus created to restore and enhance the District’s trees. In the<br />
summer of 2002, the foundation is performing an inventory of public and privately<br />
owned trees. More information is available at www.caseytrees.org.<br />
<br />
Building Code Changes – WASA participates on the Building Code Advisory Committee,<br />
which reviews and advises on code changes. As part of this committee, WASA advocates for<br />
practical changes that encourage and allow low impact development and other measures<br />
aimed at decreasing runoff. The committee recently proposed a series of changes that could<br />
reduce flow to the combined sewer system. The changes now await action by the Director of<br />
the D.C. Department of Consumer and Regulatory Affairs and submittal to and approval by<br />
the D.C. Council. The proposed changes relevant to runoff reduction are as follows:<br />
o Changes to Section 1101 of Plumbing Code to allow storm water discharge to<br />
vegetated areas and any other approved place of disposal<br />
o New Section 708 of Plumbing Code that requires owners to disconnect storm<br />
drainage systems from sewer systems if physically possible and when the property<br />
improvements exceed 50% of fair market value<br />
o Changes to definition of “Cisterns” in the Plumbing code to allow cisterns in any land<br />
use<br />
<br />
Zoning Changes – The Zoning Commission has asked the Mayor’s Office of <strong>Plan</strong>ning to<br />
review regulations that encourage or require more rather than less impervious cover in land<br />
use. WASA proposes to make the agencies aware of the issues and seek appropriate reform.<br />
<br />
D.C. Extension Service – the Land Grant Extension Service, based at the University of the<br />
District of Columbia (U<strong>DC</strong>), has expressed an interest in playing a role in LID programs.<br />
WASA has offered to work with U<strong>DC</strong> and the Extension Service.<br />
<br />
Suburban Jurisdictions – The suburban jurisdictions send separate sanitary wastewater flow<br />
to Blue Plains for treatment. Monitoring data indicates that this flow increases during wet<br />
\\Gh-wash\eng 1160\LTCP\LTCP Final\Sec 13.doc 13-15 FINAL - July 2002
Recommended <strong>Control</strong> <strong>Plan</strong><br />
weather, most likely due to infiltration and inflow. While wet weather flows from the<br />
suburbs are within the peak flow limits allowed by the Intermunicipal Agreement (IMA), the<br />
suburbs do have ongoing infiltration and inflow reduction programs. For example, WSSC<br />
has a program to assess wet weather flow in particular drainage basins and prioritize them for<br />
remedial action as is cost effective and appropriate. Such reductions in wet weather flows<br />
from the suburbs could help in the reduction in CSOs in the District.<br />
<br />
Other WASA programs, other than the LTCP - WASA has other programs that are or will be<br />
underway that may have additional CSO reduction benefits. These are:<br />
o <strong>Water</strong> Conservation and Wastewater Flow Reduction Programs - these programs will<br />
reduce dry weather flow, thereby allowing the system to accommodate more CSO.<br />
The purpose of the programs is to reduce the District’s annual average flow from the<br />
current 160mgd to meet the District’s IMA allocation of 148 mgd. The LTCP was<br />
prepared with the District’s dry weather flow at 148 mgd. Any additional reductions<br />
in flow due to these programs below the IMA allowance would provide additional<br />
CSO reduction benefit.<br />
o <strong>Sewer</strong> <strong>System</strong> Assessment – WASA is beginning a system-wide sewer system<br />
assessment program. The purpose of the program is to assess the condition and<br />
capacity of the sewer system and to develop a program for rehabilitation and upgrade<br />
of the system where needed. This program may make recommendations for<br />
downspout disconnection, some selective separation and projects to reduce inflow<br />
and infiltration. Particular attention will be given to separating areas where<br />
investments in separation have already been made such as College Pond and portions<br />
of downtown near the Capitol and White House.<br />
o Tide Gate Replacement – WASA is in the process of replacing tide gates at selected<br />
CSO outfalls. Replacement of tide gates can reduce the amount of water that enters<br />
the system from the receiving waters, thereby freeing ups space for CSO and<br />
reducing overflows.<br />
13.3 BENEFITS OF RECOMMENDED CONTROL PROGRAM<br />
The selected CSO control program is expected to provide significant benefits to the citizens of the<br />
District and to all who use and enjoy the Anacostia River, Rock Creek and the Potomac River.<br />
13.3.1 CSO Overflow Reduction<br />
The frequency and volume of CSO overflows will be greatly reduced as a result of the recommended<br />
LTCP. Table 13-5 illustrates the reduction of overflows.<br />
\\Gh-wash\eng 1160\LTCP\LTCP Final\Sec 13.doc 13-16 FINAL - July 2002
Recommended <strong>Control</strong> <strong>Plan</strong><br />
Table 13-5<br />
CSO Overflow Reduction of Recommended CSO <strong>Plan</strong> (Average Year)<br />
Anacostia<br />
River<br />
Item<br />
CSO Overflow Volume (mg/yr)<br />
No Phase I <strong>Control</strong>s<br />
With Phase I <strong>Control</strong>s<br />
Recommended <strong>Plan</strong><br />
% Reduction from No Phase I <strong>Control</strong>s<br />
Number of Overflows/yr<br />
No Phase I <strong>Control</strong>s<br />
82<br />
With Phase I <strong>Control</strong>s<br />
75<br />
Recommended <strong>Plan</strong><br />
2<br />
Notes:<br />
1. One at Piney Branch, four at the other Rock Creek CSOs<br />
2,142<br />
1,485<br />
54<br />
97.5%<br />
Potomac<br />
River<br />
1,063<br />
953<br />
79<br />
92.5%<br />
74<br />
74<br />
4<br />
Rock<br />
Creek<br />
49<br />
52<br />
5<br />
89.8%<br />
Total<br />
<strong>System</strong><br />
3,254<br />
2,490<br />
138<br />
95.8%<br />
-<br />
30<br />
1 / 4 1 -<br />
30 -<br />
% Capture of<br />
<strong>Combined</strong> Sewage<br />
per CSO Policy<br />
76%<br />
82%<br />
99%<br />
-<br />
-<br />
-<br />
-<br />
The Phase I CSO controls consisted of the inflatable dams for in-system storage and the Northeast<br />
Boundary Swirl Facility for treatment of CSO overflows. These controls were completed in 1991.<br />
Prior to the Phase I <strong>Control</strong>s, the predicted annual CSO overflow volume to all receiving waters was<br />
about 3,254 million gallons. The Phase I <strong>Control</strong>s reduced this to an estimated 2,490 million gallons.<br />
The recommended CSO plan is predicted to reduce this to 138 million gallons or by about 95.8% on<br />
a system-wide basis compared to no Phase I <strong>Control</strong>s.<br />
In the Anacostia the number of overflows are predicted to decrease from about 82 per average year to<br />
2 per average year. Similarly, the number of overflows in the Potomac River and Rock Creek are<br />
predicted to decrease from 74 and 30 to 4 and 1 per average year, respectively.<br />
In addition to demonstrating reductions in overflows from current levels, EPA’s CSO Policy calls for<br />
calculating the percentage of combined sewage that is captured for treatment in the combined sewer<br />
system. The percentage of capture without the Phase I CSO controls was already very high at 76%,<br />
primarily due to the ability of BPWWTP to treat high flows during wet weather events. With<br />
implementation of the recommended LTCP, the CSO capture rate is predicted to be 99% on a system<br />
wide, annual average basis. This is extremely high when compared to EPA’s guideline of 85%<br />
capture under the presumptive approach as described in Section 2.<br />
13.3.2 Outfall Elimination<br />
The recommended plan will eliminate 14 CSO outfalls by separation and consolidation. For CSOs<br />
eliminated by separation, a storm water outfall will be present for each of the drainage areas<br />
separated. The eliminated outfalls are summarized in Table 13-6.<br />
\\Gh-wash\eng 1160\LTCP\LTCP Final\Sec 13.doc 13-17 FINAL - July 2002
Recommended <strong>Control</strong> <strong>Plan</strong><br />
Table 13-6<br />
Outfalls Eliminated by Consolidation and Separation<br />
Receiving<br />
<strong>Water</strong> Outfall Eliminated Drainage Area Method of Elimination<br />
Anacostia CSO 006 Fort Stanton Separation<br />
Anacostia CSO 016 Navy Yard/M St.: 12 th St.– 9 th St. Consolidation<br />
Anacostia CSO 017 Navy Yard/M St.: 14 th to Penn Consolidation<br />
Ave.<br />
Anacostia CSO 018 Barney Circle Consolidation<br />
Potomac CSO 023/024 West of Rock Creek Diversion Consolidation<br />
<strong>Sewer</strong> – K St.To Wisconsin Ave.<br />
Potomac CSO 025 31 st & K St NW Consolidation<br />
Potomac CSO 026 <strong>Water</strong> St District (WRC) Consolidation<br />
Potomac CSO 027 Georgetown Consolidation<br />
Potomac CSO 028 37 th St-Georgetown Consolidation<br />
Rock Creek CSO 031 Penn Ave-Middle East Rock<br />
Separation<br />
Creek<br />
Rock Creek CSO 037 Kalorama Circle West – E. Rock Separation<br />
Creek<br />
Rock Creek CSO 053 Q St. – West Rock Creek Separation<br />
Rock Creek CSO 058 Connecticut Avenue Separation<br />
Rock Creek CSO 059 Luzon Valley Separation Complete<br />
Total Number 14<br />
Note that the tunnels must be completed before consolidation can take place because the tunnel<br />
capacity is used to move the flow from the consolidated outfalls downstream. Separation can<br />
proceed independently of the tunnels.<br />
13.3.3 <strong>Water</strong> Quality<br />
Bacteria and dissolved oxygen are the two common performance measures used to assess water<br />
quality and the benefits provided by CSO control.<br />
Bacteria<br />
The analyses conducted as part of the LTCP demonstrated that other sources of bacteria will prevent<br />
meeting the Class A water quality standard for fecal coliform in the Anacostia River and Rock Creek,<br />
even if CSOs were eliminated. However, the recommended LTCP will dramatically reduce the<br />
impact of CSOs. By themselves, CSOs will meet the fecal coliform geometric mean standard in each<br />
receiving water as shown in Table 13-7.<br />
\\Gh-wash\eng 1160\LTCP\LTCP Final\Sec 13.doc 13-18 FINAL - July 2002
Recommended <strong>Control</strong> <strong>Plan</strong><br />
Table 13-7<br />
CSOs Will Meet Bacteria Geometric Mean Standard<br />
No. of Months per Average Year<br />
Class A Fecal Coliform Standard<br />
Receiving <strong>Water</strong> of 200/100 ml Exceeded<br />
Anacostia River 0<br />
Potomac River 0<br />
Rock Creek 0<br />
Figure 13-2 shows the number of days where the predicted fecal coliform concentration is greater<br />
that 200/100 ml.<br />
Figure 13-2<br />
Number of Days Fecal Coliforms Exceeding 200/100 ml<br />
Days per Year<br />
350<br />
300<br />
250<br />
200<br />
150<br />
100<br />
50<br />
0<br />
No Phase I <strong>Control</strong>s 239 142 294<br />
Recommended <strong>Plan</strong> - All Loads 182 106 294<br />
Recommended <strong>Plan</strong>-CSO's Only,<br />
Calendar Year (1)<br />
Recommended <strong>Plan</strong>-CSO's Only,<br />
May-Sept (1)<br />
Anacostia River<br />
(Navy Yard)<br />
Potomac River<br />
(at Memorial<br />
Bridge)<br />
Rock Creek (at<br />
Zoo)<br />
7 4 1<br />
5 3 1<br />
Note: (1) Days due to CSOs are number of days concentration exceeds 200/100 ml if there were no other sources of bacteria.<br />
In the Anacostia River, implementation of the recommended LTCP will reduce the number of days<br />
where the predicted concentration is above 200/100 ml from approximately 239 days to 182 days.<br />
Figure 13-2 shows the predicted days the concentration in the receiving waters would exceed 200 due<br />
to CSOs if there were no other sources of bacteria in the river. Of the 182 days predicted to exceed<br />
200/100ml, 7 days in the year would be caused by CSOs. Of those 7 days, 5 are in the period May<br />
through September, the period of most likely primary contact recreation. A similar pattern is<br />
observed for the Potomac River and Rock Creek.<br />
\\Gh-wash\eng 1160\LTCP\LTCP Final\Sec 13.doc 13-19 FINAL - July 2002
Recommended <strong>Control</strong> <strong>Plan</strong><br />
While other sources of pollution will prevent meeting water quality standards that allow full body<br />
contact recreation, CSO controls will significantly reduce the concentrations of bacteria in the<br />
receiving waters. As an example, the fecal coliform concentrations in May in the Anacostia at the<br />
Navy Yard are predicted to decrease from about 3,300 organisms/100ml (no Phase I <strong>Control</strong>s) to<br />
about 800 organisms/100ml (2 overflows per year).<br />
Dissolved Oxygen<br />
Dissolved oxygen is not a significant concern in Rock Creek or the Potomac River because existing<br />
water quality standards are met the majority of the time. The reduction of CSO overflows to these<br />
receiving waters will reduce the quantity of pollutants which contribute to oxygen deficiencies.<br />
In the Anacostia River, dissolved oxygen is a significant concern. Low dissolved oxygen levels<br />
typically occur in the summer months of June to August and typically follow a significant local or<br />
upstream wet weather event. The low dissolved oxygen is driven by the naturally low saturation<br />
level of oxygen in the water due to the high water temperature, the influx of pollutant loads from wet<br />
weather events, and the demand exerted by polluted sediments in the river bottom. Dissolved oxygen<br />
levels below 2.0 mg/L can occur several times per summer month, with each episode lasting 1 to 2<br />
days. Fish kills have been observed in the past. Figure 13-3 shows the projected benefits provided<br />
by the recommended LTCP at South Capitol Street.<br />
In addition to the number of days less than 5 mg/L, the figure also shows the number of days less<br />
than 4 mg/L and 2 mg/L. Below 4 mg/L, certain fish begin to experience stress, while dissolved<br />
oxygen levels below 2 mg/L cause a risk of fish kill.<br />
It is predicted that the recommended LTCP will reduce the number of days less than 5 mg/L from<br />
approximately 93 to 66. A similar reduction is observed for the 4 mg/L threshold. At South Capitol<br />
Street, the selected plan is predicted to eliminate the number of days less than 2 mg/L, the fish kill<br />
threshold. It is important to note that dissolved oxygen levels below 2.0 mg/L are still predicted to<br />
occur at other locations in the river such as at the Navy Yard and RFK Stadium, primarily due to the<br />
impact of sources such as upstream loads, storm water discharges and the sediments in the river.<br />
\\Gh-wash\eng 1160\LTCP\LTCP Final\Sec 13.doc 13-20 FINAL - July 2002
Recommended <strong>Control</strong> <strong>Plan</strong><br />
Figure 13-3<br />
Number of Days Per Year Dissolved Oxygen is Less Than Indicated<br />
Value at South Capitol Street in Anacostia River<br />
100<br />
80<br />
Days/year<br />
60<br />
40<br />
20<br />
0<br />
No Phase I <strong>Control</strong>s 93 49 6<br />
Recommended LTCP-All<br />
Loads<br />
Recommended LTCP-CSO's<br />
Only<br />
Days < 5 mg/L Days
Recommended <strong>Control</strong> <strong>Plan</strong><br />
Location<br />
Table 13-8<br />
LTCP Meets Anacostia River TMDLs<br />
BOD TMDL (lb BOD/avg yr) TSS TMDL (tons TSS/April-Oct 1989)<br />
TMDL Allocation<br />
to CSO<br />
Projected CSO<br />
Load for LTCP<br />
TMDL Allocation<br />
to CSO<br />
Projected CSO<br />
Load for LTCP<br />
Upper Anacostia 0 8,901 58 56<br />
Lower Anacostia 152,906 9,490 45.4 22<br />
Total 152,906 18,391 103.4 78<br />
Preliminary discussions with DOH indicate that the LTCP will comply with the future fecal coliform<br />
TMDL for the Anacostia, Potomac and Rock Creek.<br />
Chesapeake Bay Program<br />
In 1983 and 1987, Virginia, Maryland, Pennsylvania, the District of Columbia, the Chesapeake Bay<br />
Commission and EPA signed agreements establishing the Chesapeake Bay Program to protect and<br />
restore the Chesapeake Bay. In 2000, Chesapeake 2000 was signed which reaffirmed the<br />
commitments. The Agreement calls for many measures to improve the ecosystem such as habitat<br />
restoration, water quality protection and improvement, nutrient reduction, land conservation and<br />
other factors. The receiving waters in the District are tributary to the Chesapeake Bay and affect its<br />
water quality. The reduction in CSO overflow of 96 % due to the proposed CSO controls will benefit<br />
the Bay and will contribute to meeting the goals of the Bay Program.<br />
13.3.4 Solids and Floatables <strong>Control</strong><br />
Solids and floatables on the receiving waters come from the following sources:<br />
<br />
<br />
<br />
<br />
<strong>Combined</strong> sewer overflows<br />
Storm water outfalls<br />
Littering and dumping directly into or along the receiving waters<br />
Upstream sources<br />
Implementation of the recommended control plan will virtually eliminate solids and floatables from<br />
combined sewer system discharges because the majority of CSOs will be captured and treated. For<br />
storms which are beyond the capacity of the proposed control system, the first flush of CSO which<br />
contains the vast majority of solids and floatables will be captured and treated. Overflows from the<br />
proposed control system will typically occur near the end of extreme storm events after most of the<br />
solids and floatables have been washed from the streets and captured by the control facilities. In<br />
addition, the following control measures will be implemented:<br />
\\Gh-wash\eng 1160\LTCP\LTCP Final\Sec 13.doc 13-22 FINAL - July 2002
Recommended <strong>Control</strong> <strong>Plan</strong><br />
<br />
<br />
<br />
WASA will incorporate floatables control for overflows which exceed the capacity of the<br />
recommended control plan into the design of new CSO diversion structures/facilities which<br />
will be constructed as part of the recommended plan, where practical. One method that<br />
might be used is a combination baffle/bar rack arrangement in new CSO regulators. This<br />
method has been used successfully in Richmond, Virginia and Boston, Massachusetts. As<br />
was discovered in those communities, there may be some outfalls where incorporation of<br />
floatables control into new facilities is not practical due to hydraulics, site constraints or other<br />
factors. This will be evaluated on a case by case basis during the design phase.<br />
WASA will continue to operate the Anacostia River Floatable Debris Removal Program,<br />
which consists of skimmer boats that remove solids and floatables from the Anacostia and<br />
Potomac Rivers. Note that this program removes materials from the rivers from all sources,<br />
not just from CSOs.<br />
The storm water pumps at the Main and O Street Pumping Stations incorporate trash racks on<br />
the influent side of the pumps that remove floatables before discharge to the Anacostia River.<br />
After implementation of the recommended plan, a large amount of trash may still be present due to<br />
sources other than CSO. <strong>Control</strong> of these other sources in a watershed-based approach is<br />
recommended.<br />
13.4 COMPARISON OF FINAL LTCP TO DRAFT LTCP<br />
The Final LTCP described in this report represents a major increase in CSO control over the Draft<br />
LTCP that was released in June 2001. In developing the Final LTCP, consideration was given to<br />
public and regulatory agency comments, the CSO Policy, the need to meet D.C. water quality<br />
standards, and existing and prospective TMDLs for the receiving waters. Particular attention was<br />
paid to separation, outfall elimination, low impact development and increasing the level of CSO<br />
control. Major advances in each of these categories have been made. The Final LTCP is compared<br />
to the Draft in Table 13-9.<br />
Table 13-9<br />
Comparison of Final and Draft LTCPs<br />
Item Draft LTCP Final LTCP<br />
No. CSO Overflows/Avg. Year<br />
Anacostia 4 2<br />
Potomac 12 4<br />
Rock Creek at Piney Branch 4 1<br />
Rock Creek – other outfalls 4 4<br />
CSO Overflow Volume (mg/avg yr)<br />
Anacostia 93 54<br />
Potomac 153 79<br />
Rock Creek 13 5<br />
Total 259 138<br />
% Reduction From Existing 92% 96%<br />
\\Gh-wash\eng 1160\LTCP\LTCP Final\Sec 13.doc 13-23 FINAL - July 2002
Recommended <strong>Control</strong> <strong>Plan</strong><br />
Item Draft LTCP Final LTCP<br />
% Reduction on Anacostia 96% 98%<br />
<strong>System</strong> Characteristics<br />
CSO Storage Volume (mg) 147 193<br />
No of CSO Outfalls 60 46<br />
<strong>Water</strong> Quality Criteria<br />
Meets Oxygen and Bacteria <strong>Water</strong> Quality<br />
Standard for Design Condition Yes Yes<br />
BOD - Yes<br />
TSS - Yes<br />
Meets Anacostia BOD and TSS TMDLs<br />
Yes<br />
Cost<br />
Capital Cost (Year 2001) $1.05 Billion $1.265 Billion<br />
Cost Increase over Draft LTCP - 20%<br />
13.5 FINANCIAL IMPACTS<br />
A detailed affordability analysis was prepared to assess the impact of the recommended LTCP on<br />
rate payers. The following two methods were used:<br />
<br />
<br />
<strong>Long</strong>-term rate impact analyses using the Authority’s financial planning and rates model, and<br />
Affordability analysis using procedures developed by EPA.<br />
A key indicator of the affordability of the proposed LTCP is the impact on the annual household<br />
budgets for District ratepayers as measured by the timing and extent of the required annual rate<br />
increases. To document the actual impact on household budgets and to supplement the EPA<br />
approach, WASA conducted an analysis of the impacts of the CSO program on wastewater rates.<br />
To finance its current $1.6 billion capital program, annual increases in retail rates of approximately<br />
6.5% to 7.0% through FY 2008 followed by 6% annual increases from FY 2009 through FY 2012<br />
will be required. Over the long-term, WASA is projecting that future necessary infrastructure reinvestment<br />
will continue to require steady rate increases of about 5% per year. This longer-term<br />
outlook is consistent with national infrastructure studies that document the need for doubling of rates<br />
over 20 years for infrastructure investment. Under this “baseline” scenario, the annual cost for water<br />
and wastewater for a typical residential customer with metered consumption of 100 CCF per year<br />
will increase 113% (from $290 to $617) in fifteen years.<br />
Implementation of the LTCP will result in additional rate increases and higher costs to the<br />
Authority’s customers over and above the increases needed to fund the baseline capital program.<br />
Through analysis of a range of LTCP implementation schedules WASA has determined that the only<br />
rates impacts that are feasible are those associated with the longest implementation schedules. Table<br />
13-10 displays the impacts for a 100 CCF customer over 15 years for the baseline and for several<br />
LTCP implementation schedules.<br />
\\Gh-wash\eng 1160\LTCP\LTCP Final\Sec 13.doc 13-24 FINAL - July 2002
Recommended <strong>Control</strong> <strong>Plan</strong><br />
Table 13-10<br />
Rate Impacts of the CSO LTCP on 100 CCF Residential Customer<br />
FY 2003<br />
Annual<br />
Bill<br />
Annual Bill<br />
in<br />
15 Years<br />
Annual<br />
Rate Increases<br />
Over 15 Years<br />
Baseline – No LTCP $290 $617 6.0%<br />
Baseline Plus LTCP – 40 Years $290 $722 7.2%<br />
Baseline Plus LTCP – 30 Years $290 $795 8.0%<br />
Baseline Plus LTCP – 20 Years $290 $942 9.4%<br />
Baseline Plus LTCP – 15 Years $290 $1,002 9.9%<br />
If WASA implemented the proposed LTCP over a 40-year period, a typical residential customer with<br />
annual metered water consumption of 100 CCF will see their annual wastewater costs rise from $290<br />
to $722 in 15-years; a 150% increase.<br />
Shorter LTCP implementation schedules create too high a burden on the Authority’s rate payers in terms<br />
of rapid escalation of the cost of wastewater services. The 15 and 20-year LTCP implementation<br />
schedules would require a large number of consecutive “double-digit” rate increases when the costs<br />
of those programs are added to the demands imposed by the baseline investment in water and<br />
wastewater infrastructure. As shown in Figure 13-4, the 15-year program is projected to require 8<br />
consecutive increases over 10% per year. Such rate increases would outpace expected growth in<br />
household incomes by two to three times, thereby eroding household resources for other items. As<br />
shown in Figure 13-5, longer implementation schedules require lower peak rate increases and reduce<br />
the number of increases over 10% from 8 consecutive increases to fund the 15-year schedule to a<br />
single increase exceeding 10% in the case of the 40-year schedule.<br />
There are two ways to reduce the rate impacts of a shorter LTCP implementation schedule, external<br />
funding assistance and deferral of other water and wastewater capital expenditures. External<br />
assistance targeted at limiting peak rate increases can reduce the severe impacts of high annual rate<br />
increases associated with the shorter programs. External assistance of approximately 62% of the<br />
capital cost of the program can keep rate increases to 8% per year as shown in the following chart.<br />
Total external capital assistance under this scenario would be $960 million. It is important for any<br />
external assistance to reflect year-of-expenditure values or the actual “cost to complete” the project.<br />
If external assistance is determined on current dollars or on an amount per year, the cost to complete<br />
and inflation risks are shifted to ratepayers.<br />
\\Gh-wash\eng 1160\LTCP\LTCP Final\Sec 13.doc 13-25 FINAL - July 2002
Recommended <strong>Control</strong> <strong>Plan</strong><br />
18%<br />
Figure 13-4<br />
Annual Rate Increases Required for 15 and 20-year LTCP <strong>Plan</strong>s<br />
16%<br />
15-Year LTCP<br />
14%<br />
20-Year LTCP<br />
Annual Wastewater Rate Increase<br />
12%<br />
10%<br />
8%<br />
6%<br />
Baseline<br />
4%<br />
2%<br />
0%<br />
2 3 4 5 6 7 8 9 10 11 12 13 14 15 16 17 18 19 20 21 22 23 24 25 26 27 28 29 30 31 32 33 34 35 36 37 38 39 40<br />
Project Year<br />
18%<br />
Figure 13-5<br />
Annual Rate Increases Required for 30 and 40-year LTCP <strong>Plan</strong>s<br />
16%<br />
30-Year LTCP<br />
14%<br />
40-Year LTCP<br />
Annual Wastewater Rate Increase<br />
12%<br />
10%<br />
8%<br />
6%<br />
Baseline<br />
4%<br />
2%<br />
0%<br />
2 3 4 5 6 7 8 9 10 11 12 13 14 15 16 17 18 19 20 21 22 23 24 25 26 27 28 29 30 31 32 33 34 35 36 37 38 39 40<br />
Project Year<br />
\\Gh-wash\eng 1160\LTCP\LTCP Final\Sec 13.doc 13-26 FINAL - July 2002
Recommended <strong>Control</strong> <strong>Plan</strong><br />
The EPA’s approach involves calculating the cost per household (CPH) for residential customers for<br />
current and proposed wastewater treatment and CSO control costs. The CPH is used in conjunction<br />
with the median household income (MHI), estimated at $39,760 per year in 2001, to estimate<br />
residential impacts. Residential impacts are considered by EPA to be ‘low’ if the CPH is less than<br />
1% of the MHI, ‘medium’ if the CPH is between 1% and 2% of the MHI, and ‘high’ if the CPH is<br />
greater than 2% of the MHI. The CPH is combined with other factors such as unemployment rate,<br />
property tax collection rates and other factors to develop an overall assessment of financial burden.<br />
In the District, incomes do not follow a conventional statistical distribution. Instead, there is a<br />
distinct clustering of household incomes at the lower and upper extremes of the income spectrum.<br />
Because of the disproportionate number of low-income households in the District, the impact of<br />
wastewater treatment and CSO control costs on the lowest 20% of income distribution in the District<br />
was calculated. The analysis was performed for the maximum income in this category, which is<br />
$18,000 per year.<br />
Table 13-11 summarizes the results of the analysis. For all median incomes, wastewater treatment<br />
costs including the proposed CSO controls are projected to impose a medium burden according to<br />
EPA guidelines. Current wastewater treatment costs alone impose a medium burden on lower<br />
income households. Addition of CSO controls to low income households increases the burden level<br />
to EPA’s highest level, reaching nearly 3.5% of household income alone for wastewater costs.<br />
Various levels of Federal assistance are listed showing the degree to which they reduce the CPH as a<br />
percent of median income.<br />
Table 13-11<br />
Cost Impacts on Residential Customers (Year 2001 Dollars)<br />
Scenario<br />
Cost Per<br />
Household for<br />
Wastewater<br />
Treatment ($/yr)<br />
Median<br />
Incomes<br />
Cost Per Household as % of Income<br />
Upper end of Lower 24% of Incomes<br />
($18,000/yr Income)<br />
Current Residential Bill (April 2001) $271 0.8% 1.5 %<br />
After Completion of Current Capital<br />
Improvement Program, but no additional CSO<br />
controls 1 $329 0.83% 1.83%<br />
Current Capital Improvement Program Plus<br />
Additional Recommended CSO <strong>Control</strong>s:<br />
0% Assistance $602 1.51% 3.35%<br />
25% Assistance $539 1.36% 3.00%<br />
75% Assistance $413 1.04% 2.30%<br />
Notes: 1. Includes cost of rehabilitation of Main, ‘O’ Street, Eastside and Poplar Point Pumping Stations.<br />
\\Gh-wash\eng 1160\LTCP\LTCP Final\Sec 13.doc 13-27 FINAL - July 2002
Recommended <strong>Control</strong> <strong>Plan</strong><br />
13.6 SCHEDULE<br />
A schedule for implementing the selected control plan was developed using the following priorities:<br />
<br />
<br />
<br />
<br />
<br />
In accordance with public and regulatory agency comments, Anacostia River projects should<br />
be given priority.<br />
Those projects which could be implemented quickly should be moved ahead in the schedule.<br />
Those projects which provide the greatest environmental benefit should be a priority.<br />
Those projects that would benefit sensitive areas should be a priority.<br />
Practical construction considerations, such as the need to construct downstream facilities<br />
prior to upstream facilities.<br />
Based on these considerations, a sequencing of projects was developed. An implementation schedule<br />
was then developed for each project. The implementation schedule typically included the following<br />
steps:<br />
<br />
<br />
<br />
<br />
<br />
<br />
Facility <strong>Plan</strong>ning – This step comprises the next activity following approval of the LTCP and<br />
includes developing additional definition of the project necessary for preliminary design.<br />
Examples would include performing planning level geotechnical investigations and<br />
developing proposed alignments for the tunnels, setting bases for design, establishing system<br />
hydraulics, siting shafts, regulators and pumping stations, and other elements needed to<br />
define the function and interaction of the system.<br />
Design – This step consists of performing preliminary designs and preparing contract<br />
documents (plans and specifications) to obtain bids for construction.<br />
Permitting, Approvals, Land Acquisitions – this step entails obtaining the necessary permits<br />
and approvals required for construction. It also includes acquiring land or obtaining<br />
easements necessary for construction.<br />
Notice to Proceed – After obtaining bids and awarding a construction contract, a notice to<br />
proceed is issued to the construction contractor indicating that work can begin.<br />
Construction - this includes the building of the facility.<br />
Place in Operation – at this milestone, the facility is operational and is performing the<br />
function for which it is intended. Construction may extend beyond this milestone for such<br />
items as landscaping, final cleanup, punch list items or to address claims arising during<br />
construction.<br />
The projects in the LTCP can be divided into two categories: those in the existing Capital<br />
Improvement Program (CIP) and those not currently in the CIP. Projects in the CIP have been<br />
budgeted and scheduled and these projects will move forward without approval of the LTCP. The<br />
schedule for these projects is shown on Figure 13-6.<br />
\\Gh-wash\eng 1160\LTCP\LTCP Final\Sec 13.doc 13-28 FINAL - July 2002
Recommended <strong>Control</strong> <strong>Plan</strong><br />
For projects not currently in the CIP, an implementation schedule has been developed based on years<br />
after approval of the LTCP. Based on the financial capability assessment and in order to mitigate the<br />
annual rate increases that would be required to fund the full LTCP, 40-year implementation time is<br />
required for the entire recommended plan if no outside financial assistance is received. This<br />
schedule is shown on Figure 13-7.<br />
If significant outside financial assistance is obtained, it is technically feasible to accelerate the<br />
schedule to a 15-year implementation time frame. Significant outside assistance on the order of 62%<br />
would be required to achieve this schedule. A 15-year schedule is shown on Figure 13-8.<br />
13.7 BASES FOR LTCP DEVELOPMENT AND IMPLEMENTATION SCHEDULE<br />
The LTCP has been developed at this stage to a conceptual level. Basic capacities have been<br />
established for the facilities, general locations have been selected and appurtenant and support<br />
facilities identified. Also, the general hydraulic operation of the system has been formulated,<br />
interfaces with existing facilities considered and potential construction sequencing reviewed.<br />
The overall probable time requirements for implementing the complete LTCP range from fifteen to<br />
forty years. These time requirements are dictated principally by the availability of funds. There are,<br />
however, a wide-array of institutional, legal and technical factors which also control time<br />
requirements for implementation of the LTCP. This plan will be one of the largest single public<br />
works projects in the District and experience shows that it is neither feasible nor practicable to<br />
establish final time requirements for the various elements that make up a project of this magnitude<br />
and complexity in a highly urbanized environment.<br />
Time requirements in the implementation schedule have been based on information compiled during<br />
the planning process, experience with similar projects and estimates of future and field conditions.<br />
There are a number of uncertainties associated with the time requirements included in the<br />
implementation plan and schedules. As the implementation process moves forward, it will be<br />
necessary to identify and resolve such uncertainties and to adjust time requirements. Additionally,<br />
changes in laws, requirements or regulations could occur during implementation of the LTCP and<br />
requires different time requirements than anticipated. The principal criteria, standards, regulations,<br />
laws, guidelines and assumptions upon which the elements of the LTCP and schedule are based<br />
include but may not be limited to those listed below. Changes to any of the following may require<br />
modification of the LTCP and the implementation schedule:<br />
1. The Clean <strong>Water</strong> Act, 1994 CSO Policy and EPA guidance for CSOs and for performing<br />
water quality standard reviews and revisions.<br />
2. District of Columbia <strong>Water</strong> Quality Standards.<br />
\\Gh-wash\eng 1160\LTCP\LTCP Final\Sec 13.doc 13-29 FINAL - July 2002
District Columbia <strong>Water</strong> and <strong>Sewer</strong> Authority<br />
<strong>Combined</strong> <strong>Sewer</strong> <strong>System</strong> <strong>Long</strong> <strong>Term</strong> <strong>Control</strong> <strong>Plan</strong><br />
Figure 13-6<br />
Implementation Schedule for Projects in Capital Improvement Program (CIP)<br />
No. Activity 2001 2002 2003 2004 2005 2006 2007 2008 2009 2010<br />
SYSTEM WIDE<br />
1. Low Impact Redevelopment<br />
By WASA 1<br />
2.<br />
ANACOSTIA RIVER PROJECTS<br />
Rehabilitate Main and 'O' Street Pumping<br />
Stations<br />
Retain Program Manager and Designer<br />
Design<br />
Permitting<br />
Construction<br />
Place in Operation<br />
3. Rehabilitate Eastside Pumping Station<br />
Retain Program Manager and Designer<br />
Design<br />
Permitting, Land Acquistion<br />
Construction<br />
Place in Operation<br />
4. Rehabilitate Poplar Point Pumping Station<br />
Retain Program Manager and Designer<br />
Design<br />
Permitting<br />
Construction<br />
Place in Operation<br />
Legend<br />
Ongoing Program<br />
Procurement<br />
Design (2)<br />
Approvals (3)<br />
Construction (4)<br />
Facility <strong>Plan</strong>ning<br />
POTOMAC RIVER PROJECTS<br />
5. Rehabilitate Potomac Pumping Station<br />
Retain Program Manager and Designer<br />
Design<br />
Permitting<br />
Construction<br />
Place in Operation<br />
Notes:<br />
1. Incorporate into new construction or reconstruction at WASA facilities where appropriate.<br />
2. Includes submitting documents for requried approvals.<br />
3. Includes approvals from agencies having jurisdiction and obtaining necessary permits, advertisement for bids and award of<br />
4. Construction may extend beyond placing facilities in operation.<br />
13-30
District Columbia <strong>Water</strong> and <strong>Sewer</strong> Authority<br />
<strong>Combined</strong> <strong>Sewer</strong> <strong>System</strong> <strong>Long</strong> <strong>Term</strong> <strong>Control</strong> <strong>Plan</strong><br />
Figure 13-7<br />
40-Year Implementation Schedule for Projects Not in Capital Improvement Program (CIP)<br />
Schedule (Years after Approval of LTCP)<br />
No. Activity 1 2 3 4 5 6 7 8 9 10 11 12 13 14 15 16 17 18 19 20 21 22 23 24 25 26 27 28 29 30 31 32 33 34 35 36 37 38 39 40<br />
SYSTEM WIDE<br />
1. Low Impact Redevelopment (1)<br />
By WASA 1<br />
By District<br />
2. Facility <strong>Plan</strong><br />
ANACOSTIA RIVER<br />
PROJECTS<br />
3. Separate CSO 006<br />
Preliminary Design<br />
Detailed Design<br />
Permitting, Land Acquistion<br />
Notice to Proceed<br />
Construction<br />
Place in Operation<br />
4. Anacostia Tunnel <strong>System</strong> 3<br />
Design<br />
Permitting, Land Acquistion<br />
Notice to Proceed<br />
Construction<br />
Place in Operation<br />
13-31<br />
5.<br />
ROCK CREEK PROJECTS<br />
Separate CSO 031, 037, 053, and<br />
058<br />
Preliminary Design<br />
Detailed Design<br />
Permitting, Land Acquistion<br />
Notice to Proceed<br />
Construction<br />
Place in Operation<br />
Legend<br />
Ongoing Program<br />
Facility <strong>Plan</strong>ning<br />
Design<br />
6.<br />
Monitoring and Regulator<br />
Improvments at CSO 033, 036, 047<br />
and 057<br />
Preliminary Design<br />
Detailed Design<br />
Permitting, Land Acquistion<br />
Notice to Proceed<br />
Construction<br />
Place in Operation<br />
Permitting, Land Acquistion<br />
Construction<br />
Notice to Proceed<br />
Permitting, Land Acquisition<br />
Construction (2)<br />
Place in Operation
District Columbia <strong>Water</strong> and <strong>Sewer</strong> Authority<br />
<strong>Combined</strong> <strong>Sewer</strong> <strong>System</strong> <strong>Long</strong> <strong>Term</strong> <strong>Control</strong> <strong>Plan</strong><br />
Figure 13-7<br />
40-Year Implementation Schedule for Projects Not in Capital Improvement Program (CIP)<br />
Schedule (Years after Approval of LTCP)<br />
No. Activity 1 2 3 4 5 6 7 8 9 10 11 12 13 14 15 16 17 18 19 20 21 22 23 24 25 26 27 28 29 30 31 32 33 34 35 36 37 38 39 40<br />
7. Piney Branch Storage Tunnel<br />
Update Facility <strong>Plan</strong><br />
Preliminary Design<br />
Detailed Design<br />
Permitting, Land Acquistion<br />
Notice to Proceed<br />
Construction<br />
Place in Operation<br />
POTOMAC RIVER<br />
PROJECTS<br />
8. Potomac Storage Tunnel<br />
Update Facility <strong>Plan</strong><br />
Preliminary Design<br />
Detailed Design<br />
Permitting, Land Acquistion<br />
Notice to Proceed<br />
Construction<br />
Place in Operation<br />
13-32<br />
9.<br />
BPWWTP PROJECTS<br />
Excess Flow Treatment<br />
Improvements<br />
Preliminary Design<br />
Detailed Design<br />
Permitting, Land Acquistion<br />
Notice to Proceed<br />
Construction<br />
Place in Operation<br />
Notes:<br />
1. Incorporate into new construction or reconstruction at WASA facilities where appropriate.<br />
2. Construction may extend beyond placing facilities in operation.<br />
3. Activities may be phased in accordance with financial, technical, legal, and institutional conditions that affect the program.<br />
\\Gh-wash\ENG 1160\LTCP\LTCP Final\[LTCP_13_Schedule.xls]15 yr
District Columbia <strong>Water</strong> and <strong>Sewer</strong> Authority<br />
<strong>Combined</strong> <strong>Sewer</strong> <strong>System</strong> <strong>Long</strong> <strong>Term</strong> <strong>Control</strong> <strong>Plan</strong><br />
Figure 13-8<br />
15-Year Implementation Schedule for Projects Not in Capital Improvement Program (CIP)<br />
Schedule (Years after Approval of LTCP)<br />
No. Activity 1 2 3 4 5 6 7 8 9 10 11 12 13 14 15 16 17 18 19 20<br />
SYSTEM WIDE<br />
1. Low Impact Redevelopment (1)<br />
By WASA 1<br />
By District<br />
2. Facility <strong>Plan</strong><br />
ANACOSTIA RIVER PROJECTS<br />
3. Separate CSO 006<br />
Preliminary Design<br />
Detailed Design<br />
Permitting, Land Acquistion<br />
Notice to Proceed<br />
Construction<br />
Place in Operation<br />
4. Anacostia Tunnel <strong>System</strong><br />
Design<br />
Permitting, Land Acquistion<br />
Notice to Proceed<br />
Construction<br />
Place in Operation<br />
Legend<br />
Ongoing Program<br />
Facility <strong>Plan</strong>ning<br />
Design<br />
Notice to Proceed<br />
Permitting, Land<br />
Construction (2)<br />
Place in Operation<br />
ROCK CREEK PROJECTS<br />
5. Separate CSO 031, 037, 053, and 058<br />
Preliminary Design<br />
Detailed Design<br />
Permitting, Land Acquistion<br />
Notice to Proceed<br />
Construction<br />
Place in Operation<br />
6.<br />
Monitoring and Regulator Improvments at<br />
CSO 033, 036, 047 and 057<br />
Preliminary Design<br />
Detailed Design<br />
Permitting, Land Acquistion<br />
Notice to Proceed<br />
Construction<br />
Place in Operation<br />
7. Piney Branch Storage Tunnel<br />
Update Facility <strong>Plan</strong><br />
Preliminary Design<br />
Detailed Design<br />
Permitting, Land Acquistion<br />
Notice to Proceed<br />
Construction<br />
Place in Operation<br />
POTOMAC RIVER PROJECTS<br />
8. Potomac Storage Tunnel<br />
Update Facility <strong>Plan</strong><br />
Preliminary Design<br />
Detailed Design<br />
Permitting, Land Acquistion<br />
Notice to Proceed<br />
Construction<br />
Place in Operation<br />
BPWWTP PROJECTS<br />
9. Excess Flow Treatment Improvements<br />
Preliminary Design<br />
Detailed Design<br />
Permitting, Land Acquistion<br />
Notice to Proceed<br />
Construction<br />
Place in Operation<br />
Notes:<br />
\\Gh-wash\ENG 1160\LTCP\LTCP Final\[LTCP_13_Schedule.xls]15 yr<br />
1. Incorporate into new construction or reconstruction at WASA facilities where appropriate.<br />
2. Construction may extend beyond placing facilities in operation.<br />
13-33
Recommended <strong>Control</strong> <strong>Plan</strong><br />
3. The BOD and TSS TMDLs for the Anacostia River as they existed in June 2002. No other<br />
TMDLs exist for District waters affected by CSOs.<br />
4. WASA’s NPDES Permit.<br />
5. Future judicial or administrative orders.<br />
6. The requirements of the 1985 Intermunicipal Agreement.<br />
7. The financial capability of WASA and the District remains equal to or better than that<br />
indicated in the financial capability assessment in the LTCP.<br />
8. WASA bond’s rating is not lower than that indicated in the financial capability assessment in<br />
the LTCP and the interest rate for bonding is not higher than that indicated in the financial<br />
capability assessment.<br />
9. All approvals, permits and land acquisitions can be obtained in the time frames shown in the<br />
implementation schedule.<br />
10. Facility <strong>Plan</strong> – at this stage, the LTCP is a concept plan. Tunnel alignments have not been<br />
selected, easements have not been obtained, facilities have not been finally sited, etc. The<br />
purpose of the facility plan is to collect additional information (such as soil borings) and to<br />
perform additional engineering (such as hydraulic design, functional design, system<br />
operational design, interaction and interface studies, configuration design, geotechnical<br />
investigations and right-of-way investigations) necessary to develop the LTCP projects in<br />
more detail so phasing and preliminary designs can be prepared. Based on the results of the<br />
investigations, and studies, the facility plan findings may require revision to time<br />
requirements and the project schedule. Subsequent changes in the findings of the Facility<br />
<strong>Plan</strong> may require additional modifications of the schedule. These are fundamental<br />
assumptions upon which the LTCP and schedule are based.<br />
11. Land is acquired or easements or rights to use the land are obtained from landowners,<br />
including the National Park Service, without unreasonable restrictions, for the following<br />
facilities:<br />
a. Anacostia River<br />
i. Alignment for the Fort Stanton Interceptor generally along the Anacostia Park<br />
road between CSO 007 and Poplar Point.<br />
ii. Site for a new Poplar Point and Tunnel Dewatering Pumping Station in the<br />
general vicinity of the existing Poplar Point Pumping Station.<br />
iii. Site for tunnel drop shaft and ancillary facilities near the existing Northeast<br />
Boundary <strong>Sewer</strong> Outfall.<br />
iv. Rights to cross under National Park Service land with the Anacostia Tunnel<br />
between:<br />
1. Northeast Boundary outfall CSO 019 and CSO 018.<br />
2. Main and O Street Pumping Station and the new Poplar Point Tunnel<br />
Dewatering Pumping Station.<br />
\\Gh-wash\eng 1160\LTCP\LTCP Final\Sec 13.doc 13-34 FINAL - July 2002
Recommended <strong>Control</strong> <strong>Plan</strong><br />
b. Potomac River<br />
i. Site for drop shaft, access shaft and tunnel in Chesapeake and Ohio Canal to<br />
intercept CSO 029.<br />
ii. Rights to cross under National Park Service land with the Potomac Tunnel in<br />
Cheaspeake and Ohio Canal Park, Rock Creek, Rock Creek Park and West<br />
Potomac Park between CSO 020 and 029<br />
iii. Rights to connect CSO 020 (Easby Point) to the Potomac Tunnel via a surface<br />
pipeline.<br />
c. Rock Creek<br />
i. Piney Branch Tunnel in the slope of land north of Piney Branch stream such<br />
that gravity dewatering of the tunnel is possible.<br />
ii. Rock Creek regulator improvements as indicated in the LTCP.<br />
iii. Outfall/pipeline to Rock Creek required for separation of the CSOs specified<br />
in the LTCP to be separated.<br />
d. Other facilities as necessary to complete the LTCP<br />
12. The National Park Service and other landowners allow temporary construction access,<br />
without unreasonable restriction, to perform investigations, surveys, and to construct the<br />
facilities at locations as identified above.<br />
13. The technical bases related to construction conditions and technology for construction of the<br />
control facilities.<br />
14. <strong>Plan</strong>s of the District or Federal governments that impact the siting, operation or other<br />
functional requirements of the control facilities.<br />
15. The actual costs of CSO control projects (based on construction bids or conditions<br />
encountered during construction which change costs) that change the financial capability<br />
bases.<br />
16. Technical, legal and institutional conditions which require more time than anticipated or<br />
planned.<br />
13.8 CSO REDUCTION VERSUS TIME<br />
It will not be necessary to wait until the completion of the entire program to realize the benefits of the<br />
LTCP. CSO reduction will occur regularly throughout implementation of the program as facilities<br />
are brought on line. Significant reductions in CSO will occur early in the program with replacement<br />
of the inflatable dams and rehabilitation of the pumping stations. Major reductions in CSO will<br />
occur when tunnel segments are made operational. Figure 13-9 shows how reductions in CSO would<br />
occur for the 40 year and 15 year implementation time frames.<br />
\\Gh-wash\eng 1160\LTCP\LTCP Final\Sec 13.doc 13-35 FINAL - July 2002
Recommended <strong>Control</strong> <strong>Plan</strong><br />
Figure 13-9: CSO Reduction vs. Time<br />
15 Yr Schedule 40 Yr Schedule<br />
CSO Overflow Volume (mg/avg yr)<br />
3,500<br />
3,000<br />
2,500<br />
2,000<br />
1,500<br />
1,000<br />
500<br />
0<br />
Anacostia<br />
Tunnel<br />
Inflatable Dams<br />
Potomac/Piney Tunnels<br />
Pump Station Rehab.<br />
Anacostia Tunnel<br />
Potomac Tunnel<br />
Piney Tunnel<br />
0 5 10 15 20 25 30 35 40<br />
Years After LTCP Approval<br />
\\Gh-wash\eng 1160\LTCP\LTCP Final\Sec 13.doc 13-36 FINAL - July 2002
<strong>Water</strong> Quality Standards Review<br />
Section 14<br />
<strong>Water</strong> Quality Standards Review<br />
14.1 INTRODUCTION<br />
USEPA policy and guidance state that the selected LTCP should provide for compliance with<br />
existing water quality standards. This same policy and guidance also provide, however, that if the<br />
preferred option in the LTCP will not result in compliance with existing water quality standards<br />
when fully implemented, and chemical, physical or economic factors appear to preclude attainment<br />
of the standards, then the data collected during LTCP development may be used to support revisions<br />
to water quality standards, “including adoption of uses that better reflect the water quality that can be<br />
achieved with an affordable level of CSO control.” [See, EPA Guidance on Implementing the <strong>Water</strong><br />
Quality-Based Provisions in the CSO <strong>Control</strong> Policy (Draft – December 20, 2000).]<br />
The recommended LTCP does not result in compliance with existing District of Columbia <strong>Water</strong><br />
quality standards under all wet weather situations because physical and economic factors appear to<br />
preclude their attainment. Therefore, as provided in Section 402 (q) of the Clean <strong>Water</strong> Act and<br />
USEPA’s CSO <strong>Control</strong> Policy, a review has been conducted to evaluate and assess the draft LTCP<br />
discharges against the District of Columbia <strong>Water</strong> Quality Standards and selected water quality<br />
conditions to support revisions to the water quality standards to better reflect water quality that can<br />
be achieved with an affordable level of CSO control.<br />
14.2 NATIONAL REGULATORY BACKGROUND<br />
In 1994, the USEPA published its CSO <strong>Control</strong> Policy (Policy). Subsequently, enactment of the Wet<br />
Weather <strong>Water</strong> Quality Act in December 2000 resulted in the CSO <strong>Control</strong> Policy being made law<br />
by incorporating the Policy into the Clean <strong>Water</strong> Act at Section 402 (q).<br />
A key principle in the Policy is the “review and revision, as appropriate, of water quality standards<br />
and their implementation procedures when developing CSO control plans to reflect site-specific<br />
impacts of CSOs”. Additionally, pursuant to subsection 402 (q) (2) of the Clean <strong>Water</strong> Act, the<br />
USEPA is developing guidance to facilitate the conduct of water quality and designated use reviews<br />
for municipal combined sewer overflow receiving waters. The guidance is still in draft form, but the<br />
information included in the working draft can be applied to the evaluation of LTCPs for control of<br />
CSO discharges.<br />
14.3 DISTRICT OF COLUMBIA WATER QUALITY STANDARDS (<strong>DC</strong>WQS)<br />
Although greatly reduced under the recommended LTCP, combined sewer overflows will be<br />
discharged to the Anacostia River, Potomac River, Rock Creek and tributaries, under certain storm<br />
conditions.<br />
\\Gh-wash\eng 1160\LTCP\LTCP Final\Sec 14.doc 14-1 FINAL - July 2002
<strong>Water</strong> Quality Standards Review<br />
These District waters have been classified on the basis of current uses and future designated uses to<br />
which the waters will be restored. The classifications are as follows:<br />
Use Classes<br />
Surface <strong>Water</strong> Current Use Designated Use<br />
Anacostia River B, C, D, E A, B, C, D, E<br />
Potomac River B, C, D, E A, B, C, D, E<br />
Rock Creek B, C, D, E A, B, C, D, E<br />
Categories of uses for the surface waters listed are as follows:<br />
Surface <strong>Water</strong><br />
A<br />
B<br />
C<br />
D<br />
E<br />
Categories of Uses Which Determine<br />
<strong>Water</strong> Quality Standards<br />
Primary contact recreation<br />
Secondary contact recreation and aquatic enjoyment<br />
Protection and propagation of fish, shellfish and wildlife<br />
Protection of human health related to consumption of fish & shellfish<br />
Navigation<br />
Principal <strong>DC</strong>WQS, which may be applicable to the evaluation of CSO discharges under the LTCP,<br />
are summarized as follows:<br />
<br />
The Director may remove a designated use, establish a partial use, or establish subcategories<br />
of a use for a particular surface water segment or body if a use attainability<br />
analysis can demonstrate that attaining the designated use is not feasible because:<br />
Naturally occurring pollutant concentrations prevent the attainments of the use;<br />
<br />
<br />
<br />
<br />
Natural, ephemeral, intermittent or low flow conditions or water levels prevent the<br />
attainment of the use, unless these conditions may be compensated for by the<br />
discharge of sufficient volume of effluent discharges without violating the District’s<br />
water conservation requirements to enable uses to be met;<br />
Human caused conditions or sources of pollution prevent the attainment of the use<br />
and cannot be remedied or would cause more environmental damage to correct than<br />
to leave in place;<br />
Dams, diversions or other types of hydrologic modifications preclude the attainment<br />
of the use, and it is not feasible to restore the water body to its original condition or,<br />
to operate such modification in a way that would result in the attainment of the use;<br />
Physical conditions related to the natural features of the water body, such as the lack<br />
of proper substrate, cover, flow, depth, pools, riffles, and the like unrelated to water<br />
quality, preclude attainment of aquatic life protection uses; or<br />
\\Gh-wash\eng 1160\LTCP\LTCP Final\Sec 14.doc 14-2 FINAL - July 2002
<strong>Water</strong> Quality Standards Review<br />
<br />
<br />
<br />
<br />
<strong>Control</strong>s more stringent than those required by sections 310(b) and 306 of the<br />
Federal Clean <strong>Water</strong> Act would result in substantial and widespread economic and<br />
social impact.<br />
A designated use specified in section 1101 may not be removed and a partial use, that<br />
involves the removal of the designated use, may not be established if:<br />
<br />
<br />
The use is actually attained in the surface water segment or body on or after<br />
November 28, 1975, unless a use requiring more stringent criteria is added, or<br />
Such uses will be attained by implementing effluent limits required under sections<br />
301(b) and 306 of the Federal Clean <strong>Water</strong> Act and by implementing cost-effective<br />
and reasonable best management practices for nonpoint source control.<br />
If a permittee requests the Director to conduct a use attainability analysis and provides a<br />
reasonable basis for the need, the Director shall:<br />
<br />
<br />
<br />
<br />
<br />
<br />
<br />
<br />
Conduct a public meeting in the watershed of the affected segment or water body to<br />
inform the public of the nature of the use change requested and the basis of the<br />
request and solicit the opinions and views of the public prior to determining whether<br />
to conduct a use attainability analysis;<br />
Inform the permittee and the public of the decision;<br />
Inform the permittee of the approximate costs of the analysis and the schedule and<br />
the permittee shall provide payment as specified by the Director for the analysis;<br />
Not allow the permittee to perform the analysis;<br />
Form an advisory group of citizens and affected parties who will meet periodically<br />
during the course of the study;<br />
Hold a public hearing concerning the preliminary finding of the use attainability<br />
analysis prior to concluding the study;<br />
Submit the analysis to the Environmental Protection Agency for review and approval,<br />
if it is determined that a modification or change in the uses of the segment or water<br />
body is justified; and<br />
Modify or remove the use in accordance with federal and District procedures for<br />
revising water quality standards upon receipt of approval by the Environmental<br />
Protection Agency.<br />
Numeric criteria include the following:<br />
\\Gh-wash\eng 1160\LTCP\LTCP Final\Sec 14.doc 14-3 FINAL - July 2002
<strong>Water</strong> Quality Standards Review<br />
Criteria for Classes<br />
Constituent A B C<br />
Bacteriological (No./100mL)<br />
Fecal Coliform<br />
(Maximum 30 day geometric mean for 5 samples)<br />
Physical<br />
Dissolved oxygen (mg/L)<br />
Minimum daily average<br />
(3 samples per 24 hours once per 8 hour)<br />
One hour minimum<br />
March through June<br />
July through February<br />
200 1,000<br />
5.0<br />
5.0<br />
4.0<br />
<br />
<br />
<br />
<br />
<br />
The surface waters of the District shall be free from substances attributable to point or<br />
nonpoint sources discharged in amounts that do any of the following:<br />
Settle to form objectionable deposits;<br />
Float as debris, scum, oil or other matter to form nuisances;<br />
Produce objectionable odor, color, taste or turbidity;<br />
<br />
<br />
<br />
Cause injury to, are toxic to or produce adverse physiological or behavioral changes<br />
in human, plants or animals;<br />
Produce undesirable aquatic life or result in the dominance of nuisance species; or<br />
Impair the biological community, which naturally occurs in the waters or depends on<br />
the waters for their survival and propagation.<br />
For the waters of the District with multiple designated uses, the most stringent standards or<br />
criteria shall govern.<br />
Class A waters shall be free of discharge of untreated sewage, litter and unmarked,<br />
submerged or partially submerged, man-made structures which would constitute a hazard to<br />
users.<br />
The aesthetic qualities of Class B waters shall be maintained. Construction, placement or<br />
moving of facilities not primarily and directly water oriented is prohibited in, on or over<br />
Class B waters unless:<br />
The facility is for the general public benefit and service, and<br />
Land based alternatives are not available.<br />
Class E waters shall be free of unmarked submerged or partially submerged man-made<br />
objects which pose a hazard to users of these waters (<strong>DC</strong> Register, 2000).<br />
Overall, the <strong>DC</strong>WQS define the designated use of the receiving waters as “fishable-swimmable”.<br />
The D.C. uses and water quality standards have been considered with regard to the performance and<br />
compliance aspects of the LTCP.<br />
\\Gh-wash\eng 1160\LTCP\LTCP Final\Sec 14.doc 14-4 FINAL - July 2002
<strong>Water</strong> Quality Standards Review<br />
14.4 SELECTED WATER QUALITY CONDITIONS<br />
<strong>Water</strong> quality standards are, in general, designed for drought or low flow conditions in receiving<br />
waters under steady state and short term conditions. <strong>Combined</strong> sewer overflows are wet weather<br />
events and are, therefore, episodic in nature and will occur over a wide range of receiving water flow<br />
conditions.<br />
The existing numeric water quality standards for dissolved oxygen and bacteria (fecal coliform) do<br />
not effectively describe the effects associated with combined sewer overflows. Other values have,<br />
therefore, been employed to evaluate CSO discharges. The existing numeric criteria and other values<br />
developed for evaluation of CSO discharges are summarized in Table 14-1:<br />
Table 14-1<br />
Evaluation Criteria for CSO Discharges<br />
Item Existing WQS CSO Evaluation Criteria<br />
Dissolved Oxygen-mg/l<br />
Minimum Daily Average 5.0 5.0<br />
One hour minimum<br />
March-June 5.0 5.0<br />
July-February 4.0 4.0<br />
Minimum Day - 2.0<br />
Fecal Coliform- #/100ml<br />
Maximum 30 day Geometric Mean 200 -<br />
Daily Average Level - 200 (1)<br />
(1) This criterion is more stringent than a 200 count geometric mean<br />
14.5 CSO CONTROL – GENERAL<br />
Extensive mathematical modeling together with economic and water quality benefit comparisons<br />
have been conducted as part of development of the LTCP. These studies show that elimination (by<br />
complete separation) of combined sewer discharges to the receiving waters is not economically<br />
feasible for the District and has numerous technical and environmental drawbacks. One of the<br />
drawbacks of complete separation is the extensive disruption associated with the construction of<br />
essentially a new sewer system in the central one-third of the District. Additionally, the water quality<br />
conditions predicted for complete separation have been shown to be less beneficial as compared to<br />
control programs based on significant reductions and treatment of combined sewer overflows.<br />
Since complete separation was found to be not cost effective and technically difficult with lower<br />
water quality benefits, the studies focused on long term controls that would reduce overflows and<br />
strike a balance between costs and benefits. The LTCP was selected as a plan that offers an effective<br />
combination of costs, benefits and environmental protection. However, although greatly reduced,<br />
\\Gh-wash\eng 1160\LTCP\LTCP Final\Sec 14.doc 14-5 FINAL - July 2002
<strong>Water</strong> Quality Standards Review<br />
CSO discharges will exist under the LTCP and water quality provisions will need to be adopted that<br />
accommodate wet weather discharges from the combined sewer system.<br />
14.6 LTCP WET WEATHER WATER QUALITY CONDITIONS<br />
<strong>Water</strong> quality conditions predicted in the receiving waters for the LTCP are summarized in Table 14-<br />
2 and Table 14-3.<br />
Table 14-2<br />
Predicted Conditions for Average Year In Receiving <strong>Water</strong>s<br />
Predicted Condition for Average Year<br />
In Receiving <strong>Water</strong>s<br />
After Completion- LTCP Anacostia River Potomac River Rock Creek<br />
1. Location Navy Yard Memorial Bridge At Zoo<br />
2. Annual Overflow Volume All Outfalls All Outfalls All Outfalls<br />
3.<br />
4.<br />
Percent Reduction 97.5% 92.5% 89.8%<br />
Fecal Coliform-Percent Time (Days)<br />
Less than 200/100ml, CSO Load Only<br />
Year Around<br />
98.1%<br />
98.9%<br />
99.7%<br />
May thru Sept.<br />
96.7%<br />
99%<br />
99.3%<br />
Dissolved Oxygen-Number Days Less<br />
Than (CSO Load Only):<br />
5.0 mg/l 0 0 (1)<br />
4.0 mg/l 0 0 (1)<br />
2.0 mg/l 0 0 (1)<br />
5.<br />
Dissolved Oxygen-Minimum Day<br />
Concentration-mg/l (CSO Load Only) 6.9 7.4 (1)<br />
(1) <strong>Water</strong> quality standards met<br />
Table 14-3<br />
LTCP Wet Weather <strong>Water</strong> Quality Conditions<br />
Predicted Condition for Average Year<br />
In Receiving <strong>Water</strong>s<br />
Item Anacostia River Potomac River Rock Creek<br />
A. Number of Annual Overflow Events<br />
1. Location Navy Yard Mem Bridge At Zoo<br />
2. No Phase I <strong>Control</strong>s 82 74 30<br />
3. After Completion, LTCP 2 4 4<br />
B. Annual Overflow Volume (mg/yr)<br />
1. Location All Outfalls All Outfalls All Outfalls<br />
2. No Phase 1 <strong>Control</strong>s 2,142 1,063 49<br />
3. After Completion LTCP 54 79 5<br />
4. Percent Reduction 97.5% 92.5% 89.8%<br />
\\Gh-wash\eng 1160\LTCP\LTCP Final\Sec 14.doc 14-6 FINAL - July 2002
<strong>Water</strong> Quality Standards Review<br />
C. Bacteria (As Fecal Coliform, No./ 100 ml)<br />
Predicted Condition for Average Year<br />
In Receiving <strong>Water</strong>s<br />
Item Anacostia River Potomac River Rock Creek<br />
1. Location Navy Yard Mem Bridge At Zoo<br />
2. No. Mos. Class A Geo. Mean (200/100 ml) exceeded<br />
<br />
<br />
All Loads (CSO, Upstream, D.C. Storm <strong>Water</strong>)<br />
No Phase I <strong>Control</strong>s 11 3 12<br />
After Completion, LTCP 5 0 12<br />
Percent Reduction 55% 100% 0%<br />
CSO Loads Only<br />
No Phase I <strong>Control</strong>s 9 0 0<br />
After Completion, LTCP 0 0 0<br />
3. No. Days 200/100 ml exceeded (Year Round)<br />
<br />
<br />
All Loads<br />
No Phase I <strong>Control</strong>s 239 142 294<br />
After Completion, LTCP 182 106 294<br />
CSO Loads Only<br />
No Phase I <strong>Control</strong>s 212 57 22<br />
After Completion, LTCP 7 4 1<br />
4. No. Days 200/100 ml Exceeded (May thru Sep)<br />
<br />
<br />
All Loads<br />
No Phase I <strong>Control</strong>s 91 64 136<br />
After Completion, LTCP 61 43 119<br />
CSO Loads Only<br />
No Phase I <strong>Control</strong>s 84 33 14<br />
After Completion, LTCP 5 3 1<br />
5. Percent Time (Days) Bacteria Less than 200/100 ml<br />
<br />
<br />
D. Dissolved Oxygen<br />
All Loads<br />
No Phase I <strong>Control</strong>s 34.5% 61.1% 19.4%<br />
After Completion, LTCP 50.1% 70.9% 19.4%<br />
CSO Loads Only<br />
No Phase I <strong>Control</strong>s 41.9% 84.4% 93.9%<br />
After Completion, LTCP 98.6% 98.9% 99.7%<br />
1. Location Navy Yard Mem.Bridge At Zoo<br />
2. No. Days Less Than 5.0 mg/L<br />
<br />
<br />
All Loads<br />
No Phase I <strong>Control</strong>s 93 0 N/A 1<br />
After Completion, LTCP 72 0 N/A<br />
CSO Loads Only<br />
No Phase I <strong>Control</strong>s 0 0 N/A<br />
After Completion, LTCP 0 0 N/A<br />
3. No. Days Less Than 4.0 mg/L<br />
<br />
All Loads<br />
No Phase I <strong>Control</strong>s 57 0 N/A<br />
After Completion, LTCP 35 0 N/A<br />
\\Gh-wash\eng 1160\LTCP\LTCP Final\Sec 14.doc 14-7 FINAL - July 2002
<strong>Water</strong> Quality Standards Review<br />
<br />
CSO Loads Only<br />
Predicted Condition for Average Year<br />
In Receiving <strong>Water</strong>s<br />
Item Anacostia River Potomac River Rock Creek<br />
No Phase I <strong>Control</strong>s 0 0 N/A<br />
After Completion, LTCP 0 0 N/A<br />
4. No. Days Less Than 2.0 mg/L<br />
<br />
<br />
All Loads<br />
No Phase I <strong>Control</strong>s 10 0 N/A<br />
After Completion, LTCP 3 0 N/A<br />
CSO Loads Only<br />
No Phase I <strong>Control</strong>s 0 0 N/A<br />
After Completion, LTCP 0 0 N/A<br />
5. Min. Day Concentration-mg/L 2<br />
<br />
<br />
All Loads<br />
No Phase I <strong>Control</strong>s 0.5 5.6 N/A<br />
After Completion, LTCP 2.5 5.6 N/A<br />
CSO Loads Only<br />
No Phase I <strong>Control</strong>s 4.9 7.3 N/A<br />
After Completion, LTCP 6.9 7.4 N/A<br />
Notes:<br />
1. Dissolved oxygen was not modeled for Rock Creek. Because of its free flowing nature, there is no evidence of dissolved<br />
oxygen problems.<br />
2. Minimum day concentration in entire three-year period (1988-1990) as predicted by the model for the hydraulic conditions<br />
occurring in those three years.<br />
Additional evaluations were made for the fecal coliform condition for the May through September<br />
period and are summarized in Table 14-4.<br />
Table 14-4<br />
Predicted Average Year LTCP Performance: Fecal Coliform – CSO Load Only<br />
LTCP Performance-CSO Load Only<br />
Number of Days Fecal Coliform Count is Predicted to<br />
Exceed 200/100 ml<br />
Receiving <strong>Water</strong> May June July August September Total<br />
Percent of Time Fecal<br />
ColiformCount Less Than<br />
200/100 ml<br />
Anacostia River at<br />
Navy Yard 1 1 2 1 0 5 96.7%<br />
Potomac River at<br />
Memorial Bridge 0 0 1 1 1 3 98.0%<br />
Rock Creek at Zoo 1 0 0 0 0 1 99.3%<br />
Because fecal coliform levels are the principal concern for Class A use of the receiving waters,<br />
evaluations have been made for conditions beyond the average year. These evaluations have been<br />
made for the actual 51-year period of record for the years 1948 through 1998. The evaluations have<br />
\\Gh-wash\eng 1160\LTCP\LTCP Final\Sec 14.doc 14-8 FINAL - July 2002
<strong>Water</strong> Quality Standards Review<br />
been based on those rainfall events that are predicted to exceed the capacity of the Final LTCP and<br />
result in the occurrence of an overflow from the combined sewer system. The data have been<br />
summarized for the impacts from CSO loads only in Table 14-5.<br />
Table 14-5<br />
Predictions for 51-Year Period of Record (1948-1998)<br />
Predicted Condition in Receiving <strong>Water</strong> For 51-Year Record<br />
Rock Creek<br />
Item Anacostia River Potomac River (Piney Branch only)<br />
Total Number of Rainfall Events<br />
Resulting in a CSO 118 188 75<br />
Average Number of CSOs per Year 2.31 3.69 1.47<br />
Percent of Time <strong>Water</strong>s are Free From:<br />
A CSO Occurrence 99.4 % 99.0 % 99.6 %<br />
A Fecal Coliform Level Greater Than<br />
200/100ml 1 98.1 % 98.0 % 99.6 %<br />
Notes:<br />
1. Based on CSOs causing fecal coliform levels to exceed 200/100 ml the following number of days on<br />
average for each occurrence: Anacostia –3 days, Potomac – 2 days, Rock Creek – 1 day.<br />
The findings from the foregoing analyses of water quality conditions in the receiving waters for the<br />
LTCP have been summarized as follows:<br />
<br />
<br />
<br />
<br />
For CSO loads only in the average year and in accordance with the CSO Policy, the<br />
remaining overflows after implementation of the Final LTCP will meet the D.C. numerical<br />
water quality standards in all receiving waters.<br />
The D.C. standards at 1104.3 prohibit “discharges of untreated sewage”. CSOs that remain<br />
after implementation of the LTCP will all have received some degree of treatment prior to<br />
discharge to the receiving waters. Generally, the treatment will be in the form of solid and<br />
floatables control. Under these conditions, the remaining CSOs would not be untreated and<br />
therefore, should meet the narrative D.C. water quality standards in all receiving waters.<br />
After implementation of the Final LTCP, all receiving waters are predicted to be free from<br />
average daily levels of fecal coliform (due to CSOs) greater than 200/100 ml between 98 and<br />
99 percent of the time.<br />
Other pollution sources in the watersheds will have to be reduced to produce the same water<br />
quality improvements provided by the Final LTCP.<br />
The findings show that the Final LTCP can meet the D.C water quality standards in accordance<br />
with the CSO Policy. The findings also show that on average, and based on the 51 year record of<br />
rainfall events, the LTCP would be protective of the beneficial uses of the receiving waters.<br />
Because fecal coliform levels due to CSOs are predicted to be greater than 200/100 ml about 1 to<br />
\\Gh-wash\eng 1160\LTCP\LTCP Final\Sec 14.doc 14-9 FINAL - July 2002
<strong>Water</strong> Quality Standards Review<br />
two percent of the time, there would be minimal disruption from CSOs to public use of the<br />
waters for full body contact.<br />
Additionally, the findings show that pollution sources other than discharges from the combined<br />
sewer system cause impairment to the receiving waters. The other pollution sources in the watershed<br />
include separate storm water systems and nonpoint source discharges. These watershed-wide sources<br />
would have to be substantially reduced to reach the equivalent degree of protection that can be<br />
achieved by WASA’s LTCP. The sources of the contaminants that comprise the other pollution<br />
sources have not been completely identified or documented.<br />
Cost effective and reliable technical programs to effectively reduce the impact of the other pollution<br />
sources may not be available for the foreseeable future. Besides the technical uncertainties of<br />
reduction of the other pollution sources, a significant component of these sources originate in<br />
political jurisdictions outside the District. Given the history and experience of dealing with diverse<br />
pollution sources and other political jurisdictions, the results of future efforts to control these sources<br />
cannot be predicted with any degree of certainty. The CSO studies have shown that the benefits of<br />
the Final LTCP are reliable and implementable. As WASA and the District develop provisions to<br />
implement the LTCP, consideration should be given to formation of a watershed based forum to<br />
reduce the other pollution sources.<br />
In view of the complex and technically difficult situation regarding control of diverse and<br />
undocumented pollution sources, consistent “fishable and swimmable” water quality conditions for<br />
District waters receiving CSO discharges may not be achievable, particularly during wet weather.<br />
Certainly, the studies show that the LTCP will be a fundamental component to an eventual watershed<br />
solution. As a component of an ultimate watershed solution, the LTCP will control CSO discharges<br />
in the three receiving waters for the average year to:<br />
<br />
<br />
<br />
Reduce the annual volume of uncontrolled CSO discharges by approximately 96 percent,<br />
Meet the D.C. narrative and numeric water quality standards; and<br />
Reduce the exceedance of a 200 per 100ml fecal coliform count to no more than about 3% of<br />
the time during the recreational season (May thru September) due to CSOs alone, if no other<br />
loads were present,<br />
Under the conditions that are predicted for the LTCP, the District’s use of “fishable-swimmable” for<br />
its waters should not need to be revised. As with many public use waters (beaches, streams), there<br />
are situations which render such waters unavailable to the public at certain times and locations. Such<br />
situations may include:<br />
\\Gh-wash\eng 1160\LTCP\LTCP Final\Sec 14.doc 14-10 FINAL - July 2002
<strong>Water</strong> Quality Standards Review<br />
<br />
<br />
<br />
<br />
<br />
Unsafe high surf at an ocean beach<br />
Storms or temperature conditions<br />
Low flow or exposed rocks<br />
High flow (raging waters) conditions<br />
Nuisance aquatic life<br />
Based on examination of the 51-year record, some of the natural conditions such as stormy weather<br />
would be expected to occur at the same time as CSOs. Overall, therefore, CSOs would not always<br />
add to those situations when waters might not be available for full body contact.<br />
In any case, the LTCP would provide the foundation to work towards “fishable-swimmable”<br />
conditions. To such an end, the LTCP would accomplish the following:<br />
<br />
<br />
A situation whereby the “fishable” component of the “fishable-swimmable” use designation<br />
would be achieved. In this regard, fishing could be practiced whether or not a CSO discharge<br />
was occurring.<br />
A situation wherein full body contact might not be available at all times. However, there<br />
would be few occurrences throughout the warm weather recreational period when the public<br />
might occasionally be precluded from full body contact by CSO discharges.<br />
WASA has developed a comprehensive CSO <strong>Control</strong> LTCP that can serve as a foundation for<br />
“fishable-swimmable” conditions in District waters which minimize the periods when full body<br />
contact should be avoided without inconveniencing the public use. <strong>Control</strong>s for other pollution<br />
sources would also be needed to support the protection that can be achieved under the LTCP.<br />
14.7 WET WEATHER DISCHARGE CONDITIONS<br />
WASA has developed a LTCP that supports public use of District waters receiving CSO discharges.<br />
Substantial financial commitments will be required by District ratepayers and by those providing<br />
financial assistance in support of LTCP implementation.<br />
Wet weather discharge provisions need to be provided to accommodate LTCP implementation. The<br />
wet weather discharge provisions need to recognize that there will be CSOs when the capacity of the<br />
LTCP control facilities is exceeded.<br />
WASA has been in discussions with the D.C. Department of Health and EPA regarding the nature of<br />
such provisions. The discussions have not been finalized and alternative approaches are still being<br />
considered. Under some approaches, the LTCP would be accommodated without changing the water<br />
quality standards. These approaches may involve the interpretation by regulatory agencies that the<br />
\\Gh-wash\eng 1160\LTCP\LTCP Final\Sec 14.doc 14-11 FINAL - July 2002
<strong>Water</strong> Quality Standards Review<br />
proposed LTCP meets the current water quality standards. Such an interpretation could be made in<br />
the regulatory agencies’ approval of the LTCP.<br />
Other approaches under consideration involve incorporating provisions in the water quality standards<br />
to accommodate the remaining discharges after the capacity of the LTCP is exceeded. Such<br />
approaches may require a use attainability analysis (UAA) and/or modification or additions to the<br />
uses in the water quality standards. If revision of the standards is required, the following elements or<br />
conditions should be considered for incorporation into the water quality standards:<br />
<br />
<br />
<br />
<br />
The capacity of the LTCP facilities has been developed based on a specific storm in the<br />
period of record that has its own unique total precipitation, duration, intensity and spatial<br />
distribution.<br />
The capacity of facilities that transfer flow from the combined sewers to storage or treatment,<br />
the storage facilities and treatment facilities have all been based on this storm and its<br />
characteristics. The WQS need to recognize that because of the variability of climate<br />
condition, an overflow could occur because the capacity of one or a combination of the<br />
elements of the control facilities has been exceeded.<br />
The WQS now have a low stream flow limit for application of the criteria. It would be<br />
appropriate for the wet weather provisions to establish an upper limit for application of the<br />
criteria.<br />
The upper limit for application of the criteria should be the capacity of the LTCP based on<br />
the flow rates derived from the storm used to establish the capacity of the various elements of<br />
the plan (e.g. transfer or conveyance, storage, and treatment).<br />
Because there is a great deal of natural variability in climate conditions that can cause the capacity of<br />
one or a combination of elements of the LTCP to be exceeded, it does not appear feasible to fix an<br />
upper limit for application of the WQS to a single flow condition (e.g. the seven day ten year low<br />
flow, 7Q10 used as the low stream flow limit for application of the standards). For the combined<br />
sewer system, the LTCP describes the upper limit because it is the document that translates the storm<br />
condition to flow conditions that would limit the application of the WQS. In view of these unique<br />
circumstances, the practicable approach would be to incorporate the LTCP into the WQS.<br />
A potential approach for modifying the District’s WQS for the LTCP based on the foregoing would<br />
be as follows:<br />
District WQS at subsection 1105.6, Delete, and replace with the following:<br />
1105.6 The narrative and numeric criteria at 1104 shall not apply to CSO overflows<br />
occurring consistent with a <strong>Long</strong> <strong>Term</strong> <strong>Control</strong> <strong>Plan</strong> approved for implementation by<br />
EPA and the Director.<br />
\\Gh-wash\eng 1160\LTCP\LTCP Final\Sec 14.doc 14-12 FINAL - July 2002
<strong>Water</strong> Quality Standards Review<br />
District WQS at subsection 1199.1, (Definitions) add<br />
LTCP or <strong>Long</strong> <strong>Term</strong> <strong>Control</strong> <strong>Plan</strong>. A plan for control of combined sewer overflows<br />
prepared pursuant to the CSO <strong>Control</strong> Policy at Section 402 (q) of the Federal Clean<br />
<strong>Water</strong> Act and approved for implementation by the Director and EPA.<br />
The foregoing may be a departure from the traditional approach for identifying flow conditions<br />
applicable to criteria. It does, however, deal with the climatic variabilities and flow complexities<br />
inherent in CSO control and would establish straightforward methods for measuring performance.<br />
Such methods have been developed and are described in Section 15.<br />
Other states (California, Massachusetts) have adopted approaches for incorporating control plans as<br />
part of standards applications and the above suggestion for the District’s standards would not be<br />
inconsistent with those approaches. Additionally, the suggested provisions provide a basis for future<br />
modifications that may be needed based on review of plan performance or the promulgation of new<br />
criteria.<br />
\\Gh-wash\eng 1160\LTCP\LTCP Final\Sec 14.doc 14-13 FINAL - July 2002
Section 15<br />
Post Construction Monitoring<br />
Post Construction Monitoring<br />
15.1 INTRODUCTION<br />
This section describes the post construction monitoring program that would be used to monitor the<br />
effectiveness of the long-term CSO controls and establishes NPDES permit conditions for measuring<br />
compliance. The CSO Policy requires that a post construction water quality monitoring program be<br />
developed to ascertain the effectiveness of CSO controls and to verify compliance with water quality<br />
standards and protection of designated uses. The monitoring program described in this section will<br />
utilize existing monitoring programs and will supplement these to determine the performance of the<br />
selected CSO controls and their effects on water quality.<br />
15.2 OVERVIEW OF APPROACH<br />
The LTCP has demonstrated that, under existing conditions, bacteria water quality standards will not<br />
be achieved most of the time in each receiving water, even if CSOs did not exist. This is due to<br />
upstream and storm water pollutant loads. Unless there are dramatic changes in the other pollutant<br />
loads, the post construction monitoring program will not be able to demonstrate that water quality<br />
standards will be met after the LTCP is in place. For example, the models predict that with the CSO<br />
controls in place, the fecal coliform count will exceed 200 MPN/100ml more than 180 days per year<br />
in the Anacostia due to other pollutant loads. Instead, the post construction monitoring will be able<br />
to demonstrate that CSOs are reduced to the levels predicted for the recommended LTCP. This<br />
reduction in the occurrence of CSOs is the most tangible measure of system performance. In terms<br />
of water quality, the post construction monitoring will be able to demonstrate that concentrations of<br />
bacteria are greatly reduced.<br />
It is important to note that assessing compliance can be difficult. In accordance with the CSO Policy,<br />
the LTCP was developed based on “average year” conditions. Rainfall varies substantially from year<br />
to year and from storm to storm. It may be difficult to compare one year’s rainfall conditions to the<br />
average year to assess performance. The same is true for receiving water monitoring where the<br />
variables include other pollutant sources that are also driven by wet weather conditions. For these<br />
reasons, considerable judgment must be employed when assessing results.<br />
In addition to field monitoring, the combined sewer system and receiving water models will continue<br />
to be used to analyze results. This will be useful in relating measured conditions to the average year<br />
performance levels predicted in the LTCP.<br />
In the LTCP, there are two milestones where there will be significant reduction in CSO to the<br />
receiving waters. The first is the completion of the replacement of the inflatable dams and the<br />
rehabilitation of the pumping stations. These activities are projected to reduce CSO overflow volume<br />
\\Gh-wash\ENG 1160\LTCP\LTCP Final\Sec 15.doc 15-1 FINAL - July 2002
Post Construction Monitoring<br />
by about 40% on a system-wide basis. The next major milestone is the completion of the storage<br />
tunnels, which will provide the largest reduction in CSO overflow volumes. The post construction<br />
monitoring program has thus been divided into phases to allow assessment of the benefits of each<br />
milestone.<br />
The various phases are described in the following subsections and summarized as follows:<br />
<br />
Phase 1 Monitoring – After Inflatable Dams and Pumping Station Rehabilitation. This<br />
program will be conducted for a period of one year after rehabilitation projects are placed in<br />
operation in each receiving water (Anacostia and Potomac Rivers).<br />
<br />
Phase 2 Monitoring – After Tunnel Construction. This program will be conducted for a<br />
period of one year after tunnels are placed in operation in each receiving water (Anacostia,<br />
and Potomac Rivers and Rock Creek).<br />
<br />
Phase 3 Monitoring – This program will be conducted once every 5 years for each receiving<br />
water (Anacostia and Potomac Rivers and Rock Creek) after all control facilities have been<br />
placed in operation.<br />
<br />
NPDES Permit Compliance Monitoring – This program would be part of permit conditions<br />
for measuring compliance of the LTCP.<br />
15.3 EXISTING DATA SOURCES<br />
Several ongoing receiving water quality monitoring programs can provide data to assess compliance.<br />
The agencies that support monitoring are as follows:<br />
<br />
<br />
<br />
<br />
Metropolitan Washington Council of Governments<br />
D.C. Department of Health, Environmental Health Administration, <strong>Water</strong> Quality Division<br />
Maryland Department of Natural Resources<br />
National Park Service<br />
The monitoring conducted by these agencies is described below.<br />
<br />
Metropolitan Washington Council of Governments (MWCOG) - MWCOG supports a<br />
Regional Monitoring Subcommittee (RMS) that coordinates the local monitoring efforts of<br />
federal, state, and local government agencies in Maryland, Virginia, and the District of<br />
Columbia. MWCOG maintains a centralized database and performs processing, analysis, and<br />
\\Gh-wash\ENG 1160\LTCP\LTCP Final\Sec 15.doc 15-2 FINAL - July 2002
Post Construction Monitoring<br />
disbursement of ambient monitoring data. MWCOG also conducts two monitoring efforts<br />
that provide data that will be important to assessing compliance. These are as follows:<br />
o Monitors at Benning Road and Seafarer’s Marina stations on the Anacostia River that<br />
record dissolved oxygen, temperature, conductivity, alkalinity, pH, date, and time at<br />
30 minute intervals.<br />
o Fall Line monitoring at Chain Bridge on the Potomac River, which has been<br />
supported by MWCOG since the early 1980s. Because the bridge is located<br />
approximately at the fall line and head of tide, the measurements are indicative of the<br />
quality and quantity of upstream inputs into the estuary. Grab samples are taken on a<br />
weekly basis and more often during storm events. The automated sampler measures<br />
river stage. When the river level is high, the samples are taken at timed intervals until<br />
the water level recedes. This wet-weather sampling is done to characterize the loads<br />
when they are expected to be the highest. Samples from the Chain Bridge Station are<br />
tested for many parameters, including: temperature, DO, pH, conductivity, TSS,<br />
turbidity, dissolved organic carbon, TKN, ammonia, alkalinity, BOD, fecal coliform,<br />
total coliform, chlorophyll, alkalinity, and hardness.<br />
<br />
<strong>DC</strong> Department of Health - The <strong>DC</strong> Department of Health (DOH), <strong>Water</strong> Quality Monitoring<br />
Branch (WQMB) monitors a total of 80 surface water stations. Of these, 29 stations are on<br />
the Anacostia River; 28 stations are on the Potomac River; and the remaining 23 stations are<br />
on Rock Creek, the C&O Canal, the Washington Ship Channel, the Tidal Basin, Kingman<br />
Lake, and other small streams and surface waters throughout the District. The physical<br />
parameters measured at all stations are temperature, DO, pH, and conductivity. Chemical<br />
analysis is performed on samples from 26 of the stations (7 on the Potomac, 10 on the<br />
Anacostia, 3 on Watts Branch, 2 on Rock Creek, 2 on the C&O Canal, and 2 on Kingman<br />
Lake). The water chemistry parameters include TSS, turbidity, dissolved organic carbon,<br />
TKN, ammonia, nitrate, nitrite, total and soluble phosphorus, orthophosphorus, silica,<br />
alkalinity, BOD-5, fecal coliform, chlorophyll, alkalinity, and hardness. Metals tests include<br />
arsenic, cadmium, chromium, copper, iron, mercury, lead, selenium, and zinc.<br />
Sampling is typically conducted once per month. Four samples per year at water chemistry<br />
stations are tested for heavy metals. The regular sampling program is supplemented by rapid<br />
bioassessments, fish tissue samples, and sediment surveys.<br />
DOH also installed a continuous DO monitor in the Anacostia River on the CONRAIL<br />
Bridge in 1997.<br />
\\Gh-wash\ENG 1160\LTCP\LTCP Final\Sec 15.doc 15-3 FINAL - July 2002
Post Construction Monitoring<br />
<br />
Maryland Department of Natural Resources (MDNR) - The MDNR conducts monitoring on<br />
the Anacostia near Bladensburg, MD at the head of tide on a monthly basis. MDNR also<br />
conducts biological sampling in the Anacostia once every three years.<br />
<br />
National Park Service (NPS) - The NPS conducts routine monitoring and special surveys on<br />
the Anacostia and Potomac Rivers. In the Anacostia River the NPS monitoring includes<br />
stations in and adjacent to Kenilworth Marsh and Kingman Lake, a backwater of the tidal<br />
Anacostia River.<br />
Since compliance monitoring under an NPDES permit may occur many years after approval of the<br />
LTCP, the availability and scope of existing monitoring sources will be ascertained prior<br />
implementation of the actual monitoring program.<br />
15.4 PHASE 1 MONITORING – AFTER INFLATABLE DAMS AND PUMPING<br />
STATION REHABILITATION<br />
The goal of the Phase 1 monitoring is to confirm the reduction in CSO due to the replacement of the<br />
inflatable dams and the pumping station rehabilitations. The proposed monitoring program will<br />
consist of rainfall monitoring, CSO overflow monitoring and sampling. Receiving water monitoring<br />
performed by the D.C. Department of Health will be used to assess water quality benefits. The<br />
proposed system monitoring is summarized in Table 15-1. No monitoring is proposed in Rock Creek<br />
because the inflatable dams and pumping station rehabilitation are not predicted to have a measurable<br />
effect on these CSOs.<br />
Table 15-1<br />
Phase 1 Monitoring<br />
Monitoring Type Anacostia River Potomac River Rock Creek Frequency<br />
Rain Fall Monitoring 1 gage in Northeast 1 gage in Slash Run -- Continuous<br />
Boundary<br />
1 gage in Tiber Creek<br />
CSO Overflow<br />
Monitoring (Flow and<br />
Volume)<br />
-- Continuous<br />
CSO Overflow<br />
Sampling<br />
Receiving water<br />
Monitoring-<br />
Dissolved Oxygen<br />
Receiving <strong>Water</strong><br />
Monitoring- Bacteria,<br />
Field Parameters<br />
Northeast Boundary<br />
CSO 019<br />
B ST/ NJ Ave Pumped<br />
Overflow CSO 010<br />
1 sampling station at<br />
Northeast Boundary<br />
<br />
<br />
D.O. monitors operated<br />
by DOH<br />
Use data from other<br />
existing programs<br />
Potomac Pumping<br />
Station CSO 021<br />
West Rock Creek<br />
Diversion <strong>Sewer</strong> CSO<br />
023/024<br />
-- -- 4 storms per<br />
year<br />
Approx 1 hour<br />
sample interval<br />
for each storm<br />
D.O. monitors operated<br />
by DOH<br />
Use data from other<br />
existing programs<br />
-- Approx 30<br />
minute<br />
intervals<br />
-- Frequency of<br />
existing<br />
programs<br />
\\Gh-wash\ENG 1160\LTCP\LTCP Final\Sec 15.doc 15-4 FINAL - July 2002
Post Construction Monitoring<br />
Rainfall and flow monitoring will be conducted for 12 months. The sampling at Northeast Boundary<br />
will be conducted at the influent to the Northeast Boundary Swirl Facility. Sampling data will be<br />
collected up to a maximum of 4 storms, with samples collected at approximately 1 hour intervals<br />
during each storm. The sampling will be tailored to capture the first flush of the discharge. CSO<br />
samples will be analyzed for fecal coliform, enterococci, CBOD5 and TSS.<br />
15.5 PHASE 2 MONITORING – AFTER TUNNEL CONSTRUCTION<br />
Phase 2 monitoring will be conducted after tunnel construction. The monitoring program would<br />
comprise elements as follows:<br />
Rainfall monitoring<br />
<br />
<br />
<br />
<br />
Flow monitoring:<br />
o At representative CSO overflows on each receiving water system.<br />
o At representative facilities that transfer flow from CSO outfalls to storage.<br />
Periodic sampling at representative CSO overflows<br />
A system to measure the degree to which storage facilities are filled.<br />
A receiving water monitoring program to obtain information on water quality. This program<br />
would be structured similar to that employed to obtain information for the LTCP.<br />
Table 15-2 summarizes proposed monitoring locations and frequencies.<br />
Table 15-2<br />
Phase 2 Monitoring<br />
Monitoring Type Anacostia River Potomac River Rock Creek Frequency<br />
Rain Fall Monitoring 1 gage in Northeast<br />
Boundary<br />
1 gage in Tiber Creek<br />
1 gage in Slash<br />
Run<br />
1 gage in College<br />
Pond<br />
1 gage in Piney<br />
Branch<br />
Continuous<br />
CSO Overflow<br />
Monitoring and<br />
Diversion to Storage<br />
Monitoring<br />
Tunnel Storage Level<br />
Monitoring<br />
CSO Overflow<br />
Sampling<br />
Receiving water<br />
Monitoring- Dissolved<br />
Oxygen<br />
Receiving <strong>Water</strong><br />
Monitoring- Bacteria,<br />
Field Parameters<br />
Northeast Boundary<br />
CSO 019<br />
Fort Stanton CSO 007<br />
B ST/ NJ Ave Pumped<br />
Overflow CSO 010<br />
Potomac Pumping<br />
Station CSO 021<br />
College Pond CSO<br />
029<br />
Piney Branch<br />
CSO 049<br />
Continuous<br />
1 sensor in Tunnel 1 sensor in Tunnel 1 sensor in<br />
Tunnel<br />
Continuous<br />
1 sampling station at 1 sampling station<br />
-- 4 storms per year<br />
Northeast Boundary at CSO 021<br />
Approx 1 hour<br />
sample interval<br />
for each storm<br />
Continuous D.O.<br />
monitors operated by<br />
others<br />
Continuous D.O.<br />
monitors operated<br />
by others<br />
Approx. 6 locations Approx. 3<br />
locations<br />
Approx. 7<br />
locations<br />
-- Approx 30<br />
minute intervals<br />
Once per week<br />
\\Gh-wash\ENG 1160\LTCP\LTCP Final\Sec 15.doc 15-5 FINAL - July 2002
Post Construction Monitoring<br />
CSO overflow samples will be collected up to a maximum of 4 storms per year, with samples<br />
collected at approximately 1 hour intervals during each storm. The sampling will be tailored to<br />
capture the first flush of the discharge. CSO samples will be analyzed for fecal coliform,<br />
enterococci, CBOD5 and TSS.<br />
In order to assess performance, the CSO sampling and the receiving water monitoring are proposed<br />
to be conducted for 12 months. Depending on the results, periodic CSO sampling and receiving<br />
water monitoring may be recommended to confirm performance. The Phase 2 monitoring may be<br />
conducted at different times on each receiving water to coincide with the phased implementation of<br />
controls in each receiving water.<br />
After the Phase 2 assessment, long term compliance monitoring would consist of flow monitoring<br />
representative CSO overflows and CSO diversion rates to storage, and measuring storage levels in<br />
the tunnel. It is anticipated that these monitoring provisions would become part of NPDES permit<br />
conditions, which are described in the following section.<br />
15.6 PHASE 3 MONITORING<br />
After the control facilities are in operation and after the Phase 2 performance evaluation has been<br />
conducted, Phase 3 monitoring will be conducted every 5 years. The purpose of the monitoring will<br />
be to identify any changes in control system performance, any changes in the nature of CSO<br />
discharges and in receiving water conditions and impacts.<br />
As part of the NPDES compliance monitoring described below, CSO overflow volume, CSO<br />
diversion rates into the tunnel and tunnel level will be regularly monitored. Phase 3 monitoring will<br />
supplement this with the collection of samples of CSO overflow at representative overflows, and<br />
assessment of water quality impacts in the receiving water. Receiving water monitoring data<br />
collected by others such as the Department of Health will be used in conjunction with the models to<br />
assess receiving water conditions. Table 15-3 summarizes the monitoring.<br />
\\Gh-wash\ENG 1160\LTCP\LTCP Final\Sec 15.doc 15-6 FINAL - July 2002
Table 15-3<br />
Phase 3 Monitoring<br />
Post Construction Monitoring<br />
Monitoring Type Anacostia River Potomac River Rock Creek Frequency<br />
Rain Fall Monitoring 1 gage in Northeast<br />
Boundary<br />
1 gage in Tiber Creek<br />
1 gage in Slash<br />
Run<br />
1 gage in College<br />
Pond<br />
1 gage in Piney<br />
Branch<br />
Continuous<br />
CSO Overflow<br />
Monitoring and<br />
Diversion to Storage<br />
Monitoring<br />
Tunnel Storage Level<br />
Monitoring<br />
CSO Overflow<br />
Sampling<br />
Receiving water<br />
Monitoring- Dissolved<br />
Oxygen<br />
Receiving <strong>Water</strong><br />
Monitoring- Bacteria,<br />
Field Parameters<br />
Northeast Boundary<br />
CSO 019<br />
Fort Stanton CSO 007<br />
B ST/ NJ Ave Pumped<br />
Overflow CSO 010<br />
Potomac Pumping<br />
Station CSO 021<br />
College Pond CSO<br />
029<br />
Piney Branch<br />
CSO 049<br />
Continuous<br />
1 sensor in Tunnel 1 sensor in Tunnel 1 sensor in<br />
Tunnel<br />
Continuous<br />
1 sampling station at 1 sampling station<br />
-- 4 storms per year<br />
Northeast Boundary at CSO 021<br />
Approx 1 hour<br />
sample interval<br />
<br />
<br />
D.O. monitors<br />
operated by DOH<br />
Use data from other<br />
existing programs<br />
D.O. monitors<br />
operated by DOH<br />
Use data from<br />
other existing<br />
programs<br />
for each storm<br />
-- Approx 30<br />
minute intervals<br />
-- Frequency of<br />
existing<br />
programs<br />
Phase 3 monitoring will be conducted for 12 months.<br />
15.7 NPDES PERMIT CONDITIONS<br />
Because the operation of the District’s combined sewer system is addressed in NPDES Permit No.<br />
<strong>DC</strong>0021199, permit conditions will need to be developed to monitor and measure compliance based<br />
on operation of the LTCP. A potential framework for defining an acceptable level of performance<br />
and permit compliance would contain the requirements such that the CSO control system would be in<br />
compliance when:<br />
<br />
<br />
<br />
Transfer facilities from CSO outfalls to storage are conveying flow up to prescribed rates.<br />
An outfall is not discharging when its associated storage facility is not filled to capacity and<br />
the transfer facility is conveying flow up to prescribed rates.<br />
The BPWWTP is operating at prescribed treatment rates and capacities.<br />
An outline of permit conditions is as follows:<br />
<br />
Discharges from permitted individual combined sewer system outfalls are prohibited except<br />
during wet weather events when:<br />
o The associated combined sewer overflow storage facilities are filled to capacity:<br />
\\Gh-wash\ENG 1160\LTCP\LTCP Final\Sec 15.doc 15-7 FINAL - July 2002
Post Construction Monitoring<br />
<br />
<br />
o <strong>Combined</strong> sewer flow is being transferred from the individual outfall to the<br />
appropriate storage facility at prescribed rates; and<br />
o The associated wastewater pumping stations are operating at their maximum practical<br />
capacity; and<br />
o The Blue Plains Wastewater Treatment <strong>Plan</strong>t (BPWWTP) is providing treatment for<br />
flows conveyed to the plant as specified below.<br />
<strong>Combined</strong> sewer overflow storage capacity shall be not less than the following:<br />
o Anacostia River <strong>System</strong> – 126 million gallons.<br />
o Potomac River <strong>System</strong> – 58 million gallons.<br />
o Piney Branch Storage Tunnel – 9.5 million gallons<br />
Transfer rates from combined sewer outfalls to storage facilities shall be not less than the<br />
rates listed in Table 15-4<br />
Table 15-4<br />
Minimum Diversion Capacities to Storage for Recommended LTCP<br />
Minimum Diversion<br />
Capacity Required for<br />
CSO Outfall<br />
Drainage Area<br />
CSO <strong>Control</strong>(mgd)<br />
Anacostia CSOs<br />
005 Fort Stanton 37<br />
006 Fort Stanton Proposed to be separated<br />
007 Fort Stanton 111<br />
009 Canal Street 36<br />
010 B St./N.J. Ave 690<br />
011 B St./N.J. Ave 460<br />
012 Tiber Creek 471<br />
013 Canal Street <strong>Sewer</strong> 18<br />
014 Navy Yard/M St.: 6 th St – 7 th St 92<br />
015 Navy Yard/9 th St-M St. 11<br />
016 1 Navy Yard/M St.: 12 th St.– 9 th St. 86<br />
017 1 Navy Yard/M St.: 14 th to Penn Ave. 65<br />
018 1 Barney Circle 57<br />
019 Northeast Boundary 1,460<br />
Potomac CSOs<br />
020 Easby Point 297<br />
021 Slash Run 530<br />
022 I St.- 22 nd St., NW 333<br />
023/24 1 West of Rock Creek Diversion <strong>Sewer</strong> 66<br />
025 1 31 st & K St NW 3<br />
026 1 <strong>Water</strong> St District (WRC) 0<br />
027 1 Georgetown 92<br />
028 1 37 th St-Georgetown 9<br />
\\Gh-wash\ENG 1160\LTCP\LTCP Final\Sec 15.doc 15-8 FINAL - July 2002
Post Construction Monitoring<br />
CSO Outfall<br />
Drainage Area<br />
Minimum Diversion<br />
Capacity Required for<br />
CSO <strong>Control</strong>(mgd)<br />
029 College Pond 133<br />
Rock Creek CSOs<br />
049 Piney Branch 468<br />
Note:<br />
1. These outfalls are proposed to be consolidated. The diversion capacity indicated is that required for<br />
CSO control. For consolidation, the full capacity of the outfall and/or drainage area must be<br />
conveyed to and relieved from the tunnel to prevent flooding. This diversion rate will be confirmed<br />
during the detailed design stage.<br />
<br />
<br />
<br />
<br />
Excess flow treatment at the BPWWTP means treatment of plant influent flows comprising<br />
screening, grit removal, primary clarification in the east primary facilities, followed by<br />
chlorination and dechlorination with discharge from outfall 001. The maximum capacity of<br />
excess flow treatment is 336 mgd.<br />
Complete treatment means passage of plant influent and recycle flows through any<br />
combination of conveyance and treatment facilities downstream of primary sedimentation<br />
that ultimately discharges effluent from Outfall 002.<br />
During wet weather conditions the BPWWTP shall treat at rates not less than those indicated<br />
below:<br />
o First four hours: Up to 1,076 mgd, with the first 740 mgd receiving complete<br />
treatment and up to 336 mgd receiving excess flow treatment.<br />
o Next 20 hours: Up to 847 mgd, with the first 511 mgd receiving complete treatment,<br />
and up to 336 mgd receiving excess flow treatment.<br />
o Thereafter: Up to 786 mgd, with the first 450 mgd receiving complete treatment, and<br />
up to 336 mgd receiving excess flow treatment.<br />
All combined sewer storage on the Anacostia River, Potomac River and Rock Creek systems<br />
shall be emptied within 59 hours following the cessation of a wet weather event. If a wet<br />
weather event occurs within 59 hours of the end of one event, the cessation period shall start<br />
from the end of the last event. All flow stored in the storage systems shall receive treatment<br />
at the BPWWTP.<br />
An schematic of the monitoring system is shown on Figure 15-1.<br />
\\Gh-wash\ENG 1160\LTCP\LTCP Final\Sec 15.doc 15-9 FINAL - July 2002
Post Construction Monitoring<br />
Existing<br />
<strong>Combined</strong><br />
<strong>Sewer</strong><br />
Existing Dry<br />
Weather Interceptor<br />
New CSO<br />
Diversion<br />
Structure<br />
New<br />
Meter<br />
(Typ)<br />
Exist.<br />
CSO<br />
Outfall<br />
“A”<br />
Receiving<br />
<strong>Water</strong><br />
M<br />
Existing CSO<br />
Regulator<br />
“B”<br />
M<br />
“E” MGD<br />
Max Rate<br />
“F”<br />
MGD,<br />
Max Rate<br />
Blue Plains<br />
WWTP<br />
De-waters<br />
Storage in<br />
“D” hrs<br />
CSO<br />
Storage<br />
Facility<br />
(Tunnel)<br />
Pumping<br />
Station<br />
“G” MGD,<br />
Max Rate<br />
“C”<br />
Flow through meter at “A”<br />
must be zero at all times<br />
during a wet weather event<br />
except when:<br />
<br />
<br />
<br />
Flow rate through<br />
meter at “B” reaches<br />
a prescribed rate; or<br />
Sensor at “C” shows<br />
that storage is full;<br />
and<br />
BPWWTP is being<br />
operated at<br />
prescribed capacity<br />
Complete<br />
Treatment<br />
Excess Flow<br />
Treatment<br />
Outfall<br />
002<br />
Outfall<br />
001<br />
Figure 15-1<br />
LTCP Monitoring Approach<br />
15.8 PUBLIC NOTIFICATION<br />
In order to advise the affected public of overflows, a visual notification system will be installed at<br />
three or four locations on each receiving water at public access locations. This system would serve<br />
to notify the public of the occurrence of overflows based on the flow monitoring at the representative<br />
\\Gh-wash\ENG 1160\LTCP\LTCP Final\Sec 15.doc 15-10 FINAL - July 2002
Post Construction Monitoring<br />
CSO outfalls. The system would comprise a series of colored lights, flags or pendents that would<br />
operate as follows:<br />
<br />
<br />
<br />
<br />
<br />
Color A would be displayed as long as flow is being detected as flowing out from the<br />
representative outfall.<br />
Other colors would be displayed based on the overflow volume from the representative<br />
outfall. There would be two levels of notification; one for a normal event and another for a<br />
major event.<br />
For a normal volume (probable impact not more than 24 hours), Color B would be displayed<br />
for 24 hours after flow has ceased flowing out from the representative outfall.<br />
For a significant volume (probable impact greater than 24 hours but less than 72 hours),<br />
Color C would be displayed for 72 hours after flow has ceased flowing out from the<br />
representative outfall.<br />
The visual notification system would be described and explained on WASA’s web site.<br />
\\Gh-wash\ENG 1160\LTCP\LTCP Final\Sec 15.doc 15-11 FINAL - July 2002
References<br />
References<br />
Aliquier, M. et. al. 1982. “Improvement of Swirl Concentrator”, Journal of the Environmental<br />
Engineering Division, ASCE, Vol. 108, No. EE2, April 1982.<br />
Ambrose, R.B.Jr., T.A. Wool and J.L. Martin, 1993. The <strong>Water</strong> Quality Analysis Simulation<br />
Program, WASP5 (3 volumes). U.S. EPA, Athens, GA .<br />
Board of Engineers, 1957. Report to District of Columbia Department of Sanitary Engineering on<br />
Improvements to <strong>Sewer</strong>age <strong>System</strong>.<br />
City of Indianapolis. 1996. Implementation of early Action CSO <strong>Control</strong> Projects: Pilot Facilities<br />
for In-<strong>System</strong> Storage and Solids/Floatables <strong>Control</strong>.<br />
Department of Consumer and Regulatory Affairs (<strong>DC</strong>RA). 1988. Storm <strong>Water</strong> Management<br />
Guidebook.<br />
Delon Hampton & Associates, 1998. Pumping Station Upgrade and Increase of Conveyance <strong>System</strong><br />
Capacity. Prepared for District of Columbia <strong>Water</strong> and <strong>Sewer</strong> Authority, Washington D.C.<br />
Delon Hampton & Associates, Charted, 1996. CSO Abatement program: Nine Minimum <strong>Control</strong><br />
Compliance Report. Report prepared for the <strong>DC</strong> <strong>Water</strong> and <strong>Sewer</strong> Authority, Washington, <strong>DC</strong>.<br />
District of Columbia Register, Vol. 47-No. 3, Friday, January 21, 2000.<br />
D. C. Department of Health (DOH). March 2001. Biochemical Oxygen Demand Total Maximum<br />
Daily Load for the Anacostia River.<br />
D. C. Department of Health (DOH). September 28, 1998. List of <strong>Water</strong> Bodies Required to be Listed<br />
under 303(d) of the Clean <strong>Water</strong> Act.<br />
Engineering Program Management Consultant – III, 2001a. Study Memorandum LTCP-3-3:<br />
Regulatory Requirements, Greeley and Hansen, Upper Marlboro, MD.<br />
Engineering Program Management Consultant – III, 2001b. Study Memorandum LTCP-3-4:<br />
Sensitive Areas, Greeley and Hansen, Upper Marlboro, MD.<br />
\\Gh-wash\ENG 1160\LTCP\LTCP Final\references.doc 1 FINAL - July 2002
References<br />
Engineering Program Management Consultant – III, 2000a. District of Columbia <strong>Water</strong> and <strong>Sewer</strong><br />
Authority <strong>Sewer</strong> <strong>System</strong>: Diversion, Intercepting and Overflow Structures. Prepared for District<br />
of Columbia <strong>Water</strong> and <strong>Sewer</strong> Authority, Washington D.C.<br />
Engineering Program Management Consultant – III, 2000b. Study Memorandum LTCP 5-8: CSS and<br />
SSWS Event Mean Concentrations. Prepared for District of Columbia <strong>Water</strong> and <strong>Sewer</strong><br />
Authority, Washington D.C.<br />
Engineering Program Management Consultant –III (EPMC-III). 2000c. Feasibility Assessment:<br />
EquiFlow <strong>Combined</strong> <strong>Sewer</strong> Overflow Storage <strong>System</strong>.<br />
Engineering Program Management Consultant –III (EPMC-III). 1999a. <strong>Combined</strong> <strong>Sewer</strong> <strong>System</strong><br />
Nine Minimum <strong>Control</strong>s Summary Report – Draft, July 1999.<br />
Engineering Program Management Consultant – III. 1999b. Quality Assurance Project <strong>Plan</strong>:<br />
Monitoring for <strong>Combined</strong> <strong>Sewer</strong> <strong>System</strong> <strong>Long</strong> <strong>Term</strong> <strong>Control</strong> <strong>Plan</strong>.<br />
Engineering Program Management Consultant – III, 1999c. Study Memorandum LTCP-3-1:<br />
<strong>Water</strong>sheds – General, Greeley and Hansen, Upper Marlboro, MD.<br />
Engineering Program Management Consultant – III, 1999d. Study Memorandum LTCP-3-2: Rainfall<br />
Conditions, Greeley and Hansen, Upper Marlboro, MD.<br />
Engineering Program Management Consultant – III, 1999e. Study Memorandum LTCP 5-3: CSS<br />
Model Justification and Selection. Prepared for District of Columbia <strong>Water</strong> and <strong>Sewer</strong><br />
Authority, Washington D.C.<br />
Engineering Program Management Consultant – III, 1999f. Study Memorandum LTCP 5-6: SSWS<br />
Model Justification and Selection. Prepared for District of Columbia <strong>Water</strong> and <strong>Sewer</strong><br />
Authority, Washington D.C.<br />
Engineering-Science. October 1989. Anacostia Park from a Historical and Archeological<br />
Perspective, Bromberg, Francine Weiss et al., Washington, <strong>DC</strong>.<br />
Fair, G. and Geyer, J. 1965. Elements of <strong>Water</strong> Supply and Wastewater Disposal, John Wiley &<br />
Sons, Inc. New York.<br />
\\Gh-wash\ENG 1160\LTCP\LTCP Final\references.doc 2 FINAL - July 2002
References<br />
Ferrara, R. A. and Witkowski, P. 1983. Stormwater Quality Characteristics in Detention Basins,<br />
Journal of Environmental Engineering ASCE, Vol. 109, No. 2.<br />
Greeley and Hansen LLP, 2001. Municipal Separate Storm <strong>Sewer</strong> <strong>System</strong> First Annual Review,<br />
Report prepared for the <strong>DC</strong> Department of Public Works, <strong>DC</strong> Department of Health and <strong>DC</strong><br />
WASA , Washington, <strong>DC</strong>.<br />
Greeley and Hansen. 1995. Memorandum Report on CSO Swirl Concentrator Facility<br />
Separator) Testing Program.<br />
(Vortex<br />
Greeley and Hansen, 1985. Blue Plains Feasibility Study, Report prepared for the <strong>DC</strong> Department of<br />
Public Works, Washington, <strong>DC</strong>.<br />
Hershfield, D.M., 1961. Rainfall Frequency Atlas of the United States for Durations from 30 Minutes<br />
to 24 Hours and Return Periods from 1 to 100 Years. US Dept. of Commerce, NWS Technical<br />
Paper No. 40. Washington, <strong>DC</strong>.<br />
Huber and Dickinson, 1988. Storm <strong>Water</strong> Management Model, Version 4: User’s Manual. EPA-<br />
600/3-88-001a, U.S. EPA, Athens, GA.<br />
Huff, F.A., 1990. Time Distributions of Heavy Rainstorms in Illnois. Illinois State <strong>Water</strong> Survey,<br />
Circular 173, Champaign, IL.<br />
HydroQual, Inc. 1995. City-Wide Floatables Study, Department of Environmental Protection,<br />
Bureau of Environmental Engineering, Division of <strong>Water</strong> Quality Improvement, New York City.<br />
Interstate Commission on the Potomac River Basin (ICPRB). 1982. “Potential for Bathing Areas on<br />
the Potomac and Anacostia Rivers in the Washington D.C. Metropolitan Area”, May 21, 1982.<br />
Interstate Commission on the Potomac River Basin (ICPRB). 2000a. History of <strong>Water</strong> Quality in the<br />
Potomac Basin. ICPRB website address http://www.potomacriver.org/wqhistory.htm.<br />
Interstate Commission on the Potomac River Basin (ICPRB), 2000b. The TAM/WASP Model: A<br />
Modeling Framework for the Total Maximum Daily Load Allocation in the Tidal Anacostia<br />
River, Report prepared for the <strong>DC</strong> Department of Health, Washington, <strong>DC</strong>.<br />
Limno-Tech, Inc (LTI), 1992a. Internal Technical Memorandum: Hydrodynamic Recalibration of the<br />
Tidal Anacostia Model (TAM). Prepared for MWCOG, Washington, <strong>DC</strong>.<br />
\\Gh-wash\ENG 1160\LTCP\LTCP Final\references.doc 3 FINAL - July 2002
References<br />
Limno-Tech, Inc (LTI), 1992b. Internal Technical Memorandum: Calibration of the Tidal Anacostia<br />
Model to 1985, 1986, and Wet Weather Survey Date of 1988. Prepared for MWCOG,<br />
Washington, <strong>DC</strong>.<br />
Limno-Tech, Inc (LTI), 1988. Dissolved Oxygen Study of the Potomac River. Report prepared for<br />
the Metropolitan Washington Council of Governments, Washington, <strong>DC</strong>.<br />
Limno-Tech, Inc (LTI), 1981. Development and Validation of a <strong>Water</strong> Quality Model for Rock<br />
Creek: Technical Memorandum LTI/<strong>DC</strong>1-7/6, Report prepared for O’Brien & Gere Engineers,<br />
Washington, <strong>DC</strong>.<br />
Metcalf & Eddy Engineers, 1955. Report to David V. Auld, Director of Sanitary Engineering,<br />
District of Columbia upon Investigation of <strong>Sewer</strong>age <strong>System</strong>.<br />
Metropolitan Washington Council of Governments (MWCOG). 2001a. Data Validation Report for<br />
WASA CSO Monitoring Project (January 2001).<br />
Metropolitan Washington Council of Governments (MWCOG). 2001b. Anacostia Wet Weather<br />
Survey Monitoring Summary.<br />
Metropolitan Washington Council of Governments (MWCOG). 2001c. Sediment Oxygen Demand<br />
in the Anacostia River.<br />
Metropolitan Washington Council of Governments (MWCOG). 2000a. Data Validation Report for<br />
WASA CSO Monitoring Project (February 2000).<br />
Metropolitan Washington Council of Governments (MWCOG). 2000b. Data Validation Report for<br />
WASA CSO Monitoring Project (June 2000).<br />
Metropolitan Washington Council of Governments (MWCOG). 2000c. Data Validation Report for<br />
WASA CSO Monitoring Project (October 2000).<br />
Metropolitan Washington Council of Governments (MWCOG). 1983. Urban Runoff in the<br />
Washington Metropolitan Area, Final Report, Washington, D.C. Area, Urban Runoff Project,<br />
U.S. EPA Nationwide Urban Runoff Program, <strong>Water</strong> Resources <strong>Plan</strong>ning Board.<br />
O’Brien & Gere, 1983. <strong>Combined</strong> <strong>Sewer</strong> Abatement Study, Report prepared for the <strong>DC</strong> Department<br />
of Environmental Services, Washington, <strong>DC</strong>.<br />
\\Gh-wash\ENG 1160\LTCP\LTCP Final\references.doc 4 FINAL - July 2002
References<br />
O’Brien & Gere, 1983. <strong>Combined</strong> <strong>Sewer</strong> Overflow Abatement Program - Final Report. Report<br />
prepared for <strong>DC</strong> Department of Environmental Services, Washington, <strong>DC</strong>.<br />
O’Brien & Gere, 1980. Preliminary Operations Analysis, Wet Weather Conditions, Phase II -<br />
<strong>Combined</strong> <strong>Sewer</strong> Overflow Study. Report prepared for <strong>DC</strong> Department of Environmental<br />
Services, Washington, <strong>DC</strong>.<br />
Oliver, L. J. and Grigoropoulos, S. G. 1981. <strong>Control</strong> of Storm Generated Pollution Using a Small<br />
Urban Lake, Journal WPCF, Vol. 53, No. 5, May 1981.<br />
Peer Consultants. 1999. Wastewater Flow Reduction <strong>Plan</strong>. Prepared for District of Columbia <strong>Water</strong><br />
and <strong>Sewer</strong> Authority.<br />
Peers Consultants, 1996. NPDES Part 2 – Storm <strong>Water</strong> Permit Application. Prepared for District of<br />
Columbia <strong>Water</strong> and <strong>Sewer</strong> Utility Administration.<br />
Urban, James, 2001. Letter to Michael Marcotte, District of Columbia <strong>Water</strong> and <strong>Sewer</strong> Authority,<br />
dated May 15, 2001<br />
U.S. Bureau of Labor Statistics, 2000, Bureau of Labor Statistics Data, Consumer Price Index-<br />
All Urban Consumers, Seasonally Adjusted, U.S. City Average, All Items, data extracted<br />
Aug. 14, 2000 from: www.bls.gov.<br />
U.S. Census Bureau, data extracted on May 20, 2002 from: www.census.gov/hhes<br />
/income/income00/statemhi.html.<br />
USDA, 1986. Urban Hydrology for Small <strong>Water</strong>sheds. National Resources Conservation Service,<br />
Technical Release 55, Washington, <strong>DC</strong>.<br />
U.S. Environmental Protection Agency (EPA), 1986. Ambient <strong>Water</strong> Quality Criteria for Bacteria-<br />
1986. EPA 440/5-84-002.<br />
U.S. Environmental Protection Agency (EPA), 1999a. <strong>Combined</strong> <strong>Sewer</strong> Overflow <strong>Control</strong> Fact<br />
Sheet – Screens. EPA 832-F-99-040.<br />
U.S. Environmental Protection Agency (EPA), 1999b. <strong>Combined</strong> <strong>Sewer</strong> Overflow <strong>Control</strong> Fact<br />
Sheet – Chlorine Disinfection. EPA 832-F-99-034.<br />
\\Gh-wash\ENG 1160\LTCP\LTCP Final\references.doc 5 FINAL - July 2002
References<br />
U.S. Environmental Protection Agency (EPA), 1999c. <strong>Combined</strong> <strong>Sewer</strong> Overflow <strong>Control</strong> Fact<br />
Sheet – Alternative Disinfection Methods. EPA 832-F-99-033.<br />
U.S. Environmental Protection Agency, 1997. Guidance for Financial Capability Assessment and<br />
Schedule Development, EPA 832-B-97-004.<br />
U.S. Environmental Protection Agency (EPA). 1994. <strong>Combined</strong> <strong>Sewer</strong> Overflow (CSO) <strong>Control</strong><br />
Policy, EPA, Office of <strong>Water</strong>, EPA-830-B-94-001, April 1994.<br />
U.S. Environmental Protection Agency, (EPA), December 1983. Results of the Nationwide Urban<br />
Runoff Program, Executive Summary, <strong>Water</strong> <strong>Plan</strong>ning Division.<br />
U.S. Environmental Protection Agency (EPA), 1979. User’s Manual for the Dynamic (Potomac)<br />
Estuary Model. Annapolis Field Office, Annapolis, MD.<br />
U.S. Environmental Protection Agency (EPA), 1978. Construction Costs for Municipal Wastewater<br />
Treatment <strong>Plan</strong>ts 1973-1977. EPA 430/9-77-013.<br />
U.S. Fish and Wildlife Service (USFWS). 2000a. May 19, 2000 correspondence from Robert J.<br />
Pennington.<br />
U.S. Fish and Wildlife Service (USFWS). 2000b. November 15, 2000 correspondence from Robert<br />
J. Pennington.<br />
WASA, 2002a. Personal communication with WASA Financial Department, June 2002.<br />
WASA, 2000a. Proposed FY 2002 Operating and Capital Budgets, p. VII-4.<br />
WASA, 2000b, Internal document entitled: FY2000-2009 Capital Improvement Disbursement<br />
<strong>Plan</strong> by Service Area/Program/User, received Sept. 19, 2000.<br />
WASA, 2000c. Internal communication, Sept. 19, 2000.<br />
WASA, 1999a. New Rates Brochure.<br />
WASA, 1999b. Proposed FY 2002 Operating and Capital Budgets, p. VI-6.<br />
Washington Post. 1928. “Colored Citizens Oppose Head of Francis High Pool”, June 27, 1928.<br />
\\Gh-wash\ENG 1160\LTCP\LTCP Final\references.doc 6 FINAL - July 2002
References<br />
Zaccagnino, J.;Stewart, M. and Kloman, L. 2000. The Role of Peer Review in the Corona Avenue<br />
Voretx Facility Evaluation Program. WEF Specialty Conference 2000.<br />
\\Gh-wash\ENG 1160\LTCP\LTCP Final\references.doc 7 FINAL - July 2002
Glossary<br />
Glossary<br />
A<br />
Activated Sludge: Product that results when primary effluent is mixed with bacteria-laden sludge<br />
and then agitated and aerated to promote biological treatment, speeding the breakdown of organic<br />
matter in raw sewage undergoing secondary waste treatment.<br />
Advanced Treatment: A level of wastewater treatment more stringent than secondary treatment;<br />
requires an 85-percent reduction in conventional pollutant concentration or a significant reduction in<br />
non-conventional pollutants. Sometimes called tertiary treatment.<br />
Advanced Wastewater Treatment: Any treatment of sewage that goes beyond the secondary or<br />
biological water treatment stage and includes the removal of nutrients such as phosphorus and<br />
nitrogen and a high percentage of suspended solids. (See primary, secondary treatment.)<br />
Aeration: A process that promotes biological degradation of organic matter in water. The process<br />
may be passive (as when waste is exposed to air), or active (as when a mixing or bubbling device<br />
introduces the air).<br />
Algae: Simple rootless plants that grow in sunlit waters in proportion to the amount of available<br />
nutrients. They can affect water quality adversely by lowering the dissolved oxygen in the water.<br />
They are food for fish and small aquatic animals.<br />
Algal Blooms: Sudden spurts of algal growth, which can affect water quality adversely and indicate<br />
potentially hazardous changes in local water chemistry.<br />
Assimilation: The ability of a body of water to purify itself of pollutants.<br />
Assimilative Capacity: The capacity of a natural body of water to receive wastewaters or toxic<br />
materials without deleterious efforts and without damage to aquatic life or humans who consume the<br />
water.<br />
Authority: District of Columbia <strong>Water</strong> and <strong>Sewer</strong> Authority<br />
B<br />
Bacteria: (Singular: bacterium) Microscopic living organisms that can aid in pollution control by<br />
metabolizing organic matter in sewage, oil spills or other pollutants. However, some types of<br />
bacteria in soil, water or air can also cause human, animal and plant health problems. Measured in<br />
number of bacteria organisms per 100 milliliters of sample (No./ml or #/100 ml).<br />
Best Management Practice (BMP): Methods that have been determined to be the most effective,<br />
practical means of preventing or reducing pollution from non-point sources.<br />
Biochemical Oxygen Demand (BOD): A measure of the amount of oxygen consumed in the<br />
biological processes that break down organic matter in water. The greater the BOD, the greater the<br />
degree of pollution.<br />
Biotic Community: A naturally occurring assemblage of plants and animals that live in the same<br />
environment and are mutually sustaining and interdependent.<br />
BPWWTP: Blue Plains Wastewater Treatment <strong>Plan</strong>t<br />
\\Gh-wash\ENG 1160\LTCP\LTCP Final\glossary.doc 1 FINAL - July 2002
Glossary<br />
C<br />
CFR: Code of Federal Regulation<br />
Capture: The total volume of flow collected in the combined sewer system during precipitation<br />
events on a system-wide, annual average basis (not percent of volume being discharged).<br />
CBOD5: Carbonaceous Biochemical Oxygen Demand<br />
Chlorination: The application of chlorine to drinking water, sewage, or industrial waste to disinfect<br />
or to oxidize undesirable compounds.<br />
CIP: Capital Improvement Program<br />
COD: Chemical Oxygen Demand<br />
Collection <strong>System</strong>: Pipes used to collect and carry wastewater from individual sources to an<br />
interceptor sewer that will carry it to a treatment facility.<br />
<strong>Combined</strong> <strong>Sewer</strong> Overflow (CSO): Discharge of a mixture of storm water and domestic waste<br />
when the flow capacity of a sewer system is exceeded during rainstorms.<br />
<strong>Combined</strong> <strong>Sewer</strong> <strong>System</strong> (CSS): A sewer system that carries both sewage and storm-water runoff.<br />
Normally, its entire flow goes to a waste treatment plant, but during a heavy storm, the volume of<br />
water may be so great as to cause overflows of untreated mixtures of storm water and sewage into<br />
receiving waters. Storm-water runoff may also carry toxic chemicals from industrial areas or streets<br />
into the sewer system.<br />
Conc. Concentration<br />
Cost-Benefit Analysis: A quantitative evaluation of the costs, which would be incurred by<br />
implementing an alternative versus the overall benefits to society of the proposed alternative.<br />
Cr+6: Chrome +6<br />
CSO: <strong>Combined</strong> <strong>Sewer</strong> Overflow (See above)<br />
CWA: Clean <strong>Water</strong> Act – Federal law stipulating actions to be carried out to improve water quality<br />
in U.S. waters.<br />
D<br />
Design Capacity: The average daily flow that a treatment plant or other facility is designed to<br />
accommodate.<br />
Designated Uses: Those water uses identified in state water quality standards that must be achieved<br />
and maintained as required under the Clean <strong>Water</strong> Act. Uses can include cold-water fisheries, public<br />
water supply, and irrigation.<br />
DETS: WASA’s Department of Engineering and Technical Services<br />
Discharge: Flow of surface water in a stream or canal or the outflow of ground water from a<br />
flowing artesian well, ditch, or spring. Can also apply to discharge of liquid effluent from a facility<br />
or to chemical emissions into the air through designated venting mechanisms.<br />
Disinfectant: A chemical or physical process that kills disease-causing organisms in water, air, or<br />
on surfaces. Chlorine is often used to disinfect sewage treatment effluent, water supplies, wells, and<br />
swimming pools.<br />
Dissolved Oxygen (DO): The oxygen freely available in water, vital to fish and other aquatic life<br />
and for the prevention of odors. DO levels are considered a most important indicator of a water<br />
body’s ability to support desirable aquatic life. Secondary and advanced waste treatments are<br />
generally designed to ensure adequate DO in waste-receiving waters.<br />
<strong>DC</strong>SW: District of Columbia Storm <strong>Water</strong><br />
DMS: WASA’s Department of Maintenance Services<br />
DOC: Dissolved Organic Carbon<br />
\\Gh-wash\ENG 1160\LTCP\LTCP Final\glossary.doc 2 FINAL - July 2002
Glossary<br />
DOH: District of Columbia Department of Health, the environmental regulatory agency for the<br />
District<br />
DOT: District of Columbia Division of Transportation<br />
DPW: District of Columbia Department of Public Works<br />
DSS: WASA’s Department of <strong>Sewer</strong> Services<br />
E<br />
Effluent Guidelines: Technical EPA documents which set effluent limitations for given industries<br />
and pollutants.<br />
Effluent Limitation: Restrictions established by a state or EPA on quantities, rates, and<br />
concentrations in wastewater discharges.<br />
Effluent Standard: (See effluent limitation.)<br />
Effluent: Wastewater—treated or untreated—that flows out of a treatment plan, sewer, or industrial<br />
outfall. Generally refers to wastes discharged into surface waters.<br />
EHRC: Enhanced High Rate Clarification<br />
EMCs: Event Mean Concentration<br />
EPA: United States Environmental Protection Agency<br />
EPMC: Engineering Program Management Consultant<br />
F<br />
Floatables: Large floating material sometimes characteristic of sanitary wastewater and storm<br />
runoff, which includes litter and trash.<br />
Food Chain: A sequence of organisms, each of which uses the next, lower member of the sequence<br />
as a food source.<br />
G<br />
GIS: Geographical Information <strong>System</strong><br />
GPD: Gallons per Day<br />
H<br />
Holding Pond: A pond or reservoir, usually made of earth, built to store polluted runoff.<br />
HRT: High Rate Treatment<br />
Hypoxia/Hypoxic <strong>Water</strong>s: <strong>Water</strong>s with dissolved oxygen concentrations of less than 2 ppm, the<br />
level generally accepted as the minimum required for most marine life to survive and reproduce.<br />
I<br />
I/I: Inflow/Infiltration (See definitions of Inflow and Infiltration below)<br />
IBI: Indices of Biological Integrity<br />
ICPRB: Interstate Commission on Potomac River Basin<br />
in: Inches<br />
Infiltration: The penetration of water from the soil into sewer or other pipes through defective<br />
joints, connections, or manhole walls.<br />
Inflow: Entry of extraneous rainwater into a sewer system from sources other than infiltration, such<br />
as basement drains, manholes, storm drains, and street washing.<br />
\\Gh-wash\ENG 1160\LTCP\LTCP Final\glossary.doc 3 FINAL - July 2002
Glossary<br />
Influent: <strong>Water</strong>, wastewater, or other liquid flowing into a reservoir, basin, or treatment plant.<br />
Interceptor <strong>Sewer</strong>s: Large sewer lines that, in a combined system, control the flow of sewage to the<br />
treatment plant. During some storm events, their capacity is exceeded and regulator structures<br />
relieve excess flow to receiving waters to prevent flooding basements, businesses and streets.<br />
K<br />
Knee-off-the-curve: The point where the incremental change in the cost of the control alternative<br />
per change in performance of the control alternative changes most rapidly.<br />
L<br />
<strong>Long</strong> <strong>Term</strong> <strong>Control</strong> <strong>Plan</strong> (LTCP): A document developed by CSO communities to describe<br />
existing waterway conditions and various CSO abatement technologies that will be used to control<br />
overflows.<br />
LID: Low Impact Development<br />
LID-R: Low Impact Development - Retrofit<br />
M<br />
Macro-invertebrate: Invertebrate (no spinal column) organism that is too large to pass through a<br />
No. 40 Screen (0.417mm).<br />
mf/l: Million fibers per liter – A measure of concentration.<br />
mg: Million Gallons – A measure of volume.<br />
mgd: Million Gallons Per Day – A measure of the rate of water flow.<br />
mg/l: Milligrams Per Liter – A measure of concentration.<br />
MHI: Median Household Income<br />
MOUSE: Computer model developed by the Danish Hydraulic Institute used to model the<br />
combined sewer system.<br />
Municipal Sewage: Wastes (mostly liquid) originating from a community; may be composed of<br />
domestic wastewater and/or industrial discharges.<br />
MWCOG: Metropolitan Washington Council of Governments<br />
N<br />
National Pollutant Discharge Elimination <strong>System</strong> (NPDES): A provision of the Clean <strong>Water</strong> Act<br />
which prohibits discharge of pollutants into water of the United States unless a special permit is<br />
issued by EPA, a state, or, where delegated, a tribal government on an Indian reservation.<br />
NH 3 : Ammonia – A nutrient pollutant of concern in the Chesapeake Region.<br />
No./ml (or #/ml): number of bacteria organisms per milliliter – measure of concentration<br />
Non-Point Source (NPS): Diffused pollution sources (i.e., without a single point of origin or not<br />
introduced into a receiving stream from a specific outlet). The pollutants are generally carried off the<br />
land by storm water. Common non-point sources are agriculture, forestry, urban, mining,<br />
construction, dams, channels, land disposal, saltwater intrusion, and city streets.<br />
Nutrient: Any substance assimilated by living things that promotes growth. The term is generally<br />
applied to nitrogen and phosphorus in wastewater, but is also applied to other essential and trace<br />
elements.<br />
\\Gh-wash\ENG 1160\LTCP\LTCP Final\glossary.doc 4 FINAL - July 2002
Glossary<br />
O<br />
Operation and Maintenance (O&M): Actions taken after construction to ensure that facilities<br />
constructed will be properly operated and maintained to achieve normative efficiency levels and<br />
prescribed effluent eliminations in an optimum manner.<br />
Organic: (1) Referring to other derived from living organisms. (2) In chemistry, any compound<br />
containing carbon.<br />
Organic Chemicals/Compounds: Naturally occurring (animal or plant-produced or synthetic)<br />
substances containing mainly carbon, hydrogen, nitrogen, and oxygen.<br />
Organic Matter: Carbonaceous waste contained in plant or animal matter and originating from<br />
domestic or industrial sources.<br />
Ortho P: Ortho Phosphorus<br />
P<br />
pH: An expression of the intensity of the basic or acid condition of a liquid; may range from 0 to 14,<br />
where 0 is the most acid and 7 is neutral. Natural waters usually have a pH between 6.5 and 8.5<br />
PCBs: Polychlorinated biphenyls<br />
PE: Primary Effluent<br />
Point Source: A stationary location or fixed facility from which pollutants are discharged; any<br />
single identifiable source of pollution; e.g., a pipe, ditch, ship, ore pit, factory smokestack.<br />
Pretreatment: Processes used to reduce, eliminate, or alter the nature of wastewater pollutants from<br />
non-domestic sources before they are discharged into Publicly Owned Treatment Works (POTWs).<br />
Priority Pollutants: A list of 129 toxic pollutants including metals developed by the EPA as a basis<br />
for defining toxics and is commonly refered to as “priority pollutants”.<br />
Primary Waste Treatment: First steps in wastewater treatment; screens and sedimentation tanks<br />
are used to remove most materials that float or will settle. Primary treatment removes about 30<br />
percent of carbonaceous biochemical oxygen demand from domestic sewage.<br />
PS: Pump Station<br />
R<br />
Raw Sewage: Untreated wastewater and its contents.<br />
Riparian Habitat: Areas adjacent to rivers and streams with a differing density, diversity, and<br />
productivity of plant and animal species relative to nearby uplands.<br />
R.L: Reporting Limit<br />
Run-Off: That part of precipitation, snowmelt, or irrigation water that runs off the land into streams<br />
or other surface-water. It can carry pollutants from the air and land into receiving waters.<br />
RTC: Real-Time <strong>Control</strong> – A system of data gathering instrumentation used in conjunction with<br />
control components such as dams, gates and pumps to maximize storage in the existing sewer<br />
system.<br />
S<br />
Sanitary <strong>Sewer</strong>s: Underground pipes that carry off any domestic or industrial waste, not storm<br />
water.<br />
SCADA: Supervisory <strong>Control</strong> and Data Acquisition, system for controlling and collecting and<br />
recording data on certain elements of WASA combined sewer system.<br />
\\Gh-wash\ENG 1160\LTCP\LTCP Final\glossary.doc 5 FINAL - July 2002
Glossary<br />
Secondary Treatment: The second step in most publicly owned waste treatment systems in which<br />
bacteria consume the organic parts of the waste. It is accomplished by bringing together waste,<br />
bacteria, and oxygen in trickling filters or in the activated sludge process. This treatment removes<br />
floating and settleable solids and about 90 percent of the oxygen-demanding substances and<br />
suspended solids. Disinfection is the final stage of secondary treatment. (See: primary, tertiary<br />
treatment.)<br />
Sedimentation: Letting solids settle out of wastewater by gravity during treatment.<br />
Sediments: Soil, sand, and minerals washed from land into water, usually after rain. They pile up in<br />
reservoirs, rivers and harbors, destroying fish and wildlife habitat, and clouding the water so that<br />
sunlight cannot reach aquatic plants. Careless farming, mining, and building activities will expose<br />
sediment materials, allowing them to wash off the land after rainfall.<br />
SF: Square foot<br />
Sediment Oxygen Demand (SOD): A measure of the amount of oxygen consumed in the biological<br />
process that breaks down organic matter in the sediment.<br />
Settleable Solids: Material heavy enough to sink to the bottom of a wastewater treatment tank.<br />
Settling Tank: A holding area for wastewater, where heavier particles sink to the bottom for<br />
removal and disposal.<br />
<strong>Sewer</strong> Sludge: Sludge produced at a Publicly Owned Treatment Works (POTW), the disposal of<br />
which is regulated under the Clean <strong>Water</strong> Act.<br />
Sewage: The waste and wastewater produced by residential and commercial sources and discharged<br />
into sewers.<br />
<strong>Sewer</strong>: A channel or conduit that carries wastewater and storm-water runoff from the source to a<br />
treatment plant or receiving stream. “Sanitary” sewers carry household, industrial, and commercial<br />
waste. “Storm” sewers carry runoff from rain or snow. “<strong>Combined</strong>” sewers handle both.<br />
<strong>Sewer</strong>age: The entire system of sewage collection, treatment, and disposal.<br />
SSWS: Separate Storm <strong>Water</strong> <strong>System</strong> – A system of catch basin, pipes, and other components that<br />
carry only surface run off to receiving waters.<br />
Storage: Treatment holding of waste pending treatment or disposal, as in containers, tanks, waste<br />
piles, and surface impoundments.<br />
Storm <strong>Sewer</strong>: A system of pipes (separate from sanitary sewers) that carries waste runoff from<br />
buildings and land surfaces.<br />
Surcharge Flow: Flow in which the water level is above the crown of the pipe causing pressurized<br />
flow in pipe segments.<br />
Surface Runoff: Precipitation, snow melt, or irrigation water in excess of what can infiltrate the soil<br />
surface and be stored in small surface depressions; a major transporter of non-point source pollutants<br />
in rivers, streams, and lakes.<br />
Surface <strong>Water</strong>: All water naturally open to the atmosphere (rivers, lakes, reservoirs, ponds,<br />
streams, impoundments, seas, estuaries, etc.)<br />
Suspended Loads: Specific sediment particles maintained in the water column by turbulence and<br />
carried with the flow of water.<br />
Suspended Solids: Small particles of solid pollutants that float on the surface of, or are suspended<br />
in, sewage or other liquids. They resist removal by conventional means.<br />
SWMP: Storm <strong>Water</strong> Management <strong>Plan</strong><br />
\\Gh-wash\ENG 1160\LTCP\LTCP Final\glossary.doc 6 FINAL - July 2002
Glossary<br />
T<br />
TDS: Total Dissolved Solids<br />
Tertiary Treatment: Advanced cleaning of wastewater that goes beyond the secondary or<br />
biological stage, removing nutrients such as phosphorus, nitrogen, and most BOD and suspended<br />
solids.<br />
TKN: Total Kjeldahl Nitrogen, the sum of organic nitrogen and ammonia nitrogen.<br />
TMDL: Total Maximum Daily Loads<br />
TOC: Total Organic Carbon<br />
Total P: Total Phosphorus<br />
Total Suspended Solids (TSS): A measure of the suspended solids in wastewater, effluent, or water<br />
bodies, determined by tests for “total suspended non-filterable solids.” (See: suspended solids.)<br />
Toxic Pollutants: Materials that cause death, disease, or birth defects in organisms that ingests or<br />
absorbs them. The quantities and exposures necessary to cause these effects can vary widely.<br />
Treated Wastewater: Wastewater that has been subjected to one or more physical, chemical, and<br />
biological processes to reduce its potential of being a health hazard.<br />
Treatment: (1) Any method, technique, or process designed to remove solids and/or pollutants from<br />
solid waste, waste-streams, effluents, and air emissions. (2) Methods used to change the biological<br />
character or composition of any regulated medical waste so as to substantially reduce or eliminate its<br />
potential for causing disease.<br />
Treatment <strong>Plan</strong>: A structure built to treat wastewater before discharging it into the environment.<br />
TSS: Total Suspended Solids<br />
U<br />
UAA: Use Attainability Analysis, an evaluation that provides the scientific and economic basis for a<br />
determination that the designated use of a water body is not attainable based on one or more factors<br />
proscribed in federal regulations.<br />
ug/l: Microgram per liter – A measure of concentration<br />
Urban Runoff: Storm water from city streets and adjacent domestic or commercial properties that<br />
carries pollutants of various kinds into the sewer systems and receiving waters.<br />
USEPA: United States Environmental Protection Agency<br />
USGS: United States Geological Survey<br />
UV: Ultraviolet<br />
V<br />
VSS: Total Volatile Suspended Solids<br />
W<br />
WASA: District of Columbia <strong>Water</strong> and <strong>Sewer</strong> Authority<br />
Waste <strong>Water</strong> Treatment <strong>Plan</strong>t (WWTP): A facility containing a series of tanks, screens, filters<br />
and other processes by which pollutants are removed from water.<br />
Wastewater: The spent or used water from a home, community, farm, or industry that contains<br />
dissolved or suspended matter.<br />
<strong>Water</strong> Pollution: The presence in water of enough harmful or objectionable material to damage the<br />
water’s quality.<br />
\\Gh-wash\ENG 1160\LTCP\LTCP Final\glossary.doc 7 FINAL - July 2002
Glossary<br />
<strong>Water</strong> Quality Criteria: Levels of water quality expected to render a body of water suitable for its<br />
designated use. Criteria are based on specific levels of pollutants that would make the water harmful<br />
if used for drinking, swimming, farming, fish production, or industrial processes.<br />
<strong>Water</strong> Quality Standards (WQS): State-adopted and EPA-approved ambient standards for water<br />
bodies. The standards prescribe the use of the water body and establish the water quality criteria that<br />
must be met to protect designated uses.<br />
<strong>Water</strong>shed: The land area that drains into a stream; the watershed for a major river may encompass<br />
a number of smaller watersheds that ultimately combined at a common point.<br />
<strong>Water</strong>shed Approach: A coordinated framework for environmental management that focuses<br />
public and private efforts on the highest priority problems within hydrologically-defined geographic<br />
area taking into consideration both ground and surface water flow.<br />
Weir: (1) A wall or plate placed in an open channel to measure the flow of water. (2) A wall or<br />
obstruction used to control flow from settling tanks and clarifiers to ensure a uniform flow rate and<br />
avoid short-circuiting.<br />
\\Gh-wash\ENG 1160\LTCP\LTCP Final\glossary.doc 8 FINAL - July 2002
District of Columbia <strong>Water</strong> and <strong>Sewer</strong> Authority<br />
<strong>Combined</strong> <strong>Sewer</strong> <strong>System</strong> <strong>Long</strong> <strong>Term</strong> <strong>Control</strong> <strong>Plan</strong><br />
APPENDIX A<br />
List of Program Documents<br />
\\Gh-wash\ENG 1160\LTCP\LTCP Final\App A-Prog Docs\Prog Docs.doc FINAL - July 2002
District of Columbia <strong>Water</strong> and <strong>Sewer</strong> Authority<br />
<strong>Combined</strong> <strong>Sewer</strong> <strong>System</strong> <strong>Long</strong> <strong>Term</strong> <strong>Control</strong> <strong>Plan</strong><br />
List of Program Documents<br />
The following documents were prepared as part of the <strong>Long</strong> <strong>Term</strong> <strong>Control</strong> <strong>Plan</strong> development<br />
process:<br />
1. <strong>Long</strong> <strong>Term</strong> <strong>Control</strong> <strong>Plan</strong> Program <strong>Plan</strong><br />
2. Study Memorandum LTCP-1-1: Study area<br />
3. Study Memorandum LTCP-1-2: Dry Weather Flow<br />
4. Study Memorandum LTCP-1-3: Existing CSO <strong>Control</strong>s and Programs<br />
5. Study Memorandum LTCP-1-4: CSO Case Histories<br />
6. Study Memorandum LTCP-2-1: Public Participation Program<br />
7. Study Memorandum LTCP-3-1: <strong>Water</strong>sheds – General<br />
8. Study Memorandum LTCP-3-2: Rainfall Conditions<br />
9. Study Memorandum LTCP-3-3: Regulatory Requirements<br />
10. Study Memorandum LTCP-3-4: Sensitive Areas<br />
11. Study Memorandum LTCP-4-2: CSS - Update Structure Book<br />
12. Study Memorandum LTCP-4-3: CSS – CSO Overflow and Diversion Structure Inspections<br />
13. Study Memorandum LTCP-4-4: CSS - <strong>Sewer</strong> <strong>System</strong> Characteristics Report<br />
14. Study Memorandum LTCP-4-6: SSWS - Exist. Info – <strong>Sewer</strong> <strong>System</strong> Characteristics Report<br />
15. Study Memorandum LTCP-5-1: Monitoring <strong>Plan</strong> for <strong>Sewer</strong> <strong>System</strong>s and Receiving <strong>Water</strong>s<br />
16. Quality Assurance Project <strong>Plan</strong>: Monitoring for <strong>Combined</strong> <strong>Sewer</strong> <strong>System</strong> <strong>Long</strong> <strong>Term</strong> <strong>Control</strong><br />
<strong>Plan</strong><br />
17. Study Memorandum LTCP-5-2: Outfall Survey Report<br />
18. Study Memorandum LTCP-5-3: CSS - Model Justification and Selection<br />
19. Study Memorandum LTCP-5-4: CSS - Model Documentation<br />
20. Study Memorandum LTCP-5-5a: CSS and SSWS Monitoring Results: Aug. 1999-Feb 2000<br />
21. Study Memorandum LTCP-5-5b: CSS and SSWS Monitoring Results: Mar. 2000-June 2000<br />
22. Study Memorandum LTCP-5-5c: CSS and SSWS Monitoring Results: July 2000-Nov. 2000<br />
23. Study Memorandum LTCP-5-5d: CSS and SSWS Monitoring Results: Dec. 2000<br />
24. Data Validation Report for WASA CSO Monitoring Project (<strong>Sewer</strong> <strong>System</strong>s) – Sept. 2000<br />
25. Data Validation Report for WASA CSO Monitoring Project (Receiving <strong>Water</strong>s)-Feb. 2000<br />
26. Data Validation Report for WASA CSO Monitoring Project (Receiving <strong>Water</strong>s)-June 2000<br />
27. Data Validation Report for WASA CSO Monitoring Project (Receiving <strong>Water</strong>s)-Oct. 2000<br />
28. Data Validation Report for WASA CSO Monitoring Project (Receiving <strong>Water</strong>s)-Jan. 2001<br />
29. Anacostia River Wet Weather Receiving <strong>Water</strong> Monitoring Survey Events 1-3, July 2000<br />
30. Study Memorandum LTCP-5-6: SSWS - Model Justification and Selection<br />
31. Study Memorandum LTCP-5-7: SSWS - Model Documentation<br />
32. Study Memorandum LTCP-5-8: CSS and SSWS Event Mean Concentrations<br />
33. Study Memorandum LTCP-5-9: Toxics Monitoring and Analysis<br />
34. Study Memorandum LTCP-6-1: Existing Information – Receiving <strong>Water</strong>s<br />
35. Study Memorandum LTCP-6-2: Receiving <strong>Water</strong>s – Report on Results of Mon. (Interim)<br />
36. Study Memorandum LTCP-6-3: Receiving <strong>Water</strong>s – Model Selection<br />
37. Study Memorandum LTCP-6-4: Anacostia River Model Documentation<br />
38. Study Memorandum LTCP-6-5: Potomac River Model Documentation<br />
39. Study Memorandum LTCP-6-6: Rock Creek Model Documentation<br />
40. Study Memorandum LTCP-7-1: <strong>Water</strong>shed - Sources of Pollution<br />
\\Gh-wash\ENG 1160\LTCP\LTCP Final\App A-Prog Docs\Prog Docs.doc FINAL - July 2002
41. Study Memorandum LTCP-8-5: Financial Capability Assessment<br />
42. Feasibility Assessment – EquiFlow <strong>Combined</strong> <strong>Sewer</strong> Overflow Storage <strong>System</strong><br />
43. Stakeholder Advisory Panel Meeting Summaries – Meetings No. 1 through 10<br />
44. Public Meeting Responsiveness Summaries – Meetings No. 1 through 3<br />
45. Nine Minimum <strong>Control</strong>s Summary Report<br />
46. Nine Minimum <strong>Control</strong>s Action <strong>Plan</strong><br />
47. Review of BMPs for Solids and Floatables <strong>Control</strong><br />
48. Catch Basin Program Evaluation<br />
49. Northeast Boundary <strong>Sewer</strong> Performance Evaluation <strong>Plan</strong><br />
50. Northeast Boundary <strong>Sewer</strong> Performance Evaluation Quality Assurance Project <strong>Plan</strong><br />
51. Northeast Boundary <strong>Sewer</strong> Local Flooding Report<br />
52. Memorandum – Documentation of Installation of CSO Outfall Signs<br />
53. Draft <strong>Long</strong> <strong>Term</strong> <strong>Control</strong> <strong>Plan</strong><br />
54. Comments on Draft <strong>Long</strong> <strong>Term</strong> <strong>Control</strong> <strong>Plan</strong><br />
\\Gh-wash\ENG 1160\LTCP\LTCP Final\App A-Prog Docs\Prog Docs.doc FINAL - July 2002
District of Columbia <strong>Water</strong> and <strong>Sewer</strong> Authority<br />
<strong>Combined</strong> <strong>Sewer</strong> <strong>System</strong> <strong>Long</strong> <strong>Term</strong> <strong>Control</strong> <strong>Plan</strong><br />
APPENDIX B<br />
Effect of CSO <strong>Control</strong>s on <strong>Water</strong> Quality<br />
Anacostia River<br />
J:\1160\LTCP\LTCP Final Draft #2 (Board)\App B-Ana WQ\Appendix B.DOC
District of Columbia <strong>Water</strong> and <strong>Sewer</strong> Authority<br />
<strong>Combined</strong> <strong>Sewer</strong> <strong>System</strong> <strong>Long</strong> <strong>Term</strong> <strong>Control</strong> <strong>Plan</strong><br />
Table of Contents<br />
Appendix B – Effect of CSO <strong>Control</strong>s on <strong>Water</strong> Quality in Anacostia River<br />
Loading<br />
Condition<br />
No Change in<br />
Storm <strong>Water</strong> or<br />
Upstream Loads<br />
Figure<br />
Parameter<br />
B-1 Fecal Coliforms - # of Months Exceeding Class A<br />
Standard<br />
B-2 Fecal Coliforms - # of Months Exceeding Class B<br />
Standard<br />
B-3 Fecal Coliforms - # of Days > 200/100ml<br />
B-4 Fecal Coliforms – May/June Geometric Means<br />
B-5 Fecal Coliforms – July/August Geometric Means<br />
B-6 Fecal Coliforms – September Geometric Means<br />
B-7 E. Coli - # of Months Exceeding 126/100 mL<br />
B-8 E. Coli - # of Days Exceeding 126/100 mL<br />
B-9 E. Coli - # of Days Exceeding 576/100 mL<br />
B-10 Dissolved Oxygen - # of Days Dissolved Oxygen<br />
200/100ml<br />
B-18 Fecal Coliforms – May/June Geometric Means<br />
B-19 Fecal Coliforms – July/August Geometric Means<br />
B-20 Fecal Coliforms – September Geometric Means<br />
B-21 E. Coli - # of Months Exceeding 126/100 mL<br />
B-22 E. Coli - # of Days Exceeding 126/100 mL<br />
B-23 E. Coli - # of Days Exceeding 576/100 mL<br />
B-24 Dissolved Oxygen - # of Days Dissolved Oxygen<br />
District of Columbia <strong>Water</strong> and <strong>Sewer</strong> Authority<br />
<strong>Combined</strong> <strong>Sewer</strong> <strong>System</strong> <strong>Long</strong> <strong>Term</strong> <strong>Control</strong> <strong>Plan</strong><br />
Figure B-1<br />
Anacostia River: Effect of CSO <strong>Control</strong> on Fecal Coliform Concentrations<br />
(No Change in Upstream or Stormwater Loads)<br />
Fecal Coliforms - # of Months Exceeding Class A Standard<br />
No Phase 1 <strong>Control</strong>s Phase 1 <strong>Control</strong>s Flow Pump Sta. Rehab. 12 Overflows/yr 8 Overflows/yr<br />
4 Overflows/yr 2 Overflows/yr 0 Overflows/yr Separation<br />
12<br />
10<br />
ENTIRE CALENDAR YEAR<br />
# of Months/yr<br />
8<br />
6<br />
4<br />
2<br />
0<br />
Haines Point South Capital St. Navy Yard RFK Stadium <strong>DC</strong>/MD Boundary<br />
Confluence NE &<br />
NW Branch<br />
No Phase 1 <strong>Control</strong>s 1 9 11 12 12 12<br />
Phase 1 <strong>Control</strong>s 1 8 8 10 12 12<br />
Pump Sta. Rehab. 1 6 8 10 12 12<br />
12 Overflows/yr 0 5 8 8 12 12<br />
8 Overflows/yr 0 4 7 8 12 12<br />
4 Overflows/yr 0 4 7 8 12 12<br />
2 Overflows/yr 0 4 5 8 12 12<br />
0 Overflows/yr 0 4 5 8 12 12<br />
Separation 0 6 8 8 12 12<br />
Fecal Coliforms - # of Months Exceeding Class A Standard<br />
No Phase 1 <strong>Control</strong>s Phase 1 <strong>Control</strong>s Pump Sta. Rehab. 12 Overflows/yr 8 Overflows/yr<br />
4 Overflows/yr 2 Overflows/yr 0 Overflows/yr Separation<br />
6<br />
5<br />
MAY THROUGH SEPTEMBER<br />
# of Months/yr<br />
4<br />
3<br />
2<br />
1<br />
0<br />
Haines Point South Capital St. Navy Yard RFK Stadium <strong>DC</strong>/MD Boundary<br />
Confluence NE &<br />
NW Branch<br />
No Phase 1 <strong>Control</strong>s 1 3 4 5 5 5<br />
Phase 1 <strong>Control</strong>s 1 2 2 3 5 5<br />
Pump Sta. Rehab. 1 2 2 3 5 5<br />
12 Overflows/yr 0 2 2 2 5 5<br />
8 Overflows/yr 0 1 2 2 5 5<br />
4 Overflows/yr 0 1 1 2 5 5<br />
2 Overflows/yr 0 1 1 2 5 5<br />
0 Overflows/yr 0 Flow 1 1 2 5 5<br />
Separation 0 1 2 2 5 5<br />
\\Gh-wash\ENG 1160\LTCP\LTCP Final Draft #2 (Board)\App B-Ana WQ\[LTCP_App B_Anacostia.xls]14
District of Columbia <strong>Water</strong> and <strong>Sewer</strong> Authority<br />
<strong>Combined</strong> <strong>Sewer</strong> <strong>System</strong> <strong>Long</strong> <strong>Term</strong> <strong>Control</strong> <strong>Plan</strong><br />
Figure B-2<br />
Anacostia River: Effect of CSO <strong>Control</strong> on Fecal Coliform Concentrations<br />
(No Change in Upstream or Stormwater Loads)<br />
Fecal Coliforms - # of Months Exceeding Class B Standard<br />
No Phase 1 <strong>Control</strong>s Phase 1 <strong>Control</strong>s Flow Pump Sta. Rehab. 12 Overflows/yr 8 Overflows/yr<br />
4 Overflows/yr 2 Overflows/yr 0 Overflows/yr Separation<br />
ENTIRE CALENDAR YEAR<br />
# of Months/yr<br />
9<br />
8<br />
7<br />
6<br />
5<br />
4<br />
3<br />
2<br />
1<br />
0<br />
Haines Point South Capital St. Navy Yard RFK Stadium <strong>DC</strong>/MD Boundary<br />
Confluence NE &<br />
NW Branch<br />
No Phase 1 <strong>Control</strong>s 0 1 4 7 6 8<br />
Phase 1 <strong>Control</strong>s 0 1 1 4 6 8<br />
Pump Sta. Rehab. 0 1 1 4 6 8<br />
12 Overflows/yr 0 0 1 3 6 8<br />
8 Overflows/yr 0 0 0 2 6 8<br />
4 Overflows/yr 0 0 0 2 6 8<br />
2 Overflows/yr 0 0 0 2 6 8<br />
0 Overflows/yr 0 0 0 2 6 8<br />
Separation 0 0 1 4 6 8<br />
Fecal Coliforms - # of Months Exceeding Class B Standard<br />
No Phase 1 <strong>Control</strong>s Phase 1 <strong>Control</strong>s Pump Sta. Rehab. 12 Overflows/yr 8 Overflows/yr<br />
4 Overflows/yr 2 Overflows/yr 0 Overflows/yr Separation<br />
MAY THROUGH SEPTEMBER<br />
# of Months/yr<br />
9<br />
8<br />
7<br />
6<br />
5<br />
4<br />
3<br />
2<br />
1<br />
0<br />
Haines Point South Capital St. Navy Yard RFK Stadium <strong>DC</strong>/MD Boundary<br />
Confluence NE &<br />
NW Branch<br />
No Phase 1 <strong>Control</strong>s 0 1 1 2 1 2<br />
Phase 1 <strong>Control</strong>s 0 1 1 1 1 2<br />
Pump Sta. Rehab. 0 1 1 1 1 2<br />
12 Overflows/yr 0 0 1 1 1 2<br />
8 Overflows/yr 0 0 0 1 1 2<br />
4 Overflows/yr 0 0 0 1 1 2<br />
2 Overflows/yr 0 0 0 1 1 2<br />
0 Overflows/yr 0 0 0 1 1 2<br />
Flow<br />
Separation 0 0 1 1 1 2<br />
\\Gh-wash\ENG 1160\LTCP\LTCP Final Draft #2 (Board)\App B-Ana WQ\[LTCP_App B_Anacostia.xls]14
District of Columbia <strong>Water</strong> and <strong>Sewer</strong> Authority<br />
<strong>Combined</strong> <strong>Sewer</strong> <strong>System</strong> <strong>Long</strong> <strong>Term</strong> <strong>Control</strong> <strong>Plan</strong><br />
Figure B-3<br />
Anacostia River: Effect of CSO <strong>Control</strong> on Fecal Coliform Concentrations<br />
(No Change in Upstream or Stormwater Loads)<br />
Fecal Coliforms - # of Days >200/100ml<br />
No Phase 1 <strong>Control</strong>s Phase 1 <strong>Control</strong>s FlowPump Sta. Rehab. 12 Overflows/yr 8 Overflows/yr<br />
4 Overflows/yr 2 Overflows/yr 0 Overflows/yr Separation<br />
350<br />
300<br />
ENTIRE CALENDAR YEAR<br />
# of Days/yr<br />
250<br />
200<br />
150<br />
100<br />
50<br />
0<br />
Haines Point South Capital St. Navy Yard RFK Stadium <strong>DC</strong>/MD Boundary<br />
Confluence NE &<br />
NW Branch<br />
No Phase 1 <strong>Control</strong>s 108 215 239 260 270 329<br />
Phase 1 <strong>Control</strong>s 84 172 202 230 269 329<br />
Pump Sta. Rehab. 76 170 200 229 269 329<br />
12 Overflows/yr 51 143 188 226 269 329<br />
8 Overflows/yr 39 137 186 225 269 329<br />
4 Overflows/yr 30 134 183 223 269 329<br />
2 Overflows/yr 21 131 182 223 268 329<br />
0 Overflows/yr 20 130 182 223 268 329<br />
Separation 41 182 210 238 268 329<br />
Fecal Coliforms - # of Days >200/100ml<br />
No Phase 1 <strong>Control</strong>s Phase 1 <strong>Control</strong>s Pump Sta. Rehab. 12 Overflows/yr 8 Overflows/yr<br />
4 Overflows/yr 2 Overflows/yr 0 Overflows/yr Separation<br />
140<br />
120<br />
MAY THROUGH SEPTEMBER<br />
# of Days/yr<br />
100<br />
80<br />
60<br />
40<br />
20<br />
0<br />
Haines Point South Capital St. Navy Yard RFK Stadium <strong>DC</strong>/MD Boundary<br />
Confluence NE &<br />
NW Branch<br />
No Phase 1 <strong>Control</strong>s 48 78 91 101 92 132<br />
Phase 1 <strong>Control</strong>s 39 66 73 84 91 132<br />
Pump Sta. Rehab. 35 64 71 84 91 132<br />
12 Overflows/yr 21 47 64 81 91 132<br />
8 Overflows/yr 17 45 63 81 91 132<br />
4 Overflows/yr 13 43 61 80 91 132<br />
2 Overflows/yr 8 42 61 80 91 132<br />
0 Overflows/yr 7 41<br />
Flow<br />
60 80 91 132<br />
Separation 14 61 73 87 91 132<br />
\\Gh-wash\ENG 1160\LTCP\LTCP Final Draft #2 (Board)\App B-Ana WQ\[LTCP_App B_Anacostia.xls]14
District of Columbia <strong>Water</strong> and <strong>Sewer</strong> Authority<br />
<strong>Combined</strong> <strong>Sewer</strong> <strong>System</strong> <strong>Long</strong> <strong>Term</strong> <strong>Control</strong> <strong>Plan</strong><br />
Figure B-4<br />
Anacostia River: Effect of CSO <strong>Control</strong> on Fecal Coliform Concentrations<br />
(No Change in Upstream or Stormwater Loads)<br />
Fecal Coliforms - May Geometric Means<br />
No Phase 1 <strong>Control</strong>s Phase 1 <strong>Control</strong>s Flow Pump Sta. Rehab. 12 Overflows/yr 8 Overflows/yr<br />
4 Overflows/yr 2 Overflows/yr 0 Overflows/yr Separation<br />
MPN/100 mL<br />
5,000<br />
4,500<br />
4,000<br />
3,500<br />
3,000<br />
2,500<br />
2,000<br />
1,500<br />
1,000<br />
500<br />
0<br />
Haines Point South Capital St. Navy Yard RFK Stadium <strong>DC</strong>/MD Boundary<br />
Confluence NE &<br />
NW Branch<br />
No Phase 1 <strong>Control</strong>s 368 2,485 3,316 4,721 3,146 3,438<br />
Phase 1 <strong>Control</strong>s 231 1,172 1,602 2,227 3,140 3,438<br />
Pump Sta. Rehab. 205 1,039 1,582 2,259 3,154 3,438<br />
12 Overflows/yr 146 583 1,039 1,902 3,152 3,438<br />
8 Overflows/yr 130 468 879 1,673 3,152 3,438<br />
4 Overflows/yr 115 398 806 1,595 3,152 3,438<br />
2 Overflows/yr 113 389 789 1,576 3,152 3,438<br />
0 Overflows/yr 103 333 718 1,452 3,152 3,438<br />
Separation 140 611 1,002 1,814 3,153 3,438<br />
1400<br />
1200<br />
Fecal Coliforms - June Geometric Means<br />
No Phase 1 <strong>Control</strong>s Phase 1 <strong>Control</strong>s Pump Sta. Rehab. 12 Overflows/yr 8 Overflows/yr<br />
4 Overflows/yr 2 Overflows/yr 0 Overflows/yr Separation<br />
MPN/100 mL<br />
1000<br />
800<br />
600<br />
400<br />
200<br />
0<br />
Haines Point South Capital St. Navy Yard RFK Stadium <strong>DC</strong>/MD Boundary<br />
Confluence NE &<br />
NW Branch<br />
No Phase 1 <strong>Control</strong>s 135 561 796 1256 902 1190<br />
Phase 1 <strong>Control</strong>s 101 302 405 570 887 1190<br />
Pump Sta. Rehab. 88 271 394 570 895 1190<br />
12 Overflows/yr 67 201 298 520 900 1190<br />
8 Overflows/yr 54 138 227 456 898 1190<br />
4 Overflows/yr 43 96 185 386 892 1190<br />
2 Overflows/yr 41 74 154 343 892 1190<br />
0 Overflows/yr 41 74<br />
Flow<br />
154 343 892 1,190<br />
Separation 50 131 216 427 894 1190<br />
\\Gh-wash\ENG 1160\LTCP\LTCP Final Draft #2 (Board)\App B-Ana WQ\[LTCP_App B_Anacostia.xls]14
District of Columbia <strong>Water</strong> and <strong>Sewer</strong> Authority<br />
<strong>Combined</strong> <strong>Sewer</strong> <strong>System</strong> <strong>Long</strong> <strong>Term</strong> <strong>Control</strong> <strong>Plan</strong><br />
Figure B-5<br />
Anacostia River: Effect of CSO <strong>Control</strong> on Fecal Coliform Concentrations<br />
(No Change in Upstream or Stormwater Loads)<br />
Fecal Coliforms - July Geometric Means<br />
No Phase 1 <strong>Control</strong>s Phase 1 <strong>Control</strong>s Flow Pump Sta. Rehab. 12 Overflows/yr 8 Overflows/yr<br />
4 Overflows/yr 2 Overflows/yr 0 Overflows/yr Separation<br />
1,200<br />
1,000<br />
MPN/100 mL<br />
800<br />
600<br />
400<br />
200<br />
0<br />
Haines Point South Capital St. Navy Yard RFK Stadium <strong>DC</strong>/MD Boundary<br />
Confluence NE &<br />
NW Branch<br />
No Phase 1 <strong>Control</strong>s 79 255 399 692 560 958<br />
Phase 1 <strong>Control</strong>s 66 144 191 267 554 958<br />
Pump Sta. Rehab. 58 127 182 266 564 959<br />
12 Overflows/yr 38 51 90 183 564 959<br />
8 Overflows/yr 35 46 82 168 563 959<br />
4 Overflows/yr 33 40 71 154 563 959<br />
2 Overflows/yr 29 30 58 137 562 959<br />
0 Overflows/yr 28 28 54 127 562 959<br />
Separation 36 69 94 195 563 959<br />
Fecal Coliforms - August Geometric Means<br />
MPN/100 mL<br />
No Phase 1 <strong>Control</strong>s Phase 1 <strong>Control</strong>s Pump Sta. Rehab. 12 Overflows/yr 8 Overflows/yr<br />
4 Overflows/yr 2 Overflows/yr 0 Overflows/yr Separation<br />
900<br />
800<br />
700<br />
600<br />
500<br />
400<br />
300<br />
200<br />
100<br />
0<br />
Haines Point South Capital St. Navy Yard RFK Stadium <strong>DC</strong>/MD Boundary<br />
Confluence NE &<br />
NW Branch<br />
No Phase 1 <strong>Control</strong>s 45 138 226 446 424 774<br />
Phase 1 <strong>Control</strong>s 35 63 95 165 414 774<br />
Pump Sta. Rehab. 29 53 90 165 422 775<br />
12 Overflows/yr 19 33 62 142 421 775<br />
8 Overflows/yr 18 31 59 136 420 775<br />
4 Overflows/yr 17 27 52 123 418 774<br />
2 Overflows/yr 14 20 44 109 416 774<br />
0 Overflows/yr 13 19<br />
Flow<br />
41 102 415 774<br />
Separation 18 38 64 143 416 774<br />
\\Gh-wash\ENG 1160\LTCP\LTCP Final Draft #2 (Board)\App B-Ana WQ\[LTCP_App B_Anacostia.xls]14
District of Columbia <strong>Water</strong> and <strong>Sewer</strong> Authority<br />
<strong>Combined</strong> <strong>Sewer</strong> <strong>System</strong> <strong>Long</strong> <strong>Term</strong> <strong>Control</strong> <strong>Plan</strong><br />
Figure B-6<br />
Anacostia River: Effect of CSO <strong>Control</strong> on Fecal Coliform Concentrations<br />
(No Change in Upstream or Stormwater Loads)<br />
Fecal Coliforms - September Geometric Means<br />
No Phase 1 <strong>Control</strong>s Phase 1 <strong>Control</strong>s Pump Sta. Rehab. 12 Overflows/yr 8 Overflows/yr<br />
Flow<br />
4 Overflows/yr 2 Overflows/yr 0 Overflows/yr Separation<br />
800<br />
700<br />
600<br />
MPN/100 mL<br />
500<br />
400<br />
300<br />
200<br />
100<br />
0<br />
Haines Point South Capital St. Navy Yard RFK Stadium <strong>DC</strong>/MD Boundary<br />
Confluence NE &<br />
NW Branch<br />
No Phase 1 <strong>Control</strong>s 54 74 103 235 340 703<br />
Phase 1 <strong>Control</strong>s 42 39 42 76 330 703<br />
Pump Sta. Rehab. 37 35 40 75 337 704<br />
12 Overflows/yr 23 19 25 58 336 704<br />
8 Overflows/yr 22 17 23 54 335 704<br />
4 Overflows/yr 21 16 22 53 335 704<br />
2 Overflows/yr 18 14 21 50 335 704<br />
0 Overflows/yr 18 14 21 50 335 704<br />
Separation 24 32 37 80 336 704<br />
\\Gh-wash\ENG 1160\LTCP\LTCP Final Draft #2 (Board)\App B-Ana WQ\[LTCP_App B_Anacostia.xls]14
District of Columbia <strong>Water</strong> and <strong>Sewer</strong> Authority<br />
<strong>Combined</strong> <strong>Sewer</strong> <strong>System</strong> <strong>Long</strong> <strong>Term</strong> <strong>Control</strong> <strong>Plan</strong><br />
Figure B-7<br />
Anacostia River: Effect of CSO <strong>Control</strong> on Fecal Coliform Concentrations<br />
(No Change in Upstream or Stormwater Loads)<br />
E. Coli - # of Months Exceeding 126/ 100 mL<br />
No Phase 1 <strong>Control</strong>s Phase 1 <strong>Control</strong>s Flow Pump Sta. Rehab. 12 Overflows/yr 8 Overflows/yr<br />
4 Overflows/yr 2 Overflows/yr 0 Overflows/yr Separation<br />
12<br />
10<br />
ENTIRE CALENDAR YEAR<br />
# of Months/yr<br />
8<br />
6<br />
4<br />
2<br />
0<br />
Haines Point South Capital St. Navy Yard RFK Stadium <strong>DC</strong>/MD Boundary<br />
Confluence NE &<br />
NW Branch<br />
No Phase 1 <strong>Control</strong>s 1 10 11 12 12 12<br />
Phase 1 <strong>Control</strong>s 1 7 8 9 12 12<br />
Pump Sta. Rehab. 0 5 8 9 12 12<br />
12 Overflows/yr 0 4 8 8 12 12<br />
8 Overflows/yr 0 3 5 8 12 12<br />
4 Overflows/yr 0 3 5 8 12 12<br />
2 Overflows/yr 0 3 5 8 12 12<br />
0 Overflows/yr 0 3 5 8 12 12<br />
Separation 0 4 7 8 12 12<br />
6<br />
5<br />
E. Coli - # of Months Exceeding 126/ 100 mL<br />
No Phase 1 <strong>Control</strong>s Phase 1 <strong>Control</strong>s Pump Sta. Rehab. 12 Overflows/yr 8 Overflows/yr<br />
4 Overflows/yr 2 Overflows/yr 0 Overflows/yr Separation<br />
MAY THROUGH SEPTEMBER<br />
# of Months/yr<br />
4<br />
3<br />
2<br />
1<br />
0<br />
Haines Point South Capital St. Navy Yard RFK Stadium <strong>DC</strong>/MD Boundary<br />
Confluence NE &<br />
NW Branch<br />
No Phase 1 <strong>Control</strong>s 1 3 4 5 5 5<br />
Phase 1 <strong>Control</strong>s 1 2 2 3 5 5<br />
Pump Sta. Rehab. 0 2 2 3 5 5<br />
12 Overflows/yr 0 1 2 2 5 5<br />
8 Overflows/yr 0 1 1 2 5 5<br />
4 Overflows/yr 0 1 1 2 5 5<br />
2 Overflows/yr 0 1 1 2 5 5<br />
0 Overflows/yr 0 1 1 2 5 5<br />
Flow<br />
Separation 0 1 1 2 5 5<br />
\\Gh-wash\ENG 1160\LTCP\LTCP Final Draft #2 (Board)\App B-Ana WQ\[LTCP_App B_Anacostia.xls]14
District of Columbia <strong>Water</strong> and <strong>Sewer</strong> Authority<br />
<strong>Combined</strong> <strong>Sewer</strong> <strong>System</strong> <strong>Long</strong> <strong>Term</strong> <strong>Control</strong> <strong>Plan</strong><br />
Figure B-8<br />
Anacostia River: Effect of CSO <strong>Control</strong> on Fecal Coliform Concentrations<br />
(No Change in Upstream or Stormwater Loads)<br />
E. Coli - # of Days Exceeding 126/100 mL<br />
No Phase 1 <strong>Control</strong>s Phase 1 <strong>Control</strong>s Flow Pump Sta. Rehab. 12 Overflows/yr 8 Overflows/yr<br />
4 Overflows/yr 2 Overflows/yr 0 Overflows/yr Separation<br />
350<br />
300<br />
ENTIRE CALENDAR YEAR<br />
# of Days/yr<br />
250<br />
200<br />
150<br />
100<br />
50<br />
0<br />
Haines Point South Capital St. Navy Yard RFK Stadium <strong>DC</strong>/MD Boundary<br />
Confluence NE &<br />
NW Branch<br />
No Phase 1 <strong>Control</strong>s 109 216 238 259 234 289<br />
Phase 1 <strong>Control</strong>s 84 167 196 222 232 289<br />
Pump Sta. Rehab. 74 165 195 221 232 289<br />
12 Overflows/yr 45 132 180 216 232 289<br />
8 Overflows/yr 33 125 178 215 232 289<br />
4 Overflows/yr 20 121 174 213 232 289<br />
2 Overflows/yr 12 116 173 212 232 289<br />
0 Overflows/yr 10 116 172 212 232 289<br />
Separation 31 173 201 231 232 289<br />
120<br />
E. Coli - # of Days Exceeding 126/100 mL<br />
No Phase 1 <strong>Control</strong>s Phase 1 <strong>Control</strong>s Pump Sta. Rehab. 12 Overflows/yr 8 Overflows/yr<br />
4 Overflows/yr 2 Overflows/yr 0 Overflows/yr Separation<br />
100<br />
MAY THROUGH SEPTEMBER<br />
# of Days/yr<br />
80<br />
60<br />
40<br />
20<br />
0<br />
Haines Point South Capital St. Navy Yard RFK Stadium <strong>DC</strong>/MD Boundary<br />
Confluence NE &<br />
NW Branch<br />
No Phase 1 <strong>Control</strong>s 48 79 91 101 87 105<br />
Phase 1 <strong>Control</strong>s 39 65 72 82 87 105<br />
Pump Sta. Rehab. 35 64 71 82 87 105<br />
12 Overflows/yr 20 45 62 78 87 105<br />
8 Overflows/yr 16 42 61 78 86 105<br />
4 Overflows/yr 11 39 59 77 86 105<br />
2 Overflows/yr 6 37 58 76 86 105<br />
0 Overflows/yr 5 37 Flow<br />
58 76 86 105<br />
Separation 10 59 70 85 86 105<br />
\\Gh-wash\ENG 1160\LTCP\LTCP Final Draft #2 (Board)\App B-Ana WQ\[LTCP_App B_Anacostia.xls]14
District of Columbia <strong>Water</strong> and <strong>Sewer</strong> Authority<br />
<strong>Combined</strong> <strong>Sewer</strong> <strong>System</strong> <strong>Long</strong> <strong>Term</strong> <strong>Control</strong> <strong>Plan</strong><br />
Figure B-9<br />
Anacostia River: Effect of CSO <strong>Control</strong> on Fecal Coliform Concentrations<br />
(No Change in Upstream or Stormwater Loads)<br />
E. Coli - # of Days Exceeding 576/100 mL<br />
No Phase 1 <strong>Control</strong>s Phase 1 <strong>Control</strong>s FlowPump Sta. Rehab. 12 Overflows/yr 8 Overflows/yr<br />
4 Overflows/yr 2 Overflows/yr 0 Overflows/yr Separation<br />
250<br />
200<br />
ENTIRE CALENDAR YEAR<br />
# of Days/yr<br />
150<br />
100<br />
50<br />
0<br />
Haines Point South Capital St. Navy Yard RFK Stadium <strong>DC</strong>/MD Boundary<br />
Confluence NE &<br />
NW Branch<br />
No Phase 1 <strong>Control</strong>s 53 134 170 194 163 138<br />
Phase 1 <strong>Control</strong>s 34 91 114 138 161 138<br />
Pump Sta. Rehab. 21 84 112 137 161 138<br />
12 Overflows/yr 11 51 78 128 161 138<br />
8 Overflows/yr 4 37 72 124 161 138<br />
4 Overflows/yr 2 29 66 123 160 138<br />
2 Overflows/yr 1 20 62 122 160 138<br />
0 Overflows/yr 0 19 60 121 160 138<br />
Separation 0 65 97 146 160 138<br />
MAY THROUGH SEPTEMBER<br />
# of Days/yr<br />
90<br />
80<br />
70<br />
60<br />
50<br />
40<br />
30<br />
20<br />
10<br />
E. Coli - # of Days Exceeding 576/100 mL<br />
No Phase 1 <strong>Control</strong>s Phase 1 <strong>Control</strong>s Pump Sta. Rehab. 12 Overflows/yr 8 Overflows/yr<br />
4 Overflows/yr 2 Overflows/yr 0 Overflows/yr Separation<br />
0<br />
Haines Point South Capital St. Navy Yard RFK Stadium <strong>DC</strong>/MD Boundary<br />
Confluence NE &<br />
NW Branch<br />
No Phase 1 <strong>Control</strong>s 23 55 67 79 65 58<br />
Phase 1 <strong>Control</strong>s 16 43 48 51 64 58<br />
Pump Sta. Rehab. 9 39 48 50 64 58<br />
12 Overflows/yr 3 22 29 43 64 58<br />
8 Overflows/yr 2 14 25 42 64 58<br />
4 Overflows/yr 1 11 22 41 64 58<br />
2 Overflows/yr 1 6 19 40 64 58<br />
0 Overflows/yr 0 5<br />
Flow<br />
18 40 64 58<br />
Separation 0 25 34 53 64 58<br />
\\Gh-wash\ENG 1160\LTCP\LTCP Final Draft #2 (Board)\App B-Ana WQ\[LTCP_App B_Anacostia.xls]14
District of Columbia <strong>Water</strong> and <strong>Sewer</strong> Authority<br />
<strong>Combined</strong> <strong>Sewer</strong> <strong>System</strong> <strong>Long</strong> <strong>Term</strong> <strong>Control</strong> <strong>Plan</strong><br />
Figure B-10<br />
Anacostia River: Effect of CSO <strong>Control</strong> on Dissolved Oxygen Concentration<br />
(No Change in Upstream or Stormwater Loads)<br />
Dissolved Oxygen - # of Days Dissolved Oxygen
District of Columbia <strong>Water</strong> and <strong>Sewer</strong> Authority<br />
<strong>Combined</strong> <strong>Sewer</strong> <strong>System</strong> <strong>Long</strong> <strong>Term</strong> <strong>Control</strong> <strong>Plan</strong><br />
Figure B-11<br />
Anacostia River: Effect of CSO <strong>Control</strong> on Dissolved Oxygen Concentration<br />
(No Change in Upstream or Stormwater Loads)<br />
Dissolved Oxygen - # of Days Dissolved Oxygen
District of Columbia <strong>Water</strong> and <strong>Sewer</strong> Authority<br />
<strong>Combined</strong> <strong>Sewer</strong> <strong>System</strong> <strong>Long</strong> <strong>Term</strong> <strong>Control</strong> <strong>Plan</strong><br />
Figure B-12<br />
Anacostia River: Effect of CSO <strong>Control</strong> on Fecal Coliform Concentrations<br />
(CSO Loads Only - no other loads present)<br />
Fecal Coliforms - # of Days of CSO Impact<br />
No Phase 1 <strong>Control</strong>s Phase 1 <strong>Control</strong>s Flow Pump Sta. Rehab. 12 Events/yr 8 Events/yr<br />
4 Events/yr 2 Events/yr 0 Overflows/yr Separation<br />
250<br />
200<br />
ENTIRE CALENDAR YEAR<br />
# of Days/yr<br />
150<br />
100<br />
50<br />
0<br />
Haines Point South Capital St. Navy Yard RFK Stadium <strong>DC</strong>/MD Boundary<br />
Confluence NE &<br />
NW Branch<br />
No Phase 1 <strong>Control</strong>s 88 192 212 216 8 0<br />
Phase 1 <strong>Control</strong>s 66 121 125 92 3 0<br />
Pump Sta. Rehab. 65 115 120 89 2 0<br />
12 Events/yr 32 51 49 39 3 0<br />
8 Events/yr 19 32 30 24 2 0<br />
4 Events/yr 7 15 15 14 1 0<br />
2 Events/yr 1 4 4 4 0 0<br />
0 Overflows/yr 0 0 0 0 0 0<br />
Separation 0 0 0 0 0 0<br />
MAY THROUGH SEPTEMBER<br />
# of Days/yr<br />
Fecal Coliforms - # of Days of CSO Impact<br />
No Phase 1 <strong>Control</strong>s Phase 1 <strong>Control</strong>s Pump Sta. Rehab. 12 Events/yr 8 Events/yr<br />
4 Events/yr 2 Events/yr 0 Overflows/yr Separation<br />
100<br />
90<br />
80<br />
70<br />
60<br />
50<br />
40<br />
30<br />
20<br />
10<br />
0<br />
Haines Point South Capital St. Navy Yard RFK Stadium <strong>DC</strong>/MD Boundary<br />
Confluence NE &<br />
NW Branch<br />
No Phase 1 <strong>Control</strong>s 42 74 84 90 6 0<br />
Phase 1 <strong>Control</strong>s 31 56 58 43 2 0<br />
Pump Sta. Rehab. 31 53 56 43 1 0<br />
12 Events/yr 14 24 24 19 2 0<br />
8 Events/yr 9 15 14 12 2 0<br />
4 Events/yr 5 9 8 8 1 0<br />
2 Events/yr 1 4 4 4 0 0<br />
0 Overflows/yr 0 Flow 0 0 0 0 0<br />
Separation 0 0 0 0 0 0<br />
J:\1160\LTCP\LTCP Final Draft #2 (Board)\App B-Ana WQ\[Fib B-15xls.xls]21
District of Columbia <strong>Water</strong> and <strong>Sewer</strong> Authority<br />
<strong>Combined</strong> <strong>Sewer</strong> <strong>System</strong> <strong>Long</strong> <strong>Term</strong> <strong>Control</strong> <strong>Plan</strong><br />
Figure B-13<br />
Anacostia River: Effect of CSO <strong>Control</strong> on Fecal Coliform Concentrations<br />
(CSO Loads Only - no other loads present)<br />
E. Coli - # of Days of CSO Impact (>126 /100 mL)<br />
No Phase 1 <strong>Control</strong>s Phase 1 <strong>Control</strong>s Flow Pump Sta. Rehab. 12 Events/yr 8 Events/yr<br />
4 Events/yr 2 Events/yr 0 Overflows/yr Separation<br />
250<br />
200<br />
ENTIRE CALENDAR YEAR<br />
# of Days/yr<br />
150<br />
100<br />
50<br />
0<br />
Haines Point South Capital St. Navy Yard RFK Stadium <strong>DC</strong>/MD Boundary<br />
Confluence NE &<br />
NW Branch<br />
No Phase 1 <strong>Control</strong>s 92 197 217 222 9 0<br />
Phase 1 <strong>Control</strong>s 70 127 127 94 3 0<br />
Pump Sta. Rehab. 66 120 123 90 2 0<br />
12 Events/yr 34 52 50 40 3 0<br />
8 Events/yr 20 33 31 25 2 0<br />
4 Events/yr 8 15 16 15 1 0<br />
2 Events/yr 2 4 4 4 0 0<br />
0 Overflows/yr 0 0 0 0 0 0<br />
Separation 0 0 0 0 0 0<br />
MAY THROUGH SEPTEMBER<br />
# of Days/yr<br />
E. Coli - # of Days of CSO Impact (>126 /100 mL)<br />
No Phase 1 <strong>Control</strong>s Phase 1 <strong>Control</strong>s Pump Sta. Rehab. 12 Events/yr 8 Events/yr<br />
4 Events/yr 2 Events/yr 0 Overflows/yr Separation<br />
100<br />
90<br />
80<br />
70<br />
60<br />
50<br />
40<br />
30<br />
20<br />
10<br />
0<br />
Haines Point South Capital St. Navy Yard RFK Stadium <strong>DC</strong>/MD Boundary<br />
Confluence NE &<br />
NW Branch<br />
No Phase 1 <strong>Control</strong>s 43 75 86 93 6 0<br />
Phase 1 <strong>Control</strong>s 34 57 58 44 2 0<br />
Pump Sta. Rehab. 33 54 57 44 1 0<br />
12 Events/yr 14 25 24 19 2 0<br />
8 Events/yr 11 16 15 12 2 0<br />
4 Events/yr 5 9 8 8 1 0<br />
2 Events/yr 2 4 4 4 0 0<br />
0 Overflows/yr 0 0<br />
Flow<br />
0 0 0 0<br />
Separation 0 0 0 0 0 0<br />
J:\1160\LTCP\LTCP Final Draft #2 (Board)\App B-Ana WQ\[Fib B-15xls.xls]21
District of Columbia <strong>Water</strong> and <strong>Sewer</strong> Authority<br />
<strong>Combined</strong> <strong>Sewer</strong> <strong>System</strong> <strong>Long</strong> <strong>Term</strong> <strong>Control</strong> <strong>Plan</strong><br />
Figure B-14<br />
Anacostia River: Effect of CSO <strong>Control</strong> on Fecal Coliform Concentrations<br />
(CSO Loads Only - no other loads present)<br />
E. Coli - # of Days of CSO Impact (>576 /100 mL)<br />
No Phase 1 <strong>Control</strong>s Phase 1 <strong>Control</strong>s Flow Pump Sta. Rehab. 12 Events/yr 8 Events/yr<br />
4 Events/yr 2 Events/yr 0 Overflows/yr Separation<br />
ENTIRE CALENDAR YEAR<br />
# of Days/yr<br />
180<br />
160<br />
140<br />
120<br />
100<br />
80<br />
60<br />
40<br />
20<br />
0<br />
Haines Point South Capital St. Navy Yard RFK Stadium <strong>DC</strong>/MD Boundary<br />
Confluence NE &<br />
NW Branch<br />
No Phase 1 <strong>Control</strong>s 49 123 149 154 2 0<br />
Phase 1 <strong>Control</strong>s 27 75 79 62 0 0<br />
Pump Sta. Rehab. 21 68 74 61 0 0<br />
12 Events/yr 9 37 38 30 0 0<br />
8 Events/yr 3 21 21 16 0 0<br />
4 Events/yr 1 11 11 11 0 0<br />
2 Events/yr 0 1 3 3 0 0<br />
0 Overflows/yr 0 0 0 0 0 0<br />
Separation 0 0 0 0 0 0<br />
80<br />
70<br />
60<br />
E. Coli - # of Days of CSO Impact (>576 /100 mL)<br />
No Phase 1 <strong>Control</strong>s Phase 1 <strong>Control</strong>s Pump Sta. Rehab. 12 Events/yr 8 Events/yr<br />
4 Events/yr 2 Events/yr 0 Overflows/yr Separation<br />
MAY THROUGH SEPTEMBER<br />
# of Days/yr<br />
50<br />
40<br />
30<br />
20<br />
10<br />
0<br />
Haines Point South Capital St. Navy Yard RFK Stadium <strong>DC</strong>/MD Boundary<br />
Confluence NE &<br />
NW Branch<br />
No Phase 1 <strong>Control</strong>s 22 53 61 68 2 0<br />
Phase 1 <strong>Control</strong>s 12 38 41 32 0 0<br />
Pump Sta. Rehab. 9 34 39 32 0 0<br />
12 Events/yr 3 17 19 15 0 0<br />
8 Events/yr 2 10 10 10 0 0<br />
4 Events/yr 1 7 6 7 0 0<br />
2 Events/yr 0 1 3 3 0 0<br />
0 Overflows/yr 0 0<br />
Flow<br />
0 0 0 0<br />
Separation 0 0 0 0 0 0<br />
J:\1160\LTCP\LTCP Final Draft #2 (Board)\App B-Ana WQ\[Fib B-15xls.xls]21
District of Columbia <strong>Water</strong> and <strong>Sewer</strong> Authority<br />
<strong>Combined</strong> <strong>Sewer</strong> <strong>System</strong> <strong>Long</strong> <strong>Term</strong> <strong>Control</strong> <strong>Plan</strong><br />
Figure B-15<br />
Anacostia River: Effect of CSO <strong>Control</strong> on Fecal Coliform Concentrations<br />
(Upstream and Stormwater Load Reduction 1 )<br />
Fecal Coliforms - # of Months Exceeding Class A Standard<br />
No Phase 1 <strong>Control</strong>s Phase 1 <strong>Control</strong>s FlowPump Sta. Rehab. 12 Overflows/yr 8 Overflows/yr<br />
4 Overflows/yr 2 Overflows/yr 0 Overflows/yr Separation<br />
12<br />
10<br />
ENTIRE CALENDAR YEAR<br />
# of Months/yr<br />
8<br />
6<br />
4<br />
2<br />
0<br />
Haines Point South Capital St. Navy Yard RFK Stadium <strong>DC</strong>/MD Boundary<br />
Confluence NE &<br />
NW Branch<br />
No Phase 1 <strong>Control</strong>s 1 9 10 11 3 0<br />
Phase 1 <strong>Control</strong>s 0 5 5 7 3 0<br />
Pump Sta. Rehab. 0 2 5 7 3 0<br />
12 Overflows/yr 0 1 2 3 3 0<br />
8 Overflows/yr 0 0 1 3 3 0<br />
4 Overflows/yr 0 0 1 3 3 0<br />
2 Overflows/yr 0 0 1 3 3 0<br />
0 Overflows/yr 0 0 0 3 3 0<br />
Separation 0 3 4 7 3 0<br />
Fecal Coliforms - # of Months Exceeding Class A Standard<br />
No Phase 1 <strong>Control</strong>s Phase 1 <strong>Control</strong>s Pump Sta. Rehab. 12 Overflows/yr 8 Overflows/yr<br />
4 Overflows/yr 2 Overflows/yr 0 Overflows/yr Separation<br />
5<br />
4<br />
MAY THROUGH SEPTEMBER<br />
# of Months/yr<br />
3<br />
2<br />
1<br />
0<br />
Haines Point South Capital St. Navy Yard RFK Stadium <strong>DC</strong>/MD Boundary<br />
Confluence NE &<br />
NW Branch<br />
No Phase 1 <strong>Control</strong>s 1 3 3 4 1 0<br />
Phase 1 <strong>Control</strong>s 0 2 2 2 1 0<br />
Pump Sta. Rehab. 0 1 2 2 1 0<br />
12 Overflows/yr 0 1 1 1 1 0<br />
8 Overflows/yr 0 0 1 1 1 0<br />
4 Overflows/yr 0 0 1 1 1 0<br />
2 Overflows/yr 0 0 1 1 1 0<br />
0 Overflows/yr 0 0 0 1 1 0<br />
Separation 0<br />
Flow<br />
1 1 1 1 0<br />
J:\1160\LTCP\LTCP Final Draft #2 (Board)\App B-Ana WQ\[Fib B-15xls.xls]21<br />
1 Storm water: 40% reduction in loads, Upstream: 40% reduction in nutrients<br />
Fecal coliforms at 80% of water quality standard (concentration = 160/100 ml)
District of Columbia <strong>Water</strong> and <strong>Sewer</strong> Authority<br />
<strong>Combined</strong> <strong>Sewer</strong> <strong>System</strong> <strong>Long</strong> <strong>Term</strong> <strong>Control</strong> <strong>Plan</strong><br />
Figure B-16<br />
Anacostia River: Effect of CSO <strong>Control</strong> on Fecal Coliform Concentrations<br />
(Upstream and Stormwater Load Reduction 1 )<br />
Fecal Coliforms - # of Months Exceeding Class B Standard<br />
No Phase 1 <strong>Control</strong>s Phase 1 <strong>Control</strong>s FlowPump Sta. Rehab. 12 Overflows/yr 8 Overflows/yr<br />
4 Overflows/yr 2 Overflows/yr 0 Overflows/yr Separation<br />
3<br />
ENTIRE CALENDAR YEAR<br />
# of Months/yr<br />
2<br />
1<br />
0<br />
Haines Point South Capital St. Navy Yard RFK Stadium <strong>DC</strong>/MD Boundary<br />
Confluence NE &<br />
NW Branch<br />
No Phase 1 <strong>Control</strong>s 0 1 2 2 0 0<br />
Phase 1 <strong>Control</strong>s 0 0 0 0 0 0<br />
Pump Sta. Rehab. 0 0 0 0 0 0<br />
12 Overflows/yr 0 0 0 0 0 0<br />
8 Overflows/yr 0 0 0 0 0 0<br />
4 Overflows/yr 0 0 0 0 0 0<br />
2 Overflows/yr 0 0 0 0 0 0<br />
0 Overflows/yr 0 0 0 0 0 0<br />
Separation 0 0 0 0 0 0<br />
Fecal Coliforms - # of Months Exceeding Class B Standard<br />
MAY THROUGH SEPTEMBER<br />
# of Months/yr<br />
No Phase 1 <strong>Control</strong>s Phase 1 <strong>Control</strong>s Pump Sta. Rehab. 12 Overflows/yr 8 Overflows/yr<br />
4 Overflows/yr 2 Overflows/yr 0 Overflows/yr Separation<br />
9<br />
8<br />
7<br />
6<br />
5<br />
4<br />
3<br />
2<br />
1<br />
0<br />
Haines Point South Capital St. Navy Yard RFK Stadium <strong>DC</strong>/MD Boundary<br />
Confluence NE &<br />
NW Branch<br />
No Phase 1 <strong>Control</strong>s 0 1 1 1 0 0<br />
Phase 1 <strong>Control</strong>s 0 0 0 0 0 0<br />
Pump Sta. Rehab. 0 0 0 0 0 0<br />
12 Overflows/yr 0 0 0 0 0 0<br />
8 Overflows/yr 0 0 0 0 0 0<br />
4 Overflows/yr 0 0 0 0 0 0<br />
2 Overflows/yr 0 0 0 0 0 0<br />
0 Overflows/yr 0 0<br />
Flow<br />
0 0 0 0<br />
Separation 0 0 0 0 0 0<br />
J:\1160\LTCP\LTCP Final Draft #2 (Board)\App B-Ana WQ\[Fib B-15xls.xls]21<br />
1 Storm water: 40% reduction in loads, Upstream: 40% reduction in nutrients<br />
Fecal coliforms at 80% of water quality standard (concentration = 160/100 ml)
District of Columbia <strong>Water</strong> and <strong>Sewer</strong> Authority<br />
<strong>Combined</strong> <strong>Sewer</strong> <strong>System</strong> <strong>Long</strong> <strong>Term</strong> <strong>Control</strong> <strong>Plan</strong><br />
Figure B-17<br />
Anacostia River: Effect of CSO <strong>Control</strong> on Fecal Coliform Concentrations<br />
(Upstream and Stormwater Load Reduction 1 )<br />
Fecal Coliforms - # of Days >200/100ml<br />
No Phase 1 <strong>Control</strong>s Phase 1 <strong>Control</strong>s Flow Pump Sta. Rehab. 12 Overflows/yr 8 Overflows/yr<br />
4 Overflows/yr 2 Overflows/yr 0 Overflows/yr Separation<br />
250<br />
200<br />
ENTIRE CALENDAR YEAR<br />
# of Days/yr<br />
150<br />
100<br />
50<br />
0<br />
Haines Point South Capital St. Navy Yard RFK Stadium <strong>DC</strong>/MD Boundary<br />
Confluence NE &<br />
NW Branch<br />
No Phase 1 <strong>Control</strong>s 95 202 222 234 137 111<br />
Phase 1 <strong>Control</strong>s 71 138 162 167 132 111<br />
Pump Sta. Rehab. 61 134 158 166 132 111<br />
12 Overflows/yr 36 78 115 151 133 111<br />
8 Overflows/yr 22 66 108 147 132 111<br />
4 Overflows/yr 9 58 104 144 132 111<br />
2 Overflows/yr 2 52 99 142 131 111<br />
0 Overflows/yr 0 50 98 141 131 111<br />
Separation 14 151 174 194 136 111<br />
Fecal Coliforms - # of Days >200/100ml<br />
No Phase 1 <strong>Control</strong>s Phase 1 <strong>Control</strong>s Pump Sta. Rehab. 12 Overflows/yr 8 Overflows/yr<br />
4 Overflows/yr 2 Overflows/yr 0 Overflows/yr Separation<br />
MAY THROUGH SEPTEMBER<br />
# of Days/yr<br />
100<br />
90<br />
80<br />
70<br />
60<br />
50<br />
40<br />
30<br />
20<br />
10<br />
0<br />
Haines Point South Capital St. Navy Yard RFK Stadium <strong>DC</strong>/MD Boundary<br />
Confluence NE &<br />
NW Branch<br />
No Phase 1 <strong>Control</strong>s 44 75 87 95 56 48<br />
Phase 1 <strong>Control</strong>s 34 59 64 63 53 48<br />
Pump Sta. Rehab. 29 58 63 63 53 48<br />
12 Overflows/yr 15 32 43 55 53 48<br />
8 Overflows/yr 11 26 40 54 53 48<br />
4 Overflows/yr 6 23 38 52 53 48<br />
2 Overflows/yr 2 20 37 52 53 48<br />
0 Overflows/yr 0 18 36 51 52 48<br />
Separation 3<br />
Flow<br />
54 62 72 54 48<br />
J:\1160\LTCP\LTCP Final Draft #2 (Board)\App B-Ana WQ\[Fib B-15xls.xls]21<br />
1 Storm water: 40% reduction in loads, Upstream: 40% reduction in nutrients<br />
Fecal coliforms at 80% of water quality standard (concentration = 160/100 ml)
District of Columbia <strong>Water</strong> and <strong>Sewer</strong> Authority<br />
<strong>Combined</strong> <strong>Sewer</strong> <strong>System</strong> <strong>Long</strong> <strong>Term</strong> <strong>Control</strong> <strong>Plan</strong><br />
Figure B-18<br />
Anacostia River: Effect of CSO <strong>Control</strong> on Fecal Coliform Concentrations<br />
(Upstream and Stormwater Load Reduction 1 )<br />
Fecal Coliforms - May Geometric Means<br />
No Phase 1 <strong>Control</strong>s Phase 1 <strong>Control</strong>s Flow Pump Sta. Rehab. 12 Overflows/yr 8 Overflows/yr<br />
4 Overflows/yr 2 Overflows/yr 0 Overflows/yr Separation<br />
3,000<br />
2,500<br />
MPN/100 mL<br />
2,000<br />
1,500<br />
1,000<br />
500<br />
0<br />
Haines Point South Capital St. Navy Yard RFK Stadium <strong>DC</strong>/MD Boundary<br />
Confluence NE &<br />
NW Branch<br />
No Phase 1 <strong>Control</strong>s 299 1,998 2,298 2,591 240 173<br />
Phase 1 <strong>Control</strong>s 165 750 777 667 237 173<br />
Pump Sta. Rehab. 140 641 750 672 237 173<br />
12 Overflows/yr 87 247 335 428 236 173<br />
8 Overflows/yr 74 162 241 345 236 173<br />
4 Overflows/yr 61 129 211 320 236 173<br />
2 Overflows/yr 60 124 206 316 236 173<br />
0 Overflows/yr 52 97 178 282 236 173<br />
Separation 86 339 424 580 243 173<br />
Fecal Coliforms - June Geometric Means<br />
No Phase 1 <strong>Control</strong>s Phase 1 <strong>Control</strong>s Pump Sta. Rehab. 12 Overflows/yr 8 Overflows/yr<br />
4 Overflows/yr 2 Overflows/yr 0 Overflows/yr Separation<br />
800<br />
700<br />
600<br />
MPN/100 mL<br />
500<br />
400<br />
300<br />
200<br />
100<br />
0<br />
Haines Point South Capital St. Navy Yard RFK Stadium <strong>DC</strong>/MD Boundary<br />
Confluence NE &<br />
NW Branch<br />
No Phase 1 <strong>Control</strong>s 123 455 554 704 142 156<br />
Phase 1 <strong>Control</strong>s 88 208 220 210 136 156<br />
Pump Sta. Rehab. 74 180 208 206 136 156<br />
12 Overflows/yr 53 119 137 172 138 156<br />
8 Overflows/yr 40 68 86 135 138 156<br />
4 Overflows/yr 29 39 61 106 135 156<br />
2 Overflows/yr 27 28 48 88 135 156<br />
0 Overflows/yr 27 28<br />
Flow<br />
48 88 135 156<br />
Separation 36 71 94 151 139 156<br />
J:\1160\LTCP\LTCP Final Draft #2 (Board)\App B-Ana WQ\[Fib B-15xls.xls]21<br />
1 Storm water: 40% reduction in loads, Upstream: 40% reduction in nutrients<br />
Fecal coliforms at 80% of water quality standard (concentration = 160/100 ml)
District of Columbia <strong>Water</strong> and <strong>Sewer</strong> Authority<br />
<strong>Combined</strong> <strong>Sewer</strong> <strong>System</strong> <strong>Long</strong> <strong>Term</strong> <strong>Control</strong> <strong>Plan</strong><br />
Figure B-19<br />
Anacostia River: Effect of CSO <strong>Control</strong> on Fecal Coliform Concentrations<br />
(Upstream and Stormwater Load Reduction 1 )<br />
Fecal Coliforms - July Fecal Coliforms<br />
No Phase 1 <strong>Control</strong>s Phase 1 <strong>Control</strong>s Flow Pump Sta. Rehab. 12 Overflows/yr 8 Overflows/yr<br />
4 Overflows/yr 2 Overflows/yr 0 Overflows/yr Separation<br />
600<br />
500<br />
MPN/100 mL<br />
400<br />
300<br />
200<br />
100<br />
0<br />
Haines Point South Capital St. Navy Yard RFK Stadium <strong>DC</strong>/MD Boundary<br />
Confluence NE &<br />
NW Branch<br />
No Phase 1 <strong>Control</strong>s 65 230 350 544 113 148<br />
Phase 1 <strong>Control</strong>s 51 118 143 157 109 148<br />
Pump Sta. Rehab. 45 104 135 154 109 148<br />
12 Overflows/yr 26 32 50 82 108 148<br />
8 Overflows/yr 23 28 44 73 107 148<br />
4 Overflows/yr 21 24 37 64 107 148<br />
2 Overflows/yr 18 16 27 53 106 148<br />
0 Overflows/yr 18 14 24 47 106 148<br />
Separation 25 51 61 104 112 148<br />
Fecal Coliforms - August Fecal Coliforms<br />
No Phase 1 <strong>Control</strong>s Phase 1 <strong>Control</strong>s Pump Sta. Rehab. 12 Overflows/yr 8 Overflows/yr<br />
4 Overflows/yr 2 Overflows/yr 0 Overflows/yr Separation<br />
350<br />
300<br />
MPN/100 mL<br />
250<br />
200<br />
150<br />
100<br />
50<br />
0<br />
Haines Point South Capital St. Navy Yard RFK Stadium <strong>DC</strong>/MD Boundary<br />
Confluence NE &<br />
NW Branch<br />
No Phase 1 <strong>Control</strong>s 38 121 188 333 92 127<br />
Phase 1 <strong>Control</strong>s 28 48 63 84 86 127<br />
Pump Sta. Rehab. 23 38 59 83 86 127<br />
12 Overflows/yr 14 20 33 63 85 127<br />
8 Overflows/yr 13 18 31 59 85 127<br />
4 Overflows/yr 12 16 26 52 84 127<br />
2 Overflows/yr 10 10 20 43 83 126<br />
0 Overflows/yr 9 9 18 39 82 126<br />
Flow<br />
Separation 13 28 40 76 86 126<br />
J:\1160\LTCP\LTCP Final Draft #2 (Board)\App B-Ana WQ\[Fib B-15xls.xls]21<br />
1 Storm water: 40% reduction in loads, Upstream: 40% reduction in nutrients<br />
Fecal coliforms at 80% of water quality standard (concentration = 160/100 ml)
District of Columbia <strong>Water</strong> and <strong>Sewer</strong> Authority<br />
<strong>Combined</strong> <strong>Sewer</strong> <strong>System</strong> <strong>Long</strong> <strong>Term</strong> <strong>Control</strong> <strong>Plan</strong><br />
Figure B-20<br />
Anacostia River: Effect of CSO <strong>Control</strong> on Fecal Coliform Concentrations<br />
(Upstream and Stormwater Load Reduction 1 )<br />
Fecal Coliforms - September Geometric Means<br />
No Phase 1 <strong>Control</strong>s Phase 1 <strong>Control</strong>s Flow Pump Sta. Rehab. 12 Overflows/yr 8 Overflows/yr<br />
4 Overflows/yr 2 Overflows/yr 0 Overflows/yr Separation<br />
MPN/100 mL<br />
200<br />
180<br />
160<br />
140<br />
120<br />
100<br />
80<br />
60<br />
40<br />
20<br />
0<br />
Haines Point South Capital St. Navy Yard RFK Stadium <strong>DC</strong>/MD Boundary<br />
Confluence NE &<br />
NW Branch<br />
No Phase 1 <strong>Control</strong>s 47 64 87 186 91 141<br />
Phase 1 <strong>Control</strong>s 36 31 30 44 84 141<br />
Pump Sta. Rehab. 32 28 28 43 84 141<br />
12 Overflows/yr 17 13 15 29 82 141<br />
8 Overflows/yr 16 11 13 27 82 141<br />
4 Overflows/yr 15 10 13 26 82 141<br />
2 Overflows/yr 13 9 12 24 82 141<br />
0 Overflows/yr 13 9 12 24 82 141<br />
Separation 19 27 28 52 87 141<br />
J:\1160\LTCP\LTCP Final Draft #2 (Board)\App B-Ana WQ\[Fib B-15xls.xls]21<br />
1 Storm water: 40% reduction in loads, Upstream: 40% reduction in nutrients<br />
Fecal coliforms at 80% of water quality standard (concentration = 160/100 ml)
District of Columbia <strong>Water</strong> and <strong>Sewer</strong> Authority<br />
<strong>Combined</strong> <strong>Sewer</strong> <strong>System</strong> <strong>Long</strong> <strong>Term</strong> <strong>Control</strong> <strong>Plan</strong><br />
Figure B-21<br />
Anacostia River: Effect of CSO <strong>Control</strong> on Fecal Coliform Concentrations<br />
(Upstream and Stormwater Load Reduction 1 )<br />
E. Coli - # of Months Exceeding 126/ 100 mL<br />
No Phase 1 <strong>Control</strong>s Phase 1 <strong>Control</strong>s FlowPump Sta. Rehab. 12 Overflows/yr 8 Overflows/yr<br />
4 Overflows/yr 2 Overflows/yr 0 Overflows/yr Separation<br />
12<br />
10<br />
ENTIRE CALENDAR YEAR<br />
# of Months/yr<br />
8<br />
6<br />
4<br />
2<br />
0<br />
Haines Point South Capital St. Navy Yard RFK Stadium <strong>DC</strong>/MD Boundary<br />
Confluence NE &<br />
NW Branch<br />
No Phase 1 <strong>Control</strong>s 1 9 11 12 2 0<br />
Phase 1 <strong>Control</strong>s 0 4 6 6 2 0<br />
Pump Sta. Rehab. 0 2 5 6 2 0<br />
12 Overflows/yr 0 1 2 3 2 0<br />
8 Overflows/yr 0 0 1 3 2 0<br />
4 Overflows/yr 0 0 0 3 2 0<br />
2 Overflows/yr 0 0 0 3 2 0<br />
0 Overflows/yr 0 0 0 3 2 0<br />
Separation 0 3 4 6 3 0<br />
E. Coli - # of Months Exceeding 126/ 100 mL<br />
No Phase 1 <strong>Control</strong>s Phase 1 <strong>Control</strong>s Pump Sta. Rehab. 12 Overflows/yr 8 Overflows/yr<br />
4 Overflows/yr 2 Overflows/yr 0 Overflows/yr Separation<br />
6<br />
5<br />
MAY THROUGH SEPTEMBER<br />
# of Months/yr<br />
4<br />
3<br />
2<br />
1<br />
0<br />
Haines Point South Capital St. Navy Yard RFK Stadium <strong>DC</strong>/MD Boundary<br />
Confluence NE &<br />
NW Branch<br />
No Phase 1 <strong>Control</strong>s 1 3 4 5 1 0<br />
Phase 1 <strong>Control</strong>s 0 2 2 2 1 0<br />
Pump Sta. Rehab. 0 1 2 2 1 0<br />
12 Overflows/yr 0 1 1 1 1 0<br />
8 Overflows/yr 0 0 1 1 1 0<br />
4 Overflows/yr 0 0 0 1 1 0<br />
2 Overflows/yr 0 0 0 1 1 0<br />
0 Overflows/yr 0 0<br />
Flow<br />
0 1 1 0<br />
Separation 0 1 1 1 1 0<br />
J:\1160\LTCP\LTCP Final Draft #2 (Board)\App B-Ana WQ\[Fib B-15xls.xls]21<br />
1 Storm water: 40% reduction in loads, Upstream: 40% reduction in nutrients<br />
Fecal coliforms at 80% of water quality standard (concentration = 160/100 ml)
District of Columbia <strong>Water</strong> and <strong>Sewer</strong> Authority<br />
<strong>Combined</strong> <strong>Sewer</strong> <strong>System</strong> <strong>Long</strong> <strong>Term</strong> <strong>Control</strong> <strong>Plan</strong><br />
Figure B-22<br />
Anacostia River: Effect of CSO <strong>Control</strong> on Fecal Coliform Concentrations<br />
(Upstream and Stormwater Load Reduction 1 )<br />
E. Coli - # of Days Exceeding 126/100 mL<br />
No Phase 1 <strong>Control</strong>s Phase 1 <strong>Control</strong>s FlowPump Sta. Rehab. 12 Overflows/yr 8 Overflows/yr<br />
4 Overflows/yr 2 Overflows/yr 0 Overflows/yr Separation<br />
250<br />
200<br />
ENTIRE CALENDAR YEAR<br />
# of days/yr<br />
150<br />
100<br />
50<br />
0<br />
Haines Point South Capital St. Navy Yard RFK Stadium <strong>DC</strong>/MD Boundary<br />
Confluence NE &<br />
NW Branch<br />
No Phase 1 <strong>Control</strong>s 100 205 228 237 133 108<br />
Phase 1 <strong>Control</strong>s 75 140 162 164 128 108<br />
Pump Sta. Rehab. 64 136 157 163 128 108<br />
12 Overflows/yr 39 75 110 145 128 108<br />
8 Overflows/yr 23 63 103 140 128 108<br />
4 Overflows/yr 10 54 98 137 128 108<br />
2 Overflows/yr 3 46 93 134 127 108<br />
0 Overflows/yr 0 43 92 134 127 108<br />
Separation 11 146 166 188 131 108<br />
MAY THROUGH SEPTEMBER<br />
# of days/yr<br />
E. Coli - # of Days Exceeding 126/100 mL<br />
No Phase 1 <strong>Control</strong>s Phase 1 <strong>Control</strong>s Pump Sta. Rehab. 12 Overflows/yr 8 Overflows/yr<br />
4 Overflows/yr 2 Overflows/yr 0 Overflows/yr Separation<br />
100<br />
90<br />
80<br />
70<br />
60<br />
50<br />
40<br />
30<br />
20<br />
10<br />
0<br />
Haines Point South Capital St. Navy Yard RFK Stadium <strong>DC</strong>/MD Boundary<br />
Confluence NE &<br />
NW Branch<br />
No Phase 1 <strong>Control</strong>s 46 77 88 95 54 47<br />
Phase 1 <strong>Control</strong>s 36 60 64 62 52 47<br />
Pump Sta. Rehab. 32 59 62 61 52 47<br />
12 Overflows/yr 17 32 41 53 52 47<br />
8 Overflows/yr 12 26 39 52 52 47<br />
4 Overflows/yr 6 22 36 50 52 47<br />
2 Overflows/yr 2 18 35 50 52 47<br />
0 Overflows/yr 0 15 34 49 51 47<br />
Flow<br />
Separation 3 51 60 70 53 47<br />
J:\1160\LTCP\LTCP Final Draft #2 (Board)\App B-Ana WQ\[Fib B-15xls.xls]21<br />
1 Storm water: 40% reduction in loads, Upstream: 40% reduction in nutrients<br />
Fecal coliforms at 80% of water quality standard (concentration = 160/100 ml)
District of Columbia <strong>Water</strong> and <strong>Sewer</strong> Authority<br />
<strong>Combined</strong> <strong>Sewer</strong> <strong>System</strong> <strong>Long</strong> <strong>Term</strong> <strong>Control</strong> <strong>Plan</strong><br />
Figure B-23<br />
Anacostia River: Effect of CSO <strong>Control</strong> on Fecal Coliform Concentrations<br />
(Upstream and Stormwater Load Reduction 1 )<br />
E. Coli - # of Days Exceeding 576/100 mL<br />
No Phase 1 <strong>Control</strong>s Phase 1 <strong>Control</strong>s Flow Pump Sta. Rehab. 12 Overflows/yr 8 Overflows/yr<br />
4 Overflows/yr 2 Overflows/yr 0 Overflows/yr Separation<br />
ENTIRE CALENDAR YEAR<br />
# of days/yr<br />
180<br />
160<br />
140<br />
120<br />
100<br />
80<br />
60<br />
40<br />
20<br />
0<br />
Haines Point South Capital St. Navy Yard RFK Stadium <strong>DC</strong>/MD Boundary<br />
Confluence NE &<br />
NW Branch<br />
No Phase 1 <strong>Control</strong>s 51 128 159 164 32 14<br />
Phase 1 <strong>Control</strong>s 31 77 86 79 31 14<br />
Pump Sta. Rehab. 20 71 84 77 31 14<br />
12 Overflows/yr 10 40 43 52 30 14<br />
8 Overflows/yr 3 23 29 44 30 14<br />
4 Overflows/yr 1 12 19 40 29 14<br />
2 Overflows/yr 0 2 12 37 29 14<br />
0 Overflows/yr 0 0 10 36 29 14<br />
Separation 0 43 58 89 30 14<br />
E. Coli - # of Days Exceeding 576/100 mL<br />
No Phase 1 <strong>Control</strong>s Phase 1 <strong>Control</strong>s Pump Sta. Rehab. 12 Overflows/yr 8 Overflows/yr<br />
4 Overflows/yr 2 Overflows/yr 0 Overflows/yr Separation<br />
80<br />
70<br />
60<br />
MAY THROUGH SEPTEMBER<br />
# of days/yr<br />
50<br />
40<br />
30<br />
20<br />
10<br />
0<br />
Haines Point South Capital St. Navy Yard RFK Stadium <strong>DC</strong>/MD Boundary<br />
Confluence NE &<br />
NW Branch<br />
No Phase 1 <strong>Control</strong>s 23 54 64 71 14 7<br />
Phase 1 <strong>Control</strong>s 14 39 42 38 13 7<br />
Pump Sta. Rehab. 9 35 42 37 13 7<br />
12 Overflows/yr 3 18 20 21 13 7<br />
8 Overflows/yr 2 11 13 18 13 7<br />
4 Overflows/yr 1 7 8 15 12 7<br />
2 Overflows/yr 0 1 4 14 12 7<br />
0 Overflows/yr 0 0 2 13 12 7<br />
Separation 0 19 Flow<br />
22 36 13 7<br />
J:\1160\LTCP\LTCP Final Draft #2 (Board)\App B-Ana WQ\[Fib B-15xls.xls]21<br />
1 Storm water: 40% reduction in loads, Upstream: 40% reduction in nutrients<br />
Fecal coliforms at 80% of water quality standard (concentration = 160/100 ml)
District of Columbia <strong>Water</strong> and <strong>Sewer</strong> Authority<br />
<strong>Combined</strong> <strong>Sewer</strong> <strong>System</strong> <strong>Long</strong> <strong>Term</strong> <strong>Control</strong> <strong>Plan</strong><br />
Figure B-24<br />
Anacostia River: Effect of CSO <strong>Control</strong> on Dissolved Oxygen Concentration<br />
(Upstream and Stormwater Load Reduction 1 )<br />
Dissolved Oxygen - # of Days Dissolved Oxygen
District of Columbia <strong>Water</strong> and <strong>Sewer</strong> Authority<br />
<strong>Combined</strong> <strong>Sewer</strong> <strong>System</strong> <strong>Long</strong> <strong>Term</strong> <strong>Control</strong> <strong>Plan</strong><br />
Figure B-25<br />
Anacostia River: Effect of CSO <strong>Control</strong> on Dissolved Oxygen Concentration<br />
(Upstream and Stormwater Load Reduction 1 )<br />
Dissolved Oxygen - # of Days Dissolved Oxygen
District of Columbia <strong>Water</strong> and <strong>Sewer</strong> Authority<br />
<strong>Combined</strong> <strong>Sewer</strong> <strong>System</strong> <strong>Long</strong> <strong>Term</strong> <strong>Control</strong> <strong>Plan</strong><br />
APPENDIX C<br />
Effect of CSO <strong>Control</strong>s on <strong>Water</strong> Quality<br />
Potomac River<br />
\\Gh-wash\ENG 1160\LTCP\LTCP Final Draft #2 (Board)\App C-Pot WQ\Appendix C.DOC
District of Columbia <strong>Water</strong> and <strong>Sewer</strong> Authority<br />
<strong>Combined</strong> <strong>Sewer</strong> <strong>System</strong> <strong>Long</strong> <strong>Term</strong> <strong>Control</strong> <strong>Plan</strong><br />
Table of Contents<br />
Appendix C – Effect of CSO <strong>Control</strong>s on <strong>Water</strong> Quality in Potomac River<br />
Loading<br />
Condition<br />
No Change in<br />
Storm <strong>Water</strong> or<br />
Upstream Loads<br />
Figure<br />
Parameter<br />
C-1 Fecal Coliforms - # of Months Exceeding Class A<br />
Standard<br />
C-2 Fecal Coliforms - # of Days > 200/100ml<br />
C-3 Fecal Coliforms – May/June Geometric Means<br />
C-4 Fecal Coliforms – July/August Geometric Means<br />
C-5 Fecal Coliforms – September Geometric Means<br />
C-6 E. Coli - # of Months Exceeding 126/100 mL<br />
C-7 E. Coli - # of Days Exceeding 126/100 mL<br />
C-8 E. Coli - # of Days Exceeding 576/100 mL<br />
C-9 Dissolved Oxygen - # of Days Dissolved Oxygen<br />
126/100 mL)<br />
loads present C-12 E. Coli - # of Days CSO Impact (>576/100 mL)<br />
Upstream and<br />
Storm <strong>Water</strong><br />
Load Reduction<br />
C-13 Fecal Coliforms - # of Months Exceeding Class A<br />
Standard<br />
C-14 Fecal Coliforms - # of Days > 200/100ml<br />
C-15 Fecal Coliforms – May/June Geometric Means<br />
C-16 Fecal Coliforms – July/August Geometric Means<br />
C-17 Fecal Coliforms – September Geometric Means<br />
C-18 E. Coli - # of Months Exceeding 126/100 mL<br />
C-19 E. Coli - # of Days Exceeding 126/100 mL<br />
C-20 E. Coli - # of Days Exceeding 576/100 mL<br />
C-21 Dissolved Oxygen - # of Days Dissolved Oxygen<br />
District of Columbia <strong>Water</strong> and <strong>Sewer</strong> Authority<br />
<strong>Combined</strong> <strong>Sewer</strong> <strong>System</strong> <strong>Long</strong> <strong>Term</strong> <strong>Control</strong> <strong>Plan</strong><br />
Figure C-1<br />
Potomac River: Effect of CSO <strong>Control</strong> on Fecal Coliform Concentrations<br />
(No Change in Upstream or Stormwater Loads)<br />
Fecal Coliforms - # of Months Exceeding Class A Standard<br />
No Phase 1 <strong>Control</strong>s Phase 1 <strong>Control</strong>s Flow Pump Sta. Rehab. 12 Overflows/yr 8 Overflows/yr<br />
4 Overflows/yr 2 Overflows/yr 0 Overflows/yr Separation<br />
ENTIRE CALENDAR YEAR<br />
# of Months/yr<br />
9<br />
8<br />
7<br />
6<br />
5<br />
4<br />
3<br />
2<br />
1<br />
0<br />
South of Wilson<br />
Bridge<br />
Blue Plains<br />
Confluence w/<br />
Anacostia<br />
Memorial Bridge Georgetown <strong>DC</strong>/MD Boundary<br />
No Phase 1 <strong>Control</strong>s 0 0 1 3 1 8<br />
Phase 1 <strong>Control</strong>s 0 0 0 2 1 8<br />
Pump Sta. Rehab. 0 0 0 1 1 8<br />
12 Overflows/yr 0 0 0 1 1 8<br />
8 Overflows/yr 0 0 0 1 1 8<br />
4 Overflows/yr 0 0 0 1 1 8<br />
2 Overflows/yr 0 0 0 1 1 8<br />
0 Overflows/yr 0 0 0 0 1 8<br />
Separation 0 0 0 1 1 8<br />
Fecal Coliforms - # of Months Exceeding Class A Standard<br />
No Phase 1 <strong>Control</strong>s Phase 1 <strong>Control</strong>s Pump Sta. Rehab. 12 Overflows/yr 8 Overflows/yr<br />
4 Overflows/yr 2 Overflows/yr 0 Overflows/yr Separation<br />
6<br />
5<br />
MAY THROUGH SEPTEMBER<br />
# of Months/yr<br />
4<br />
3<br />
2<br />
1<br />
0<br />
South of Wilson<br />
Bridge<br />
Blue Plains<br />
Confluence w/<br />
Anacostia<br />
Memorial Bridge Georgetown <strong>DC</strong>/MD Boundary<br />
No Phase 1 <strong>Control</strong>s 0 0 1 3 1 5<br />
Phase 1 <strong>Control</strong>s 0 0 0 2 1 5<br />
Pump Sta. Rehab. 0 0 0 1 1 5<br />
12 Overflows/yr 0 0 0 1 1 5<br />
8 Overflows/yr 0 0 0 1 1 5<br />
4 Overflows/yr 0 0 0 1 1 5<br />
2 Overflows/yr 0 0 0 1 1 5<br />
0 Overflows/yr 0 0 0 0 1 5<br />
Flow<br />
Separation 0 0 0 1 1 5<br />
J:\1160\LTCP\LTCP Draft#3\[LTCP_App C_Potomac.xls]Pot-Data
District of Columbia <strong>Water</strong> and <strong>Sewer</strong> Authority<br />
<strong>Combined</strong> <strong>Sewer</strong> <strong>System</strong> <strong>Long</strong> <strong>Term</strong> <strong>Control</strong> <strong>Plan</strong><br />
Figure C-2<br />
Potomac River: Effect of CSO <strong>Control</strong> on Fecal Coliform Concentrations<br />
(No Change in Upstream or Stormwater Loads)<br />
Fecal Coliforms - # of Days >200/100ml<br />
No Phase 1 <strong>Control</strong>s Phase 1 <strong>Control</strong>s FlowPump Sta. Rehab. 12 Overflows/yr 8 Overflows/yr<br />
4 Overflows/yr 2 Overflows/yr 0 Overflows/yr Separation<br />
250<br />
200<br />
ENTIRE CALENDAR YEAR<br />
# of Days/yr<br />
150<br />
100<br />
50<br />
0<br />
South of Wilson<br />
Bridge<br />
Blue Plains<br />
Confluence w/<br />
Anacostia<br />
Memorial Bridge Georgetown <strong>DC</strong>/MD Boundary<br />
No Phase 1 <strong>Control</strong>s 34 52 70 142 160 219<br />
Phase 1 <strong>Control</strong>s 35 48 63 138 160 219<br />
Pump Sta. Rehab. 34 48 58 133 157 219<br />
12 Overflows/yr 21 36 37 112 148 219<br />
8 Overflows/yr 18 29 30 110 148 219<br />
4 Overflows/yr 16 27 24 109 147 219<br />
2 Overflows/yr 15 26 20 109 147 219<br />
0 Overflows/yr 13 21 19 109 147 219<br />
Separation 7 12 23 126 150 219<br />
Fecal Coliforms - # of Days >200/100ml<br />
No Phase 1 <strong>Control</strong>s Phase 1 <strong>Control</strong>s Pump Sta. Rehab. 12 Overflows/yr 8 Overflows/yr<br />
4 Overflows/yr 2 Overflows/yr 0 Overflows/yr Separation<br />
120<br />
100<br />
MAY THROUGH SEPTEMBER<br />
# of Days/yr<br />
80<br />
60<br />
40<br />
20<br />
0<br />
South of Wilson<br />
Bridge<br />
Blue Plains<br />
Confluence w/<br />
Anacostia<br />
Memorial Bridge Georgetown <strong>DC</strong>/MD Boundary<br />
No Phase 1 <strong>Control</strong>s 21 30 39 64 68 98<br />
Phase 1 <strong>Control</strong>s 22 28 36 61 68 98<br />
Pump Sta. Rehab. 22 28 34 59 67 98<br />
12 Overflows/yr 15 23 24 45 60 98<br />
8 Overflows/yr 13 20 20 44 60 98<br />
4 Overflows/yr 12 19 17 44 60 98<br />
2 Overflows/yr 11 18 13 44 59 98<br />
0 Overflows/yr 7 11 10 34 46 98<br />
Separation 2<br />
Flow<br />
7 11 42 47 98<br />
J:\1160\LTCP\LTCP Draft#3\[LTCP_App C_Potomac.xls]Pot-Data
District of Columbia <strong>Water</strong> and <strong>Sewer</strong> Authority<br />
<strong>Combined</strong> <strong>Sewer</strong> <strong>System</strong> <strong>Long</strong> <strong>Term</strong> <strong>Control</strong> <strong>Plan</strong><br />
Figure C-3<br />
Potomac River: Effect of CSO <strong>Control</strong> on Fecal Coliform Concentrations<br />
(No Change in Upstream or Stormwater Loads)<br />
Fecal Coliforms - May Geometric Means<br />
No Phase 1 <strong>Control</strong>s Phase 1 <strong>Control</strong>s Flow Pump Sta. Rehab. 12 Overflows/yr 8 Overflows/yr<br />
4 Overflows/yr 2 Overflows/yr 0 Overflows/yr Separation<br />
350<br />
300<br />
MPN/100 mL<br />
250<br />
200<br />
150<br />
100<br />
50<br />
0<br />
South of Wilson<br />
Bridge<br />
Blue Plains<br />
Confluence w/<br />
Anacostia<br />
Memorial Bridge Georgetown <strong>DC</strong>/MD Boundary<br />
No Phase 1 <strong>Control</strong>s 142 181 214 314 221 246<br />
Phase 1 <strong>Control</strong>s 138 174 200 301 221 246<br />
Pump Sta. Rehab. 132 164 185 281 218 246<br />
12 Overflows/yr 109 133 147 220 205 245<br />
8 Overflows/yr 105 127 139 208 204 245<br />
4 Overflows/yr 103 125 135 204 204 246<br />
2 Overflows/yr 103 124 134 203 204 246<br />
0 Overflows/yr 93 114 130 199 203 246<br />
Separation 91 115 136 209 205 245<br />
Fecal Coliforms - June Geometric Means<br />
No Phase 1 <strong>Control</strong>s Phase 1 <strong>Control</strong>s Pump Sta. Rehab. 12 Overflows/yr 8 Overflows/yr<br />
4 Overflows/yr 2 Overflows/yr 0 Overflows/yr Separation<br />
250<br />
200<br />
MPN/100 mL<br />
150<br />
100<br />
50<br />
0 Overflows/yr 29 42 49 110 127 204<br />
Flow<br />
Separation 27 42 53 127 130 204<br />
J:\1160\LTCP\LTCP Draft#3\[LTCP_App C_Potomac.xls]Pot-Data<br />
0<br />
South of Wilson<br />
Bridge<br />
Blue Plains<br />
Confluence w/<br />
Anacostia<br />
Memorial Bridge Georgetown <strong>DC</strong>/MD Boundary<br />
No Phase 1 <strong>Control</strong>s 47 75 101 201 140 204<br />
Phase 1 <strong>Control</strong>s 46 71 93 188 140 201<br />
Pump Sta. Rehab. 43 65 83 173 138 204<br />
12 Overflows/yr 36 52 62 129 129 204<br />
8 Overflows/yr 33 48 54 115 128 204<br />
4 Overflows/yr 32 45 49 110 127 204<br />
2 Overflows/yr 32 45 49 110 127 204
District of Columbia <strong>Water</strong> and <strong>Sewer</strong> Authority<br />
<strong>Combined</strong> <strong>Sewer</strong> <strong>System</strong> <strong>Long</strong> <strong>Term</strong> <strong>Control</strong> <strong>Plan</strong><br />
Figure C-4<br />
Potomac River: Effect of CSO <strong>Control</strong> on Fecal Coliform Concentrations<br />
(No Change in Upstream or Stormwater Loads)<br />
Fecal Coliforms - July Geometric Means<br />
No Phase 1 <strong>Control</strong>s Phase 1 <strong>Control</strong>s Flow Pump Sta. Rehab. 12 Overflows/yr 8 Overflows/yr<br />
4 Overflows/yr 2 Overflows/yr 0 Overflows/yr Separation<br />
250<br />
200<br />
MPN/100 mL<br />
150<br />
100<br />
50<br />
0<br />
South of Wilson<br />
Bridge<br />
Blue Plains<br />
Confluence w/<br />
Anacostia<br />
Memorial Bridge Georgetown <strong>DC</strong>/MD Boundary<br />
No Phase 1 <strong>Control</strong>s 41 69 92 221 139 216<br />
Phase 1 <strong>Control</strong>s 40 67 85 208 140 216<br />
Pump Sta. Rehab. 39 63 77 190 137 216<br />
12 Overflows/yr 30 47 53 129 123 216<br />
8 Overflows/yr 29 46 50 122 121 216<br />
4 Overflows/yr 29 45 47 114 120 216<br />
2 Overflows/yr 27 42 43 105 118 216<br />
0 Overflows/yr 26 40 42 102 118 216<br />
Separation 23 38 46 121 122 216<br />
Fecal Coliforms - August Geometric Means<br />
No Phase 1 <strong>Control</strong>s Phase 1 <strong>Control</strong>s Pump Sta. Rehab. 12 Overflows/yr 8 Overflows/yr<br />
4 Overflows/yr 2 Overflows/yr 0 Overflows/yr Separation<br />
250<br />
200<br />
MPN/100 mL<br />
150<br />
100<br />
50<br />
0<br />
South of Wilson<br />
Bridge<br />
Blue Plains<br />
Confluence w/<br />
Anacostia<br />
Memorial Bridge Georgetown <strong>DC</strong>/MD Boundary<br />
No Phase 1 <strong>Control</strong>s 18 34 43 149 104 211<br />
Phase 1 <strong>Control</strong>s 18 34 39 139 104 211<br />
Pump Sta. Rehab. 18 33 34 125 101 211<br />
12 Overflows/yr 14 26 24 77 88 211<br />
8 Overflows/yr 14 25 23 75 87 211<br />
4 Overflows/yr 14 25 22 72 86 211<br />
2 Overflows/yr 14 24 20 68 85 211<br />
0 Overflows/yr 13 22 18 63 84 211<br />
Separation 12<br />
Flow<br />
22 22 84 88 211<br />
J:\1160\LTCP\LTCP Draft#3\[LTCP_App C_Potomac.xls]Pot-Data
District of Columbia <strong>Water</strong> and <strong>Sewer</strong> Authority<br />
<strong>Combined</strong> <strong>Sewer</strong> <strong>System</strong> <strong>Long</strong> <strong>Term</strong> <strong>Control</strong> <strong>Plan</strong><br />
Figure C-5<br />
Potomac River: Effect of CSO <strong>Control</strong> on Fecal Coliform Concentrations<br />
(No Change in Upstream or Stormwater Loads)<br />
Fecal Coliforms - September Geometric Means<br />
No Phase 1 <strong>Control</strong>s Phase 1 <strong>Control</strong>s Flow Pump Sta. Rehab. 12 Overflows/yr 8 Overflows/yr<br />
4 Overflows/yr 2 Overflows/yr 0 Overflows/yr Separation<br />
250<br />
200<br />
MPN/100 mL<br />
150<br />
100<br />
50<br />
0<br />
South of Wilson<br />
Bridge<br />
Blue Plains<br />
Confluence w/<br />
Anacostia<br />
Memorial Bridge Georgetown <strong>DC</strong>/MD Boundary<br />
No Phase 1 <strong>Control</strong>s 22 39 47 120 87 203<br />
Phase 1 <strong>Control</strong>s 22 38 42 113 88 203<br />
Pump Sta. Rehab. 22 37 38 103 86 203<br />
12 Overflows/yr 19 30 26 60 74 203<br />
8 Overflows/yr 18 30 25 60 74 203<br />
4 Overflows/yr 18 29 24 58 73 203<br />
2 Overflows/yr 17 27 22 55 73 203<br />
0 Overflows/yr 15 24 22 55 73 203<br />
Separation 14 23 25 84 80 203<br />
J:\1160\LTCP\LTCP Draft#3\[LTCP_App C_Potomac.xls]Pot-Data
District of Columbia <strong>Water</strong> and <strong>Sewer</strong> Authority<br />
<strong>Combined</strong> <strong>Sewer</strong> <strong>System</strong> <strong>Long</strong> <strong>Term</strong> <strong>Control</strong> <strong>Plan</strong><br />
Figure C-6<br />
Potomac River: Effect of CSO <strong>Control</strong> on Fecal Coliform Concentrations<br />
(No Change in Upstream or Stormwater Loads)<br />
E. Coli - # of Months Exceeding 126/ 100 mL<br />
No Phase 1 <strong>Control</strong>s Phase 1 <strong>Control</strong>s Flow Pump Sta. Rehab. 12 Overflows/yr 8 Overflows/yr<br />
4 Overflows/yr 2 Overflows/yr 0 overflows/yr Separation<br />
12<br />
10<br />
8<br />
ENTIRE CALENDAR YEAR<br />
6<br />
4<br />
2<br />
0<br />
South of Wilson<br />
Bridge<br />
Blue Plains<br />
Confluence w/<br />
Anacostia<br />
Memorial Bridge Georgetown <strong>DC</strong>/MD Boundary<br />
No Phase 1 <strong>Control</strong>s 0 0 0 2 0 1<br />
Phase 1 <strong>Control</strong>s 0 0 0 1 0 1<br />
Pump Sta. Rehab. 0 0 0 1 0 1<br />
12 Overflows/yr 0 0 0 0 0 1<br />
8 Overflows/yr 0 0 0 0 0 1<br />
4 Overflows/yr 0 0 0 0 0 1<br />
2 Overflows/yr 0 0 0 0 0 1<br />
0 overflows/yr 0 0 0 0 0 1<br />
Separation 0 0 0 0 0 1<br />
E. Coli - # of Months Exceeding 126/ 100 mL<br />
No Phase 1 <strong>Control</strong>s Phase 1 <strong>Control</strong>s Pump Sta. Rehab. 12 Overflows/yr 8 Overflows/yr<br />
4 Overflows/yr 2 Overflows/yr 0 overflows/yr Separation<br />
12<br />
10<br />
MAY THROUGH SEPTEMBER<br />
8<br />
6<br />
4<br />
2<br />
0<br />
South of Wilson<br />
Bridge<br />
Blue Plains<br />
Confluence w/<br />
Anacostia<br />
Memorial Bridge Georgetown <strong>DC</strong>/MD Boundary<br />
No Phase 1 <strong>Control</strong>s 0 0 0 2 0 1<br />
Phase 1 <strong>Control</strong>s 0 0 0 1 0 1<br />
Pump Sta. Rehab. 0 0 0 1 0 1<br />
12 Overflows/yr 0 0 0 0 0 1<br />
8 Overflows/yr 0 0 0 0 0 1<br />
4 Overflows/yr 0 0 0 0 0 1<br />
2 Overflows/yr 0 0 0 0 0 1<br />
0 overflows/yr 0 0<br />
Flow<br />
0 0 0 1<br />
Separation 0 0 0 0 0 1<br />
J:\1160\LTCP\LTCP Draft#3\[LTCP_App C_Potomac.xls]Pot-Data
District of Columbia <strong>Water</strong> and <strong>Sewer</strong> Authority<br />
<strong>Combined</strong> <strong>Sewer</strong> <strong>System</strong> <strong>Long</strong> <strong>Term</strong> <strong>Control</strong> <strong>Plan</strong><br />
Figure C-7<br />
Potomac River: Effect of CSO <strong>Control</strong> on Fecal Coliform Concentrations<br />
(No Change in Upstream or Stormwater Loads)<br />
E. Coli - # of Days Exceeding 126/100 mL<br />
No Phase 1 <strong>Control</strong>s Phase 1 <strong>Control</strong>s FlowPump Sta. Rehab. 12 Overflows/yr 8 Overflows/yr<br />
4 Overflows/yr 2 Overflows/yr 0 overflows/yr Separation<br />
250<br />
200<br />
ENTIRE CALENDAR YEAR<br />
150<br />
100<br />
50<br />
0<br />
South of Wilson<br />
Bridge<br />
Blue Plains<br />
Confluence w/<br />
Anacostia<br />
Memorial Bridge Georgetown <strong>DC</strong>/MD Boundary<br />
No Phase 1 <strong>Control</strong>s 35 52 65 118 131 218<br />
Phase 1 <strong>Control</strong>s 34 48 57 112 132 218<br />
Pump Sta. Rehab. 33 48 53 108 129 218<br />
12 Overflows/yr 19 34 31 82 117 218<br />
8 Overflows/yr 16 28 23 79 117 218<br />
4 Overflows/yr 14 25 18 77 115 218<br />
2 Overflows/yr 13 23 13 77 115 218<br />
0 overflows/yr 10 17 12 76 115 218<br />
Separation 3 8 13 98 117 218<br />
E. Coli - # of Days Exceeding 126/100 mL<br />
No Phase 1 <strong>Control</strong>s Phase 1 <strong>Control</strong>s Pump Sta. Rehab. 12 Overflows/yr 8 Overflows/yr<br />
4 Overflows/yr 2 Overflows/yr 0 overflows/yr Separation<br />
120<br />
100<br />
MAY THROUGH SEPTEMBER<br />
80<br />
60<br />
40<br />
20<br />
0<br />
South of Wilson<br />
Bridge<br />
Blue Plains<br />
Confluence w/<br />
Anacostia<br />
Memorial Bridge Georgetown <strong>DC</strong>/MD Boundary<br />
No Phase 1 <strong>Control</strong>s 21 29 38 57 57 98<br />
Phase 1 <strong>Control</strong>s 20 27 34 54 58 98<br />
Pump Sta. Rehab. 20 27 32 52 56 98<br />
12 Overflows/yr 13 21 22 37 47 98<br />
8 Overflows/yr 11 19 17 36 47 98<br />
4 Overflows/yr 10 16 14 36 46 98<br />
2 Overflows/yr 8 15 10 35 46 98<br />
0 overflows/yr 7 11 10 34 46 98<br />
Flow<br />
Separation 2 7 11 42 47 98<br />
J:\1160\LTCP\LTCP Draft#3\[LTCP_App C_Potomac.xls]Pot-Data
District of Columbia <strong>Water</strong> and <strong>Sewer</strong> Authority<br />
<strong>Combined</strong> <strong>Sewer</strong> <strong>System</strong> <strong>Long</strong> <strong>Term</strong> <strong>Control</strong> <strong>Plan</strong><br />
Figure C-8<br />
Potomac River: Effect of CSO <strong>Control</strong> on Fecal Coliform Concentrations<br />
(No Change in Upstream or Stormwater Loads)<br />
E. Coli - # of Days Exceeding 576/100 mL<br />
No Phase 1 <strong>Control</strong>s Phase 1 <strong>Control</strong>s Flow Pump Sta. Rehab. 12 Events/yr 8 Events/yr<br />
4 Events/yr 2 Events/yr 0 overflows/yr Separation<br />
ENTIRE CALENDAR YEAR<br />
45<br />
40<br />
35<br />
30<br />
25<br />
20<br />
15<br />
10<br />
5<br />
0<br />
South of Wilson<br />
Bridge<br />
Blue Plains<br />
Confluence w/<br />
Anacostia<br />
Memorial Bridge Georgetown <strong>DC</strong>/MD Boundary<br />
No Phase 1 <strong>Control</strong>s 3 9 21 41 1 0<br />
Phase 1 <strong>Control</strong>s 3 8 18 37 2 0<br />
Pump Sta. Rehab. 1 5 14 33 1 0<br />
12 Events/yr 1 1 3 11 0 0<br />
8 Events/yr 0 1 2 7 0 0<br />
4 Events/yr 0 0 1 4 0 0<br />
2 Events/yr 0 0 0 2 0 0<br />
0 overflows/yr 0 0 0 0 0 0<br />
Separation 0 0 0 0 0 0<br />
E. Coli - # of Days Exceeding 576/100 mL<br />
No Phase 1 <strong>Control</strong>s Phase 1 <strong>Control</strong>s Pump Sta. Rehab. 12 Events/yr 8 Events/yr<br />
4 Events/yr 2 Events/yr 0 overflows/yr Separation<br />
30<br />
25<br />
MAY THROUGH SEPTEMBER<br />
20<br />
15<br />
10<br />
5<br />
0<br />
South of Wilson<br />
Bridge<br />
Blue Plains<br />
Confluence w/<br />
Anacostia<br />
Memorial Bridge Georgetown <strong>DC</strong>/MD Boundary<br />
No Phase 1 <strong>Control</strong>s 2 6 13 24 1 0<br />
Phase 1 <strong>Control</strong>s 2 6 11 23 1 0<br />
Pump Sta. Rehab. 0 3 9 22 1 0<br />
12 Events/yr 0 0 2 7 0 0<br />
8 Events/yr 0 0 1 5 0 0<br />
4 Events/yr 0 0 1 3 0 0<br />
2 Events/yr 0 0 0 1 0 0<br />
0 overflows/yr 0 0<br />
Flow<br />
0 0 0 0<br />
Separation 0 0 0 0 0 0<br />
J:\1160\LTCP\LTCP Draft#3\[LTCP_App C_Potomac.xls]Pot-Data
District of Columbia <strong>Water</strong> and <strong>Sewer</strong> Authority<br />
<strong>Combined</strong> <strong>Sewer</strong> <strong>System</strong> <strong>Long</strong> <strong>Term</strong> <strong>Control</strong> <strong>Plan</strong><br />
Figure C-9<br />
Potomac River: Effect of CSO <strong>Control</strong> on Fecal Coliform Concentrations<br />
(No Change in Upstream or Stormwater Loads)<br />
Dissolved Oxygen - # of Days Dissolved Oxygen
District of Columbia <strong>Water</strong> and <strong>Sewer</strong> Authority<br />
<strong>Combined</strong> <strong>Sewer</strong> <strong>System</strong> <strong>Long</strong> <strong>Term</strong> <strong>Control</strong> <strong>Plan</strong><br />
Figure C-10<br />
Potomac River: Effect of CSO <strong>Control</strong> on Fecal Coliform Concentrations<br />
(CSO Loads Only - no other loads present)<br />
Fecal Coliforms - # of Days of CSO Impact<br />
No Phase 1 <strong>Control</strong>s Phase 1 <strong>Control</strong>s Flow Pump Sta. Rehab. 12 Events/yr 8 Events/yr<br />
4 Events/yr 2 Events/yr 0 Overflows/yr Separation<br />
60<br />
50<br />
ENTIRE CALENDAR YEAR<br />
# of Days/yr<br />
40<br />
30<br />
20<br />
10<br />
0<br />
South of Wilson<br />
Bridge<br />
Blue Plains<br />
Confluence w/<br />
Anacostia<br />
Memorial Bridge Georgetown <strong>DC</strong>/MD Boundary<br />
No Phase 1 <strong>Control</strong>s 24 34 47 57 11 0<br />
Phase 1 <strong>Control</strong>s 22 33 41 51 12 0<br />
Pump Sta. Rehab. 20 31 35 44 6 0<br />
12 Events/yr 9 17 14 16 3 0<br />
8 Events/yr 5 12 9 10 1 0<br />
4 Events/yr 4 9 6 6 0 0<br />
2 Events/yr 2 7 1 2 0 0<br />
0 Overflows/yr 0 0 0 0 0 0<br />
Separation 0 0 0 0 0 0<br />
Fecal Coliforms - # of Days of CSO Impact<br />
No Phase 1 <strong>Control</strong>s Phase 1 <strong>Control</strong>s Pump Sta. Rehab. 12 Events/yr 8 Events/yr<br />
4 Events/yr 2 Events/yr 0 Overflows/yr Separation<br />
35<br />
30<br />
MAY THROUGH SEPTEMBER<br />
# of Days/yr<br />
25<br />
20<br />
15<br />
10<br />
5<br />
0<br />
South of Wilson<br />
Bridge<br />
Blue Plains<br />
Confluence w/<br />
Anacostia<br />
Memorial Bridge Georgetown <strong>DC</strong>/MD Boundary<br />
No Phase 1 <strong>Control</strong>s 14 19 27 33 7 0<br />
Phase 1 <strong>Control</strong>s 13 18 24 30 8 0<br />
Pump Sta. Rehab. 13 18 21 27 4 0<br />
12 Events/yr 6 11 9 10 2 0<br />
8 Events/yr 4 7 6 6 0 0<br />
4 Events/yr 3 6 4 4 0 0<br />
2 Events/yr 2 5 1 2 0 0<br />
0 Overflows/yr 0 0 0 0 0 0<br />
Flow<br />
Separation 0 0 0 0 0 0<br />
J:\1160\LTCP\LTCP Draft#3\[LTCP_App C_Potomac.xls]Pot-Data
District of Columbia <strong>Water</strong> and <strong>Sewer</strong> Authority<br />
<strong>Combined</strong> <strong>Sewer</strong> <strong>System</strong> <strong>Long</strong> <strong>Term</strong> <strong>Control</strong> <strong>Plan</strong><br />
Figure C-11<br />
Potomac River: Effect of CSO <strong>Control</strong> on Fecal Coliform Concentrations<br />
(CSO Loads Only - no other loads present)<br />
E. Coli - # of Days of CSO Impact (>126 /100 mL)<br />
No Phase 1 <strong>Control</strong>s Phase 1 <strong>Control</strong>s Flow Pump Sta. Rehab. 12 Overflows/yr 8 Overflows/yr<br />
4 Overflows/yr 2 Overflows/yr 0 Overflows/yr Separation<br />
70<br />
60<br />
50<br />
40<br />
30<br />
20<br />
10<br />
0<br />
South of Wilson<br />
Bridge<br />
Blue Plains<br />
Confluence w/<br />
Anacostia<br />
Memorial Bridge Georgetown <strong>DC</strong>/MD Boundary<br />
No Phase 1 <strong>Control</strong>s 27 38 50 60 14 0<br />
Phase 1 <strong>Control</strong>s 27 38 43 52 15 0<br />
Pump Sta. Rehab. 24 35 39 46 9 0<br />
12 Overflows/yr 10 20 15 17 3 0<br />
8 Overflows/yr 7 14 10 10 2 0<br />
4 Overflows/yr 5 12 6 6 0 0<br />
2 Overflows/yr 4 9 1 3 0 0<br />
0 Overflows/yr 0 0 0 0 0 0<br />
Separation 0 0 0 0 0 0<br />
35<br />
30<br />
25<br />
20<br />
15<br />
10<br />
5<br />
0<br />
E. Coli - # of Days of CSO Impact (>126 /100 mL)<br />
No Phase 1 <strong>Control</strong>s Phase 1 <strong>Control</strong>s Pump Sta. Rehab. 12 Overflows/yr 8 Overflows/yr<br />
4 Overflows/yr<br />
40<br />
2 Overflows/yr 0 Overflows/yr Separation<br />
South of Wilson<br />
Bridge<br />
Blue Plains<br />
Confluence w/<br />
Anacostia<br />
Memorial Bridge Georgetown <strong>DC</strong>/MD Boundary<br />
No Phase 1 <strong>Control</strong>s 16 21 29 35 9 0<br />
Phase 1 <strong>Control</strong>s 15 21 24 31 10 0<br />
Pump Sta. Rehab. 14 19 23 29 6 0<br />
12 Overflows/yr 7 12 9 10 2 0<br />
8 Overflows/yr 4 8 7 7 1 0<br />
4 Overflows/yr 3 7 4 5 0 0<br />
2 Overflows/yr 3 6 1 2 0 0<br />
0 Overflows/yr 0 0 0 0 0 0<br />
Separation 0 Flow 0 0 0 0 0<br />
J:\1160\LTCP\LTCP Draft#3\[LTCP_App C_Potomac.xls]Pot-Data
District of Columbia <strong>Water</strong> and <strong>Sewer</strong> Authority<br />
<strong>Combined</strong> <strong>Sewer</strong> <strong>System</strong> <strong>Long</strong> <strong>Term</strong> <strong>Control</strong> <strong>Plan</strong><br />
Figure C-12<br />
Potomac River: Effect of CSO <strong>Control</strong> on Fecal Coliform Concentrations<br />
(CSO Loads Only - no other loads present)<br />
E. Coli - # of Days of CSO Impact (>576 /100 mL)<br />
No Phase 1 <strong>Control</strong>s Phase 1 <strong>Control</strong>s Flow Pump Sta. Rehab. 12 Overflows/yr 8 Overflows/yr<br />
4 Overflows/yr 2 Overflows/yr 0 Overflows/yr Separation<br />
45<br />
40<br />
35<br />
30<br />
25<br />
20<br />
15<br />
10<br />
5<br />
0<br />
South of Wilson<br />
Bridge<br />
Blue Plains<br />
Confluence w/<br />
Anacostia<br />
Memorial Bridge Georgetown <strong>DC</strong>/MD Boundary<br />
No Phase 1 <strong>Control</strong>s 2 8 19 39 0 0<br />
Phase 1 <strong>Control</strong>s 1 7 16 36 0 0<br />
Pump Sta. Rehab. 1 4 12 31 0 0<br />
12 Overflows/yr 0 1 2 10 0 0<br />
8 Overflows/yr 0 0 2 6 0 0<br />
4 Overflows/yr 0 0 1 3 0 0<br />
2 Overflows/yr 0 0 0 0 0 0<br />
0 Overflows/yr 0 0 0 0 0 0<br />
Separation 0 0 0 0 0 0<br />
E. Coli - # of Days of CSO Impact (>576 /100 mL)<br />
No Phase 1 <strong>Control</strong>s Phase 1 <strong>Control</strong>s Pump Sta. Rehab. 12 Overflows/yr 8 Overflows/yr<br />
4 Overflows/yr 2 Overflows/yr 0 Overflows/yr Separation<br />
30<br />
25<br />
20<br />
15<br />
10<br />
5<br />
0<br />
South of Wilson<br />
Bridge<br />
Blue Plains<br />
Confluence w/<br />
Anacostia<br />
Memorial Bridge Georgetown <strong>DC</strong>/MD Boundary<br />
No Phase 1 <strong>Control</strong>s 1 6 11 24 0 0<br />
Phase 1 <strong>Control</strong>s 1 5 10 23 0 0<br />
Pump Sta. Rehab. 0 3 7 20 0 0<br />
12 Overflows/yr 0 0 1 6 0 0<br />
8 Overflows/yr 0 0 1 4 0 0<br />
4 Overflows/yr 0 0 1 3 0 0<br />
2 Overflows/yr 0 0 0 0 0 0<br />
0 Overflows/yr 0 0 0 0 0 0<br />
Separation 0 Flow 0 0 0 0 0<br />
J:\1160\LTCP\LTCP Draft#3\[LTCP_App C_Potomac.xls]Pot-Data
District of Columbia <strong>Water</strong> and <strong>Sewer</strong> Authority<br />
<strong>Combined</strong> <strong>Sewer</strong> <strong>System</strong> <strong>Long</strong> <strong>Term</strong> <strong>Control</strong> <strong>Plan</strong><br />
Figure C-13<br />
Potomac River: Effect of CSO <strong>Control</strong> on Fecal Coliform Concentrations<br />
(Upstream and Stormwater Load Reduction 1 )<br />
Fecal Coliforms - # of Months Exceeding Class A Standard<br />
No Phase 1 <strong>Control</strong>s Phase 1 <strong>Control</strong>s FlowPump Sta. Rehab. 12 Overflows/yr 8 Overflows/yr<br />
4 Overflows/yr 2 Overflows/yr 0 Overflows/yr Separation<br />
4<br />
ENTIRE CALENDAR YEAR<br />
# of Months/yr<br />
3<br />
2<br />
1<br />
0<br />
South of Wilson<br />
Bridge<br />
Blue Plains<br />
Confluence w/<br />
Anacostia<br />
Memorial Bridge Georgetown <strong>DC</strong>/MD Boundary<br />
No Phase 1 <strong>Control</strong>s 0 0 0 1 0 0<br />
Phase 1 <strong>Control</strong>s 0 0 0 1 0 0<br />
Pump Sta. Rehab. 0 0 0 0 0 0<br />
12 Overflows/yr 0 0 0 0 0 0<br />
8 Overflows/yr 0 0 0 0 0 0<br />
4 Overflows/yr 0 0 0 0 0 0<br />
2 Overflows/yr 0 0 0 0 0 0<br />
0 Overflows/yr 0 0 0 0 0 0<br />
Separation 0 0 0 0 0 0<br />
Fecal Coliforms - # of Months Exceeding Class A Standard<br />
No Phase 1 <strong>Control</strong>s Phase 1 <strong>Control</strong>s Pump Sta. Rehab. 12 Overflows/yr 8 Overflows/yr<br />
4 Overflows/yr 2 Overflows/yr 0 Overflows/yr Separation<br />
4<br />
MAY THROUGH SEPTEMBER<br />
# of Months/yr<br />
3<br />
2<br />
1<br />
0<br />
South of Wilson<br />
Bridge<br />
Blue Plains<br />
Confluence w/<br />
Anacostia<br />
Memorial Bridge Georgetown <strong>DC</strong>/MD Boundary<br />
No Phase 1 <strong>Control</strong>s 0 0 0 1 0 0<br />
Phase 1 <strong>Control</strong>s 0 0 0 1 0 0<br />
Pump Sta. Rehab. 0 0 0 0 0 0<br />
12 Overflows/yr 0 0 0 0 0 0<br />
8 Overflows/yr 0 0 0 0 0 0<br />
4 Overflows/yr 0 0 0 0 0 0<br />
2 Overflows/yr 0 0 0 0 0 0<br />
0 Overflows/yr 0 0<br />
Flow<br />
0 0 0 0<br />
Separation 0 0 0 0 0 0<br />
J:\1160\LTCP\LTCP Draft#3\[LTCP_App C_Potomac7.xls]Pot-Ecoli<br />
1 Storm water: 40% reduction in loads, Upstream: 40% reduction in nutrients<br />
Fecal coliforms at 80% of water quality standard (concentration = 160/100 ml)
District of Columbia <strong>Water</strong> and <strong>Sewer</strong> Authority<br />
<strong>Combined</strong> <strong>Sewer</strong> <strong>System</strong> <strong>Long</strong> <strong>Term</strong> <strong>Control</strong> <strong>Plan</strong><br />
Figure C-14<br />
Potomac River: Effect of CSO <strong>Control</strong> on Fecal Coliform Concentrations<br />
(Upstream and Stormwater Load Reduction 1 )<br />
Fecal Coliforms - # of Days >200/100ml<br />
No Phase 1 <strong>Control</strong>s Phase 1 <strong>Control</strong>s FlowPump Sta. Rehab. 12 Overflows/yr 8 Overflows/yr<br />
4 Overflows/yr 2 Overflows/yr 0 Overflows/yr Separation<br />
ENTIRE CALENDAR YEAR<br />
# of Days/yr<br />
80<br />
70<br />
60<br />
50<br />
40<br />
30<br />
20<br />
10<br />
0<br />
South of Wilson<br />
Bridge<br />
Blue Plains<br />
Confluence w/<br />
Anacostia<br />
Memorial Bridge Georgetown <strong>DC</strong>/MD Boundary<br />
No Phase 1 <strong>Control</strong>s 27 39 50 68 26 19<br />
Phase 1 <strong>Control</strong>s 27 39 45 61 27 19<br />
Pump Sta. Rehab. 25 38 41 54 23 19<br />
12 Overflows/yr 12 23 18 19 8 19<br />
8 Overflows/yr 9 17 11 13 6 19<br />
4 Overflows/yr 6 14 6 8 4 19<br />
2 Overflows/yr 5 12 2 5 2 19<br />
0 Overflows/yr 4 6 0 3 2 19<br />
Separation 0 0 1 20 5 19<br />
Fecal Coliforms - # of Days >200/100ml<br />
No Phase 1 <strong>Control</strong>s Phase 1 <strong>Control</strong>s Pump Sta. Rehab. 12 Overflows/yr 8 Overflows/yr<br />
4 Overflows/yr 2 Overflows/yr 0 Overflows/yr Separation<br />
40<br />
35<br />
30<br />
MAY THROUGH SEPTEMBER<br />
# of Days/yr<br />
25<br />
20<br />
15<br />
10<br />
5<br />
0<br />
South of Wilson<br />
Bridge<br />
Blue Plains<br />
Confluence w/<br />
Anacostia<br />
Memorial Bridge Georgetown <strong>DC</strong>/MD Boundary<br />
No Phase 1 <strong>Control</strong>s 15 21 28 37 17 10<br />
Phase 1 <strong>Control</strong>s 15 21 25 33 18 10<br />
Pump Sta. Rehab. 15 21 24 32 15 10<br />
12 Overflows/yr 8 14 11 11 5 9<br />
8 Overflows/yr 6 10 7 8 4 9<br />
4 Overflows/yr 4 8 4 6 3 9<br />
2 Overflows/yr 3 7 1 4 1 9<br />
0 Overflows/yr 2 3<br />
Flow<br />
0 2 1 9<br />
Separation 0 0 0 11 2 9<br />
J:\1160\LTCP\LTCP Draft#3\[LTCP_App C_Potomac7.xls]Pot-Ecoli<br />
1 Storm water: 40% reduction in loads, Upstream: 40% reduction in nutrients<br />
Fecal coliforms at 80% of water quality standard (concentration = 160/100 ml)
District of Columbia <strong>Water</strong> and <strong>Sewer</strong> Authority<br />
<strong>Combined</strong> <strong>Sewer</strong> <strong>System</strong> <strong>Long</strong> <strong>Term</strong> <strong>Control</strong> <strong>Plan</strong><br />
Figure C-15<br />
Potomac River: Effect of CSO <strong>Control</strong> on Fecal Coliform Concentrations<br />
(Upstream and Stormwater Load Reduction 1 )<br />
Fecal Coliforms - May Geometric Means<br />
No Phase 1 <strong>Control</strong>s Phase 1 <strong>Control</strong>s FlowPump Sta. Rehab. 12 Overflows/yr 8 Overflows/yr<br />
4 Overflows/yr 2 Overflows/yr 0 Overflows/yr Separation<br />
250<br />
200<br />
MPN/100 mL<br />
150<br />
100<br />
50<br />
0<br />
South of Wilson<br />
Bridge<br />
Blue Plains<br />
Confluence w/<br />
Anacostia<br />
Memorial Bridge Georgetown <strong>DC</strong>/MD Boundary<br />
No Phase 1 <strong>Control</strong>s 100 125 147 216 145 168<br />
Phase 1 <strong>Control</strong>s 97 119 136 205 146 168<br />
Pump Sta. Rehab. 92 111 123 189 143 168<br />
12 Overflows/yr 71 85 92 141 134 168<br />
8 Overflows/yr 68 80 85 130 133 168<br />
4 Overflows/yr 67 77 81 126 132 168<br />
2 Overflows/yr 66 77 81 126 132 168<br />
0 Overflows/yr 58 69 77 122 131 168<br />
Separation 56 70 83 131 133 167<br />
MPN/100 mL<br />
180<br />
160<br />
140<br />
120<br />
100<br />
80<br />
60<br />
40<br />
20<br />
0 Overflows/yr 21 30<br />
Flow<br />
33 78 99 170<br />
Separation 20 30 38 91 100 170<br />
J:\1160\LTCP\LTCP Draft#3\[LTCP_App C_Potomac7.xls]Pot-Ecoli<br />
0<br />
Fecal Coliforms - June Geometric Means<br />
No Phase 1 <strong>Control</strong>s Phase 1 <strong>Control</strong>s Pump Sta. Rehab. 12 Overflows/yr 8 Overflows/yr<br />
4 Overflows/yr 2 Overflows/yr 0 Overflows/yr Separation<br />
South of Wilson<br />
Bridge<br />
Blue Plains<br />
Confluence w/<br />
Anacostia<br />
Memorial Bridge Georgetown <strong>DC</strong>/MD Boundary<br />
No Phase 1 <strong>Control</strong>s 39 61 81 156 109 170<br />
Phase 1 <strong>Control</strong>s 38 57 73 145 110 170<br />
Pump Sta. Rehab. 35 51 65 133 108 170<br />
12 Overflows/yr 28 39 46 95 101 170<br />
8 Overflows/yr 26 35 38 83 99 170<br />
4 Overflows/yr 25 33 34 78 99 170<br />
2 Overflows/yr 24 33 34 78 99 170<br />
1 Storm water: 40% reduction in loads, Upstream: 40% reduction in nutrients<br />
Fecal coliforms at 80% of water quality standard (concentration = 160/100 ml)
District of Columbia <strong>Water</strong> and <strong>Sewer</strong> Authority<br />
<strong>Combined</strong> <strong>Sewer</strong> <strong>System</strong> <strong>Long</strong> <strong>Term</strong> <strong>Control</strong> <strong>Plan</strong><br />
Figure C-16<br />
Potomac River: Effect of CSO <strong>Control</strong> on Fecal Coliform Concentrations<br />
(Upstream and Stormwater Load Reduction 1 )<br />
Fecal Coliforms - July Geometric Means<br />
No Phase 1 <strong>Control</strong>s Phase 1 <strong>Control</strong>s FlowPump Sta. Rehab. 12 Overflows/yr 8 Overflows/yr<br />
4 Overflows/yr 2 Overflows/yr 0 Overflows/yr Separation<br />
MPN/100 mL<br />
200<br />
180<br />
160<br />
140<br />
120<br />
100<br />
80<br />
60<br />
40<br />
20<br />
0<br />
South of Wilson<br />
Bridge<br />
Blue Plains<br />
Confluence w/<br />
Anacostia<br />
Memorial Bridge Georgetown <strong>DC</strong>/MD Boundary<br />
No Phase 1 <strong>Control</strong>s 34 55 70 163 102 176<br />
Phase 1 <strong>Control</strong>s 33 52 63 152 104 176<br />
Pump Sta. Rehab. 32 49 56 138 100 176<br />
12 Overflows/yr 23 34 35 85 88 176<br />
8 Overflows/yr 22 33 33 80 86 176<br />
4 Overflows/yr 22 32 30 73 65 176<br />
2 Overflows/yr 21 30 27 66 83 176<br />
0 Overflows/yr 19 28 26 64 83 176<br />
Separation 17 27 29 80 86 175<br />
Fecal Coliforms - August Geometric Means<br />
No Phase 1 <strong>Control</strong>s Phase 1 <strong>Control</strong>s Pump Sta. Rehab. 12 Overflows/yr 8 Overflows/yr<br />
4 Overflows/yr 2 Overflows/yr 0 Overflows/yr Separation<br />
MPN/100 mL<br />
200<br />
180<br />
160<br />
140<br />
120<br />
100<br />
80<br />
60<br />
40<br />
20<br />
0<br />
South of Wilson<br />
Bridge<br />
Blue Plains<br />
Confluence w/<br />
Anacostia<br />
Memorial Bridge Georgetown <strong>DC</strong>/MD Boundary<br />
No Phase 1 <strong>Control</strong>s 16 29 35 109 77 179<br />
Phase 1 <strong>Control</strong>s 16 29 30 101 78 179<br />
Pump Sta. Rehab. 16 28 27 90 75 179<br />
12 Overflows/yr 12 21 17 50 63 179<br />
8 Overflows/yr 12 21 17 49 63 179<br />
4 Overflows/yr 12 20 15 47 62 179<br />
2 Overflows/yr 12 19 14 43 61 179<br />
0 Overflows/yr 10 17 12 40 60 179<br />
Separation 10<br />
Flow<br />
17 15 57 63 178<br />
J:\1160\LTCP\LTCP Draft#3\[LTCP_App C_Potomac7.xls]Pot-Ecoli<br />
1 Storm water: 40% reduction in loads, Upstream: 40% reduction in nutrients<br />
Fecal coliforms at 80% of water quality standard (concentration = 160/100 ml)
District of Columbia <strong>Water</strong> and <strong>Sewer</strong> Authority<br />
<strong>Combined</strong> <strong>Sewer</strong> <strong>System</strong> <strong>Long</strong> <strong>Term</strong> <strong>Control</strong> <strong>Plan</strong><br />
Figure C-17<br />
Potomac River: Effect of CSO <strong>Control</strong> on Fecal Coliform Concentrations<br />
(Upstream and Stormwater Load Reduction 1 )<br />
Fecal Coliforms - September Geometric Means<br />
No Phase 1 <strong>Control</strong>s Phase 1 <strong>Control</strong>s FlowPump Sta. Rehab. 12 Overflows/yr 8 Overflows/yr<br />
4 Overflows/yr 2 Overflows/yr 0 Overflows/yr Separation<br />
MPN/100 mL<br />
200<br />
180<br />
160<br />
140<br />
120<br />
100<br />
80<br />
60<br />
40<br />
20<br />
0<br />
South of Wilson<br />
Bridge<br />
Blue Plains<br />
Confluence w/<br />
Anacostia<br />
Memorial Bridge Georgetown <strong>DC</strong>/MD Boundary<br />
No Phase 1 <strong>Control</strong>s 21 36 40 92 69 177<br />
Phase 1 <strong>Control</strong>s 21 34 35 86 69 177<br />
Pump Sta. Rehab. 21 34 32 78 67 177<br />
12 Overflows/yr 17 27 20 42 58 177<br />
8 Overflows/yr 17 26 19 42 57 177<br />
4 Overflows/yr 16 25 19 41 57 177<br />
2 Overflows/yr 15 23 16 38 57 177<br />
0 Overflows/yr 13 20 16 38 57 177<br />
Separation 12 20 20 62 61 177<br />
J:\1160\LTCP\LTCP Draft#3\[LTCP_App C_Potomac7.xls]Pot-Ecoli<br />
1 Storm water: 40% reduction in loads, Upstream: 40% reduction in nutrients<br />
Fecal coliforms at 80% of water quality standard (concentration = 160/100 ml)
District of Columbia <strong>Water</strong> and <strong>Sewer</strong> Authority<br />
<strong>Combined</strong> <strong>Sewer</strong> <strong>System</strong> <strong>Long</strong> <strong>Term</strong> <strong>Control</strong> <strong>Plan</strong><br />
Figure C-18<br />
Potomac River: Effect of CSO <strong>Control</strong> on Fecal Coliform Concentrations<br />
(Upstream and Stormwater Load Reduction 1 )<br />
E. Coli - # of Months Exceeding 126/ 100 mL<br />
No Phase 1 <strong>Control</strong>s Phase 1 <strong>Control</strong>s FlowPump Sta. Rehab. 12 Overflows/yr 8 Overflows/yr<br />
4 Overflows/yr 2 Overflows/yr 0 overflows/yr Separation<br />
12<br />
10<br />
8<br />
ENTIRE CALENDAR YEAR<br />
6<br />
4<br />
2<br />
0<br />
South of Wilson<br />
Bridge<br />
Blue Plains<br />
Confluence w/<br />
Anacostia<br />
Memorial Bridge Georgetown <strong>DC</strong>/MD Boundary<br />
No Phase 1 <strong>Control</strong>s 0 0 0 1 0 0<br />
Phase 1 <strong>Control</strong>s 0 0 0 1 0 0<br />
Pump Sta. Rehab. 0 0 0 0 0 0<br />
12 Overflows/yr 0 0 0 0 0 0<br />
8 Overflows/yr 0 0 0 0 0 0<br />
4 Overflows/yr 0 0 0 0 0 0<br />
2 Overflows/yr 0 0 0 0 0 0<br />
0 overflows/yr 0 0 0 0 0 0<br />
Separation 0 0 0 0 0 0<br />
E. Coli - # of Months Exceeding 126/ 100 mL<br />
No Phase 1 <strong>Control</strong>s Phase 1 <strong>Control</strong>s Pump Sta. Rehab. 12 Overflows/yr 8 Overflows/yr<br />
4 Overflows/yr 2 Overflows/yr 0 overflows/yr Separation<br />
12<br />
10<br />
MAY THROUGH SEPTEMBER<br />
8<br />
6<br />
4<br />
2<br />
0<br />
South of Wilson<br />
Bridge<br />
Blue Plains<br />
Confluence w/<br />
Anacostia<br />
Memorial Bridge Georgetown <strong>DC</strong>/MD Boundary<br />
No Phase 1 <strong>Control</strong>s 0 0 0 1 0 0<br />
Phase 1 <strong>Control</strong>s 0 0 0 1 0 0<br />
Pump Sta. Rehab. 0 0 0 0 0 0<br />
12 Overflows/yr 0 0 0 0 0 0<br />
8 Overflows/yr 0 0 0 0 0 0<br />
4 Overflows/yr 0 0 0 0 0 0<br />
2 Overflows/yr 0 0 0 0 0 0<br />
0 overflows/yr 0 0<br />
Flow<br />
0 0 0 0<br />
Separation 0 0 0 0 0 0<br />
J:\1160\LTCP\LTCP Draft#3\[LTCP_App C_Potomac7.xls]Pot-Ecoli<br />
1 Storm water: 40% reduction in loads, Upstream: 40% reduction in nutrients<br />
Fecal coliforms at 80% of water quality standard (concentration = 160/100 ml)
District of Columbia <strong>Water</strong> and <strong>Sewer</strong> Authority<br />
<strong>Combined</strong> <strong>Sewer</strong> <strong>System</strong> <strong>Long</strong> <strong>Term</strong> <strong>Control</strong> <strong>Plan</strong><br />
Figure C-19<br />
Potomac River: Effect of CSO <strong>Control</strong> on Fecal Coliform Concentrations<br />
(Upstream and Stormwater Load Reduction 1 )<br />
E. Coli - # of Days Exceeding 126/100 mL<br />
No Phase 1 <strong>Control</strong>s Phase 1 <strong>Control</strong>s FlowPump Sta. Rehab. 12 Overflows/yr 8 Overflows/yr<br />
4 Overflows/yr 2 Overflows/yr 0 overflows/yr Separation<br />
ENTIRE CALENDAR YEAR<br />
80<br />
70<br />
60<br />
50<br />
40<br />
30<br />
20<br />
10<br />
0<br />
South of Wilson<br />
Bridge<br />
Blue Plains<br />
Confluence w/<br />
Anacostia<br />
Memorial Bridge Georgetown <strong>DC</strong>/MD Boundary<br />
No Phase 1 <strong>Control</strong>s 30 44 52 69 27 16<br />
Phase 1 <strong>Control</strong>s 29 41 47 62 28 17<br />
Pump Sta. Rehab. 29 40 42 55 25 16<br />
12 Overflows/yr 15 26 20 20 9 16<br />
8 Overflows/yr 11 18 11 13 6 16<br />
4 Overflows/yr 8 15 6 7 4 16<br />
2 Overflows/yr 7 13 2 4 2 16<br />
0 overflows/yr 6 7 0 3 1 16<br />
Separation 0 0 0 16 4 16<br />
E. Coli - # of Days Exceeding 126/100 mL<br />
No Phase 1 <strong>Control</strong>s Phase 1 <strong>Control</strong>s Pump Sta. Rehab. 12 Overflows/yr 8 Overflows/yr<br />
4 Overflows/yr 2 Overflows/yr 0 overflows/yr Separation<br />
MAY THROUGH SEPTEMBER<br />
45<br />
40<br />
35<br />
30<br />
25<br />
20<br />
15<br />
10<br />
5<br />
0<br />
South of Wilson<br />
Bridge<br />
Blue Plains<br />
Confluence w/<br />
Anacostia<br />
Memorial Bridge Georgetown <strong>DC</strong>/MD Boundary<br />
No Phase 1 <strong>Control</strong>s 17 23 29 39 18 8<br />
Phase 1 <strong>Control</strong>s 16 22 26 33 18 8<br />
Pump Sta. Rehab. 17 22 25 32 17 8<br />
12 Overflows/yr 10 15 12 11 6 8<br />
8 Overflows/yr 7 11 8 8 4 8<br />
4 Overflows/yr 5 9 5 6 3 8<br />
2 Overflows/yr 4 8 1 3 1 8<br />
0 overflows/yr 3 4 0 2 1 8<br />
Separation 0 0<br />
Flow<br />
0 8 2 8<br />
J:\1160\LTCP\LTCP Draft#3\[LTCP_App C_Potomac7.xls]Pot-Ecoli<br />
1 Storm water: 40% reduction in loads, Upstream: 40% reduction in nutrients<br />
Fecal coliforms at 80% of water quality standard (concentration = 160/100 ml)
District of Columbia <strong>Water</strong> and <strong>Sewer</strong> Authority<br />
<strong>Combined</strong> <strong>Sewer</strong> <strong>System</strong> <strong>Long</strong> <strong>Term</strong> <strong>Control</strong> <strong>Plan</strong><br />
Figure C-20<br />
Potomac River: Effect of CSO <strong>Control</strong> on Fecal Coliform Concentrations<br />
(Upstream and Stormwater Load Reduction 1 )<br />
E. Coli - # of Days Exceeding 576/100 mL<br />
No Phase 1 <strong>Control</strong>s Phase 1 <strong>Control</strong>s FlowPump Sta. Rehab. 12 Events/yr 8 Events/yr<br />
4 Events/yr 2 Events/yr 0 overflows/yr Separation<br />
ENTIRE CALENDAR YEAR<br />
45<br />
40<br />
35<br />
30<br />
25<br />
20<br />
15<br />
10<br />
5<br />
0<br />
South of Wilson<br />
Bridge<br />
Blue Plains<br />
Confluence w/<br />
Anacostia<br />
Memorial Bridge Georgetown <strong>DC</strong>/MD Boundary<br />
No Phase 1 <strong>Control</strong>s 3 9 20 40 1 0<br />
Phase 1 <strong>Control</strong>s 3 8 17 37 2 0<br />
Pump Sta. Rehab. 1 5 14 32 1 0<br />
12 Events/yr 0 1 3 11 0 0<br />
8 Events/yr 0 1 2 7 0 0<br />
4 Events/yr 0 0 1 4 0 0<br />
2 Events/yr 0 0 0 1 0 0<br />
0 overflows/yr 0 0 0 0 0 0<br />
Separation 0 0 0 0 0 0<br />
E. Coli - # of Days Exceeding 576/100 mL<br />
No Phase 1 <strong>Control</strong>s Phase 1 <strong>Control</strong>s Pump Sta. Rehab. 12 Events/yr 8 Events/yr<br />
4 Events/yr 2 Events/yr 0 overflows/yr Separation<br />
30<br />
25<br />
MAY THROUGH SEPTEMBER<br />
20<br />
15<br />
10<br />
5<br />
0<br />
South of Wilson<br />
Bridge<br />
Blue Plains<br />
Confluence w/<br />
Anacostia<br />
Memorial Bridge Georgetown <strong>DC</strong>/MD Boundary<br />
No Phase 1 <strong>Control</strong>s 2 6 12 24 0 0<br />
Phase 1 <strong>Control</strong>s 2 6 10 23 1 0<br />
Pump Sta. Rehab. 0 3 9 21 0 0<br />
12 Events/yr 0 0 1 7 0 0<br />
8 Events/yr 0 0 1 5 0 0<br />
4 Events/yr 0 0 1 3 0 0<br />
2 Events/yr 0 0 0 1 0 0<br />
0 overflows/yr 0 0<br />
Flow<br />
0 0 0 0<br />
Separation 0 0 0 0 0 0<br />
J:\1160\LTCP\LTCP Draft#3\[LTCP_App C_Potomac7.xls]Pot-Ecoli<br />
1 Storm water: 40% reduction in loads, Upstream: 40% reduction in nutrients<br />
Fecal coliforms at 80% of water quality standard (concentration = 160/100 ml)
District of Columbia <strong>Water</strong> and <strong>Sewer</strong> Authority<br />
<strong>Combined</strong> <strong>Sewer</strong> <strong>System</strong> <strong>Long</strong> <strong>Term</strong> <strong>Control</strong> <strong>Plan</strong><br />
Figure C-21<br />
Potomac River: Effect of CSO <strong>Control</strong> on Fecal Coliform Concentrations<br />
(Upstream and Stormwater Load Reduction 1 )<br />
Dissolved Oxygen - # of Days Dissolved Oxygen
District of Columbia <strong>Water</strong> and <strong>Sewer</strong> Authority<br />
<strong>Combined</strong> <strong>Sewer</strong> <strong>System</strong> <strong>Long</strong> <strong>Term</strong> <strong>Control</strong> <strong>Plan</strong><br />
APPENDIX D<br />
Effect of CSO <strong>Control</strong>s on <strong>Water</strong> Quality<br />
Rock Creek<br />
\\Gh-wash\ENG 1160\LTCP\LTCP Final Draft #2 (Board)\App D-RC WQ\Appendix D.DOC
District of Columbia <strong>Water</strong> and <strong>Sewer</strong> Authority<br />
<strong>Combined</strong> <strong>Sewer</strong> <strong>System</strong> <strong>Long</strong> <strong>Term</strong> <strong>Control</strong> <strong>Plan</strong><br />
Table of Contents<br />
Appendix D – Effect of CSO <strong>Control</strong>s on <strong>Water</strong><br />
Quality in Rock Creek<br />
Loading<br />
Condition<br />
No Change in<br />
Storm <strong>Water</strong> or<br />
Upstream Loads<br />
Figure<br />
Parameter<br />
D-1 Fecal Coliforms - # of Months Exceeding Class A<br />
Standard<br />
D-2 Fecal Coliforms - # of Months Exceeding Class B<br />
Standard<br />
D-3 Fecal Coliforms - # of Days >200/100 ml<br />
D-4 Fecal Coliforms – May/June Geometric Means<br />
D-5 Fecal Coliforms – July/August Geometric Means<br />
D-6 Fecal Coliforms – September Geometric Means<br />
D-7 E. Coli - # of Months Exceeding 126/100 mL<br />
D-8 E. Coli - # of Days Exceeding 126/100 mL<br />
D-9 E. Coli - # of Days Exceeding 576/100 mL<br />
CSO Loads D-10 Fecal Coliforms - # of Days of CSO Impact<br />
Only – no other D-11 E. Coli - # of Days CSO Impact (>126/100 mL)<br />
loads present D-12 E. Coli - # of Days CSO Impact (>576/100 mL)<br />
Upstream and<br />
Storm <strong>Water</strong><br />
Load Reduction<br />
D-13 Fecal Coliforms - # of Months Exceeding Class A<br />
Standard<br />
D-14 Fecal Coliforms - # of Months Exceeding Class B<br />
Standard<br />
D-15 Fecal Coliforms - # of Days > 200/100ml<br />
D-16 Fecal Coliforms – May/June Geometric Means<br />
D-17 Fecal Coliforms – July/August Geometric Means<br />
D-18 Fecal Coliforms – September Geometric Means<br />
D-19 E. Coli - # of Months Exceeding 126/100 mL<br />
D-20 E. Coli - # of Days Exceeding 126/100 mL<br />
D-21 E. Coli - # of Days Exceeding 576/100 mL<br />
\\Gh-wash\ENG 1160\LTCP\LTCP Final Draft #2 (Board)\App D-RC WQ\Appendix D.DOC
District of Columbia <strong>Water</strong> and <strong>Sewer</strong> Authority<br />
<strong>Combined</strong> <strong>Sewer</strong> <strong>System</strong> <strong>Long</strong> <strong>Term</strong> <strong>Control</strong> <strong>Plan</strong><br />
Figure D-1<br />
Rock Creek: Effect of CSO <strong>Control</strong> on Fecal Coliform Concentrations<br />
(No Change in Upstream or Stormwater Loads)<br />
Fecal Coliforms - # of Months Exceeding Class A Standard<br />
No Phase 1 <strong>Control</strong>s Phase 1 <strong>Control</strong>s Flow Pump Sta. Rehab. 12 Overflows/yr 8 Overflows/yr<br />
4 Overflows/yr 2 Overflows/yr 0 Overflows/yr Separation<br />
12<br />
10<br />
ENTIRE CALENDAR YEAR<br />
# of Months/yr<br />
8<br />
6<br />
4<br />
2<br />
0<br />
M Street Mass. Ave. Zoo After Piney Branch<br />
Before Piney<br />
Branch<br />
<strong>DC</strong>/MD Boundary<br />
No Phase 1 <strong>Control</strong>s 12 12 12 12 12 12<br />
Phase 1 <strong>Control</strong>s 12 12 12 12 12 12<br />
Pump Sta. Rehab. 12 12 12 12 12 12<br />
12 Overflows/yr 12 12 12 12 12 12<br />
8 Overflows/yr 12 12 12 12 12 12<br />
4 Overflows/yr 12 12 12 12 12 12<br />
2 Overflows/yr 12 12 12 12 12 12<br />
0 Overflows/yr 12 12 12 12 12 12<br />
Separation 12 12 12 12 12 12<br />
Fecal Coliforms - # of Months Exceeding Class A Standard<br />
No Phase 1 <strong>Control</strong>s Phase 1 <strong>Control</strong>s Pump Sta. Rehab. 12 Overflows/yr 8 Overflows/yr<br />
4 Overflows/yr 2 Overflows/yr 0 Overflows/yr Separation<br />
6<br />
5<br />
MAY THROUGH SEPTEMBER<br />
# of Months/yr<br />
4<br />
3<br />
2<br />
1<br />
0<br />
M Street Mass. Ave. Zoo After Piney Branch<br />
Before Piney<br />
Branch<br />
<strong>DC</strong>/MD Boundary<br />
No Phase 1 <strong>Control</strong>s 5 5 5 5 5 5<br />
Phase 1 <strong>Control</strong>s 5 5 5 5 5 5<br />
Pump Sta. Rehab. 5 5 5 5 5 5<br />
12 Overflows/yr 5 5 5 5 5 5<br />
8 Overflows/yr 5 5 5 5 5 5<br />
4 Overflows/yr 5 5 5 5 5 5<br />
2 Overflows/yr 5 5 5 5 5 5<br />
0 Overflows/yr 5 5 5 5 5 5<br />
Separation 5 Flow 5 5 5 5 5<br />
\\Gh-wash\ENG 1160\LTCP\LTCP Final Draft #2 (Board)\App D-RC WQ\[LTCP_App D_RC7.xls]21
District of Columbia <strong>Water</strong> and <strong>Sewer</strong> Authority<br />
<strong>Combined</strong> <strong>Sewer</strong> <strong>System</strong> <strong>Long</strong> <strong>Term</strong> <strong>Control</strong> <strong>Plan</strong><br />
Figure D-2<br />
Rock Creek: Effect of CSO <strong>Control</strong> on Fecal Coliform Concentrations<br />
(No Change in Upstream or Stormwater Loads)<br />
Fecal Coliforms - # of Months Exceeding Class B Standard<br />
No Phase 1 <strong>Control</strong>s Phase 1 <strong>Control</strong>s Pump Sta. Rehab. 12 Overflows/yr 8 Overflows/yr<br />
Flow<br />
4 Overflows/yr 2 Overflows/yr 0 Overflows/yr Separation<br />
12<br />
10<br />
ENTIRE CALENDAR YEAR<br />
# of Months/yr<br />
8<br />
6<br />
4<br />
2<br />
0<br />
M Street Mass. Ave. Zoo After Piney Branch<br />
Before Piney<br />
Branch<br />
<strong>DC</strong>/MD Boundary<br />
No Phase 1 <strong>Control</strong>s 3 3 4 6 6 0<br />
Phase 1 <strong>Control</strong>s 3 3 4 6 6 0<br />
Pump Sta. Rehab. 3 3 4 6 6 0<br />
12 Overflows/yr 2 3 3 6 3 0<br />
8 Overflows/yr 2 3 3 6 3 0<br />
4 Overflows/yr 1 3 3 6 3 0<br />
2 Overflows/yr 1 3 3 6 3 0<br />
0 Overflows/yr 1 3 3 6 3 0<br />
Separation 12 12 12 12 11 0<br />
Fecal Coliforms - # of Months Exceeding Class B Standard<br />
MAY THROUGH SEPTEMBER<br />
# of Months/yr<br />
No Phase 1 <strong>Control</strong>s Phase 1 <strong>Control</strong>s Pump Sta. Rehab. 12 Overflows/yr 8 Overflows/yr<br />
4 Overflows/yr 2 Overflows/yr 0 Overflows/yr Separation<br />
9<br />
8<br />
7<br />
6<br />
5<br />
4<br />
3<br />
2<br />
1<br />
0<br />
M Street Mass. Ave. Zoo After Piney Branch<br />
Before Piney<br />
Branch<br />
<strong>DC</strong>/MD Boundary<br />
No Phase 1 <strong>Control</strong>s 2 2 2 2 2 0<br />
Phase 1 <strong>Control</strong>s 2 2 2 2 2 0<br />
Pump Sta. Rehab. 2 2 2 2 2 0<br />
12 Overflows/yr 2 2 2 2 2 0<br />
8 Overflows/yr 2 2 2 2 2 0<br />
4 Overflows/yr 1 2 2 2 2 0<br />
2 Overflows/yr 1 2 2 2 2 0<br />
0 Overflows/yr 1 2<br />
Flow<br />
2 2 2 0<br />
Separation 5 5 5 5 5 0<br />
\\Gh-wash\ENG 1160\LTCP\LTCP Final Draft #2 (Board)\App D-RC WQ\[LTCP_App D_RC7.xls]21
District of Columbia <strong>Water</strong> and <strong>Sewer</strong> Authority<br />
<strong>Combined</strong> <strong>Sewer</strong> <strong>System</strong> <strong>Long</strong> <strong>Term</strong> <strong>Control</strong> <strong>Plan</strong><br />
Figure D-3<br />
Rock Creek: Effect of CSO <strong>Control</strong> on Fecal Coliform Concentrations<br />
(No Change in Upstream or Stormwater Loads)<br />
ENTIRE CALENDAR YEAR<br />
# of Days/yr<br />
Fecal Coliforms - # of Days >200/100ml<br />
No Phase 1 <strong>Control</strong>s Phase 1 <strong>Control</strong>s Pump Sta. Rehab. 12 Overflows/yr 8 Overflows/yr<br />
Flow<br />
4 Overflows/yr 2 Overflows/yr 0 Overflows/yr Separation<br />
400<br />
350<br />
300<br />
250<br />
200<br />
150<br />
100<br />
50<br />
0<br />
M Street Mass. Ave. Zoo After Piney Branch<br />
Before Piney<br />
Branch<br />
<strong>DC</strong>/MD Boundary<br />
No Phase 1 <strong>Control</strong>s 264 271 294 335 338 365<br />
Phase 1 <strong>Control</strong>s 264 271 294 335 338 365<br />
Pump Sta. Rehab. 264 271 294 335 338 365<br />
12 Overflows/yr 264 271 294 335 338 365<br />
8 Overflows/yr 264 271 294 335 338 365<br />
4 Overflows/yr 264 271 294 335 338 365<br />
2 Overflows/yr 264 271 294 335 338 365<br />
0 Overflows/yr 264 271 294 335 338 365<br />
Separation 295 299 312 341 342 365<br />
Fecal Coliforms - # of Days >200/100ml<br />
No Phase 1 <strong>Control</strong>s Phase 1 <strong>Control</strong>s Pump Sta. Rehab. 12 Overflows/yr 8 Overflows/yr<br />
4 Overflows/yr 2 Overflows/yr 0 Overflows/yr Separation<br />
MAY THROUGH SEPTEMBER<br />
# of Days/yr<br />
180<br />
160<br />
140<br />
120<br />
100<br />
80<br />
60<br />
40<br />
20<br />
0<br />
M Street Mass. Ave. Zoo After Piney Branch<br />
Before Piney<br />
Branch<br />
<strong>DC</strong>/MD Boundary<br />
No Phase 1 <strong>Control</strong>s 108 111 119 135 136 153<br />
Phase 1 <strong>Control</strong>s 108 111 119 135 136 153<br />
Pump Sta. Rehab. 108 111 119 135 136 153<br />
12 Overflows/yr 108 111 119 135 136 153<br />
8 Overflows/yr 108 111 119 135 136 153<br />
4 Overflows/yr 108 111 119 135 136 153<br />
2 Overflows/yr 108 111 119 135 136 153<br />
0 Overflows/yr 108 111 119 135 136 153<br />
Separation 120<br />
Flow<br />
121 125 137 138 153<br />
\\Gh-wash\ENG 1160\LTCP\LTCP Final Draft #2 (Board)\App D-RC WQ\[LTCP_App D_RC7.xls]21
District of Columbia <strong>Water</strong> and <strong>Sewer</strong> Authority<br />
<strong>Combined</strong> <strong>Sewer</strong> <strong>System</strong> <strong>Long</strong> <strong>Term</strong> <strong>Control</strong> <strong>Plan</strong><br />
Figure D-4<br />
Rock Creek: Effect of CSO <strong>Control</strong> on Fecal Coliform Concentrations<br />
(No Change in Upstream or Stormwater Loads)<br />
Fecal Coliforms - May Geometric Means<br />
No Phase 1 <strong>Control</strong>s Phase 1 <strong>Control</strong>s Flow Pump Sta. Rehab. 12 Overflows/yr 8 Overflows/yr<br />
4 Overflows/yr 2 Overflows/yr 0 Overflows/yr Separation<br />
2,500<br />
2,000<br />
MPN/ 100 mL<br />
1,500<br />
1,000<br />
500<br />
0<br />
M Street Mass. Ave. Zoo After Piney Branch<br />
Before Piney<br />
Branch<br />
<strong>DC</strong>/MD Boundary<br />
No Phase 1 <strong>Control</strong>s 1,293 1,325 1,313 1,377 1,233 855<br />
Phase 1 <strong>Control</strong>s 1,293 1,325 1,313 1,377 1,233 855<br />
Pump Sta. Rehab. 1,293 1,325 1,313 1,377 1,233 855<br />
12 Overflows/yr 1,237 1,274 1,276 1,332 1,228 855<br />
8 Overflows/yr 1,227 1,263 1,264 1,317 1,228 855<br />
4 Overflows/yr 1,205 1,239 1,236 1,284 1,228 855<br />
2 Overflows/yr 1,202 1,237 1,233 1,281 1,228 855<br />
0 Overflows/yr 1,192 1,228 1,224 1,272 1,228 855<br />
Separation 2,149 1,916 1,882 1,916 1,516 952<br />
Fecal Coliforms - June Geometric Means<br />
No Phase 1 <strong>Control</strong>s Phase 1 <strong>Control</strong>s Pump Sta. Rehab. 12 Overflows/yr 8 Overflows/yr<br />
4 Overflows/yr 2 Overflows/yr 0 Overflows/yr Separation<br />
1400<br />
1200<br />
MPN/ 100 mL<br />
1000<br />
800<br />
600<br />
400<br />
200<br />
0<br />
M Street Mass. Ave. Zoo After Piney Branch<br />
No Phase 1 <strong>Control</strong>s 735 760 764 801 747 573<br />
Phase 1 <strong>Control</strong>s 735 760 764 801 747 573<br />
Pump Sta. Rehab. 735 760 764 801 747 573<br />
12 Overflows/yr 709 735 744 780 746 573<br />
8 Overflows/yr 700 726 733 768 746 573<br />
4 Overflows/yr 697 723 730 765 746 573<br />
2 Overflows/yr 697 723 730 765 746 573<br />
0 Overflows/yr 696 722<br />
Flow<br />
730 765 746 573<br />
Separation 1143 1063 1059 1099 935 627<br />
\\Gh-wash\ENG 1160\LTCP\LTCP Final Draft #2 (Board)\App D-RC WQ\[LTCP_App D_RC7.xls]21<br />
Before Piney<br />
Branch<br />
<strong>DC</strong>/MD Boundary
District of Columbia <strong>Water</strong> and <strong>Sewer</strong> Authority<br />
<strong>Combined</strong> <strong>Sewer</strong> <strong>System</strong> <strong>Long</strong> <strong>Term</strong> <strong>Control</strong> <strong>Plan</strong><br />
Figure D-5<br />
Rock Creek: Effect of CSO <strong>Control</strong> on Fecal Coliform Concentrations<br />
(No Change in Upstream or Stormwater Loads)<br />
Fecal Coliforms - July Geometric Means<br />
No Phase 1 <strong>Control</strong>s Phase 1 <strong>Control</strong>s Flow Pump Sta. Rehab. 12 Overflows/yr 8 Overflows/yr<br />
4 Overflows/yr 2 Overflows/yr 0 Overflows/yr Separation<br />
MPN/ 100 mL<br />
2,000<br />
1,800<br />
1,600<br />
1,400<br />
1,200<br />
1,000<br />
800<br />
600<br />
400<br />
200<br />
0<br />
M Street Mass. Ave. Zoo After Piney Branch<br />
Before Piney<br />
Branch<br />
<strong>DC</strong>/MD Boundary<br />
No Phase 1 <strong>Control</strong>s 1,064 1,100 1,110 1,170 1,055 739<br />
Phase 1 <strong>Control</strong>s 1,064 1,100 1,110 1,170 1,055 739<br />
Pump Sta. Rehab. 1,064 1,100 1,110 1,170 1,055 739<br />
12 Overflows/yr 1,017 1,058 1,071 1,127 1,051 739<br />
8 Overflows/yr 1,003 1,043 1,053 1,106 1,051 739<br />
4 Overflows/yr 993 1,032 1,041 1,093 1,051 739<br />
2 Overflows/yr 990 1,030 1,039 1,090 1,051 739<br />
0 Overflows/yr 986 1,026 1,035 1,087 1,051 739<br />
Separation 1,734 1,599 1,596 1,657 1,345 817<br />
Fecal Coliforms - August Geometric Means<br />
No Phase 1 <strong>Control</strong>s Phase 1 <strong>Control</strong>s Pump Sta. Rehab. 12 Overflows/yr 8 Overflows/yr<br />
4 Overflows/yr 2 Overflows/yr 0 Overflows/yr Separation<br />
1400<br />
1200<br />
MPN/ 100 mL<br />
1000<br />
800<br />
600<br />
400<br />
200<br />
0<br />
M Street Mass. Ave. Zoo After Piney Branch<br />
No Phase 1 <strong>Control</strong>s 693 725 736 784 738 545<br />
Phase 1 <strong>Control</strong>s 693 725 736 784 738 545<br />
Pump Sta. Rehab. 693 725 736 784 738 545<br />
12 Overflows/yr 676 711 727 774 735 545<br />
8 Overflows/yr 673 708 723 769 735 545<br />
4 Overflows/yr 670 704 718 764 735 545<br />
2 Overflows/yr 669 702 717 763 735 545<br />
0 Overflows/yr 665 699<br />
Flow<br />
714 759 735 545<br />
Separation 1155 1087 1096 1154 953 603<br />
\\Gh-wash\ENG 1160\LTCP\LTCP Final Draft #2 (Board)\App D-RC WQ\[LTCP_App D_RC7.xls]21<br />
Before Piney<br />
Branch<br />
<strong>DC</strong>/MD Boundary
District of Columbia <strong>Water</strong> and <strong>Sewer</strong> Authority<br />
<strong>Combined</strong> <strong>Sewer</strong> <strong>System</strong> <strong>Long</strong> <strong>Term</strong> <strong>Control</strong> <strong>Plan</strong><br />
Figure D-6<br />
Rock Creek: Effect of CSO <strong>Control</strong> on Fecal Coliform Concentrations<br />
(No Change in Upstream or Stormwater Loads)<br />
Fecal Coliforms - September Geometric Means<br />
No Phase 1 <strong>Control</strong>s Phase 1 <strong>Control</strong>s Flow Pump Sta. Rehab. 12 Overflows/yr 8 Overflows/yr<br />
4 Overflows/yr 2 Overflows/yr 0 Overflows/yr Separation<br />
1400<br />
1200<br />
MPN/ 100 mL<br />
1000<br />
800<br />
600<br />
400<br />
200<br />
0<br />
M Street Mass. Ave. Zoo After Piney Branch<br />
Before Piney<br />
Branch<br />
<strong>DC</strong>/MD Boundary<br />
No Phase 1 <strong>Control</strong>s 775 818 840 908 855 609<br />
Phase 1 <strong>Control</strong>s 775 818 840 908 855 609<br />
Pump Sta. Rehab. 775 818 840 908 855 609<br />
12 Overflows/yr 762 808 831 898 853 609<br />
8 Overflows/yr 759 805 827 891 853 609<br />
4 Overflows/yr 753 799 820 884 853 609<br />
2 Overflows/yr 752 798 819 883 853 609<br />
0 Overflows/yr 752 797 819 882 853 609<br />
Separation 1321 1222 1237 1311 1076 691<br />
\\Gh-wash\ENG 1160\LTCP\LTCP Final Draft #2 (Board)\App D-RC WQ\[LTCP_App D_RC7.xls]21
District of Columbia <strong>Water</strong> and <strong>Sewer</strong> Authority<br />
<strong>Combined</strong> <strong>Sewer</strong> <strong>System</strong> <strong>Long</strong> <strong>Term</strong> <strong>Control</strong> <strong>Plan</strong><br />
Figure D-7<br />
Rock Creek: Effect of CSO <strong>Control</strong> on Fecal Coliform Concentrations<br />
(No Change in Upstream or Stormwater Loads)<br />
E. Coli - # of Months Exceeding 126/ 100 mL<br />
No Phase 1 <strong>Control</strong>s Phase 1 <strong>Control</strong>s Flow Pump Sta. Rehab. 12 Overflows/yr 8 Overflows/yr<br />
4 Overflows/yr 2 Overflows/yr 0 Overflows/yr Separation<br />
12<br />
10<br />
ENTIRE CALENDAR YEAR<br />
# of Months/yr<br />
8<br />
6<br />
4<br />
2<br />
0<br />
M Street Mass. Ave. Zoo After Piney Branch<br />
Before Piney<br />
Branch<br />
<strong>DC</strong>/MD Boundary<br />
No Phase 1 <strong>Control</strong>s 12 12 12 12 12 12<br />
Phase 1 <strong>Control</strong>s 12 12 12 12 12 12<br />
Pump Sta. Rehab. 12 12 12 12 12 12<br />
12 Overflows/yr 12 12 12 12 12 12<br />
8 Overflows/yr 12 12 12 12 12 12<br />
4 Overflows/yr 12 12 12 12 12 12<br />
2 Overflows/yr 12 12 12 12 12 12<br />
0 Overflows/yr 12 12 12 12 12 12<br />
Separation 12 12 12 12 12 12<br />
E. Coli - # of Months Exceeding 126/ 100 mL<br />
No Phase 1 <strong>Control</strong>s Phase 1 <strong>Control</strong>s Pump Sta. Rehab. 12 Overflows/yr 8 Overflows/yr<br />
4 Overflows/yr 2 Overflows/yr 0 Overflows/yr Separation<br />
6<br />
5<br />
MAY THROUGH SEPTEMBER<br />
# of Months/yr<br />
4<br />
3<br />
2<br />
1<br />
0<br />
M Street Mass. Ave. Zoo After Piney Branch<br />
Before Piney<br />
Branch<br />
<strong>DC</strong>/MD Boundary<br />
No Phase 1 <strong>Control</strong>s 5 5 5 5 5 5<br />
Phase 1 <strong>Control</strong>s 5 5 5 5 5 5<br />
Pump Sta. Rehab. 5 5 5 5 5 5<br />
12 Overflows/yr 5 5 5 5 5 5<br />
8 Overflows/yr 5 5 5 5 5 5<br />
4 Overflows/yr 5 5 5 5 5 5<br />
2 Overflows/yr 5 5 5 5 5 5<br />
0 Overflows/yr 5 5 5 5 5 5<br />
Flow<br />
Separation 5 5 5 5 5 5<br />
\\Gh-wash\ENG 1160\LTCP\LTCP Final Draft #2 (Board)\App D-RC WQ\[LTCP_App D_RC7.xls]21
District of Columbia <strong>Water</strong> and <strong>Sewer</strong> Authority<br />
<strong>Combined</strong> <strong>Sewer</strong> <strong>System</strong> <strong>Long</strong> <strong>Term</strong> <strong>Control</strong> <strong>Plan</strong><br />
Figure D-8<br />
Rock Creek: Effect of CSO <strong>Control</strong> on Fecal Coliform Concentrations<br />
(No Change in Upstream or Stormwater Loads)<br />
E. Coli - # of Days Exceeding 126/100 mL<br />
No Phase 1 <strong>Control</strong>s Phase 1 <strong>Control</strong>s Flow Pump Sta. Rehab. 12 Overflows/yr 8 Overflows/yr<br />
4 Overflows/yr 2 Overflows/yr 0 Overflows/yr Separation<br />
370<br />
360<br />
ENTIRE CALENDAR YEAR<br />
# of Days/yr<br />
350<br />
340<br />
330<br />
320<br />
310<br />
M Street Mass. Ave. Zoo After Piney Branch<br />
Before Piney<br />
Branch<br />
<strong>DC</strong>/MD Boundary<br />
No Phase 1 <strong>Control</strong>s 331 350 362 365 365 365<br />
Phase 1 <strong>Control</strong>s 331 350 362 365 365 365<br />
Pump Sta. Rehab. 331 350 362 365 365 365<br />
12 Overflows/yr 331 350 362 365 365 365<br />
8 Overflows/yr 331 350 362 365 365 365<br />
4 Overflows/yr 331 350 362 365 365 365<br />
2 Overflows/yr 331 350 362 365 365 365<br />
0 Overflows/yr 331 350 362 365 365 365<br />
Separation 337 355 363 365 365 365<br />
E. Coli - # of Days Exceeding 126/100 mL<br />
No Phase 1 <strong>Control</strong>s Phase 1 <strong>Control</strong>s Pump Sta. Rehab. 12 Overflows/yr 8 Overflows/yr<br />
4 Overflows/yr 2 Overflows/yr 0 Overflows/yr Separation<br />
155<br />
150<br />
MAY THROUGH SEPTEMBER<br />
# of Days/yr<br />
145<br />
140<br />
135<br />
130<br />
125<br />
120<br />
M Street Mass. Ave. Zoo After Piney Branch<br />
Before Piney<br />
Branch<br />
<strong>DC</strong>/MD Boundary<br />
No Phase 1 <strong>Control</strong>s 132 144 153 153 153 153<br />
Phase 1 <strong>Control</strong>s 132 144 153 153 153 153<br />
Pump Sta. Rehab. 132 144 153 153 153 153<br />
12 Overflows/yr 132 144 153 153 153 153<br />
8 Overflows/yr 132 144 153 153 153 153<br />
4 Overflows/yr 132 144 153 153 153 153<br />
2 Overflows/yr 132 144 153 153 153 153<br />
0 Overflows/yr 132 144<br />
Flow<br />
153 153 153 153<br />
Separation 135 146 153 153 153 153<br />
\\Gh-wash\ENG 1160\LTCP\LTCP Final Draft #2 (Board)\App D-RC WQ\[LTCP_App D_RC7.xls]21
District of Columbia <strong>Water</strong> and <strong>Sewer</strong> Authority<br />
<strong>Combined</strong> <strong>Sewer</strong> <strong>System</strong> <strong>Long</strong> <strong>Term</strong> <strong>Control</strong> <strong>Plan</strong><br />
Figure D-9<br />
Rock Creek: Effect of CSO <strong>Control</strong> on Fecal Coliform Concentrations<br />
(No Change in Upstream or Stormwater Loads)<br />
E. Coli - # of Days Exceeding 576/100 mL<br />
No Phase 1 <strong>Control</strong>s Phase 1 <strong>Control</strong>s FlowPump Sta. Rehab. 12 Overflows/yr 8 Overflows/yr<br />
4 Overflows/yr 2 Overflows/yr 0 Overflows/yr Separation<br />
250<br />
200<br />
ENTIRE CALENDAR YEAR<br />
# of Days/yr<br />
150<br />
100<br />
50<br />
0<br />
M Street Mass. Ave. Zoo After Piney Branch<br />
Before Piney<br />
Branch<br />
<strong>DC</strong>/MD Boundary<br />
No Phase 1 <strong>Control</strong>s 173 179 182 185 184 155<br />
Phase 1 <strong>Control</strong>s 173 179 182 185 184 155<br />
Pump Sta. Rehab. 173 179 182 185 184 155<br />
12 Overflows/yr 172 179 182 185 183 155<br />
8 Overflows/yr 172 179 182 185 183 155<br />
4 Overflows/yr 172 179 182 185 183 155<br />
2 Overflows/yr 172 179 182 185 183 155<br />
0 Overflows/yr 172 179 182 185 183 155<br />
Separation 213 210 210 211 204 110<br />
E. Coli - # of Days Exceeding 576/100 mL<br />
No Phase 1 <strong>Control</strong>s Phase 1 <strong>Control</strong>s Pump Sta. Rehab. 12 Overflows/yr 8 Overflows/yr<br />
4 Overflows/yr 2 Overflows/yr 0 Overflows/yr Separation<br />
MAY THROUGH SEPTEMBER<br />
# of Days/yr<br />
100<br />
90<br />
80<br />
70<br />
60<br />
50<br />
40<br />
30<br />
20<br />
10<br />
0<br />
M Street Mass. Ave. Zoo After Piney Branch<br />
Before Piney<br />
Branch<br />
<strong>DC</strong>/MD Boundary<br />
No Phase 1 <strong>Control</strong>s 72 74 75 77 76 63<br />
Phase 1 <strong>Control</strong>s 72 74 75 77 76 63<br />
Pump Sta. Rehab. 72 74 75 77 76 63<br />
12 Overflows/yr 72 74 75 77 76 63<br />
8 Overflows/yr 72 74 75 77 76 63<br />
4 Overflows/yr 72 74 75 77 76 63<br />
2 Overflows/yr 72 74 75 77 76 63<br />
0 Overflows/yr 72 74 75 77 76 63<br />
Separation 89<br />
Flow<br />
87 86 87 83 43<br />
\\Gh-wash\ENG 1160\LTCP\LTCP Final Draft #2 (Board)\App D-RC WQ\[LTCP_App D_RC7.xls]21
District of Columbia <strong>Water</strong> and <strong>Sewer</strong> Authority<br />
<strong>Combined</strong> <strong>Sewer</strong> <strong>System</strong> <strong>Long</strong> <strong>Term</strong> <strong>Control</strong> <strong>Plan</strong><br />
Figure D-10<br />
Rock Creek: Effect of CSO <strong>Control</strong> on Fecal Coliform Concentrations<br />
(CSO Loads Only - no other loads present)<br />
Fecal Coliforms - # of Days of CSO Impact<br />
No Phase 1 <strong>Control</strong>s Phase 1 <strong>Control</strong>s Flow Pump Sta. Rehab. 12 Events/yr 8 Events/yr<br />
4 Events/yr 2 Events/yr 0 Overflows/yr Separation<br />
30<br />
25<br />
ENTIRE CALENDAR YEAR<br />
# of Days/yr<br />
20<br />
15<br />
10<br />
5<br />
0<br />
M Street Mass. Ave. Zoo After Piney Branch<br />
Before Piney<br />
Branch<br />
<strong>DC</strong>/MD Boundary<br />
No Phase 1 <strong>Control</strong>s 26 24 22 24 0 0<br />
Phase 1 <strong>Control</strong>s 26 24 22 24 0 0<br />
Pump Sta. Rehab. 26 24 22 24 0 0<br />
12 Events/yr 10 10 11 13 0 0<br />
8 Events/yr 7 7 7 9 0 0<br />
4 Events/yr 4 4 3 3 0 0<br />
2 Events/yr 3 2 2 2 0 0<br />
0 Overflows/yr 0 0 0 0 0 0<br />
Separation 0 0 0 0 0 0<br />
MAY THROUGH SEPTEMBER<br />
# of Days/yr<br />
18<br />
16<br />
14<br />
12<br />
10<br />
8<br />
6<br />
4<br />
2<br />
0<br />
Fecal Coliforms - # of Days of CSO Impact<br />
No Phase 1 <strong>Control</strong>s Phase 1 <strong>Control</strong>s Pump Sta. Rehab. 12 Events/yr 8 Events/yr<br />
4 Events/yr 2 Events/yr 0 Overflows/yr Separation<br />
M Street Mass. Ave. Zoo After Piney Branch<br />
Before Piney<br />
Branch<br />
<strong>DC</strong>/MD Boundary<br />
No Phase 1 <strong>Control</strong>s 17 16 14 15 0 0<br />
Phase 1 <strong>Control</strong>s 17 16 14 15 0 0<br />
Pump Sta. Rehab. 17 16 14 15 0 0<br />
12 Events/yr 7 7 8 8 0 0<br />
8 Events/yr 5 5 5 6 0 0<br />
4 Events/yr 3 3 2 2 0 0<br />
2 Events/yr 2 1 1 1 0 0<br />
0 Overflows/yr 0 0 0 0 0 0<br />
Separation 0<br />
Flow<br />
0 0 0 0 0<br />
\\Gh-wash\ENG 1160\LTCP\LTCP Final Draft #2 (Board)\App D-RC WQ\[LTCP_App D_RC7.xls]21
District of Columbia <strong>Water</strong> and <strong>Sewer</strong> Authority<br />
<strong>Combined</strong> <strong>Sewer</strong> <strong>System</strong> <strong>Long</strong> <strong>Term</strong> <strong>Control</strong> <strong>Plan</strong><br />
Figure D-11<br />
Rock Creek: Effect of CSO <strong>Control</strong> on Fecal Coliform Concentrations<br />
(CSO Loads Only - no other loads present)<br />
E. Coli - # of Days of CSO Impact (>126 /100 mL)<br />
No Phase 1 <strong>Control</strong>s Phase 1 <strong>Control</strong>s Flow Pump Sta. Rehab. 12 Events/yr 8 Events/yr<br />
4 Events/yr 2 Events/yr 0 Overflows/yr Separation<br />
30<br />
25<br />
ENTIRE CALENDAR YEAR<br />
# of Days/yr<br />
20<br />
15<br />
10<br />
5<br />
0<br />
M Street Mass. Ave. Zoo After Piney Branch<br />
Before Piney<br />
Branch<br />
<strong>DC</strong>/MD Boundary<br />
No Phase 1 <strong>Control</strong>s 26 25 23 24 0 0<br />
Phase 1 <strong>Control</strong>s 26 25 23 24 0 0<br />
Pump Sta. Rehab. 26 25 23 24 0 0<br />
12 Events/yr 10 11 12 13 0 0<br />
8 Events/yr 7 8 7 9 0 0<br />
4 Events/yr 4 4 4 4 0 0<br />
2 Events/yr 3 2 2 2 0 0<br />
0 Overflows/yr 0 0 0 0 0 0<br />
Separation 0 0 0 0 0 0<br />
MAY THROUGH SEPTEMBER<br />
# of Days/yr<br />
20<br />
18<br />
16<br />
14<br />
12<br />
10<br />
8<br />
6<br />
4<br />
2<br />
0<br />
E. Coli - # of Days of CSO Impact (>126 /100 mL)<br />
No Phase 1 <strong>Control</strong>s Phase 1 <strong>Control</strong>s Pump Sta. Rehab. 12 Events/yr 8 Events/yr<br />
4 Events/yr 2 Events/yr 0 Overflows/yr Separation<br />
M Street Mass. Ave. Zoo After Piney Branch<br />
Before Piney<br />
Branch<br />
<strong>DC</strong>/MD Boundary<br />
No Phase 1 <strong>Control</strong>s 18 16 14 15 0 0<br />
Phase 1 <strong>Control</strong>s 18 16 14 15 0 0<br />
Pump Sta. Rehab. 18 16 14 15 0 0<br />
12 Events/yr 7 8 8 8 0 0<br />
8 Events/yr 5 5 5 6 0 0<br />
4 Events/yr 3 3 2 2 0 0<br />
2 Events/yr 2 1 1 1 0 0<br />
0 Overflows/yr 0 0<br />
Flow<br />
0 0 0 0<br />
Separation 0 0 0 0 0 0<br />
\\Gh-wash\ENG 1160\LTCP\LTCP Final Draft #2 (Board)\App D-RC WQ\[LTCP_App D_RC7.xls]21
District of Columbia <strong>Water</strong> and <strong>Sewer</strong> Authority<br />
<strong>Combined</strong> <strong>Sewer</strong> <strong>System</strong> <strong>Long</strong> <strong>Term</strong> <strong>Control</strong> <strong>Plan</strong><br />
Figure D-12<br />
Rock Creek: Effect of CSO <strong>Control</strong> on Fecal Coliform Concentrations<br />
(CSO Loads Only - no other loads present)<br />
# of Days/yr<br />
E. Coli - # of Days of CSO Impact (>576 /100 mL)<br />
No Phase 1 <strong>Control</strong>s Phase 1 <strong>Control</strong>s Pump Sta. Rehab.<br />
Flow<br />
12 Overflows/yr 8 Overflows/yr<br />
4 Overflows/yr 2 Overflows/yr 0 Overflows/yr Separation<br />
18<br />
16<br />
14<br />
12<br />
10<br />
8<br />
6<br />
4<br />
2<br />
0<br />
M Street Mass. Ave. Zoo After Piney Branch<br />
Before Piney<br />
Branch<br />
<strong>DC</strong>/MD Boundary<br />
No Phase 1 <strong>Control</strong>s 16 15 14 16 0 0<br />
Phase 1 <strong>Control</strong>s 16 15 14 16 0 0<br />
Pump Sta. Rehab. 16 15 14 16 0 0<br />
12 Overflows/yr 9 9 10 10 0 0<br />
8 Overflows/yr 6 6 6 6 0 0<br />
4 Overflows/yr 2 2 2 2 0 0<br />
2 Overflows/yr 2 2 2 2 0 0<br />
0 Overflows/yr 0 0 0 0 0 0<br />
Separation 0 0 0 0 0 0<br />
E. Coli - # of Days of CSO Impact (>576 /100 mL)<br />
No Phase 1 <strong>Control</strong>s Phase 1 <strong>Control</strong>s Pump Sta. Rehab. 12 Overflows/yr 8 Overflows/yr<br />
4 Overflows/yr 2 Overflows/yr 0 Overflows/yr Separation<br />
12<br />
10<br />
# of Days/yr<br />
8<br />
6<br />
4<br />
2<br />
0<br />
M Street Mass. Ave. Zoo After Piney Branch<br />
No Phase 1 <strong>Control</strong>s 11 10 9 10 0 0<br />
Phase 1 <strong>Control</strong>s 11 10 9 10 0 0<br />
Pump Sta. Rehab. 11 10 9 10 0 0<br />
12 Overflows/yr 6 6 7 7 0 0<br />
8 Overflows/yr 4 4 4 4 0 0<br />
4 Overflows/yr 1 1 1 1 0 0<br />
2 Overflows/yr 1 1 1 1 0 0<br />
0 Overflows/yr 0 0<br />
Flow<br />
0 0 0 0<br />
Separation 0 0 0 0 0 0<br />
\\Gh-wash\ENG 1160\LTCP\LTCP Final Draft #2 (Board)\App D-RC WQ\[LTCP_App D_RC7.xls]21<br />
Before Piney<br />
Branch<br />
<strong>DC</strong>/MD Boundary
District of Columbia <strong>Water</strong> and <strong>Sewer</strong> Authority<br />
<strong>Combined</strong> <strong>Sewer</strong> <strong>System</strong> <strong>Long</strong> <strong>Term</strong> <strong>Control</strong> <strong>Plan</strong><br />
Figure D-13<br />
Rock Creek: Effect of CSO <strong>Control</strong> on Fecal Coliform Concentrations<br />
(Upstream and Stormwater Load Reduction 1 )<br />
Fecal Coliforms - # of Months Exceeding Class A Standard<br />
No Phase 1 <strong>Control</strong>s Phase 1 <strong>Control</strong>s FlowPump Sta. Rehab. 12 Overflows/yr 8 Overflows/yr<br />
4 Overflows/yr 2 Overflows/yr 0 Overflows/yr Separation<br />
12<br />
10<br />
ENTIRE CALENDAR YEAR<br />
# of Months/yr<br />
8<br />
6<br />
4<br />
2<br />
0<br />
M Street Mass. Ave. Zoo After Piney Branch<br />
Before Piney<br />
Branch<br />
<strong>DC</strong>/MD Boundary<br />
No Phase 1 <strong>Control</strong>s 12 12 12 12 12 0<br />
Phase 1 <strong>Control</strong>s 12 12 12 12 12 0<br />
Pump Sta. Rehab. 12 12 12 12 12 0<br />
12 Overflows/yr 12 12 12 12 12 0<br />
8 Overflows/yr 12 12 12 12 12 0<br />
4 Overflows/yr 12 12 12 12 12 0<br />
2 Overflows/yr 12 12 12 12 12 0<br />
0 Overflows/yr 12 12 12 12 12 0<br />
Separation 12 12 12 12 12 0<br />
Fecal Coliforms - # of Months Exceeding Class A Standard<br />
No Phase 1 <strong>Control</strong>s Phase 1 <strong>Control</strong>s Pump Sta. Rehab. 12 Overflows/yr 8 Overflows/yr<br />
4 Overflows/yr 2 Overflows/yr 0 Overflows/yr Separation<br />
6<br />
5<br />
MAY THROUGH SEPTEMBER<br />
# of Months/yr<br />
4<br />
3<br />
2<br />
1<br />
0<br />
M Street Mass. Ave. Zoo After Piney Branch<br />
Before Piney<br />
Branch<br />
<strong>DC</strong>/MD Boundary<br />
No Phase 1 <strong>Control</strong>s 5 5 5 5 5 0<br />
Phase 1 <strong>Control</strong>s 5 5 5 5 5 0<br />
Pump Sta. Rehab. 5 5 5 5 5 0<br />
12 Overflows/yr 5 5 5 5 5 0<br />
8 Overflows/yr 5 5 5 5 5 0<br />
4 Overflows/yr 5 5 5 5 5 0<br />
2 Overflows/yr 5 5 5 5 5 0<br />
0 Overflows/yr 5 5<br />
Flow<br />
5 5 5 0<br />
Separation 5 5 5 5 5 0<br />
\\Gh-wash\ENG 1160\LTCP\LTCP Final Draft #2 (Board)\App D-RC WQ\[LTCP_App D_RC7.xls]21<br />
1 Storm water: 40% reduction in loads, Upstream: 40% reduction in nutrients<br />
Fecal coliforms at 80% of water quality standard (concentration = 160/100 ml)
District of Columbia <strong>Water</strong> and <strong>Sewer</strong> Authority<br />
<strong>Combined</strong> <strong>Sewer</strong> <strong>System</strong> <strong>Long</strong> <strong>Term</strong> <strong>Control</strong> <strong>Plan</strong><br />
Figure D-14<br />
Rock Creek: Effect of CSO <strong>Control</strong> on Fecal Coliform Concentrations<br />
(Upstream and Stormwater Load Reduction 1 )<br />
Fecal Coliforms - # of Months Exceeding Class B Standard<br />
No Phase 1 <strong>Control</strong>s Phase 1 <strong>Control</strong>s FlowPump Sta. Rehab. 12 Overflows/yr 8 Overflows/yr<br />
4 Overflows/yr 2 Overflows/yr 0 Overflows/yr Separation<br />
12<br />
10<br />
ENTIRE CALENDAR YEAR<br />
# of Months/yr<br />
8<br />
6<br />
4<br />
2<br />
0<br />
M Street Mass. Ave. Zoo After Piney Branch<br />
Before Piney<br />
Branch<br />
<strong>DC</strong>/MD Boundary<br />
No Phase 1 <strong>Control</strong>s 0 0 0 0 0 0<br />
Phase 1 <strong>Control</strong>s 0 0 0 0 0 0<br />
Pump Sta. Rehab. 0 0 0 0 0 0<br />
12 Overflows/yr 0 0 0 0 0 0<br />
8 Overflows/yr 0 0 0 0 0 0<br />
4 Overflows/yr 0 0 0 0 0 0<br />
2 Overflows/yr 0 0 0 0 0 0<br />
0 Overflows/yr 0 0 0 0 0 0<br />
Separation 3 2 2 2 0 0<br />
Fecal Coliforms - # of Months Exceeding Class B Standard<br />
No Phase 1 <strong>Control</strong>s Phase 1 <strong>Control</strong>s Pump Sta. Rehab. 12 Overflows/yr 8 Overflows/yr<br />
4 Overflows/yr 2 Overflows/yr 0 Overflows/yr Separation<br />
5<br />
4<br />
MAY THROUGH SEPTEMBER<br />
# of Months/yr<br />
3<br />
2<br />
1<br />
0<br />
M Street Mass. Ave. Zoo After Piney Branch<br />
Before Piney<br />
Branch<br />
<strong>DC</strong>/MD Boundary<br />
No Phase 1 <strong>Control</strong>s 0 0 0 0 0 0<br />
Phase 1 <strong>Control</strong>s 0 0 0 0 0 0<br />
Pump Sta. Rehab. 0 0 0 0 0 0<br />
12 Overflows/yr 0 0 0 0 0 0<br />
8 Overflows/yr 0 0 0 0 0 0<br />
4 Overflows/yr 0 0 0 0 0 0<br />
2 Overflows/yr 0 0 0 0 0 0<br />
0 Overflows/yr 0 0<br />
Flow<br />
0 0 0 0<br />
Separation 1 1 1 1 0 0<br />
\\Gh-wash\ENG 1160\LTCP\LTCP Final Draft #2 (Board)\App D-RC WQ\[LTCP_App D_RC7.xls]21<br />
1 Storm water: 40% reduction in loads, Upstream: 40% reduction in nutrients<br />
Fecal coliforms at 80% of water quality standard (concentration = 160/100 ml)
District of Columbia <strong>Water</strong> and <strong>Sewer</strong> Authority<br />
<strong>Combined</strong> <strong>Sewer</strong> <strong>System</strong> <strong>Long</strong> <strong>Term</strong> <strong>Control</strong> <strong>Plan</strong><br />
Figure D-15<br />
Rock Creek: Effect of CSO <strong>Control</strong> on Fecal Coliform Concentrations<br />
(Upstream and Stormwater Load Reduction 1 )<br />
Fecal Coliforms - # of Days >200/100ml<br />
No Phase 1 <strong>Control</strong>s Phase 1 <strong>Control</strong>s FlowPump Sta. Rehab. 12 Overflows/yr 8 Overflows/yr<br />
4 Overflows/yr 2 Overflows/yr 0 Overflows/yr Separation<br />
250<br />
200<br />
ENTIRE CALENDAR YEAR<br />
# of Days/yr<br />
150<br />
100<br />
50<br />
0<br />
M Street Mass. Ave. Zoo After Piney Branch<br />
Before Piney<br />
Branch<br />
<strong>DC</strong>/MD Boundary<br />
No Phase 1 <strong>Control</strong>s 171 173 174 174 173 4<br />
Phase 1 <strong>Control</strong>s 171 173 174 174 173 4<br />
Pump Sta. Rehab. 171 173 174 174 173 4<br />
12 Overflows/yr 170 173 173 174 172 4<br />
8 Overflows/yr 170 173 173 174 172 4<br />
4 Overflows/yr 170 173 173 174 172 4<br />
2 Overflows/yr 170 173 173 174 172 4<br />
0 Overflows/yr 170 173 173 174 172 4<br />
Separation 234 231 224 223 212 1<br />
Fecal Coliforms - # of Days >200/100ml<br />
No Phase 1 <strong>Control</strong>s Phase 1 <strong>Control</strong>s Pump Sta. Rehab. 12 Overflows/yr 8 Overflows/yr<br />
4 Overflows/yr 2 Overflows/yr 0 Overflows/yr Separation<br />
120<br />
100<br />
MAY THROUGH SEPTEMBER<br />
# of Days/yr<br />
80<br />
60<br />
40<br />
20<br />
0<br />
M Street Mass. Ave. Zoo After Piney Branch<br />
Before Piney<br />
Branch<br />
<strong>DC</strong>/MD Boundary<br />
No Phase 1 <strong>Control</strong>s 75 77 77 77 76 2<br />
Phase 1 <strong>Control</strong>s 75 77 77 77 76 2<br />
Pump Sta. Rehab. 75 77 77 77 76 2<br />
12 Overflows/yr 75 77 77 77 76 2<br />
8 Overflows/yr 75 77 77 77 76 2<br />
4 Overflows/yr 75 77 77 77 76 2<br />
2 Overflows/yr 75 77 77 77 76 2<br />
0 Overflows/yr 75 Flow 77 77 77 76 2<br />
Separation 99 99 97 96 92 1<br />
\\Gh-wash\ENG 1160\LTCP\LTCP Final Draft #2 (Board)\App D-RC WQ\[LTCP_App D_RC7.xls]21<br />
1 Storm water: 40% reduction in loads, Upstream: 40% reduction in nutrients<br />
Fecal coliforms at 80% of water quality standard (concentration = 160/100 ml)
District of Columbia <strong>Water</strong> and <strong>Sewer</strong> Authority<br />
<strong>Combined</strong> <strong>Sewer</strong> <strong>System</strong> <strong>Long</strong> <strong>Term</strong> <strong>Control</strong> <strong>Plan</strong><br />
Figure D-16<br />
Rock Creek: Effect of CSO <strong>Control</strong> on Fecal Coliform Concentrations<br />
(Upstream and Stormwater Load Reduction 1 )<br />
Fecal Coliforms - May Geometric Means<br />
No Phase 1 <strong>Control</strong>s Phase 1 <strong>Control</strong>s Pump Sta. Rehab.<br />
Flow<br />
12 Overflows/yr 8 Overflows/yr<br />
4 Overflows/yr 2 Overflows/yr 0 Overflows/yr Separation<br />
1,400<br />
1,200<br />
MPN/ 100 mL<br />
1,000<br />
800<br />
600<br />
400<br />
200<br />
0<br />
M Street Mass. Ave. Zoo After Piney Branch<br />
Before Piney<br />
Branch<br />
<strong>DC</strong>/MD Boundary<br />
No Phase 1 <strong>Control</strong>s 457 470 462 493 411 159<br />
Phase 1 <strong>Control</strong>s 457 470 462 493 411 159<br />
Pump Sta. Rehab. 457 470 462 493 411 159<br />
12 Overflows/yr 423 437 435 461 404 159<br />
8 Overflows/yr 417 431 428 452 404 159<br />
4 Overflows/yr 407 419 414 435 404 159<br />
2 Overflows/yr 405 418 413 433 404 159<br />
0 Overflows/yr 401 414 409 429 404 159<br />
Separation 1,202 966 921 918 576 159<br />
Fecal Coliforms - June Geometric Means<br />
No Phase 1 <strong>Control</strong>s Phase 1 <strong>Control</strong>s Pump Sta. Rehab. 12 Overflows/yr 8 Overflows/yr<br />
4 Overflows/yr 2 Overflows/yr 0 Overflows/yr Separation<br />
700<br />
600<br />
MPN/ 100 mL<br />
500<br />
400<br />
300<br />
200<br />
100<br />
0<br />
M Street Mass. Ave. Zoo After Piney Branch<br />
No Phase 1 <strong>Control</strong>s 310 321 319 337 303 158<br />
Phase 1 <strong>Control</strong>s 310 321 319 337 303 158<br />
Pump Sta. Rehab. 310 321 319 337 303 158<br />
12 Overflows/yr 294 305 307 324 302 158<br />
8 Overflows/yr 288 299 300 316 302 158<br />
4 Overflows/yr 286 297 297 313 302 158<br />
2 Overflows/yr 286 297 297 313 302 158<br />
0 Overflows/yr 286 296<br />
Flow<br />
297 313 302 158<br />
Separation 620 543 529 540 411 158<br />
\\Gh-wash\ENG 1160\LTCP\LTCP Final Draft #2 (Board)\App D-RC WQ\[LTCP_App D_RC7.xls]21<br />
Before Piney<br />
Branch<br />
<strong>DC</strong>/MD Boundary<br />
1 Storm water: 40% reduction in loads, Upstream: 40% reduction in nutrients<br />
Fecal coliforms at 80% of water quality standard (concentration = 160/100 ml)
District of Columbia <strong>Water</strong> and <strong>Sewer</strong> Authority<br />
<strong>Combined</strong> <strong>Sewer</strong> <strong>System</strong> <strong>Long</strong> <strong>Term</strong> <strong>Control</strong> <strong>Plan</strong><br />
Figure D-17<br />
Rock Creek: Effect of CSO <strong>Control</strong> on Fecal Coliform Concentrations<br />
(Upstream and Stormwater Load Reduction 1 )<br />
Fecal Coliforms - July Geometric Means<br />
No Phase 1 <strong>Control</strong>s Phase 1 <strong>Control</strong>s FlowPump Sta. Rehab. 12 Overflows/yr 8 Overflows/yr<br />
4 Overflows/yr 2 Overflows/yr 0 Overflows/yr Separation<br />
1,200<br />
1,000<br />
MPN/ 100 mL<br />
800<br />
600<br />
400<br />
200<br />
0<br />
M Street Mass. Ave. Zoo After Piney Branch<br />
Before Piney<br />
Branch<br />
<strong>DC</strong>/MD Boundary<br />
No Phase 1 <strong>Control</strong>s 440 451 450 475 403 159<br />
Phase 1 <strong>Control</strong>s 440 451 450 475 403 159<br />
Pump Sta. Rehab. 440 451 450 475 403 159<br />
12 Overflows/yr 410 424 424 447 399 159<br />
8 Overflows/yr 401 414 412 433 399 159<br />
4 Overflows/yr 394 407 405 424 399 159<br />
2 Overflows/yr 393 406 403 423 399 159<br />
0 Overflows/yr 390 403 401 420 399 159<br />
Separation 985 838 817 833 566 158<br />
Fecal Coliforms - August Geometric Means<br />
No Phase 1 <strong>Control</strong>s Phase 1 <strong>Control</strong>s Pump Sta. Rehab. 12 Overflows/yr 8 Overflows/yr<br />
4 Overflows/yr 2 Overflows/yr 0 Overflows/yr Separation<br />
800<br />
700<br />
MPN/ 100 mL<br />
600<br />
500<br />
400<br />
300<br />
200<br />
100<br />
0<br />
M Street Mass. Ave. Zoo After Piney Branch<br />
Before Piney<br />
Branch<br />
<strong>DC</strong>/MD Boundary<br />
No Phase 1 <strong>Control</strong>s 309 323 325 348 319 158<br />
Phase 1 <strong>Control</strong>s 309 323 325 348 319 158<br />
Pump Sta. Rehab. 309 323 325 348 319 158<br />
12 Overflows/yr 298 313 318 340 315 158<br />
8 Overflows/yr 296 311 315 337 315 158<br />
4 Overflows/yr 294 308 312 333 315 158<br />
2 Overflows/yr 293 307 311 332 315 158<br />
0 Overflows/yr 290 305<br />
Flow<br />
309 330 315 158<br />
Separation 717 628 615 632 455 157<br />
\\Gh-wash\ENG 1160\LTCP\LTCP Final Draft #2 (Board)\App D-RC WQ\[LTCP_App D_RC7.xls]21<br />
1 Storm water: 40% reduction in loads, Upstream: 40% reduction in nutrients<br />
Fecal coliforms at 80% of water quality standard (concentration = 160/100 ml)
District of Columbia <strong>Water</strong> and <strong>Sewer</strong> Authority<br />
<strong>Combined</strong> <strong>Sewer</strong> <strong>System</strong> <strong>Long</strong> <strong>Term</strong> <strong>Control</strong> <strong>Plan</strong><br />
Figure D-18<br />
Rock Creek: Effect of CSO <strong>Control</strong> on Fecal Coliform Concentrations<br />
(Upstream and Stormwater Load Reduction 1 )<br />
Fecal Coliforms - September Geometric Means<br />
No Phase 1 <strong>Control</strong>s Phase 1 <strong>Control</strong>s FlowPump Sta. Rehab. 12 Overflows/yr 8 Overflows/yr<br />
4 Overflows/yr 2 Overflows/yr 0 Overflows/yr Separation<br />
800<br />
700<br />
600<br />
MPN/ 100 mL<br />
500<br />
400<br />
300<br />
200<br />
100<br />
0<br />
M Street Mass. Ave. Zoo After Piney Branch<br />
Before Piney<br />
Branch<br />
<strong>DC</strong>/MD Boundary<br />
No Phase 1 <strong>Control</strong>s 321 338 345 376 342 158<br />
Phase 1 <strong>Control</strong>s 321 338 345 376 342 158<br />
Pump Sta. Rehab. 321 338 345 376 342 158<br />
12 Overflows/yr 312 331 339 369 340 158<br />
8 Overflows/yr 310 329 336 365 340 158<br />
4 Overflows/yr 306 324 331 359 340 158<br />
2 Overflows/yr 306 324 330 358 340 158<br />
0 Overflows/yr 305 323 330 358 340 158<br />
Separation 759 658 653 682 483 158<br />
\\Gh-wash\ENG 1160\LTCP\LTCP Final Draft #2 (Board)\App D-RC WQ\[LTCP_App D_RC7.xls]21<br />
1 Storm water: 40% reduction in loads, Upstream: 40% reduction in nutrients<br />
Fecal coliforms at 80% of water quality standard (concentration = 160/100 ml)
District of Columbia <strong>Water</strong> and <strong>Sewer</strong> Authority<br />
<strong>Combined</strong> <strong>Sewer</strong> <strong>System</strong> <strong>Long</strong> <strong>Term</strong> <strong>Control</strong> <strong>Plan</strong><br />
Figure D-19<br />
Rock Creek: Effect of CSO <strong>Control</strong> on Fecal Coliform Concentrations<br />
(Upstream and Stormwater Load Reduction 1 )<br />
E. Coli - # of Months Exceeding 126/ 100 mL<br />
No Phase 1 <strong>Control</strong>s Phase 1 <strong>Control</strong>s Flow Pump Sta. Rehab. 12 Overflows/yr 8 Overflows/yr<br />
4 Overflows/yr 2 Overflows/yr 0 Overflows/yr Separation<br />
12<br />
10<br />
ENTIRE CALENDAR YEAR<br />
# of Months/yr<br />
8<br />
6<br />
4<br />
2<br />
0<br />
M Street Mass. Ave. Zoo After Piney Branch<br />
Before Piney<br />
Branch<br />
<strong>DC</strong>/MD Boundary<br />
No Phase 1 <strong>Control</strong>s 12 12 12 12 12 0<br />
Phase 1 <strong>Control</strong>s 12 12 12 12 12 0<br />
Pump Sta. Rehab. 12 12 12 12 12 0<br />
12 Overflows/yr 12 12 12 12 12 0<br />
8 Overflows/yr 12 12 12 12 12 0<br />
4 Overflows/yr 12 12 12 12 12 0<br />
2 Overflows/yr 12 12 12 12 12 0<br />
0 Overflows/yr 12 12 12 12 12 0<br />
Separation 12 12 12 12 12 0<br />
E. Coli - # of Months Exceeding 126/ 100 mL<br />
No Phase 1 <strong>Control</strong>s Phase 1 <strong>Control</strong>s Pump Sta. Rehab. 12 Overflows/yr 8 Overflows/yr<br />
4 Overflows/yr 2 Overflows/yr 0 Overflows/yr Separation<br />
5<br />
4<br />
MAY THROUGH SEPTEMBER<br />
# of Months/yr<br />
3<br />
2<br />
1<br />
0<br />
M Street Mass. Ave. Zoo After Piney Branch<br />
Before Piney<br />
Branch<br />
<strong>DC</strong>/MD Boundary<br />
No Phase 1 <strong>Control</strong>s 2 3 3 5 3 0<br />
Phase 1 <strong>Control</strong>s 2 3 3 5 3 0<br />
Pump Sta. Rehab. 2 3 3 5 3 0<br />
12 Overflows/yr 2 3 3 4 3 0<br />
8 Overflows/yr 2 2 3 4 3 0<br />
4 Overflows/yr 2 2 2 4 3 0<br />
2 Overflows/yr 2 2 2 4 3 0<br />
0 Overflows/yr 2 2<br />
Flow<br />
2 3 3 0<br />
Separation 5 5 5 5 5 0<br />
\\Gh-wash\ENG 1160\LTCP\LTCP Final Draft #2 (Board)\App D-RC WQ\[LTCP_App D_RC7.xls]21
District of Columbia <strong>Water</strong> and <strong>Sewer</strong> Authority<br />
<strong>Combined</strong> <strong>Sewer</strong> <strong>System</strong> <strong>Long</strong> <strong>Term</strong> <strong>Control</strong> <strong>Plan</strong><br />
Figure D-20<br />
Rock Creek: Effect of CSO <strong>Control</strong> on Fecal Coliform Concentrations<br />
(Upstream and Stormwater Load Reduction 1 )<br />
E. Coli - # of Days Exceeding 126/100 mL<br />
No Phase 1 <strong>Control</strong>s Phase 1 <strong>Control</strong>s Flow Pump Sta. Rehab. 12 Overflows/yr 8 Overflows/yr<br />
4 Overflows/yr 2 Overflows/yr 0 Overflows/yr Separation<br />
250<br />
200<br />
ENTIRE CALENDAR YEAR<br />
# of Days/yr<br />
150<br />
100<br />
50<br />
0<br />
M Street Mass. Ave. Zoo After Piney Branch<br />
Before Piney<br />
Branch<br />
<strong>DC</strong>/MD Boundary<br />
No Phase 1 <strong>Control</strong>s 169 171 171 174 171 4<br />
Phase 1 <strong>Control</strong>s 169 171 171 174 171 4<br />
Pump Sta. Rehab. 169 171 171 174 171 4<br />
12 Overflows/yr 168 170 170 173 170 4<br />
8 Overflows/yr 168 170 170 173 170 4<br />
4 Overflows/yr 168 170 170 173 170 4<br />
2 Overflows/yr 168 170 170 173 170 4<br />
0 Overflows/yr 168 170 170 173 170 4<br />
Separation 232 228 220 219 211 1<br />
E. Coli - # of Days Exceeding 126/100 mL<br />
No Phase 1 <strong>Control</strong>s Phase 1 <strong>Control</strong>s Pump Sta. Rehab. 12 Overflows/yr 8 Overflows/yr<br />
4 Overflows/yr 2 Overflows/yr 0 Overflows/yr Separation<br />
120<br />
100<br />
MAY THROUGH SEPTEMBER<br />
# of Days/yr<br />
80<br />
60<br />
40<br />
20<br />
0<br />
M Street Mass. Ave. Zoo After Piney Branch<br />
Before Piney<br />
Branch<br />
<strong>DC</strong>/MD Boundary<br />
No Phase 1 <strong>Control</strong>s 75 75 75 77 76 2<br />
Phase 1 <strong>Control</strong>s 75 75 75 77 76 2<br />
Pump Sta. Rehab. 75 75 75 77 76 2<br />
12 Overflows/yr 75 75 75 77 76 2<br />
8 Overflows/yr 75 75 75 77 76 2<br />
4 Overflows/yr 75 75 75 77 76 2<br />
2 Overflows/yr 75 75 75 77 76 2<br />
0 Overflows/yr 75 75 75 77 76 2<br />
Flow<br />
Separation 99 98 95 94 92 1<br />
\\Gh-wash\ENG 1160\LTCP\LTCP Final Draft #2 (Board)\App D-RC WQ\[LTCP_App D_RC7.xls]21
District of Columbia <strong>Water</strong> and <strong>Sewer</strong> Authority<br />
<strong>Combined</strong> <strong>Sewer</strong> <strong>System</strong> <strong>Long</strong> <strong>Term</strong> <strong>Control</strong> <strong>Plan</strong><br />
Figure D-21<br />
Rock Creek: Effect of CSO <strong>Control</strong> on Fecal Coliform Concentrations<br />
(Upstream and Stormwater Load Reduction 1 )<br />
E. Coli - # of Days Exceeding 576/100 mL<br />
No Phase 1 <strong>Control</strong>s Phase 1 <strong>Control</strong>s FlowPump Sta. Rehab. 12 Overflows/yr 8 Overflows/yr<br />
4 Overflows/yr 2 Overflows/yr 0 Overflows/yr Separation<br />
ENTIRE CALENDAR YEAR<br />
# of Days/yr<br />
200<br />
180<br />
160<br />
140<br />
120<br />
100<br />
80<br />
60<br />
40<br />
20<br />
0<br />
M Street Mass. Ave. Zoo After Piney Branch<br />
Before Piney<br />
Branch<br />
<strong>DC</strong>/MD Boundary<br />
No Phase 1 <strong>Control</strong>s 93 93 89 94 86 0<br />
Phase 1 <strong>Control</strong>s 93 93 89 94 86 0<br />
Pump Sta. Rehab. 93 93 89 94 86 0<br />
12 Overflows/yr 91 91 88 90 83 0<br />
8 Overflows/yr 91 91 88 90 83 0<br />
4 Overflows/yr 91 91 88 90 83 0<br />
2 Overflows/yr 91 91 88 90 83 0<br />
0 Overflows/yr 91 91 88 90 83 0<br />
Separation 172 159 155 156 116 0<br />
E. Coli - # of Days Exceeding 576/100 mL<br />
No Phase 1 <strong>Control</strong>s Phase 1 <strong>Control</strong>s Pump Sta. Rehab. 12 Overflows/yr 8 Overflows/yr<br />
4 Overflows/yr 2 Overflows/yr 0 Overflows/yr Separation<br />
80<br />
70<br />
60<br />
MAY THROUGH SEPTEMBER<br />
# of Days/yr<br />
50<br />
40<br />
30<br />
20<br />
10<br />
0<br />
M Street Mass. Ave. Zoo After Piney Branch<br />
Before Piney<br />
Branch<br />
<strong>DC</strong>/MD Boundary<br />
No Phase 1 <strong>Control</strong>s 41 42 40 42 38 0<br />
Phase 1 <strong>Control</strong>s 41 42 40 42 38 0<br />
Pump Sta. Rehab. 41 42 40 42 38 0<br />
12 Overflows/yr 40 40 39 40 38 0<br />
8 Overflows/yr 40 40 39 40 38 0<br />
4 Overflows/yr 40 40 39 40 38 0<br />
2 Overflows/yr 40 40 39 40 38 0<br />
0 Overflows/yr 40 40 39 40 38 0<br />
Separation 74 68 66 66 50 0<br />
Flow<br />
\\Gh-wash\ENG 1160\LTCP\LTCP Final Draft #2 (Board)\App D-RC WQ\[LTCP_App D_RC7.xls]21
District of Columbia <strong>Water</strong> and <strong>Sewer</strong> Authority<br />
<strong>Combined</strong> <strong>Sewer</strong> <strong>System</strong> <strong>Long</strong> <strong>Term</strong> <strong>Control</strong> <strong>Plan</strong><br />
APPENDIX E<br />
Basis for Cost Opinions<br />
\\Gh-wash\ENG 1160\LTCP\LTCP Final\App E-Cost Basis\Cost Basis.doc
Appendix E – Basis for Cost Opinions<br />
Appendix E<br />
Basis For Cost Opinions<br />
1. GENERAL<br />
In order to compare the alternatives, cost opinions including construction, capital, and operating and<br />
maintenance costs were prepared for each alternative carried forward. This appendix provides the<br />
bases for cost opinions.<br />
In accordance with the Association for the Advancement of Cost Engineering definitions (AACE,<br />
1997), cost opinions included in this document are considered to be concept screening level<br />
estimates, with an expected accuracy of +40%, -15%. Cost opinions are of this accuracy because<br />
alternatives have been prepared with a minimum of detailed design data for the purposes of relative<br />
comparison. This type of analysis is appropriate for comparisons between control programs.<br />
2. CONSTRUCTION COSTS<br />
2.1 Methodology<br />
The following cost bases were used for the preparation of construction cost opinions:<br />
<br />
Construction Cost Index - The annual average Engineering News Record (ENR) Construction<br />
Cost Index (CCI) for year 2000 was 6221, with a monthly value of 6283 for December 2000.<br />
During the previous five years, the CCI has increased an average of 2.6% per year. This<br />
percentage was used to estimate an annual average CCI of 6383 for year 2001, which has been<br />
used as the basis for all costs prepared herein.<br />
<br />
Approach to Estimating Construction Costs- costs have been prepared using the following<br />
resources:<br />
o Generic facility and treatment plant cost curves such as:<br />
Construction Costs for Municipal Wastewater Treatment <strong>Plan</strong>ts: 1973-1982<br />
(EPA, 1978)<br />
Manual - <strong>Combined</strong> <strong>Sewer</strong> Overflow <strong>Control</strong>, (EPA 1993a)<br />
Cost Estimating Manual – <strong>Combined</strong> <strong>Sewer</strong> Overflow Storage and Teratment<br />
(EPA, 1976)<br />
Pumping Station Design (Sanks, 1998).<br />
o Unit costs in dollars per gallon or cost per linear foot obtained from other projects. Costs<br />
have been adjusted for relative characteristics such as complexity or location using<br />
engineering judgement.<br />
o Cost data from similar facilities:<br />
Costs from other studies<br />
Engineer’s estimates of construction cost<br />
\\Gh-wash\ENG 1160\LTCP\LTCP Final\App E-Cost Basis\Cost Basis.doc E-1 FINAL - July 2002
Appendix E – Basis for Cost Opinions<br />
Bid tabulations from similar projects. Where bid tabulations were available, the<br />
second and third bidder’s unit prices were considered in addition to the low<br />
bidders unit prices.<br />
o Where facilities are unique or customized and cost curve type data does not exist was not<br />
applicable, conceptual layouts of facilities were prepared and costs were estimated by<br />
performing takeoffs to estimate quantities.<br />
<br />
Calculation Procedure - the following calculation procedure was used for construction costs:<br />
Table 1<br />
Calculation Procedure For Construction Cost Opinions<br />
Line Number Description Calculation Procedure<br />
1 Subtotal of Construction Line Items --<br />
2 Construction Contingencies 30% x Line 1<br />
3 Total Construction Cost Sum of Lines 1 and 2<br />
2.2 <strong>Sewer</strong> Separation<br />
Data used to estimate separation costs in the District was obtained from the following sources, as<br />
shown in Table 2:<br />
<br />
<br />
Data from other Cities – Many cities have evaluated separation as part of the preparation of<br />
LTCPs. Either estimated or bid costs of separation were available.<br />
District Estimates – Estimates of the cost of separation of select drainage areas within the District<br />
have been calculated in other reports. In addition, in 1957, the Board of Engineers completed a<br />
cost estimate to completely separate the combined sewer area in the District.<br />
The cost of separating the combined sewer area in the District was estimated as follows:<br />
<br />
<br />
<br />
A GIS coverage land use map of the District was obtained from MWCOG. This land use map<br />
classified the entire area of the District by development type (commercial, industrial, residential,<br />
institutional, government, or open area), density, and percent imperviousness. For the purposes<br />
of calculating separation costs, each land use classification was assigned a category of low,<br />
medium, or high density, as shown in Table 3.<br />
Based on the land use map, the percentages of each combined sewershed according to category<br />
were calculated.<br />
The total cost of separation for each combined sewershed was calculated by multiplying the<br />
acreage of each category by the unit cost per acre for each ($240,000 for high, $150,000 for<br />
medium, and $85,000 for low). These costs were estimated based on review of the existing data.<br />
\\Gh-wash\ENG 1160\LTCP\LTCP Final\App E-Cost Basis\Cost Basis.doc E-2 FINAL - July 2002
Appendix E – Basis for Cost Opinions<br />
Table 2<br />
<strong>Sewer</strong> Separation Construction Cost Data<br />
CSO Drainage<br />
Area<br />
Estimated<br />
Construction<br />
Cost<br />
(ENR=6383)<br />
Unit<br />
Construction<br />
Cost($/acre,<br />
ENR=6383)<br />
City<br />
Type of Data<br />
Other Municipalities<br />
Alexandria, VA 885 $30,567,703 $34,540 Estimate<br />
Chicago, IL 240,000 $18,030,662,872 $75,128 Estimate<br />
San Francisco, CA 24,995 $9,765,513,443 $390,699 Estimate<br />
Peoria, IL 61.3 $2,913,813 $47,534 Estimate<br />
Richmond, VA 11,000 $2,278,815,025 $207,165 Estimate<br />
Minneapolis, MN 4,000 $82,576,260 $20,644 Estimate<br />
Columbus, OH 22 $974,610 $44,300 Bid<br />
S. Dorchester Bay, Boston, MA 786 $91,522,842 $116,441 Bid<br />
Stony Brook, Boston, MA 608 $48,223,919 $79,316 Estimate<br />
Cambridge, Boston, MA 250 $70,000,000 $280,000 Estimate<br />
Garden City, MI 1,180 $33,294,117 $28,215 Bid<br />
Livonia, MI 103 $1,200,124 $11,652 Bid<br />
Plymouth Township, MI 138 $1,044,489 $7,569 Bid<br />
Wayne, MI 288 $7,405,272 $25,713 Bid<br />
Westland, MI 409 $9,518,952 $23,274 Bid<br />
Bloomfield Hills, MI 86 $1,831,426 $21,296 Bid<br />
District<br />
Board of Engineers, 1957 11,741 $1,886,687,845 $160,692 Estimate<br />
Anacostia River, (OB&G, 1983) 240 $17,264,076 $71,933 Estimate<br />
College Pond (Massey, 1962) 231 $42,401,248 $183,555 Estimate<br />
Southwest <strong>DC</strong>, (Gan. Flem., 1958) 890 $120,701,773 $135,620 Estimate<br />
Slash Run, (RK&K, 1961) 593 $43,148,031 $72,762 Estimate<br />
Table 3<br />
<strong>Sewer</strong> Separation Land Use Density Data<br />
Land Use<br />
Description<br />
Density Used for Cost of<br />
<strong>Sewer</strong> Separation<br />
C1 Low density commercial low<br />
C2 Moderate density commercial medium<br />
C3 Medium Density commercial medium<br />
C4 Medium-high density commercial high<br />
C5 High density commercial high<br />
I1 Industrial medium<br />
M1 Moderate commercial and Moderate Residential medium<br />
M2 Low Commercial and Low residential low<br />
M3 Federal and Local Public high<br />
M4 High commercial and Low residential medium<br />
M5 Medium commercial & moderate residential medium<br />
M6 Moderate commercial & medium residential medium<br />
M7 Low commercial and moderate residential medium<br />
M8 Low commercial and high residential high<br />
M10 Moderate commercial and industrial medium<br />
M11 Federal and Medium Commercial high<br />
M13 Institutional and medium residential medium<br />
\\Gh-wash\ENG 1160\LTCP\LTCP Final\App E-Cost Basis\Cost Basis.doc E-3 FINAL - July 2002
Appendix E – Basis for Cost Opinions<br />
Land Use<br />
Description<br />
Density Used for Cost of<br />
<strong>Sewer</strong> Separation<br />
M14<br />
Medium-high commercial and industrial, high<br />
residential<br />
high<br />
M15<br />
Moderate commercial and industrial, medium<br />
residential<br />
medium<br />
M16 Moderate commercial, moderate residential, park medium<br />
M17 Medium-high commercial, industrial high<br />
M18<br />
Moderate commercial, institutional, moderate<br />
residential<br />
medium<br />
M19 Low commercial and moderate residential medium<br />
M20 Medium commercial and high residential high<br />
M21 Medium commercial and medium residential medium<br />
M22 Moderate commercial + Local government medium<br />
M23 Medium-high commercial and high institutional high<br />
P1 Federal medium<br />
P2 Local public facilities High<br />
P3 (C4) Institutional high<br />
P4 Parks low<br />
R1 Low density residential low<br />
R2 Moderate density residential medium<br />
R3 Medium density residential medium<br />
R4 High density residential high<br />
W1 <strong>Water</strong> low<br />
Z1 Mixed Use medium<br />
2.3 Regulator Structures<br />
Regulator structures control the diversion of CSO flow from outfall sewers to downstream facilities<br />
such as interceptors, retention facilities and treatment facilities. Construction cost data from recent<br />
(1996-2000) regulators constructed for the City of Richmond, Virginia are summarized in Table 4<br />
and are plotted on Figure 1. The equation for construction cost as a function of flow rate in million<br />
gallons per day (mgd) was determined to be:<br />
Cost = 6075.3(mgd) + 180,000<br />
\\Gh-wash\ENG 1160\LTCP\LTCP Final\App E-Cost Basis\Cost Basis.doc E-4 FINAL - July 2002
Appendix E – Basis for Cost Opinions<br />
Table 4<br />
Existing Wet Weather Regulator Cost Data<br />
Design<br />
Diversion<br />
Capacity<br />
(mgd)<br />
Construction<br />
Cost<br />
(ENR=6383)<br />
Construction Cost/mgd<br />
(ENR=6383)<br />
City of Richmond<br />
Regulator<br />
Byrd Street 11.6 $238,335 $20,546<br />
7th Street 32 $359,859 $11,352<br />
Park Hydro 38 $417,094 $10,947<br />
Reedy Creek 68 $432,774 $6,346<br />
42nd Street 73 $358,124 $4,879<br />
McCloy Street 81 $357,400 $4,423<br />
Woodland<br />
83.5 $730,863 $8,753<br />
Heights<br />
Hampton Street 97 $445,000 $4,592<br />
Gambles Hill 122 $1,612,351 $13,205<br />
Canoe Run 239 $1,630,946 $6,824<br />
2.4 Conveyance Pipelines<br />
Costs for pipelines were developed using manufacturer’s costs for pipes and unit costs in Means and<br />
other estimating references. Costs include manholes, sediment and erosion, and thrust restraint for<br />
force mains. A pipe depth of 20 feet in an urban congested area was assumed.<br />
Table 5<br />
Unit Construction Costs for Pipelines<br />
Pipe Diameter<br />
Unit Cost ($/linear foot)<br />
Gravity <strong>Sewer</strong>s<br />
18” $423<br />
24” $482<br />
30” $548<br />
36” $619<br />
42” $697<br />
48” $772<br />
54” $854<br />
60” $948<br />
66” $1,027<br />
72” $1,112<br />
78” $1,202<br />
84” $1,318<br />
90” $1,432<br />
96” $1,551<br />
102” $1,769<br />
108” $1,923<br />
114” $2,143<br />
120” $2,192<br />
126” $2,432<br />
132” $2,533<br />
138” $2,800<br />
144” $2,852<br />
\\Gh-wash\ENG 1160\LTCP\LTCP Final\App E-Cost Basis\Cost Basis.doc E-5 FINAL - July 2002
Appendix E – Basis for Cost Opinions<br />
Pipe Diameter<br />
Unit Cost ($/linear foot)<br />
Force Mains<br />
12” $328<br />
16” $463<br />
18” $509<br />
24” $592<br />
30” $650<br />
36” $599<br />
42” $657<br />
48” $710<br />
54” $799<br />
60” $874<br />
66” $959<br />
72” $1,035<br />
78” $1,129<br />
84” $1,280<br />
90” $1,385<br />
96” $1,516<br />
2.5 Pumping Stations<br />
Cost data for pumping stations were obtained from actual facilities, EPA cost curves, and Sanks (see<br />
references). This construction cost data are plotted on Figure 2. A best-fit polynomial equation<br />
whose values were greater than or equal to most of the plotted values was developed. The equation<br />
for construction cost as a function of flow rate (MGD) was determined to be:<br />
Up to 300 mgd: Cost = 0.0307(mgd) 3 – 125.76(mgd) 2 + 213,533(mgd) + 279,183<br />
Over 300 mgd: Cost = -3.2655(mgd) 2 + 45481(mgd) + 40,000,000<br />
2.6 CSO Storage Facilities<br />
Costs for CSO storage facilities were obtained from actual facilities and from EPA cost curves.<br />
Costs are summarized in Table 6 below.<br />
Table 6<br />
Existing Storage Facility Construction Cost Data<br />
Construction Cost<br />
(Millions,<br />
ENR=6383)<br />
Storage<br />
Location<br />
Volume (mg)<br />
Mariposa - San Francisco, CA 0.7 $13.02 $18.60<br />
Fitzhugh – Saginaw, MI 1.2 $6.42 $5.35<br />
Seven Mile – Detroit MI 2 $16.44 $8.22<br />
Union Park – Boston, MA 2.5 $38.16 $15.27<br />
Eliza Howell – Detroit, MI 2.8 $19.94 $7.12<br />
Salt/Frazer – Saginaw MI 2.8 $14.82 $5.29<br />
Seneca WWTP 3 $3.62 $1.21<br />
Chattanooga, TN 3.5 $6.4 $1.83<br />
Webber – Saginaw, MI 3.6 $9.45 $2.63<br />
Unit Cost ($/gallon,<br />
ENR=6383)<br />
\\Gh-wash\ENG 1160\LTCP\LTCP Final\App E-Cost Basis\Cost Basis.doc E-6 FINAL - July 2002
Appendix E – Basis for Cost Opinions<br />
Construction Cost<br />
(Millions,<br />
ENR=6383)<br />
Storage<br />
Location<br />
Volume (mg)<br />
Acacia Park , MI 4.5 $15.23 $3.38<br />
Narragansett Bay , RI 1 5 $29.19 $5.84<br />
Emerson – Saginaw, MI 5 $21.12 $4.22<br />
Birmingham, MI 5.5 $13.81 $2.51<br />
WSSC – Rock Creek 6 $21.19 $3.53<br />
Sunny Dale - San Francisco, CA 6.2 $25.47 $4.11<br />
14 th Street – Saginaw, MI 6.5 $16.65 $2.56<br />
Weiss Street – Saginaw, MI 9.5 $28.65 $3.02<br />
Bloomfield Village, MI 10.2 $31.67 $3.1<br />
Edmund – Oakland, CA 11 $32.37 $2.94<br />
Yosemite – San Francisco, CA 11.5 $26.5 $2.3<br />
Tournament Club, Detroit 22 $59.19 $2.69<br />
North Shore, San Francisco, CA 24 $106.35 $4.43<br />
Unit Cost ($/gallon,<br />
ENR=6383)<br />
Market Ave. Retention Basin, Grand 30.5 $38.41 $1.26<br />
Rapids, MI<br />
Shockoe basin – Richmond, VA 38 $52.11 $1.37<br />
EPA has also produced a cost curve for offline storage as follows:<br />
Storage Basin Cost = 3.627 V 0.826 ; with V = volume in gallons, ENR = 4800<br />
EPA’s cost curve and the construction cost data from actual facilities are plotted on Figure 3. As<br />
shown on the Figure, there is a broad range in actual facility costs. This is due to many factors,<br />
including site constraints, geology (e.g. piles or rock excavation required), unit processes included<br />
with the basin such as screening or disinfection, and the need to mitigate impacts to the surrounding<br />
neighborhood such as including odor control. As an example, the Mariposa facility in San Francisco<br />
and the Union Park Detention Center in Boston are two facilities with the highest cost per gallon<br />
stored ($18.60 and $15.27 respectively). In the case of Mariposa, the storage facility is an<br />
underground, custom-built storage transfer box with small volume (0.7 MG) and varying width (from<br />
20 to 30 feet along its length) in a heavily urban setting. The Union Park Detention Center project<br />
included retrofits to an existing pumping station in addition to the construction of four underground<br />
storage tanks, fine screens, disinfection, and two sewer diversion structures with control gates. If<br />
retention basins were constructed in the District, they would be in a heavily urban setting and would<br />
likely be in the upper range of unit costs. Therefore, the “Value to Use” line for construction cost as<br />
a function of storage volume in million gallons (mg) as shown in Figure 3 will be used in cost<br />
opinions. This line’s equation is:<br />
Cost = 0.0307(mg) 3 – 125.76(mg) 2 + 213,533(mg) + 279,183<br />
\\Gh-wash\ENG 1160\LTCP\LTCP Final\App E-Cost Basis\Cost Basis.doc E-7 FINAL - July 2002
Appendix E – Basis for Cost Opinions<br />
2.7 Tunnels and Drop Shafts<br />
Cost data for tunnels were gathered from a variety of sources as follows:<br />
<br />
<br />
<br />
<br />
Previous studies concerning CSO control within the District:<br />
o Report to District of Columbia Department of Sanitary Engineering on Improvements<br />
to <strong>Sewer</strong>age <strong>System</strong> (Board of Engineers, 1957.)<br />
o <strong>Combined</strong> <strong>Sewer</strong> Overflow Abatement Alternatives (EPA 1970). This report was<br />
prepared by Roy F. Weston, Inc. for EPA.<br />
o Reconnaissance Study of <strong>Combined</strong> <strong>Sewer</strong> Overflows and Storm <strong>Sewer</strong> Discharges,<br />
Metcalf and Eddy, 1973 (Metcalf and Eddy 1973)<br />
An local engineering firm specializing in tunneling , Dr. G. Sauer Corporation, was retained<br />
to evaluate tunnel feasibility and prepare cost estimates for the LTCP (Dr. G. Sauer Corp,<br />
2001).<br />
Actual cost data for tunnels built by the Washington Metropolitan Area Transit Authority<br />
(WMATA) for the District’s “Metro” public transit system.<br />
Actual and estimated cost data for other tunnel obtained from other municipalities.<br />
Tunnels in soils are significantly more expensive than those in rock and cost were thus developed<br />
separately for each of the tunneling media. This data is shown in Tables 7 and 8.<br />
Table 7<br />
Construction Cost Data for Tunnels in Rock<br />
Source of Data<br />
Finished<br />
Diameter (ft)<br />
Unit Cost<br />
($/LF, ENR=6383)<br />
EPA (Weston) Cost Curve 10 $ 2,305<br />
15 $ 2,979<br />
20 $ 3,723<br />
25 $ 4,255<br />
30 $ 4,965<br />
Board of Engineers Estimate 10 $ 3,100<br />
15 $ 5,471<br />
Narragansett Bay, Rhode Island Estimate 10 $ 931<br />
20 $ 2,060<br />
30 $ 3,315<br />
Dr. G. Sauer Corp. Full Face Tunnel Boring<br />
Machine, 5-10,000' long tunnel 10 $ 2,062<br />
15 $ 2,319<br />
20 $ 2,577<br />
25 $ 3,221<br />
30 $ 3,866<br />
Dr. G. Sauer Corp. Full Face Tunnel Boring<br />
Machine, greater than 10,000' long tunnel 10 $ 1,964<br />
\\Gh-wash\ENG 1160\LTCP\LTCP Final\App E-Cost Basis\Cost Basis.doc E-8 FINAL - July 2002
Appendix E – Basis for Cost Opinions<br />
Source of Data<br />
Finished<br />
Diameter (ft)<br />
Unit Cost<br />
($/LF, ENR=6383)<br />
15 $ 2,210<br />
20 $ 2,455<br />
25 $ 3,069<br />
30 $ 3,683<br />
Dr. G. Sauer Corp. Hand Mine, New<br />
Austrian Tunneling Method, 5-10,000' long<br />
tunnel 10 $ 2,937<br />
15 $ 3,304<br />
20 $ 3,671<br />
25 $ 4,589<br />
30 $ 5,507<br />
Dr. G. Sauer Corp. Hand Mine, New<br />
Austrian Tunneling Method, >10,000' long<br />
tunnel 10 $ 2,863<br />
15 $ 3,221<br />
20 $ 3,579<br />
25 $ 4,474<br />
30 $ 5,369<br />
Dr. G. Sauer Corp., Weathered Rock, Hand<br />
Mine, New Austrian Tunneling Method ,<br />
Appendix E – Basis for Cost Opinions<br />
Table 8<br />
Construction Cost Data for Tunnels in Soil<br />
Source of Data<br />
Finished<br />
Diameter (ft)<br />
Unit Cost<br />
($/LF, ENR=6383)<br />
Board of Engineers Estimate 7 $ 3,647<br />
10 $ 5,927<br />
15 $ 9,848<br />
M & E 1973 Estimate – Low / High 12 $ 2,128 / $ 5,319<br />
20 $ 5,319 / $ 8,865<br />
30 $ 10,461 / $ 15,958<br />
New York City Estimate 20 $ 6,146<br />
25 $ 8,000<br />
30 $ 10,000<br />
Other Cities<br />
Cleveland 20 $ 3,646<br />
Birmingham, MI 11 $ 1,123<br />
Chicago, IL 12 $ 1,618<br />
Toledo, OH 13.5 $ 2,027<br />
Toledo, OH 13.5 $ 2,659<br />
PCI, MI 13.5 $ 3,605<br />
Wyandotte, MI 13.5 $ 1,763<br />
Washington, <strong>DC</strong> 21 $ 4,880<br />
Dr. G. Sauer Corp, in Potomac Deposits, 5-<br />
10,000' long tunnel 10 $ 3,192<br />
15 $ 3,591<br />
20 $ 3,990<br />
25 $ 4,988<br />
30 $ 5,985<br />
Dr. G. Sauer Corp, in Potomac Deposits,<br />
>10,000' long tunnel 10 $ 3,031<br />
15 $ 3,410<br />
20 $ 3,789<br />
25 $ 4,736<br />
30 $ 5,684<br />
Dr. G. Sauer Corp, in Terrace Deposits, 5-<br />
10,000' long tunnel 10 $ 4,038<br />
15 $ 4,542<br />
20 $ 5,047<br />
25 $ 6,309<br />
30 $ 7,571<br />
Dr. G. Sauer Corp, in Terrace Deposits,<br />
>10,000' long tunnel 10 $ 3,864<br />
15 $ 4,347<br />
20 $ 4,830<br />
25 $ 6,038<br />
30 $ 7,245<br />
\\Gh-wash\ENG 1160\LTCP\LTCP Final\App E-Cost Basis\Cost Basis.doc E-10 FINAL - July 2002
Appendix E – Basis for Cost Opinions<br />
Source of Data<br />
Finished<br />
Diameter (ft)<br />
Unit Cost<br />
($/LF, ENR=6383)<br />
WMATA (by contract no)<br />
C-4 15 $ 2,913<br />
D-9 15 $ 5,283<br />
F-3c 15 $ 4,657<br />
E4b 15 $ 3,182<br />
E4b 15 $ 4,053<br />
The aforementioned cost data per linear foot of tunnel were plotted against finished tunnel diameter,<br />
for excavation in both rock and soil, as shown in Figure 4. For both rock and soil tunnels, a best-fit<br />
polynomial equation whose values were greater than or equal to most of the plotted values was<br />
developed. The equations for both rock and soil tunnels as a function of finished tunnel diameter in<br />
feet are as follows:<br />
Cost = 3(dia) 2 + 35(dia) + 2,410<br />
(rock)<br />
Cost = 6.7143(dia) 2 - 85.571(dia) + 5,000<br />
(soil)<br />
2.8 Tunnel Drop Shafts<br />
Drop shafts will be required to convey flow from the elevation of the outfalls (near grade) down to<br />
tunnel level. Drop shafts were based on the vortex drop design based on pilot studies by Jain and<br />
Kennedy (Jain and Kennedy, 1983) for the Milwaukee CSO tunnel system. The drop shafts typically<br />
include:<br />
<br />
<br />
<br />
Tangential inlets – an approach channel designed to even out the flow streamlines and to<br />
force the flow into a spiral pattern.<br />
Drop shafts – vertical drop shafts where the CSO falls downward in a spiral pattern. The<br />
spiral pattern is designed to allow air to escape up the central core, preventing bulking of<br />
the flow. It also dissipates the energy gained by the flow when falling vertically.<br />
Deaeration chamber – chamber at the bottom of the drop shaft where air is allowed to<br />
escape before the CSO enters the main tunnel.<br />
Drop shafts were assumed to be 130’ deep. Preliminary layouts were prepared for 75, 200 and 1500<br />
mgd facilities, and quantity takeoffs and cost estimates were prepared as shown in Table 9.<br />
\\Gh-wash\ENG 1160\LTCP\LTCP Final\App E-Cost Basis\Cost Basis.doc E-11 FINAL - July 2002
Appendix E – Basis for Cost Opinions<br />
Table 9<br />
Tangential Inlet, Drop Shaft and Deaeration Chamber Construction Costs<br />
Flow Rate (mgd) Tangential Inlet Drop Shaft Deaeration Chamber<br />
75 $237,529 $1,014,659 $263,393<br />
200 $315,345 $1,139,258 $498,640<br />
1500 $961,961 $1,832,252 $2,330,315<br />
The values in Table 9 were used to develop construction cost curves as a function of flow rate in mgd<br />
(Figure 5). The derived equations are as follows:<br />
Cost = 503.89(mgd) + 206,813<br />
Cost = 4.2855(mgd) + 7,685.3<br />
Cost = 1,433.5(mgd) + 182,624<br />
(tangential inlets)<br />
(drop shafts)<br />
(deaeration chambers)<br />
2.9 Reductions in Dry Weather Flow<br />
WASA’s Wastewater Flow Reduction and <strong>Water</strong> Conservation Programs have developed<br />
preliminary cost estimates for various types of programs designed to base dry weather flow. These<br />
programs are summarized in Table 10, and are compared to conservation and flow reduction<br />
programs from New York City and Chicago. The unit cost of these programs covers a wide range,<br />
from $1 million/mgd to over $60 million/mgd. An average of $10 million/MGD of dry weather flow<br />
reduction will be used for the LTCP.<br />
Table 10<br />
Dry Weather Flow Reduction<br />
Reduction<br />
in Flow<br />
(mgd)<br />
Updated<br />
Construction<br />
Cost ($M)<br />
(ENR=6383<br />
$Million<br />
dollars/mgd<br />
removed<br />
Item<br />
Source<br />
I/I removal 1 4.1 $3.7 $0.9 WASA Wastewater Flow<br />
Reduction <strong>Plan</strong> (Peer, 1999a)<br />
Storm <strong>Sewer</strong><br />
3.5 $50 $14 WASA Wastewater Flow<br />
Separation 1 Reduction <strong>Plan</strong> (Peer, 1999a)<br />
Sanitary <strong>Sewer</strong><br />
Separation 1 6.5 $406 $62 WASA Wastewater Flow<br />
Reduction <strong>Plan</strong> (Peer, 1999a)<br />
Ground <strong>Water</strong><br />
Diversion 1 8.6 $43 $5 WASA Wastewater Flow<br />
Reduction (Peer, 1999a)<br />
<strong>Water</strong> Conservation<br />
Measures<br />
6.4 $14 $2.2 WASA <strong>Water</strong> Conservation<br />
<strong>Plan</strong> (Peer, 1999b)<br />
New York City Toilet<br />
Rebate Program<br />
70-90 $290 $3.6 New York City <strong>Water</strong><br />
Conservation Programs<br />
(NYC, 1999)<br />
\\Gh-wash\ENG 1160\LTCP\LTCP Final\App E-Cost Basis\Cost Basis.doc E-12 FINAL - July 2002
Appendix E – Basis for Cost Opinions<br />
Chicago 2 1 $10-$20 $10-$20 Chicago <strong>Sewer</strong> Condition<br />
Assessment (Greeley and<br />
Hansen, 1995)<br />
Notes:<br />
1. Capital costs in study were converted to Construction costs and updated to 2001 dollars (ENR=6383)<br />
2. Cost were calculated by assuming an existing infiltration rate of 5,000 gpd/inch-mile was reduced to 400<br />
gpd/inch-mile for representative 24” diameter and 72” diameter sewers. The 24” sewer was assumed to be<br />
rehabilitated by cured in place lining, while the 72” pipe was rehabilitated by cast in place concrete lining.<br />
2.10 High Rate Physical Chemical Treatment<br />
Costs for high rate treatment facilities were obtained from estimates on proposed facilities and from<br />
the manufacturer’s information, as shown in Table 11 below. As the application of this technology<br />
to CSO treatment is relatively new, none of the facilities under construction in the US have been<br />
completed. As a high rate treatment process must be integrated with existing wastewater plant<br />
infrastructure, there are many site specific construction requirements which may not be represented<br />
by the bid tabs of other projects. Note that the total cost of high rate treatment and ancillary facilities<br />
may include upgrades to existing facilities that are unrelated to the high rate treatment installation.<br />
The values in Table 11 were used to develop a construction cost curve as a function of flow rate in<br />
mgd (Figure 5). The developed equation is:<br />
Cost = -0.0002(mgd) 2 + 0.4426(mgd) + 7.5562<br />
Location<br />
Table 11<br />
Construction Cost of High Rate Treatment Facilities<br />
Flow Rate<br />
(MGD)<br />
Cost for High Rate<br />
only ($M,<br />
ENR=6383)<br />
Cost, High Rate and<br />
Ancillary Facilities<br />
($M, ENR=6383)<br />
Unit Cost<br />
($k/mgd,<br />
ENR=6383)<br />
St. Bernard, LA (bid tab) 10 $0.6 $8.5 $850<br />
Bremerton, WA 20 - $4.1 $205<br />
Lawrence, KS 40 $10 $37.5 $938<br />
Jefferson County, LA 60 $6 - -<br />
(proposed)<br />
Dallas, TX 110 - $30.0 $273<br />
Onondaga County, NY 126 - $91.0 $722<br />
Paerdegat Basin, the 500<br />
$27.5<br />
$165.0<br />
$330<br />
Bronx, NY (proposed) 750<br />
$41.1<br />
$216.0<br />
$288<br />
2.11 Low Impact Development-Retrofit (LID-R)<br />
Based on a literature review, the design parameters and costs of more than 20 LID-R technologies<br />
were determined as shown in Table 12 below. The technologies were divided into those that have a<br />
high probability of being applicable to the District, and those that appear to have a low probability.<br />
For example, earthen retention/detention basins unlikely to be widely applicable to built-up areas like<br />
the District.<br />
\\Gh-wash\ENG 1160\LTCP\LTCP Final\App E-Cost Basis\Cost Basis.doc E-13 FINAL - July 2002
Appendix E – Basis for Cost Opinions<br />
Base Year Costs in Literature<br />
ENR<br />
Low End<br />
CCI Units Cost Type Cost<br />
Table 12<br />
LID Facility Data<br />
High End<br />
Cost<br />
Escalated Costs<br />
(ENR = 6383)<br />
Low End High End<br />
Cost Cost<br />
Convert to<br />
$/Imp acre<br />
Technology Year<br />
Notes<br />
High Probability<br />
of Applicability<br />
Infiltration Trench 1997 5825 ft 3 Constr. - $ 4.00 - $ 4.38 Typical for a 100' trench. $ 19,889 1<br />
1997 5826 ft 3 Constr. $ 2.00 $ 4.00 $ 2.19 $ 4.38 $ 19,886 3<br />
1991 4835 ft 3 Constr. $ 1.73 $ 3.67 $ 2.29 $ 4.84<br />
Low end for a 100x10x6<br />
(LxWxH) trench,High end for<br />
a 100x4x3 (LxWxH) trench.<br />
Unit cost per volume based on<br />
treatment volume, assuming<br />
32% porosity. $ 21,965 3<br />
Typical for a 0.25 acre<br />
Infiltration Basin 1997 5825 ft 3 Constr. - $ 1.30 - $ 1.42 infiltration basin. $ 6,464 1<br />
1991 4835 ft 3 Constr. - $ 0.80 - $ 1.06 For a 1.0 acre basin. $ 4,792 3<br />
Porous Pavement 1991 4835 acres Constr. - $ 50,000 - $ 66,008 $ 66,008 3<br />
1987 4398 acres Constr. - $ 80,000 - $ 116,107 $ 116,107 3<br />
2001 6383 acres Constr. - $ 87,120 - $ 87,120 $ 87,120 5<br />
Incremental cost over the cost<br />
1991 4835 acres Constr. $ 43,560 $ 87,120 $ 57,506 $ 115,013 of conventional asphalt. $ 115,013 7<br />
Concrete Grid<br />
Pavement 1981 3533 acres Constr. $ 43,560 $ 87,120<br />
Incremental cost over the cost<br />
$ 78,699 $ 157,398 of conventional asphalt. $ 157,398 7<br />
Perimeter sand filters are<br />
medium cost, surface and<br />
underground are most<br />
Sand Filter 1997 5825 ft 3 Constr. $ 3.00 $ 6.00 $ 3.29 $ 6.57 expensive. $ 29,833 1<br />
1994 5410 Imp Ac Constr. $ 3,400 $ 50,000 $ 4,011 $ 58,993 $ 58,993 8<br />
Sand<br />
Filter/Filtration<br />
Basin 1990 4728 ft 3 Constr. $ 1.00 $ 11.00 $ 1.35 $ 14.85 $ 67,385 7<br />
Bioretention 1997 5825 ft 3 Constr. - $ 5.30 - $ 5.81<br />
Usually designed as a<br />
constant fraction of the total<br />
drainage area, and therefore is<br />
relatively constant in cost. $ 26,353 1<br />
Based on cost per square foot,<br />
and assuming 6 inches of<br />
storage in the filter strip.<br />
Loewst cost assumes buffer<br />
uses existing vegetation, and<br />
highest cost assumes that sods<br />
was used to establish the filter<br />
Filter Strip 1997 5825 ft 3 Constr. $ - $ 1.30 $ - $ 1.42 strip. $ 6,464 1<br />
Roof Drain<br />
Redirection 1999 6060 ea Constr. $ 45 $ 75 $ 47 $ 79 4<br />
Basement Sump<br />
Pump Redirection 1999 6060 ea Constr. $ 300 $ 500 $ 316 $ 527 4<br />
Flow Restriction<br />
for c.b.'s 1999 6060 ea Constr. $ 500 $ 1,200 $ 527 $ 1,264 4<br />
Streets 2001 6383 lf Constr. - $ 121 - $ 121<br />
Street width of 16' paved<br />
surface, 8' of parking on<br />
grasscrete underlain with 36"<br />
of gravel and a sidewalk on<br />
one side. $ 219,615 5<br />
A layer of soil and compost<br />
mixture under swales and<br />
Soil Amendments 2001 6383 sf Constr. - $ 0.36 - $ 0.36 bioretention cells. $ 15,682 5<br />
Rooftop Rainwater<br />
collection system 2001 6383 ea Constr. - $ 8,000 - $ 8,000<br />
Per household<br />
5<br />
<strong>Water</strong> Quality Inlet 1991 4835 ea Constr. $ 1,100 $ 3,000 $ 1,452 $ 3,960 7<br />
<strong>Water</strong> Quality Inlet<br />
with Sand Filters 1991 4835 acres Constr. - $ 10,000 - $ 13,202 7<br />
Oil/Grit Separator 1987 4398 acres Constr. $ 15,000 $ 20,000 $ 21,770 $ 29,027 7<br />
Source<br />
\\Gh-wash\ENG 1160\LTCP\LTCP Final\App E-Cost Basis\Cost Basis.doc E-14 FINAL - July 2002
Appendix E – Basis for Cost Opinions<br />
Escalated Costs<br />
Base Year Costs in Literature<br />
(ENR = 6383)<br />
ENR<br />
Low End High End Low End High End<br />
Convert to<br />
Technology Year CCI Units Cost Type Cost Cost Cost Cost<br />
Notes<br />
$/Imp acre Source<br />
Green Roofs (thin) 2001 6383 sf Constr. $ 15 $ 20 $ 15 $ 20 $ 871,200 9<br />
Low Probability<br />
of Applicability<br />
Green Roofs<br />
(walkable) 2001 6383 sf Constr. $ 75 $ - $ 75 $3,267,000 10<br />
Retention and<br />
Detention Basins 1997 5825 ft 3 Constr. $ 0.50 $ 1.00 $ 0.55 $<br />
Low unit cost for 150,000 ft3,<br />
1.10 high unit cost for 15,000 ft3 $ 4,972 1<br />
1991 4835 ft 3 Constr. - $ 1.06 - $<br />
For 0.25 acre, 23,300 ft3<br />
basin (moderate cost for this<br />
1.40 size) $ 6,350 2<br />
1991 4835 ft 3 Constr. - $ 0.43 - $<br />
For 1.0 acre, 148,000 ft3<br />
basin (moderate cost for this<br />
0.57 size) $ 2,576 2<br />
1991 4835 ft 3 Constr. - $ 0.33 - $<br />
For 3.0 acre, 547,000 ft3<br />
basin (moderate cost for this<br />
0.44 size) $ 1,977 2<br />
1991 4835 ft 3 Constr. - $ 0.31 - $<br />
For 5.0 acre, 952,000 ft3<br />
basin (moderate cost for this<br />
0.41 size) $ 1,857 2<br />
Extended<br />
Detention Dry<br />
Pond 1991 4835 ft 3 Constr. $ 0.05 $ 3.20 $ 0.07 $<br />
Average is $0.50/ cubic ft<br />
4.22<br />
$ 19,169 7<br />
Wet Pond and<br />
Extended<br />
Detention Wet<br />
Pond 1991 4835 ft 3 Constr. $ 0.05 $ 1.00 $ 0.07 $<br />
Storage Volume < 1,000,000<br />
cubic ft, Average is $0.50/<br />
cubic ft<br />
1.32<br />
$ 5,990 7<br />
1991 4835 ft 3 Constr. $ 0.05 $ 0.50 $ 0.07 $<br />
Storage Volume > 1,000,000<br />
cubic ft, Average is $0.25/<br />
0.66 cubic ft $ 2,995 7<br />
Constructed<br />
It was assumed Wetlands<br />
would be 25% more<br />
expensive than retention<br />
Wetland 1997 5825 ft 3 Constr. $ 0.60 $ 1.25 $ 0.66 $ 1.37 basins $ 6,215 1<br />
Grass Swale 1997 5825 ft 3 Constr. - $ 0.50 - $<br />
Based on cost per square foot,<br />
assuming 6 inches of storage<br />
0.55 in filter. $ 2,486 1<br />
Swale 2001 6383 lf Constr. - $ 8.00 - $<br />
Includes fine grading and<br />
8.00 vegetation installation. NA 5<br />
Sources:<br />
1. US EPA. Preliminary Data Summary of Urban Storm <strong>Water</strong> Best Management Practices. August 1999. Page 6-3.<br />
2. US EPA. Preliminary Data Summary of Urban Storm <strong>Water</strong> Best Management Practices. August 1999. Page 6-7.<br />
3. US EPA. Preliminary Data Summary of Urban Storm <strong>Water</strong> Best Management Practices. August 1999. Page 6-9.<br />
4. US EPA. <strong>Combined</strong> <strong>Sewer</strong> Overflow Technology Fact Sheet: Inflow Reduction. September 1999. Table 1.<br />
5. CH2M Hill. Pierce County Low Impact Development Study, Final Report. April 11, 2001. <strong>Sewer</strong>, water, electric infrastructure costs,<br />
and excavation/grading costs not included.<br />
6. US EPA. Low Impact Development (LID): A Literature Review. October 2000.<br />
7. US EPA. Guidance Specifying Management Measures For Sources of Nonpoint Pollution in Coast <strong>Water</strong>. January 1993. Table 4-8.<br />
8. US EPA. Preliminary Data Summary of Urban Storm <strong>Water</strong> Best Management Practices. August 1999. Page 6-12.<br />
9. Environmental Design + Construction Magazine, "Green Roofs: Stormwater Management from the Top Down" by Katrin Scholz-<br />
Barth, Jan-Feb 2001<br />
10. New York Times, "Cooling Chicago, Starting with a Garden on the Roof of City Hall", John W Fountain<br />
The costs were converted to a dollars ($) per impervious acre treated at 1.25” of rain for comparison<br />
purposes. In addition, layouts and sizing were performed for technologies that appeared to have<br />
good potential for applicability in built-up urban areas: infiltrating curbs, street tree filters and<br />
infiltrating catch basins.<br />
\\Gh-wash\ENG 1160\LTCP\LTCP Final\App E-Cost Basis\Cost Basis.doc E-15 FINAL - July 2002
Appendix E – Basis for Cost Opinions<br />
A mix of LID technologies was selected to generate a unit cost per acre for LID-R. The mix was<br />
selected as identified in Table 13.<br />
Table 13<br />
Unit Costs for LID Application<br />
Base<br />
Construction<br />
Cost<br />
Construction<br />
Cost with 30%<br />
Contingency<br />
LID-R Technology<br />
$/Imp Ac % Applied<br />
Capital Cost<br />
Bioretention $ 26,000 25% $ 6,500 $ 8,450 $ 9,100<br />
Sand Filters $ 55,000 15% $ 8,250 $ 10,725 $ 11,550<br />
Porous Pavement on Sidewalks $ 90,000 15% $ 13,500 $ 17,550 $ 18,900<br />
Infiltrating catch basins $370,000 15% $ 55,500 $ 72,150 $ 77,700<br />
Infiltrating curbs $ 77,000 20% $ 15,400 $ 20,020 $ 21,560<br />
Street Tree Filters $423,000 10% $ 42,300 $ 54,990 $ 59,220<br />
Total $/Imp ac(rounded) 100% $142,000 $ 184,000 $ 198,000<br />
Total $/acre @ 25% Impervious (rounded) $ 35,363 $ 46,000 $ 50,000<br />
Total $/acre @ 65% Impervious (rounded) $ 92,000 $ 120,000 $ 129,000<br />
3. CAPITAL COSTS<br />
Engineering, construction management, construction inspection and administrative costs were<br />
calculated as a percentage of the construction cost to obtain the total opinion of capital cost.<br />
Percentages for these items were obtained from WASA based on current construction projects at<br />
BPWWTP. Capitalized interest is the cost of funds to finance construction projects. Recent WASA<br />
bonds have been approximately 6.5% and this value was used in the capital cost calculation. The<br />
following percentages of construction cost were used to estimate capital costs:<br />
Table 14<br />
Capital Cost Percentages<br />
Line<br />
Number Description Calculation Procedure Net Impact<br />
1 Total Construction Cost --<br />
2 Program Management 5% x Line 1<br />
3 Design Engineering 9% x Line 1<br />
4 Construction Management 11% x Line 1<br />
5 Office Engineering During 2% x Line 1<br />
Construction<br />
6 O & M Services 2% x Line 1<br />
7 Startup 2% x Line 1<br />
8 Subtotal Sum of Lines 1 through 7<br />
9 Capitalized Interest 6.5% x Line 8<br />
10 Total Capital Cost Sum of Lines 8 and 9 Equivalent to<br />
Capital Cost = 1.40 x Construction<br />
Cost<br />
\\Gh-wash\ENG 1160\LTCP\LTCP Final\App E-Cost Basis\Cost Basis.doc E-16 FINAL - July 2002
Appendix E – Basis for Cost Opinions<br />
4. OPERATION AND MAINTENANCE COSTS<br />
Operation and maintenance (O & M) costs were estimated using the following bases:<br />
<br />
<br />
<br />
<br />
Labor – Labor costs and requirements for the various CSO alternatives were based on the<br />
average cost of maintaining a single operating post manned by one operator on a 24 hour,<br />
year round basis. According to WASA’s FY 2001 operations budget, a total of 1,057<br />
positions required $54,491,000 which included regular wages, benefits, and overtime. Thus<br />
the average cost of one position was approximately $50,000. Assuming an eight hour<br />
workday, with three shifts per day, the average cost for a Continuous Operating Post (COP)<br />
would be $150,000. The number of COPs required for each alternative was determined on a<br />
case by case basis.<br />
Maintenance costs for facilities were taken as a percentage of the construction cost. For very<br />
large facilities, the percentages were adjusted to account for economy of scale on a case by<br />
case basis.<br />
Power – electricity costs were based on the unit cost per kWH as currently paid by WASA.<br />
Chemicals – chemical requirements were determined for each CSO control alternative based<br />
on the particular design requirements of that facility. Unit chemical costs were estimated<br />
based on actual chemical expenses at Blue Plains and by quotes from chemical suppliers.<br />
Operation<br />
Table 15<br />
Operation and Maintenance Cost Basis<br />
Item Unit Cost Basis (per year)<br />
Conveyance pipelines --<br />
Storage basins<br />
Up to 10 mg<br />
Over 10 mg<br />
Pump stations<br />
Up to 100 mgd<br />
Over 100 mgd<br />
High Rate Physical<br />
COP<br />
COP<br />
COP<br />
COP<br />
Included in<br />
maintenance cost, see<br />
below<br />
0.5<br />
1.0<br />
0.5<br />
2.0<br />
COP 2.0<br />
Chemical Treatment<br />
Tunnels COP 2.0<br />
Maintenance<br />
Conveyance pipelines % of construction cost 0.5%<br />
Storage basins % of construction cost 1.5%<br />
Pump stations % of construction cost 3.0%<br />
High Rate Physical<br />
Chemical Treatment<br />
% of construction cost 3.0%<br />
Tunnels (except Piney<br />
Branch)<br />
% of construction cost 1.0%<br />
Piney Branch Tunnel % of construction cost 2.0%<br />
\\Gh-wash\ENG 1160\LTCP\LTCP Final\App E-Cost Basis\Cost Basis.doc E-17 FINAL - July 2002
Appendix E – Basis for Cost Opinions<br />
Item Unit Cost Basis (per year)<br />
LID % of construction cost 5.0%<br />
New Clarifiers % of construction cost 3.0%<br />
Treatment<br />
Complete treatment MG $615<br />
Excess flow treatment MG $184.50<br />
High rate treatment MG $273<br />
Power KW-Hr $0.051<br />
Chemicals<br />
Chlorine gas Pound $0.134<br />
Sodium hypochlorite, 15%<br />
solution strength<br />
Pound $0.328<br />
Sulfur dioxide gas, 1.3:1<br />
SO 2 : Cl 2 treatment ratio<br />
Pound $0.124<br />
Sodium bisulfite, 38%<br />
solution strength, 1.3:1<br />
Pound $1.80<br />
SO 2 : Cl 2 treatment ratio<br />
Alum<br />
Pound<br />
Ferric chloride, 40%<br />
solution strength<br />
Pound $0.105<br />
Liquid polymer, dry Pound $1.30<br />
Liquid polymer, emulsion Pound $0.56<br />
Liquid polymer, mannich Pound $0.05<br />
Microsand, 3 mg/l dosage Pound $0.25<br />
5. NET PRESENT WORTH ANALYSIS<br />
All costs were compared on a net present worth (NPW) basis using the following methodology and<br />
assumptions:<br />
Table 12<br />
Net Present Worth Assumptions<br />
Item<br />
Description<br />
<strong>Plan</strong>ning Period<br />
20 years<br />
Salvage Value of Capital Facilities $0<br />
Inflation Rate 3%<br />
Interest Rate (i.e. cost of money) 6.5%<br />
For comparison of alternatives, capital expenditures were assumed to occur at year zero. Annual O<br />
& M costs were inflated each year at the inflation rate throughout the planning period. The interest<br />
rate was then used to bring each year’s operation and maintenance cost to year zero to calculate the<br />
NPW of O & M costs.<br />
\\Gh-wash\ENG 1160\LTCP\LTCP Final\App E-Cost Basis\Cost Basis.doc E-18 FINAL - July 2002
Appendix E – Basis for Cost Opinions<br />
6. REFERENCES<br />
Association for the Advancement of Cost Engineering (AACE). 1997. Recommended Practice No.<br />
18R-97: Cost Estimate Classification <strong>System</strong>. August 12, 1997.<br />
Board of Engineers, 1957. Report to District of Columbia Department of Sanitary Engineering on<br />
Improvements to <strong>Sewer</strong>age <strong>System</strong>.<br />
CH2M Hill. April 11, 2001. Pierce County Low Impact Development Study, Final Report.<br />
Dr. G. Sauer Corp. June 2001. Letter report to Greeley and Hansen.<br />
Environmental Protection Agency (EPA). 1970. <strong>Combined</strong> <strong>Sewer</strong> Overflow Abatement Alternatives.<br />
Environmental Protection Agency (EPA). 1976. Cost Estimating Manual – <strong>Combined</strong> <strong>Sewer</strong><br />
Overflow Storage and Treatment. EPA 600/2-76-286.<br />
Environmental Protection Agency (EPA). 1978. Construction Costs for Municipal Wastewater<br />
Treatment <strong>Plan</strong>ts: 1973-1977. EPA 430/9-77-013.<br />
Environmental Protection Agency (EPA). 1993a. Manual - <strong>Combined</strong> <strong>Sewer</strong> Overflow <strong>Control</strong>,<br />
Office of Research and Development, Center for Environmental Research and Information,<br />
Cincinnati, Ohio, EPA/625/R-93/007, Sept. 1993.<br />
Environmental Protection Agency (EPA), January 1993. Guidance Specifying Management<br />
Measures For Sources of Nonpoint Pollution in Coast <strong>Water</strong>.<br />
Environmental Protection Agency (EPA), August, 1999. Preliminary Data Summary of Urban<br />
Stormwater Best Management Practices, EPA-821-R-99-012.<br />
Environmental Protection Agency (EPA), September 1999. <strong>Combined</strong> <strong>Sewer</strong> Overflow Technology<br />
Fact Sheet: Inflow Reduction.<br />
Environmental Protection Agency (EPA), October 2000. Low Impact Development (LID): A<br />
Literature Review.<br />
Fountain, John W., New York Times, "Cooling Chicago, Starting with a Garden on the Roof of City<br />
Hall".<br />
Greeley and Hansen. 1995. Report on City-Wide Study and Evaluation of the Adequacy and Physical<br />
\\Gh-wash\ENG 1160\LTCP\LTCP Final\App E-Cost Basis\Cost Basis.doc E-19 FINAL - July 2002
Appendix E – Basis for Cost Opinions<br />
Condition of City of Chicago <strong>Sewer</strong> <strong>System</strong>. Prepared for City of Chicago Department of <strong>Sewer</strong>s.<br />
Jain, S.C. & J.F. Kennedy, July 1983. "Vortex Drop Structures for the Milwaukee Metropolitan<br />
<strong>Sewer</strong>age District Inline Storage <strong>System</strong>". Iowa Institute of Hydraulic Research, Report No. 264.<br />
Metcalf and Eddy, 1973. Reconnaissance Study of <strong>Combined</strong> <strong>Sewer</strong> Overflows and Storm <strong>Sewer</strong><br />
Discharges.<br />
Metropolitan Washington Council of Governments (MWCOG) and Metcalf and Eddy, 2001.<br />
Regional Wastewater Flow Forecast Model (RWFFM): Update for the Blue Plains Service Area –<br />
Final Report.<br />
New York City. 1999. New York City <strong>Water</strong> Conservation Programs: a Summary.<br />
Peer Consultants. 1999a. Wastewater Flow Reduction <strong>Plan</strong>. Prepared for District of Columbia <strong>Water</strong><br />
and <strong>Sewer</strong> Authority.<br />
Peer Consultants. 1999b. <strong>Water</strong> Conservation <strong>Plan</strong>. Prepared for District of Columbia <strong>Water</strong> and<br />
<strong>Sewer</strong> Authority.<br />
Sanks, Robert L. 1989. Pumping Station Design. Butterworth Publishers, Stonham, MA.<br />
\\Gh-wash\ENG 1160\LTCP\LTCP Final\App E-Cost Basis\Cost Basis.doc E-20 FINAL - July 2002
District of Columbia <strong>Water</strong> and <strong>Sewer</strong> Authority<br />
<strong>Combined</strong> <strong>Sewer</strong> <strong>System</strong> <strong>Long</strong> <strong>Term</strong> <strong>Control</strong> <strong>Plan</strong><br />
Appendix E - Basis For Cost Opinions<br />
Figure 1<br />
Regulator Structure Cost<br />
(ENR=6383)<br />
$10,000,000<br />
y = 6075.3x + 180000<br />
Construction Cost ($)<br />
$1,000,000<br />
Facility Data<br />
Value to Use<br />
$100,000<br />
1 10 100 1000 10000<br />
Design Diversion Rate (mgd)<br />
\\Gh-wash\ENG 1160\LTCP\LTCP Final\App E-Cost Basis\[Cost_Reg.xls]Report Fig.
District of Columbia <strong>Water</strong> and <strong>Sewer</strong> Authority<br />
<strong>Combined</strong> <strong>Sewer</strong> <strong>System</strong> <strong>Long</strong> <strong>Term</strong> <strong>Control</strong> <strong>Plan</strong><br />
Appendix E - Basis For Cost Opinions<br />
Figure 2<br />
Raw Wastewater Pumping Station Construction Costs<br />
(ENR=6383)<br />
EPA CSO Cost Manual (1976) Sanks-"High" Cost Curve Sanks-"Low" Cost Curve<br />
Lake Michigan WTP Study EPA, 1981 Value to Use<br />
Rochester Tunnel P.S. Detroit WWTP Actual Facilities<br />
Florida Facilities1<br />
Poly. (Value to Use)<br />
$1,000,000,000<br />
$100,000,000<br />
y = 0.0307x 3 - 125.76x 2 + 213533x + 279183<br />
Construction Cost (4)<br />
$10,000,000<br />
$1,000,000<br />
$100,000<br />
1 10 100 1,000 10,000<br />
Firm Capacity (mgd)<br />
\\Gh-wash\ENG 1160\LTCP\LTCP Final\App E-Cost Basis\[Cost_P.S..xls]Report Fig
District of Columbia <strong>Water</strong> and <strong>Sewer</strong> Authority<br />
<strong>Combined</strong> <strong>Sewer</strong> <strong>System</strong> <strong>Long</strong> <strong>Term</strong> <strong>Control</strong> <strong>Plan</strong><br />
Appendix E - Basis For Cost Opinions<br />
Figure 3<br />
Storage Basin Costs<br />
(ENR=6383)<br />
Facility Data<br />
EPA Cost Curve<br />
1000<br />
Value to Use<br />
Construction Cost (million $)<br />
100<br />
10<br />
y = 7.1937x 0.7597<br />
1<br />
1.0 10.0 100.0<br />
Storage Volume (MG)<br />
\\Gh-wash\ENG 1160\LTCP\LTCP Final\App E-Cost Basis\[Cost_Stor.xls]Figure 3
District of Columbia <strong>Water</strong> and <strong>Sewer</strong> Authority<br />
<strong>Combined</strong> <strong>Sewer</strong> <strong>System</strong> <strong>Long</strong> <strong>Term</strong> <strong>Control</strong> <strong>Plan</strong><br />
Appendix E - Basis For Cost Opinions<br />
Figure 4<br />
Rock Tunnel Costs<br />
Other Cities<br />
Sauer Full Face TBM 5-10,000'<br />
Weston Cost Curve<br />
Value to Use<br />
Poly. (Value to Use)<br />
Narragansett Bay Est.<br />
Sauer Hand Mine NATM 5-10,000'<br />
Metro Experience<br />
Sauer Weathered Rock NATM - Hand
District of Columbia <strong>Water</strong> and <strong>Sewer</strong> Authority<br />
<strong>Combined</strong> <strong>Sewer</strong> <strong>System</strong> <strong>Long</strong> <strong>Term</strong> <strong>Control</strong> <strong>Plan</strong><br />
Appendix E - Basis For Cost Opinions<br />
Figure 5<br />
Approach Channel Tangential Inlet Cost vs. Design Flow Rate (ENR=6383)<br />
$1,200,000<br />
Construction Cost<br />
$1,000,000<br />
$800,000<br />
$600,000<br />
$400,000<br />
$200,000<br />
$0<br />
y = 503.89x + 206813<br />
Estimated Based on Takeoff<br />
Linear (Estimated Based on Takeoff)<br />
0 200 400 600 800 1000 1200 1400 1600<br />
Design Flow Rate (mgd)<br />
Construction Cost ($/VLF)<br />
$16,000<br />
$14,000<br />
$12,000<br />
$10,000<br />
$8,000<br />
$6,000<br />
$4,000<br />
$2,000<br />
$-<br />
Vertical Drop Shaft Cost vs. Design Flow Rate (ENR=6383)<br />
y = 4.2855x + 7685.3<br />
Estimated Based on Takeoff<br />
Linear (Estimated Based on Takeoff)<br />
0 200 400 600 800 1000 1200 1400 1600<br />
Design Flow Rate (mgd)<br />
Construction Cost<br />
$2,500,000<br />
$2,000,000<br />
$1,500,000<br />
$1,000,000<br />
$500,000<br />
$-<br />
Deaeration Chamber Cost vs. Design Flow Rate (ENR=6383)<br />
y = 1433.5x + 182624<br />
Estimated Based on Takeoff<br />
Linear (Estimated Based on Takeoff)<br />
0 200 400 600 800 1000 1200 1400 1600<br />
Design Flow Rate (mgd)<br />
\\Gh-wash\ENG 1160\LTCP\LTCP Final\App E-Cost Basis\[Cost_dropshaft.xls]Cost Sum
District of Columbia <strong>Water</strong> and <strong>Sewer</strong> Authority<br />
<strong>Combined</strong> <strong>Sewer</strong> <strong>System</strong> <strong>Long</strong> <strong>Term</strong> <strong>Control</strong> <strong>Plan</strong><br />
Appendix E - Basis For Cost Opinions<br />
Figure 6<br />
HRPCT Construction Cost (ENR=6383, Exclusive of Disinfection)<br />
Construction Cost<br />
$250.0<br />
$200.0<br />
$150.0<br />
$100.0<br />
$50.0<br />
y = -0.0002x 2 + 0.4426x + 7.5562<br />
R 2 = 0.9533<br />
$0.0<br />
0 100 200 300 400 500 600 700 800<br />
Treatment Capacity (mgd)<br />
\\Gh-wash\ENG 1160\LTCP\LTCP Final\App E-Cost Basis\[Cost _High Rate.xls]Report Fig
District of Columbia <strong>Water</strong> and <strong>Sewer</strong> Authority<br />
<strong>Combined</strong> <strong>Sewer</strong> <strong>System</strong> <strong>Long</strong> <strong>Term</strong> <strong>Control</strong> <strong>Plan</strong><br />
APPENDIX F<br />
Responses to Comments<br />
\\Gh-wash\ENG 1160\LTCP\LTCP Final\App F-Resp to Com\Resp to Com.doc FINAL - July 2002
Responses to Comments<br />
Appendix F<br />
Responses to Comments<br />
1. INTRODUCTION<br />
This Appendix presents responses to comments received on the Draft <strong>Long</strong> <strong>Term</strong> <strong>Control</strong> <strong>Plan</strong> which<br />
was released in June 2001. An extremely large number of comments were received. In addition,<br />
there are significant degrees of overlap and common themes in many of the comments. As a result,<br />
comments were grouped by type and subject matter and addressed together in a commentary type<br />
response. The goal of this approach is to produce a commentary that is both readable and<br />
comprehensive. The comments were grouped as being related to the following topics:<br />
<br />
<br />
<br />
<br />
<br />
<br />
<br />
<br />
<br />
<br />
<br />
<br />
<br />
<br />
<br />
Nine Minimum <strong>Control</strong>s<br />
Alternatives Evaluation<br />
Separation<br />
Low Impact Development Source <strong>Control</strong>, Pollution Prevention<br />
Blue Plains Wastewater Treatment <strong>Plan</strong>t<br />
CSO Location<br />
Flooding<br />
Implementability<br />
Tunneling<br />
Regulatory Compliance<br />
Public Participation<br />
Financial Capability<br />
Schedule<br />
<strong>Water</strong> Quality Standards Revisions<br />
Miscellaneous Comments<br />
In the following text, each type of comments is described and a response is provided. The numbers<br />
after each comment refer to the comment number. Table 1 at the end of this section lists the<br />
commenters by comment number.<br />
2. COMMENTS ON NINE MINIMUM CONTROLS<br />
2.1 Several commenters indicated that WASA should install a public notification system to<br />
advise people of the occurrence of CSOs. Commenters suggested that given the long<br />
time frame for LTCP implementation, a notification system was needed in the short term.<br />
One commenter suggested the system should be installed within 12 months and that a<br />
schedule should be included in the LTCP. EPA also asked what real-time enhancements<br />
\\Gh-wash\ENG 1160\LTCP\LTCP Final\App F-Resp to Com\Resp to Com.doc F-1 FINAL - July 2002
Responses to Comments<br />
to the overflow event warning system were planned to satisfy public notification<br />
requirements of the nine minimum controls (294, 295, 296, 297, 305).<br />
The LTCP proposes a system of colored lights on each receiving water to notify the<br />
public. One color will be displayed when the overflow is occurring. Other colors would<br />
be displayed based on the overflow volume from a representative outfall in each<br />
receiving water. There would be two levels of notification; one for a normal event and<br />
another for a major event. For a normal volume, one color would be displayed for a<br />
specified time period. For a significant overflow volume, a second color would be<br />
displayed for a longer time period. The light display and durations following CSO events<br />
would be determined in consultation with The D.C. Department of Health and EPA.<br />
2.2 One commenter indicated that WASA should fully implement the Nine Minimum<br />
<strong>Control</strong>s before embarking on a LTCP (306). EPA commented that the LTCP should<br />
more fully describe WASA’s nine minimum control efforts to date, and plans to<br />
implement each of the NMCs. Since the overflow volume to be addressed by the LTCP<br />
can be reduced by maximizing NMC effectiveness, EPA indicated that it is important that<br />
current NMC information be reported. EPA asked if there were any near-term plans for<br />
trash and floatables control and if portions of the LTCP could be reduced in size or<br />
eliminated through full implementation of the Nine Minimum <strong>Control</strong>s. (305)<br />
In 1996, WASA prepared a summary of its Nine Minimum <strong>Control</strong> (NMC) program.<br />
EPA made several comments on the report, which were ultimately addressed by WASA.<br />
Absent any documentation to the contrary, WASA thus considers its NMC adequate and<br />
in compliance with the CSO Policy.<br />
In 1998, WASA participated in EPA’s “Special Panel to Address <strong>Combined</strong> <strong>Sewer</strong><br />
Overflows and Storm <strong>Water</strong> Issues in the District of Columbia”. As a panel member,<br />
WASA was asked to review its NMC program and recommend improvements. This was<br />
documented in two reports: the Nine Minimum <strong>Control</strong> Summary Report (July 1999) and<br />
the Nine Minimum <strong>Control</strong> Action <strong>Plan</strong> (February 2000). No comments were received<br />
from EPA or the D.C. Department of Health on either of those reports. WASA continues<br />
to implement the enhancements to its NMC program as outlined in the reports.<br />
It is important to note that the NMCs are best management practices. They are based on<br />
best professional judgement and are meant to be adapted to the site specific conditions of<br />
each system. The NMC program is also not a static program but is meant to be adjusted<br />
over time as appropriate. The enhancements that have been completed and those that are<br />
underway are in the spirit of making continuous improvements where feasible.<br />
\\Gh-wash\ENG 1160\LTCP\LTCP Final\App F-Resp to Com\Resp to Com.doc F-2 FINAL - July 2002
Responses to Comments<br />
In the Draft LTCP, WASA has taken advantage of CSO reduction benefits of NMCrelated<br />
measures. The two measures which have the most significant benefit are cleaning<br />
of the Eastside Interceptor and replacement of the inflatable dams. These components<br />
were assumed to be in place during the evaluation of alternatives. The benefits of these<br />
elements are shown on page 6-2 of the LTCP. Implementation of these measures has<br />
allowed for reduction in the size of capital facilities proposed in the Draft LTCP.<br />
Regarding trash and floatables control, WASA will continue to:<br />
<br />
<br />
<br />
<br />
Operate the Anacostia River Floatable Debris Program on the Anacostia River.<br />
This is a skimmer boat program which removes floating debris on the river. Note<br />
that this program removes debris from storm water and upstream Maryland<br />
sources in addition to CSO sources.<br />
Continue to operate the end of pipe netting system on CSO 018 on the Anacostia<br />
River<br />
Continue the increased frequency of catch basin cleaning recommended in the<br />
NMC Summary Report.<br />
Operate the screening facility at the Northeast Boundary <strong>Sewer</strong> and the bar racks<br />
at the pumped overflows at the Main and ‘O’ Street Pumping Stations<br />
Regarding a warning system to advise of overflows, WASA has proposed a warning light<br />
system to advise the public in the Final LTCP.<br />
3. COMMENTS ON ALTERNATIVES EVALUATION<br />
3.1 Some commenters suggested moving toward decentralized treatment systems such as<br />
composting toilets in lieu of centralized treatment systems (1,2). One commenter<br />
suggested constructing holding tanks for sanitary wastewater at individual properties such<br />
that wastewater could be held back during rain events so that overflows during rain<br />
events would not contain sanitary sewage (8).<br />
There are two basic options for the management of decentralized treatment systems:<br />
operation by the utility such as WASA or operation by private individuals. Due to the<br />
large number of properties, operation by a utility would not be cost effective or practical.<br />
The large number required would be difficult to install, manage, maintain and operate.<br />
Operation by individual properties would not be reliable in that a significant percentage<br />
would likely be inoperable due to lack of maintenance. It is also unlikely that such a<br />
system would be accepted by the populace due to the space requirements of such<br />
systems, the need to enter private property to install them, and the disruption to private<br />
properties.<br />
\\Gh-wash\ENG 1160\LTCP\LTCP Final\App F-Resp to Com\Resp to Com.doc F-3 FINAL - July 2002
Responses to Comments<br />
Note also that WASA’s discharge permit will most likely require a specified degree of<br />
performance for the combined sewer system. Violations of the permit are subject to<br />
penalties by law. If decentralized systems were relied on to provide CSO control, there<br />
would need to be a permit system with individual properties in place to assure<br />
satisfactory performance to meet CSO control requirements. The numbers of properties<br />
and sites involved would make such a system expensive and unweildly.<br />
In a concentrated urban environment, management of sanitary wastewater is a health<br />
issue in addition to being an aesthetic and environmental issue. The health issue could be<br />
of special concern in high rise buildings with many tenants. Given these difficulties, this<br />
type of system is not recommended for CSO control.<br />
3.2 A commenter proposed the use of floodplains for controlling storm water to prevent its<br />
entry into the combined sewer system and thus to reduce overflows (3).<br />
Floodplains are typically used adjacent to natural waterways to accommodate floodwaters<br />
in a natural area where damage to property and life is minimal. In the combined sewer<br />
system, the natural drainage system has been eliminated by the development of the city<br />
such that there is no natural outlet available. Typically, the only outlet available is the<br />
combined sewer. In these systems, it is not possible to effectively use floodplains<br />
without separating the system. An approach where facilities are constructed to allow<br />
storm water to infiltrate into the ground instead of into the combined sewer system is<br />
possible and is known as low impact development-retrofit (LID-R). This approach is<br />
addressed in subsequent comments.<br />
3.3 One commenter suggested using used oil tankers for storage facilities for CSO overflows<br />
in lieu of the proposed tunnels. The tankers would be parked near outfalls and would be<br />
dewatered to the treatment plant after the rain subsided (7).<br />
The CSO outfalls in the District are geographically dispersed along the waterways. It<br />
would be necessary to use many tankers or connect groups of outfalls to a tanker using a<br />
large diameter pipeline or tunnel. The draft LTCP uses the interconnecting tunnel as the<br />
storage facility. It is thus considered a more practical approach. Use of tankers would<br />
present the following additional difficulties:<br />
<br />
<br />
Tankers would take up considerable space in the water way, would present a<br />
hindrance to navigation and recreation and would detract aesthetically from the<br />
water way<br />
Solids in CSOs that settle in the tanker would be difficult to remove and would<br />
compromise CSO storage capacity.<br />
\\Gh-wash\ENG 1160\LTCP\LTCP Final\App F-Resp to Com\Resp to Com.doc F-4 FINAL - July 2002
Responses to Comments<br />
<br />
<br />
Separate pumping facilities would be needed at each tanker. This would be more<br />
expensive and difficult to operate and maintain than one or two consolidated<br />
facilities.<br />
In many locations, water depth an/or physical facilities nearby would not make<br />
tankers feasible<br />
For these reasons, tankers for CSO storage are not recommended.<br />
3.4 One commenter suggested using CSO as “grey water” to water lawns at golf courses and<br />
for other non-potable uses. (11)<br />
Greywater typically refers to water which has received a level of treatment rendering it<br />
safe for use in non-potable applications such as watering lawns. CSO has relatively high<br />
levels of bacteria, solids, and trash/floatables which would make it unsuitable for use a<br />
greywater without treatment. Treatment of CSOs was evaluated in the draft LTCP and<br />
was found to be less practical than storage due to the extreme flow peaks that can occur,<br />
the lack of land available for treatment, and due to the intermittent and unpredictable<br />
nature of CSOs. A grey water system would require CSO to be collected, treated and<br />
then distributed to where grey water could be used. Such a system is not cost-effective<br />
compared to other technologies, particularly in the eastern United States where water is<br />
relatively plentiful.<br />
3.5 One commenter indicated that the Draft LTCP was prepared allowing for growth in the<br />
suburbs but that it would not allow for growth in the District without increasing<br />
overflows. (18) Another commenter indicated that the Draft LTCP assumed the District<br />
flows met their IMA allowances when the District is currently exceeds its IMA<br />
allowance. (430).<br />
BPWWTP has a rated annual average flow capacity of 370 mgd. The Blue Plains<br />
Intermunicipal Agreement of 1985 (IMA) allocates wastewater treatment capacity<br />
between the District and the surrounding jurisdictions. The surrounding jurisdictions are<br />
allocated an annual average capacity of 212 mgd. The District is allocated a capacity of<br />
148 mgd with 10 mgd reserved to accommodate additional Potomac Interceptor flows for<br />
a total of 158 mgd. The Draft LTCP was prepared using the dry weather flows specified<br />
in the IMA: 158 mgd for the District, 212 mgd for the suburbs, or 370 mgd total.<br />
The Metropolitan Washington Council of Governments (MWCOG) recently completed<br />
wastewater flow projections for the BPWWTP in 2002. MWCOG uses the Regional<br />
Wastewater Flow Forecast Model (RWFFM) to project flows. The RWFFM is a<br />
computer model that links GIS sewershed layer with population projections to compute<br />
wastewater flows. The RWFFM develops a base year flow based on regression analysis<br />
\\Gh-wash\ENG 1160\LTCP\LTCP Final\App F-Resp to Com\Resp to Com.doc F-5 FINAL - July 2002
Responses to Comments<br />
of historical data. This is done to dampen the effects of short-term flow fluctuations.<br />
From the base year flow, the model then projects future flows based on population<br />
changes, infiltration and inflow allowances, and changes in wastewater management such<br />
as flow diversions to other treatment facilities.<br />
MWCOG indicates that the year 2000 wastewater flow to the District was 160 mgd. The<br />
population in the District is projected to increase from about 518,000 in 2000 to about<br />
648,000 in 2025. The unadjusted year 2025 wastewater flow from the District is<br />
projected to average 180 mgd. The term ‘unadjusted’ means it does not account for<br />
other changes in the sewer sytem. WASA plans a Wastewater Flow Reduction Program,<br />
a <strong>Water</strong> Conservation Program, and a <strong>Sewer</strong> <strong>System</strong> Assessment Program that are<br />
expected to achieve a total 20 mgd reduction in District Wastewater Flows. Considering<br />
these adjustments, MWCOG projects the flow from the District in 2025 to be 160 mgd.<br />
The year 2025 wastewater flow of 160 mgd is extremely close to the 158 mgs used in<br />
draft LTCP. As a result, the Draft LTCP does allow for substantial population growth in<br />
the District without an increase in overflows.<br />
3.6 Several commenters indicated that the plan failed to address rehabilitation of the existing<br />
combined sewer system. A commenter suggested that it did not make sense to spend<br />
money on a new tunnel system if the existing combined sewer was in need of<br />
rehabilitation. (35, 36, 37, 38, 39, 40, 41, 42)<br />
In the LTCP, WASA accounted for rehabilitation of the CSS in areas where there were<br />
known problems and where rehabilitation could have a measurable CSO benefit. These<br />
rehabilitations include:<br />
<br />
<br />
<br />
Cleaning of the Eastside Interceptor- the Eastside Interceptor is a sewer between<br />
the Northeast Boundary and Main Pumping station that was determined to have a<br />
large degree of siltation. WASA cleaned the sewer and accounted for the<br />
resulting CSO benefits in the draft LTCP.<br />
Replacement of the Inflatable Dams – the inflatable dams are air filled devices<br />
placed in several large sewers that provide in system storage capacity. Six of the<br />
twelve dams are not functioning and WASA is in the process of replacing them.<br />
Again, the CSO reduction benefits of replacing the dams were demonstrated and<br />
accounted for in the draft LTCP.<br />
Rehabilitation of Pumping Stations – WASA is in the process of rehabilitating<br />
the Potomac, Main, O Street, Eastside and Poplar Point Pumping Stations to<br />
restore pumping capacity and improve system reliability. The CSO reduction<br />
\\Gh-wash\ENG 1160\LTCP\LTCP Final\App F-Resp to Com\Resp to Com.doc F-6 FINAL - July 2002
Responses to Comments<br />
benefits of the rehabilitations were demonstrated and accounted for in the draft<br />
LTCP.<br />
WASA is also beginning a program of systematic evaluation of its combined and separate<br />
sewer system to identify and prioritize areas in need of rehabilitation and improvement.<br />
This will be an ongoing effort. It is unlikely that this program will results in significant<br />
CSO reduction on the order required by the CSO Policy and to meet water quality<br />
standards.<br />
3.7 Several commenters indicated the plan did not address the following items:<br />
Alleged inadequate maintenance of catch basins, separate storm sewers and combined<br />
sewers (20,21)<br />
Pollution from the separate storm sewer system and sanitary sewer overflows (SSOs).<br />
(16)<br />
Cross connections between the water and sewer system (17)<br />
The draft LTCP was prepared in accordance with WASA’s NPDES Permit and EPA’s<br />
CSO Policy, which is now part of the Clean <strong>Water</strong> Act. In accordance with these<br />
requirements, the purpose of the plan is to determine what CSO controls are required to<br />
meet water quality standards and other requirements specified in the Policy. Other<br />
programs are in place or under development to address other issues as follows:<br />
<br />
<br />
Catch Basin Cleaning and Maintenance of sewers – WASA has an approved Nine<br />
Minimum <strong>Control</strong> Program which includes catch basin cleaning and maintenance<br />
of sewers. The frequency of catch basin cleaning is approximately once per year,<br />
higher in trouble spots.<br />
Pollution from separate storm water system – pollution from the separate storm<br />
water system comes from both separate sewered areas in Maryland and in the<br />
District. In Maryland, The Maryland Department of the Environment (MDE) is<br />
the agency responsible for regulating state environmental issues. For waters that<br />
do not meet water quality standards, each state is responsible for developing a<br />
total maximum daily load (TMDL) for each pollution source designed to bring it<br />
into compliance with water quality standards. Maryland is in the process of<br />
developing several TMDLs. EPA is regulating this process. In the District, the<br />
separate storm water system is being addressed as part of the MS4 permit held by<br />
the District Government. WASA is the storm water administrator, and relies<br />
heavily on the Department of Public Works and Department of Health for many<br />
aspects of storm water control. In addition to District sources of storm water, the<br />
Federal Government owns many storm water outfalls.<br />
\\Gh-wash\ENG 1160\LTCP\LTCP Final\App F-Resp to Com\Resp to Com.doc F-7 FINAL - July 2002
Responses to Comments<br />
<br />
<br />
Sanitary <strong>Sewer</strong> Overflows (SSOs) - EPA is in the process of developing and<br />
promulgating its SSO policy. The nation as a whole is beginning to address these<br />
issues. WASA will be doing the same.<br />
Cross connections Between Potable <strong>Water</strong> and <strong>Sewer</strong> – WASA has identified<br />
cross connections in the system. As of March 2002, two separate contractors<br />
were working to address them.<br />
3.8 Several commenters indicated that since flows from Maryland and Virginia take up<br />
capacity in the combined sewer system, they contribute to overflows. Commenters<br />
suggested that the suburbs should reduce their flows by water conservation, storm water<br />
controls or other unidentified measures. Another commenter suggested that the suburban<br />
flows should be carried around the combined sewer system so they do not affect the CSS<br />
and thus reduce overflows. EPA suggested that an alternative be developed to reduce the<br />
flow from the separated sewers from the suburbs and the District by storage, satellite<br />
treatment or conveyance past BPWWTP. (22, 23, 24, 29, 30, 44)<br />
Flows to BPWWTP are governed by the Intermunicipal Agreement (IMA) of 1985. The<br />
IMA places annual average and peak flow limitations on the suburban jurisdictions. The<br />
suburbs are currently within their average and peak flow limitations and the LTCP was<br />
prepared by assuming the suburbs were discharging at these limits. WASA cannot<br />
require the suburban jurisdictions to reduce their flows without renegotiating the IMA.<br />
This would be a long and involved political process with an uncertain outcome.<br />
An alternative wherein WASA would construct flow equalization basins in the District<br />
for the large suburban flows was evaluated. The purpose of the equalization basins was<br />
to reduce the suburban peaks during wet weather events. The modeling indicated that<br />
reducing the suburban peaks did not have a significant effect on CSOs in the District<br />
compared to the cost of the equalization basins. This is because the majority of the flow<br />
during wet weather is rainwater from the combined sewer system. It would also be<br />
difficult to obtain land and public acceptance to construct such facilities. This alternative<br />
was not considered attractive.<br />
Conveying the suburban flows around the combined sewer area and directly to BPWWTP<br />
was also evaluated as a CSO control option. Construction of such facilities would be<br />
extremely expensive and disruptive. In addition, the overflow volume would not change<br />
significantly since the capacity of BPWWTP would still limit the amount of total flow<br />
treated.<br />
\\Gh-wash\ENG 1160\LTCP\LTCP Final\App F-Resp to Com\Resp to Com.doc F-8 FINAL - July 2002
Responses to Comments<br />
3.9 Several commenters advocated for an integrated watershed approach that includes<br />
watershed protection and involves the counties. One suggested that WASA should<br />
allocate funding to these programs (26, 27, 28, 66, 67, 68)<br />
The draft LTCP was prepared in accordance with WASA’s NPDES Permit and EPA’s<br />
CSO Policy, which is now part of the Clean <strong>Water</strong> Act. In accordance with these<br />
requirements, the purpose of the plan is to determine what CSO controls are required to<br />
meet water quality standards and other requirements specified in the Policy. While<br />
control of pollution sources in other parts of the watershed could improve water quality,<br />
they will not have any effect on CSO discharges. As a result, the draft LTCP was<br />
focused on controlling CSOs in the District.<br />
The Draft LTCP indicated that control of CSOs alone will not allow the water quality<br />
standards to be met much of the time in the District. This is due to the other sources of<br />
pollution in the District and outside of the District. The analyses indicate that a<br />
watershed approach is necessary and that all major pollution sources must be controlled<br />
to achieve water quality standards.<br />
WASA is active in larger watershed issues and is an advocate for control of other sources<br />
of pollution. WASA currently chairs the Anacostia <strong>Water</strong>shed Restoration Committee,<br />
which is a group established to bring together the major regulatory representatives and<br />
stakeholders in the watershed. WASA also has a role as the administrator for the<br />
District’s separate storm water system permit issued by EPA. In this role, there are<br />
opportunities for reducing pollution from the storm water system. It is important to note<br />
that WASA shares responsibility for the storm water system with the Department of<br />
Public Works, the Department of Health and other agencies. However, WASA is not<br />
authorized to spend financial resources to control pollution that is the responsibility of<br />
other jurisdictions.<br />
3.10 One commenter indicated that WASA’s CSO modeling reports indicate that during the<br />
calibration, the combined system model predicted no overflows when overflows actually<br />
occurred during some calibration events. The commenter indicated that this raised<br />
concerns as to whether the model was capable of accurately predicting overflows. The<br />
commenter further suggested that WASA should account for this underprediction in some<br />
manner such as by increasing the size of the storage facilities. (31)<br />
The model of the combined sewer system was calibrated to 9 months of monitoring data<br />
(October 1999-June 2000) representing a wide range of rainfall conditions. In general,<br />
the model calibration was excellent. In certain instances, the model predicted CSO<br />
overflows when none occurred, and other times did not predict overflows when some<br />
were measured. This was not a common occurrence and typically occurred at the smaller<br />
\\Gh-wash\ENG 1160\LTCP\LTCP Final\App F-Resp to Com\Resp to Com.doc F-9 FINAL - July 2002
Responses to Comments<br />
rainfall events that were near the threshold of overflowing. This is not atypical for CSO<br />
modeling and it represents the state of current predictive technology.<br />
Overall, the model over predicted CSO overflow volumes by about 10-15% on an<br />
average year basis. This was intentionally done to provide conservatism and to account<br />
for the under prediction on certain occasions.<br />
3.11 EPA commented that that the Real Time <strong>Control</strong> (RTC) alternative assumed the use of<br />
inflatable dams to provide in-system storage. Since the dams were susceptible to<br />
damage, the commenter suggested considering other technologies. (46)<br />
The original inflatable dams in the District were an innovative and unproven technology<br />
at the time of installation. Some of the dams failed as a result of seam failure due to a<br />
manufacturing defect (not puncture). This also happened to other municipalities that<br />
installed dams from the same manufacturer. The manufacturer ultimately went bankrupt.<br />
The replacement dams that are being installed are from a reputable manufacturer with a<br />
proven track record at other municipalities. As a result, additional inflatable dams are a<br />
viable option for future installation.<br />
Other options also exist such as sluice gates, butterfly gates, tipping weirs and movable<br />
weirs. The assessment of the practicality and cost effectiveness of additional RTC to<br />
supplement the existing dams would not be substantially affected by the selection of the<br />
technology employed.<br />
3.12 EPA suggested that further consideration be given to satellite treatment of high volume<br />
CSOs where water quality impacts would be the greatest (47)<br />
High rate physical chemical treatment (HRPCT) and disinfection were considered both in<br />
place of, and to supplement, the proposed storage facilities. These facilities were not<br />
considered preferred alternatives for the following reasons:<br />
<br />
<br />
<br />
<br />
Lack of land and difficulty in obtaining public acceptance for such facilities<br />
Intermittent operation would require continuous staffing or potentially unreliable<br />
automatic operation<br />
In order to have a reasonable number of treatment facilities, it is necessary to<br />
intercept and convey the various CSOs to one or more central sites for treatment.<br />
The size of these conveyance facilities becomes so large that it becomes more<br />
cost effective to increase their size to make them storage facilities<br />
Lack of cost effectiveness and practicality when compared to storage options<br />
For these reasons, satellite treatment was not considered feasible or cost effective.<br />
\\Gh-wash\ENG 1160\LTCP\LTCP Final\App F-Resp to Com\Resp to Com.doc F-10 FINAL - July 2002
Responses to Comments<br />
3.13 The Draft LTCP indicated that solid and floatable control would be incorporated into the<br />
design of new regulators. EPA requested clarification regarding where regulators are to<br />
be replaced and how the evaluation regarding the applicability of solids and floatables<br />
control would be evaluated (65).<br />
New regulators would typically be provided for CSOs that will be controlled or captured<br />
by the tunnels. The regulators are used to divert CSO into the storage tunnels. Existing<br />
regulators cannot normally be used for this new function because the diversion rates<br />
required to achieve the specified degree of CSO control are much higher than the<br />
diversion rates of the existing regulators. The physical location of the regulators will<br />
depend on final location of the tunnels, the availability of land for construction and other<br />
factors. The siting of regulators is usually done at the design development stage.<br />
The Draft LTCP indicates that WASA will incorporate floatables control for overflows<br />
which exceed the capacity of the recommended control plan into the design of new CSO<br />
diversion structures/facilities constructed as part of the LTCP. One method that might be<br />
used is a combination baffle/bar rack arrangement in new CSO regulators. This method<br />
has been used successfully in Richmond, Virginia and Boston, Massachusetts. As was<br />
discovered in those communities, there may be some outfalls where incorporation of<br />
floatables control into new facilities is not practical due to hydraulics, site constraints or<br />
other factors. As an example, there may be some outfalls where incorporation of<br />
solids/floatables control may cause added headloss such that flooding conditions may be<br />
created. It is not possible to make these types of assessments at this time. These<br />
evaluations are typically performed at the design stage when detailed information is<br />
available regarding facility location. WASA will make every effort to incorporate<br />
solids/floatables control where feasible.<br />
3.14 While acknowledging that the option of relocating the Main and O Street Pumping<br />
Facilities to the Poplar Point was costly and less desirable at the present time, a<br />
commenter supported retaining this option in the event circumstances or events changed.<br />
Examples include public/private development in Poplar Point changes in real estate<br />
values, etc. (421)<br />
Comment noted. The decision to relocate Main and O Street Pumping Stations is<br />
relatively independent of the selection of the LTCP. That is, nearly any LTCP can<br />
accommodate the relocation of Main and O Pumping Stations to Poplar Point. Deciding<br />
to relocate the facilities prior to completion of design of the new CSO facilities would be<br />
the most beneficial because it would allow joint design, construction and integration of<br />
the relocation in conjunction with other new facilities.<br />
\\Gh-wash\ENG 1160\LTCP\LTCP Final\App F-Resp to Com\Resp to Com.doc F-11 FINAL - July 2002
Responses to Comments<br />
4. COMMENTS ON LEVEL OF CSO CONTROL<br />
4.1 Ten commenters expressed support for the Draft LTCP (217, 218, 219, 220, 221, 222,<br />
223, 224, 225, 226).<br />
Comment noted.<br />
4.2 One commenter indicated an opposition to any CSO control because the water quality<br />
benefits were not that great. (232). Two commenters opposed any degree of CSO control<br />
without other polluters such as Maryland, Virginia and the Federal Government doing<br />
their fair share. (25, 289)<br />
<strong>Control</strong> of CSOs is required by the Clean <strong>Water</strong> Act and by WASA’s National Pollutant<br />
Discharge Elimination <strong>System</strong> (NPDES) Permit. Other communities in the nation also<br />
are facing this issue. By controlling CSOs, WASA will lead by example and hopefully<br />
encourage the surrounding jurisdictions and the Federal Government to control their<br />
pollution sources.<br />
4.3 EPA indicated it was unclear how benefits from LTCP implementation will translate to<br />
protection of designated and existing uses. We know the reduced number of overflows,<br />
and the reduction in CSO loading. What we do not know is how severe a storm will have<br />
to be to trigger overflows, and what the resultant water quality impacts will be (assuming<br />
of course that other point sources and NPS are controlled as envisioned in the BOD<br />
TMDL)(433).<br />
4.3.1 What magnitude storm [5 (or whatever) year storm, defined as so many<br />
inches per hour, for a given amount of time, spread over a defined area] will<br />
cause overflows to the Anacostia (post implementation of the draft LTCP)<br />
How severe would a storm have to be to result in sufficient overflows to<br />
exceed numeric water quality criteria How much of a CSO load would it<br />
take to cause such an exceedance<br />
In accordance with the CSO Policy, CSO planning is based on average year<br />
conditions. WASA’s LTCP (and most LTCPs around the country) propose<br />
that remaining overflows after implementation will be in the range of 1 to 4<br />
per average year. This means that storms less severe than the 1 year storm<br />
will cause overflows.<br />
Determining the return frequency of a storm that will cause overflows is<br />
complex and not directly translatable to actual conditions on the ground. In<br />
addition to rain volume and intensity, overflows can be caused by back-toback<br />
small or moderate storms. These storms can fill the storage facility to<br />
\\Gh-wash\ENG 1160\LTCP\LTCP Final\App F-Resp to Com\Resp to Com.doc F-12 FINAL - July 2002
Responses to Comments<br />
capacity before there is time to dewater the facility. In this case, smaller<br />
storms that do not meet the “design storm” threshold can cause an overflow.<br />
In addition to these complexities, design storms typically do not occur in the<br />
real world. Actual rainfall has a significant spacial and temporal variation<br />
that can dramatically affect overflows. Summer thunderstorms can cause<br />
intense rainfall in one drainage basin and little or no rainfall in an adjacent<br />
basin. Because of these complexities, it is difficult to translate design storms<br />
into real world actual conditions. As a result, and in accordance with the<br />
CSO Policy, average year conditions are used to gage system performance.<br />
If upstream and storm water sources were controlled to levels required by the<br />
Anacostia TMDLs, the LTCP would meet the bacteria geometric mean<br />
standard in the Anacostia in the average year (the design condition per the<br />
CSO Policy). With other sources controlled, the same is true for the Potomac<br />
and Rock Creek.<br />
4.3.2 How many days of water body use, if any, do the models suggest would be<br />
lost in an average year to such exceedances (post implementation of the draft<br />
LTCP)<br />
For the Draft LTCP in the average year, CSOs are projected to cause fecal<br />
coliform levels to rise above an average of 200MPN/100 ml for 11 days per<br />
year, 6 of which occur in the period of likely recreational use from May to<br />
September. Storm water and upstream sources are projected to cause<br />
exceedances of this criteria 183 days per year, a far greater number. Note that<br />
the 200 MPN/100 ml average daily concentration is a much more restrictive<br />
standard than the current water quality standards which specify a 30 day<br />
geometric mean.<br />
4.3.3 Please repeat the above for the LTCP scenario suggested by DOH, in which<br />
there would be no overflows to the Anacostia in an average year.<br />
The LTCP was evaluated based on a 3-year analysis period: 1988, 1989, and<br />
1990. This included a wet year, dry year and average year. Average year<br />
conditions were defined as the arithmetic average of the results for the three<br />
years. The DOH plan called for no overflows in the dry or average year but<br />
allowed overflows in the wet year. For this plan, CSOs are projected to cause<br />
fecal coliform levels to rise above the 200MPN/100 ml daily average for 1<br />
day per year. This day occurs in the period of likely recreational use from<br />
\\Gh-wash\ENG 1160\LTCP\LTCP Final\App F-Resp to Com\Resp to Com.doc F-13 FINAL - July 2002
Responses to Comments<br />
May to September. Storm water and upstream sources are projected to cause<br />
exceedances of this criteria 182 days per year.<br />
4.4 EPA questioned the extent to which increasing the diameters of the Anacostia tunnels<br />
increases the percent capture and decreases the number of overflow events without<br />
significantly adding to the overall cost of the project (229).<br />
The cost versus CSO reduction curves and the associated analyses in the Draft LTCP are<br />
shown on page 9-30 for the Anacostia River. The knee-of-the-curve is the point where<br />
increasing tunnel sizes results in proportionately more costs than CSO reduction benefits.<br />
This starts to occur at the four overflows per average year level. The Draft LTCP was<br />
selected at the point where increasing tunnel sizes results in proportionately more costs<br />
than benefits. The Final LTCP increases the level of control to the point where increased<br />
level of control will provide few water quality benefits at great cost.<br />
4.5 General Comments on Level of <strong>Control</strong><br />
4.5.1 Comments Applicable to All Receiving <strong>Water</strong>s<br />
4.5.1.1. Many commenters advocated for a higher degree of control in<br />
general without specifying the degree of control (152, 163-199, 211,<br />
230).<br />
4.5.1.2. Several commenters recommended developing a plan that eliminates<br />
CSOs under all conditions. It was unclear from the comments<br />
whether the commenters advocated separation. (4, 161, 206, 207,<br />
208, 209, 210,214).<br />
4.5.1.3. A commenter advocated for some way to stop overflows under all<br />
conditions short of separation.(14).<br />
4.5.1.4. One commenter recommended sizing facilities for zero discharges in<br />
the average year (215)<br />
4.5.1.5. One commenter indicated support for the tunnels but that they<br />
should be sized for zero overflows in the wettest year of the three<br />
year evaluation period (213)<br />
4.5.1.6. One commenter recommended the highest degree of control feasible<br />
without separation (212).<br />
4.5.1.7. One commenter indicated that CSO controls were investments for<br />
the future and that cost was thus not the biggest consideration (228).<br />
Another commenter indicated that the decisions made now about<br />
CSO control would affect the District for the next 100 years and<br />
thus WASA should be visionary and bold in making the right<br />
decision. (231)<br />
4.5.1.8. One commenter called for less pollution in general (160)<br />
\\Gh-wash\ENG 1160\LTCP\LTCP Final\App F-Resp to Com\Resp to Com.doc F-14 FINAL - July 2002
Responses to Comments<br />
4.5.1.9. One commenter asked for a prediction of the magnitude of<br />
overflows expected for the 1, 5, 10, 15, and 25 year storms. (32)<br />
4.5.2 Comments Specific to Anacostia River<br />
4.5.2.1. The D.C. Department of Health suggested a CSO plan where the<br />
Anacostia tunnels would be sized for no overflows in the dry and<br />
average year with 1 to 2 overflows in the wet year. One commenter<br />
indicated support for DOH’s plan. (216)<br />
4.5.2.2. One commenter supported the tunnels as a good first step but<br />
indicated that more control was necessary (362)<br />
4.5.2.3. One commenter endorsed the tunnels as laid out, but recommended<br />
they be sized to control the 25 year storm. The commenter further<br />
recommended that the pumping stations be upgraded, that LID be<br />
expanded and that water conservation be implemented in the<br />
Northeast Boundary. (156)<br />
4.5.2.4. One commenter recommended that the goal in the Anacostia should<br />
be 0 overflows per year (157).<br />
4.5.2.5. A commenter indicated that the Anacostia should receive priority<br />
because it is the most impacted river and that a higher degree of<br />
control should be provided for the Anacostia (158)<br />
4.5.2.6. One commenter indicated the Anacostia River should receive a<br />
degree of control such that its water quality is the equal of the<br />
Potomac. (159)<br />
4.5.3 Comments Specific to Potomac River:<br />
4.5.3.1. In the Potomac, DOH concurred with the recommended plan which<br />
reduced overflows to 12 per average year (154)<br />
4.5.3.2. One commenter indicated the Potomac tunnels should be sized for<br />
the wettest year in the three year evaluation period. (200)<br />
4.5.3.3. Commenters indicated that the level of control proposed for the<br />
Potomac was too low compared to the other receiving waters. A<br />
commenter further indicated that the Potomac River is a highly used<br />
river for recreational purposes and that its use is expanding. The<br />
commenter indicated that there are opportunities for direct human<br />
contact with the water in the form of splashing from boat, boat<br />
upsets in the river, and dogs exercising in the river and then being<br />
handled by owners. The commenter recommended a higher degree<br />
of control for the Potomac River and suggested that the plan will<br />
\\Gh-wash\ENG 1160\LTCP\LTCP Final\App F-Resp to Com\Resp to Com.doc F-15 FINAL - July 2002
Responses to Comments<br />
have an adverse impact on users of the Potomac River. (201, 202,<br />
203, 204, 205, 424)<br />
This responds to all comments listed under item 4.5. The only CSO plan that will<br />
eliminate overflows under all weather conditions is separation. Separation has a cost<br />
almost triple that of the recommended LTCP, would cause massive disruption and<br />
hardships, and results in worse water quality than the recommended LTCP. For these and<br />
other reasons separation was not recommended. Given that separation is not feasible,<br />
there will be some remaining overflows for any CSO control plan. What remains to be<br />
decided is how big to make the facilities and how infrequent the CSO overflows will be.<br />
The higher the degree of CSO control, the higher the cost. The recommended plan was<br />
selected to provide an effective balance of overflow reduction, water quality<br />
improvement and cost. After implementation, it is predicted that CSOs will occur<br />
infrequently and that there will be very infrequent disruption of water quality due to<br />
CSO.<br />
4.6 One commenter questioned the efficacy and rationale behind the Piney Branch tunnel in<br />
that it has very little water quality benefits. The commenter suggested implementing<br />
extensive LID and installation of a trash trap and disinfection facility in lieu of the tunnel<br />
at the Piney Branch Outfall. (33)<br />
Due to the sensitive park setting, a trash trap and disinfection facility are unlikely to be<br />
acceptable to the National Park Service or the public. In fact, a screening facility was<br />
proposed for Piney Branch as a result of the 1983 CSO study. This was never<br />
constructed due, in part, to the impacts on Rock Creek.<br />
4.7 One commenter suggested that there might be sewer leaks at sewers crossing Rock Creek<br />
at Military Road and the Dam upstream of Boulder Bridge. (44)<br />
The receiving water monitoring in Rock Creek conducted as part of the LTCP did not<br />
suggest the presence of leaking sewers in the areas indicated. However, WASA will be<br />
conducting a City-wide assessment of the sewer system. Creek crossings will be one of<br />
the areas where particular attention will be focused.<br />
4.8 One commenter suggested redesigning or closing regulators at Rock Creek where<br />
feasible. (45)<br />
The LTCP proposes separation to eliminate four outfalls and associated regulators along<br />
Rock Creek. The plan also proposes monitoring and regulator improvements at four<br />
additional regulators in Rock Creek.<br />
4.9 A commenter recommended setting enforceable milestones for reducing bacteria levels<br />
from Montgomery county to improve water quality in Rock Creek. The commenter<br />
\\Gh-wash\ENG 1160\LTCP\LTCP Final\App F-Resp to Com\Resp to Com.doc F-16 FINAL - July 2002
Responses to Comments<br />
indicated that WASA should mandate aggressive LID in the Rock Creek sewer shed in<br />
Montgomery county coupled with water conservation measures to reduce flows through<br />
the Rock Creek Interceptor. (253)<br />
WASA does not have the authority to place requirements on surrounding jurisdictions.<br />
4.10 EPA suggested that Rock Creek appeared to be a good candidate for selective separation<br />
or other remediation prior to construction of the Piney Branch tunnel. EPA asked about<br />
other alternatives to correct storm water and CSO overflows to Rock Creek (43).<br />
In the combined sewer area tributary to Rock Creek, almost all of the storm water and<br />
sanitary sewage is captured by the combined sewer system. This is evident by the very<br />
low annual overflow volumes compared to the large drainage area. The analyses have<br />
indicated that large-scale separation in Rock Creek would make the water quality much<br />
worse. This is because of the very large volume of storm water which is captured by the<br />
combined sewer system that would otherwise discharge untreated to the Creek if<br />
separated. Large-scale separation is thus not beneficial.<br />
Due to the low overflow volume in Rock Creek, CSOs do not have a significant effect on<br />
water quality. In the Draft LTCP, CSOs are projected to cause fecal coliform bacteria<br />
levels to be greater than 200 MPN/100 ml 4 days per average year, while storm water and<br />
upstream loads are projected to cause this level to be exceeded 294 days per year. The<br />
proposed CSO control will lower the concentrations of bacteria in the Creek, but will not<br />
result in the attainment of water quality standards. However, control of CSOs to zero<br />
overflows per year does not produce noticeably different water quality in Rock Creek<br />
when compared to the proposed levels of control.<br />
The analyses demonstrate that the only way to meet water quality standards is to control<br />
urban storm water and upstream loads. This is the case for many urban streams in<br />
separate sewer areas.<br />
4.11 One commenter indicated that WASA should consider not constructing the Potomac<br />
Tunnel and putting the money into Anacostia CSO control instead. (6)<br />
CSOs can adversely affect the water quality in the Potomac. The CSO Policy thus<br />
requires this to be addressed. However, priority has been given in the schedule to the<br />
Anacostia.<br />
4.12 EPA recommended that the Potomac and Rock Creek tunnels be re-evaluated when the<br />
Anacostia tunnel is completed, as part of the Anacostia post-construction monitoring plan<br />
(324).<br />
\\Gh-wash\ENG 1160\LTCP\LTCP Final\App F-Resp to Com\Resp to Com.doc F-17 FINAL - July 2002
Responses to Comments<br />
Anacostia performance data will be used to re-evaluate the Potomac and Rock Creek<br />
programs where it is available.<br />
4.13 One commenter indicated that the Draft LTCP “fails to reverse the old system of<br />
environmental injustice that has placed a disproportionate burden on the predominantly<br />
African-American communities on the East Side of <strong>DC</strong>”. The commenter indicated that<br />
much has been spent on cleaning up the Potomac River, and that the proposed plan fails<br />
to do this for the Anacostia. (153,155)<br />
The greatest CSO control benefit and the largest expenditures in both the Draft and Final<br />
LTCP are directed toward improving the Anacostia River. Of the $1.265 billion program,<br />
$940 million or about 74% are directed toward improving the water quality of the<br />
Anacostia River. The plan proposes to reduce overflows to the Anacostia such that both<br />
the frequency and volume of overflows are less than overflows to the Potomac. The<br />
LTCP is thus extremely responsive to the suggestion that the Anacostia be given priority.<br />
4.14 One commenter advocated considering downstream beneficiaries in the cost benefit<br />
analysis and not just beneficiaries in the District. (162)<br />
The LTCP identifies benefits to water quality in the District associated with CSO control.<br />
To some degree, these same benefits apply to downstream populations. Jurisdictions in<br />
close geographic proximity to the District would benefit the greatest. Jurisdictions<br />
farther from the District would benefit less so since the natural processes of dilution and<br />
assimilation of pollution mean that CSOs have less impact on waters farther from the<br />
District.<br />
5. COMMENTS ON SEPARATION<br />
5.1 EPA and several other commenters indicated that further consideration should be given to<br />
partial or targeted separation. Commenters suggested an evaluation considering such<br />
measures as cost, volume reduction, impacts on water quality, ability to alleviate<br />
flooding, potential to alleviate human health hazards from recreational contact, age and<br />
condition of existing infrastructure, impacts on wildlife and ability to be constructed in<br />
tandem with storm water management and LID measures. Some commenters<br />
recommended specifically considering separation in upper Rock Creek, the Federal area,<br />
and in the Ivy City/Trinidad neighborhoods subject to flooding to prevent human contact<br />
with wastewater. (10, 48, 49, 51, 52, 54, 57)<br />
An evaluation of targeted separation based on feasibility, cost, CSO reduction and water<br />
quality benefits has been conducted. This evaluation is included in the Final LTCP. The<br />
studies show benefits for targeted separation and selected outfalls will be included for<br />
separation.<br />
\\Gh-wash\ENG 1160\LTCP\LTCP Final\App F-Resp to Com\Resp to Com.doc F-18 FINAL - July 2002
Responses to Comments<br />
5.2 Two commenters indicated that the cost estimates for separation were too high compared<br />
to the costs in EPA literature and the costs being used in Atlanta, Georgia (50, 58).<br />
The unit cost of separation ($/acre) was obtained from the literature, actual construction<br />
experience in other cities, and estimates performed by others. This data was obtained<br />
from cities such as San Francisco, Boston, Richmond, Chicago, Alexandria and others.<br />
The cost was found to range from about $24,000 acre (year 2001 dollars) for small<br />
communities without dense development to about $390,000/acre (year 2001 dollars) for<br />
ultra-dense urban areas. Most separation has taken place in small to medium size<br />
communities in low-density areas. Little actual construction data is available for largescale<br />
separation of major metropolitan areas since most major cities have not selected this<br />
route. Different unit costs for separation were used as a function of land use in the<br />
District. High density areas were assigned a higher unit cost than low density areas. This<br />
reflects the increased expense associated with working around dense urban development<br />
in tight urban confines. The following unit costs were used:<br />
High density land uses: $240,000/acre<br />
Medium density land uses: $150,000/acre<br />
Low density land uses: $85,000/acre<br />
These unit costs conservatively allow for potentially expensive contingencies such as<br />
working on or around private property, as well as difficulties encountered during actual<br />
construction.<br />
5.3 One commenter suggested looking at installing separate sewers inside of the existing<br />
combined sewers as a cost saving measure (53).<br />
Installation of small separate sewers inside larger combined sewers has not been widely<br />
applied or tested. The technique would be limited to sewers larger 3 feet to 4 feet in<br />
diameter. Some concerns include<br />
<br />
<br />
<br />
It will still be necessary to deal with the downspouts and connections on private<br />
property. This can be a significant portion of the cost.<br />
It will still be necessary to separate by conventional means the smaller diameter<br />
combined sewer<br />
There is the potential of taking up excessive amounts of the hydraulic capacity of<br />
the combined sewer and the resultant creation of flooding problems<br />
In the draft LTCP, separation of combined sewers was shown to result in worse water<br />
quality than the draft LTCP. This is due to the large amount of storm water that is<br />
collected in the combined sewer system and treated prior to discharge. This same<br />
\\Gh-wash\ENG 1160\LTCP\LTCP Final\App F-Resp to Com\Resp to Com.doc F-19 FINAL - July 2002
Responses to Comments<br />
disadvantage would apply to separation by installing separate sewers inside of combined<br />
sewers. As a result the difficulties noted above, separation is not recommended.<br />
5.4 Three commenters advocated for complete separation of the combined sewer system.<br />
The benefits of separation were reported to be elimination of flooding, reduction of<br />
odors and the ability to meet water quality standards (59-64). In addition several<br />
commenters indicated that since the infrastructure is old and must be replaced anyway,<br />
separation makes sense (55, 64).<br />
Complete separation of the combined sewer system was evaluated in the draft LTCP.<br />
Issues associated with this alternative are as follows:<br />
<br />
Disruption – Separation essentially involves constructing a duplicate sewer system<br />
for the central one third of the District. <strong>Sewer</strong> construction would be necessary in<br />
every neighborhood and in the vast majority of streets in each neighborhood.<br />
Disruption associated with construction would be significant, widespread, and long<br />
lasting.<br />
<br />
Impacts to Private Property – the majority of buildings in the combined sewer area<br />
have roof drains and gutters discharging to the building sanitary system, which in<br />
turn discharges to the combined sewer system. Separation on private property would<br />
thus be required. Past separation experience in the District and in other cities has<br />
shown that obtaining access and permission from private property owners can be<br />
difficult, time consuming, and, in some cases, not achievable<br />
<br />
Technical Difficulty – Other cities such as Boston have discovered some separation<br />
projects to be much more difficult to construct that originally anticipated. In some<br />
cases, the efforts to separate sewer systems have been abandoned. Part of the reason<br />
for this is that there are many unknowns involved in working with sewer systems<br />
which have been constructed over a long period of time. Costs and difficulties of<br />
construction can be much greater than originally anticipated depending on what is<br />
actually discovered.<br />
<br />
Impact on Receiving <strong>Water</strong> Quality – the analyses conducted as part of the LTCP<br />
indicate that separation does not provide as good water quality as a high degree of<br />
CSO control. This is due to the large volume of separate storm water captured and<br />
treated by combined sewer system. Separation would eliminate CSOs and would<br />
thereby technically meet the water quality standards. However, the waterway would<br />
meet the water quality standards less frequently due to the increase in untreated storm<br />
water.<br />
\\Gh-wash\ENG 1160\LTCP\LTCP Final\App F-Resp to Com\Resp to Com.doc F-20 FINAL - July 2002
Responses to Comments<br />
Cost – complete separation is estimated to cost about $3.5 billion in year 2001<br />
dollars. This is significantly more than the LTCP<br />
<br />
Flooding protection - Several commenters indicated that separation had the<br />
opportunity to eliminate flooding. In most cases, separation would be conducted by<br />
constructing a new sanitary sewer and converting the combined sewer to a separate<br />
storm sewer. The storm water conveyance capacity would then be provided by the<br />
existing combined sewer. The benefit to flood control would be very marginal since<br />
the existing sewer would be used. The only benefit would be that the combined<br />
sewer would no longer receive sanitary flow and would thus have some greater<br />
capacity for storm water.<br />
<br />
Reduction of odors – It is unlikely that separation will have a significant effect on<br />
odors.<br />
<br />
Need to Rehabilitate Collection <strong>System</strong> - Separation would involve constructing new<br />
separate sanitary sewers and converting the existing combined sewers to separate<br />
storm sewers. If the combined sewers need to be rehabilitated, that cost would need<br />
to be added on top of the cost to separate.<br />
Given these reasons and other identified in the draft LTCP, complete separation of the<br />
combined sewer system is not recommended.<br />
5.5 EPA commented that the report lacked a cost for separation of the Anacostia CSO areas<br />
(56).<br />
The capital cost estimate for separating the Anacostia system is $2.1 billion in year 2001<br />
dollars. The total estimated cost of separating the entire combined sewer system is $3.5<br />
billion in year 2001 dollars. The LTCP has been amended to include this.<br />
6. COMMENTS ON LOW IMPACT DEVELOPMENT, SOURCE CONTROL,<br />
POLLUTION PREVENTION<br />
6.1 Many commenters advocated for more emphasis on non-engineered solutions aimed at<br />
reducing storm water such as Low Impact Development (LID) and Best Management<br />
Practices (BMPs) (10, 234, 236, 249, 254-274, 280). Commenters indicated that LID<br />
offers many side benefits such as beautification, reduction of heating/cooling costs, etc.<br />
(252). One commenter indicated that WASA should consider implementing LID instead<br />
of the tunnel system (235). Some commenters indicated that WASA should increase<br />
funding for LID (246-248). Others indicated that WASA’s evaluation of LID was not<br />
\\Gh-wash\ENG 1160\LTCP\LTCP Final\App F-Resp to Com\Resp to Com.doc F-21 FINAL - July 2002
Responses to Comments<br />
reasonable in that is overstated the cost and understated the effectiveness (248, 251, 432).<br />
One commenter attached information indicating that LID can cost $20,000-60,000 per<br />
acre to install (248). EPA commented that a more thorough proposal for LID options<br />
should be included covering the following (233). One commenter indicated that<br />
increased tree cover could significantly reduce runoff. The commenter indicated that <strong>DC</strong><br />
had experienced a 64% decrease in tree cover since 1973 and that this resulted in a 34%<br />
increase in storm water. (282-285):<br />
<br />
<br />
<br />
<br />
CSO reduction benefits and water quality impacts of LID throughout District and<br />
not just on WASA facilities.<br />
A more complete explanation of program objectives and methods including<br />
coordination with storm water management plans required by the MS-4 permit<br />
for the District.<br />
Specific mechanisms to implement LID District-wide<br />
Review a variety of levels of LID application and assess benefits<br />
The analyses conducted as part of the LTCP indicate that LID-R can reduce the<br />
magnitude and frequency of CSOs. Generally, CSO reduction benefits of LID-R are in<br />
proportion to the quantity of storm water that would be diverted from the receiving<br />
waters (e.g. Anacostia River) by the LID-R measures. In order to achieve a high degree<br />
of CSO control, a large application rate for LID-R is required.<br />
In order to meet the requirements of the CSO Policy, the degree of CSO control proposed<br />
in the LTCP is extremely high in that the controls are sized for large and intense storms.<br />
As a result, the analyses indicate that application of LID-R by itself cannot be expected to<br />
provide the degree of CSO control proposed in the LTCP and required to meet the CSO<br />
Policy and D.C. <strong>Water</strong> Quality Standards. However, LID-R can be coupled with<br />
structural controls to reduce CSOs or to reduce the size of capital facilities required for<br />
the degree of control proposed in the LTCP.<br />
There are several challenges associated with the implementation of LID-R. These have<br />
been divided into technical, institutional and regulatory issues below:<br />
<br />
Technical Issues - In the past, LID has been primarily applied in new<br />
developments. Little data are available on the application of LID in retrofit<br />
conditions on a mass scale the size of the District. The lack of data makes it<br />
difficult to predict the implementability, performance, cost and CSO reduction<br />
benefits of such measures. As a result, there is uncertainty as to the practicability<br />
of implementation of LID-R in heavily developed urban areas and as to its<br />
benefits and cost effectiveness.<br />
\\Gh-wash\ENG 1160\LTCP\LTCP Final\App F-Resp to Com\Resp to Com.doc F-22 FINAL - July 2002
Responses to Comments<br />
<br />
Institutional Issues – LID-R would need to be applied in streets, sidewalks,<br />
parking lots and in public and private property in the District. One difficulty is<br />
that WASA does not control and cannot regulate development or redevelopment<br />
in the District. As a result, WASA is not able to mandate application of LID-R.<br />
Laws and building codes in the District would need to be changed in order for<br />
this to occur. WASA can, however, recommend these types of changes to the<br />
District and provide technical assistance in their development.<br />
<br />
Regulatory Issues - The most practical and cost-effective way to implement LID-<br />
R would be in conjunction with redevelopment and reconstruction within the<br />
District. It would be much more costly to implement LID-R separate from<br />
reconstruction that was already planned. As a result, the implementation time<br />
associated with LID-R would be a function of the rate and magnitude of<br />
redevelopment. This may make the implementation time for LID-R very long<br />
with an uncertain end. After the LTCP is implemented, WASA’s discharge<br />
permit will require a specified degree of performance for the CSO controls.<br />
Violations of the permit are subject to penalties by law. If LID-R is relied on to<br />
provide all or part of the control specified in the permit, this could place WASA<br />
in the situation of having to meet a permit condition without the means to control<br />
LID-R, which is relied upon to meet the permit.<br />
Since WASA does not control development or redevelopment in the District, WASA<br />
cannot mandate application of LID-R. WASA can, however, incorporate LID-R<br />
techniques into new construction or reconstruction on WASA facilities, where applicable.<br />
In addition, WASA recommends that the District Government develop and adopt the<br />
necessary laws and regulations to enable implementation of LID-R. In the Anacostia,<br />
LID-R can be viewed as additional control over and above that provided by the proposed<br />
tunnels. Detailed recommendations are included in the LTCP.<br />
6.2 One commenter indicated that the <strong>DC</strong> Council should create incentives for LID (278).<br />
The LTCP makes recommendations for governmental initiatives to foster LID in the<br />
District. The creation of incentives by the District and Federal Government is one of the<br />
initiatives.<br />
6.3 Several commenters indicated a support for a variety of source control measures such as<br />
building code changes, public education, source reduction, water conservation, I/I<br />
\\Gh-wash\ENG 1160\LTCP\LTCP Final\App F-Resp to Com\Resp to Com.doc F-23 FINAL - July 2002
Responses to Comments<br />
reduction, roof leader disconnection, storm water reuse, green roofs, street sweeping, and<br />
other measures (9, 237, 250, 275, 279, 281).<br />
WASA has a water conservation and wastewater flow reduction program to reduce flow<br />
in the system. Modeling indicates that these programs will not have a significant impact<br />
on CSO overflows because most of the water in the combined sewer system that causes<br />
overflows is from rain water (runoff). The combined sewer system is designed to convey<br />
rainwater to prevent flooding. WASA also has an approved Nine Minimum <strong>Control</strong><br />
program which includes a public outreach and education measures. In addition, WASA<br />
is involved in building code review and updates and uses this forum to advocate for<br />
source control measures for storm water.<br />
6.4 One commenter supported collaborative efforts between WASA and the Office of<br />
<strong>Plan</strong>ning in the areas of public education, daylighting orphaned storm sewers, storm<br />
water detention and low impact development (420).<br />
WASA will seek opportunities to coordinate and collaborate with the Office of <strong>Plan</strong>ning<br />
throughout the implementation phase of the LTCP.<br />
6.5 Several commenters indicated that groundwater pumpage from properties in the Federal<br />
Triangle and other areas were of concern. Commenters indicated that these properties<br />
should pay to discharge water to the system. EPA commented that the LTCP does not<br />
propose to remove the groundwater and asked if anything could be done to eliminate<br />
these flows from the system (238-242).<br />
Prior studies have estimated groundwater flows to the combined sewer system to be<br />
approximately 8 mgd. Modeling has indicated that removal of this flow from the<br />
combined sewer system has minimal impact on CSO reduction because it is very small<br />
relative to wet weather flows. The cost of removal is extremely high because there is no<br />
separate storm sewer to the receiving water.<br />
Assessment of the feasibility of extending orphaned storm sewers to the receiving waters<br />
is described in detail on page 8-13 of the Draft LTCP. A potential disadvantage of this<br />
option is the resulting polluted storm water that would be untreated and thus affect water<br />
quality.<br />
Both of these options were considered as a form of CSO control. While feasible, they<br />
were determined to be much less cost effective than the proposed solution.<br />
6.6 Several commenters indicated that I/I control and water conservation should be a<br />
significant part of the LTCP. One commenter indicated that WASA’s owns studies<br />
suggest there may be up to 118 mgd of I/I in the system. Another commenter suggested<br />
\\Gh-wash\ENG 1160\LTCP\LTCP Final\App F-Resp to Com\Resp to Com.doc F-24 FINAL - July 2002
Responses to Comments<br />
incentives to reduce water use (243-245). A commenter recommended conducting<br />
detailed I/I studies on the existing Rock Creek Interceptor (253).<br />
Modeling indicates that reduction in base flow via infiltration and inflow and water<br />
conservation will not have a significant impact on CSOs compared to the cost of control.<br />
This is because the vast majority of the water in the system when overflows occur is due<br />
to storm water runoff. WASA has a water conservation and wastewater flow reduction<br />
program that is currently being implemented. The program is projected to achieve a 20<br />
mgd reduction in base flow. The reference to up to 118 mgd of I/I is taken out of<br />
context. The report in question indicated that the exact amount of I/I is unknown and that<br />
the 118 mgd probably overstates the amount. The magnitude and cost-effective<br />
opportunities to remove I/I will be addressed as part of a City-wide sewer system<br />
evaluation that will be conducted in the near future.<br />
7. COMMENTS ON BLUE PLAINS WASTEWATER TREATMENT PLANT<br />
7.1 EPA questioned the predicted frequency and duration that denitrification would not be<br />
achieved due to high flow conditions at BPWWTP. EPA asked what measures could be<br />
taken to optimize treatment at Blue Plains and assure maximum denitrification (71).<br />
The BPWWTP was designed for nitrification, and these facilities were placed in<br />
operation in 1980. The plant was not originally designed to remove nitrogen (i.e. to<br />
denitrify). In 1987, the District of Columbia signed the Chesapeake Bay Agreement,<br />
which calls for voluntary reductions in nutrients to the Bay by 40 percent by 2000 using<br />
1985 as a base year. In 1996, a Denitrification Demonstration Facility was constructed at<br />
BPWWTP. The facility uses the existing nitrification reactors and other nitrification<br />
capacity to conduct both nitrification and denitrification. Nitrification capacity was<br />
reduced to the first four stages of the reactor, to accommodate denitrification in the last<br />
stage. Full scale denitrification using this approach was later incorporated at the plant.<br />
This approach to denitrification utilizes one facility for two processes. There are<br />
difficulties in conducting denitrification under all conditions of flow, load and<br />
temperature. This was shown to be the case when implementation of nitrogen removal<br />
was negotiated with regulatory agencies. Experience with the full scale facility has<br />
shown that denitrification process produces poorly settling solids which contribute to<br />
solids washouts and blinding of the effluent filters at high flow rates. This is due to<br />
attempting to treat high flows during storm events simultaneously with nitrificationdenitrification<br />
using the same tankage, particularly during cold weather. Based on this<br />
experience, it appears that BPWWTP will not be able to reliable denitrify under high<br />
flow conditions.<br />
\\Gh-wash\ENG 1160\LTCP\LTCP Final\App F-Resp to Com\Resp to Com.doc F-25 FINAL - July 2002
Responses to Comments<br />
The frequency of this occurrence depends on rainfall conditions and water temperature.<br />
A preliminary estimate of the time denitrification might not be feasible is on the order of<br />
100 days per average year. This will need to be refined when higher flows begin to be<br />
received at the plant after the pump station rehabilitations.<br />
Because the Chesapeake Bay Program is considering revised nitrogen limits for the Bay,<br />
future nitrogen removal at Blue Plains may include total nitrogen effluent concentration<br />
as low as 3 mg/L. Chesapeake Bay Program Goals may thus dictate nitrogen removal<br />
requirements at the plant, and further measures should be based on the final outcome of<br />
the Bay Program.<br />
7.2 EPA indicated that outfall 001 at BPWWTP had been characterized as a CSO under the<br />
existing NPDES permit, but that it may be characterized as a bypass under the CSO<br />
Policy. Under the CSO Policy, approval of a CSO bypass requires that the LTCP provide<br />
justification for the cut-off point at which the flow will be diverted from the secondary<br />
treatment portion of the treatment plant and provide a cost-benefit analysis demonstrating<br />
that conveyance of wet weather flow to the POTW for primary treatment is more<br />
beneficial than other CSO abatement alternatives such as storage and pump back for<br />
secondary treatment, sewer separation, or satellite treatment. EPA indicated the LTCP<br />
should include a section addressing this (70).<br />
This assessment is included in the Final LTCP.<br />
7.3 One commenter asked what modifications, if any, were required to accommodate the<br />
increased flows expected at BPWWTP. The commenter further questioned whether the<br />
increased flows would be treated by the full process train or the excess flow treatment<br />
train. If the flows are to be treated by the full train, the commenter asked if WASA<br />
possesses sufficient unused capacity in the IMA to handle the additional flow. If not, the<br />
commenter asked how the District would acquire that capacity (69, 72, 75, 427).<br />
Once the pumping stations in the system are rehabilitated, increased flows will be sent to<br />
BPWWTP during wet weather. These improvements consist of the addition of four new<br />
clarifiers and appurtenant weir and control system improvements. To accommodate this,<br />
improvements to the excess flow treatment train are recommended to improve<br />
performance and reliability. Stored CSO captured by the tunnels will be treated by the<br />
complete treatment train that discharges effluent at outfall 002. No improvements to the<br />
complete treatment train are proposed.<br />
7.4 A commenter asked if the increased flow at BPWWTP due to the LTCP would cause<br />
operational impacts or affect the plants ability to meet permit limits (74, 429).<br />
The plant is projected to be able to meet its permit limits with the LTCP in place.<br />
\\Gh-wash\ENG 1160\LTCP\LTCP Final\App F-Resp to Com\Resp to Com.doc F-26 FINAL - July 2002
Responses to Comments<br />
7.5 A commenter asked if any new facilities would be considered joint-use or non-joint use<br />
facilities and asked about the cost of the modifications (72, 73). The commenter also<br />
asked if there would be any increase in Blue Plains operational costs and if the expense<br />
would be considered a WASA-only expense (76).<br />
The cost apportionment of facilities and operation costs at BPWWTP have not been<br />
determined, but will be addressed once a Final LTCP is approved for implementation by<br />
regulatory agencies.<br />
7.6 EPA asked what additional solids handling facilities would be included in the tunnel<br />
system and at Blue Plains to handle increased flows (367)<br />
The tunnels will capture solids that will be pumped to BPWWTP for removal. Tunnels<br />
typically include screens to protect pumps and a sump at the end with clamshell for<br />
removal of material at pumping station. Tunnel slopes are also set to wash any solids to<br />
the pump station for removal. Additional solids handling facilities are not projected to be<br />
required at BPWWTP.<br />
7.7 A commenter indicated that WSSC leases 95 mgd of capacity in the Anacostia <strong>System</strong>.<br />
The commenter asked if the lease could continue or if WSSC could acquire some<br />
additional capacity in the Anacostia system (77).<br />
The LTCP contemplates that the District will utilize the capacity it is currently using in<br />
the 108” Anacostia Force Main via pumpage from the East Side Pumping Station. As a<br />
result, the LTCP does not anticipate any change from current conditions.<br />
8. COMMENTS ON CSO LOCATION<br />
8.1 Several commenters indicated that CSOs discharge to areas that are highly used and<br />
indicated that these CSOs should be moved, eliminated or given extra control. Concern<br />
was voiced for CSOs discharging near the Zoo in Rock Creek, Thompson’s Boat House<br />
in the Potomac, and the marina’s in the Anacostia. The commenter suggested that the<br />
outfalls near the entrance to Zoo be closed since it is in an area where wading might<br />
occur. EPA questioned whether some CSOs could be eliminated or consolidated (45, 78,<br />
79, 80, 104).<br />
The Final LTCP includes consolidation and separation of some outfalls. Those outfalls<br />
that are consolidated can be eliminated entirely. For those outfalls that are separated, a<br />
separate storm sewer outfall will remain.<br />
9. COMMENTS ON FLOODING<br />
9.1 Many commenters made general complaints about flooding in various sections of the<br />
District, some within the combined sewer area, others in the separate sewer area. Many<br />
\\Gh-wash\ENG 1160\LTCP\LTCP Final\App F-Resp to Com\Resp to Com.doc F-27 FINAL - July 2002
Responses to Comments<br />
of the complaints were general in nature and not specific to one area. Commenters<br />
indicated that while the Draft LTCP would address flooding in some areas, it would not<br />
address problems District-wide. Other commenters indicated that the LTCP should<br />
indicate whether the proposed improvements will prevent reoccurrence of the flooding<br />
that occurred on August 11, 2001. A commenter indicated that WASA was not<br />
responsive to the flooding of August 11, 2001. Specific complaints were issued about the<br />
following areas: (128, 129, 131-139, 141, 142, 143,145, 148)<br />
31 st and K Street NW in Georgetown<br />
West Virginia and Mt Olivet, NE<br />
Basement apartments in Dupont Circle area<br />
Bloomingdale and Trinidad neighborhoods<br />
The purpose of the LTCP is to select CSO controls for the combined sewer system.<br />
Addressing the need for capacity/flooding relief is being addressed as part of a separate<br />
City-wide evaluation of the sewer system. However, while preparing the LTCP, an<br />
opportunity was identified to address long standing flooding problems in the Northeast<br />
Boundary drainage area. This includes the areas of West Virginia and Mt. Olivet, NE,<br />
the Bloomingdale and Trinidad neighborhoods, and Rhode Island and 4 th Avenues NE.<br />
These areas were addressed due to the historical and well known nature of the chronic<br />
flooding occurring in these areas. Many of the areas that flooding on August 11,<br />
2001were not previously known as susceptible top flooding. These areas will be<br />
addressed as part of the city-wide assessment of the sewer system.<br />
9.2 EPA commented that the LTCP should describe in greater detail how and on what<br />
schedule the recommended plan will alleviate flooding in the Northeast Boundary area<br />
(130). EPA also commented on the new “relief outfall” into the Anacostia near the<br />
Northeast Boundary Swirl Facility and outfall 019 with the following questions: 1) What<br />
is the predicted frequency and duration of overflows for this outfall 2) Is it included in<br />
Table 9-3 3) Are the flows part of the receiving stream model for the Anacostia 4)<br />
What are the impacts to water quality from the discharge 5) What controls will be<br />
placed on the new outfall 6) How is the new outfall to be permitted (150)<br />
Flooding in the Northeast Boundary is described on pages 8-26 and 8-27 of the LTCP.<br />
Three of the tunnels in the Draft LTCP address flooding in these areas as follows:<br />
<br />
<br />
<br />
Tunnel parallel to the Northeast Boundary <strong>Sewer</strong><br />
Short tunnel from the Northeast Boundary <strong>Sewer</strong> to Rhode Island & 4 th St NE<br />
Short tunnel from the Northeast Boundary <strong>Sewer</strong> to West Virginia & Mt. Olivet,<br />
NE<br />
\\Gh-wash\ENG 1160\LTCP\LTCP Final\App F-Resp to Com\Resp to Com.doc F-28 FINAL - July 2002
Responses to Comments<br />
The flooding in these areas is predominantly caused by inadequate capacity of existing<br />
sewers, including the Northeast Boundary <strong>Sewer</strong>. When the existing sewers reach their<br />
capacity, the excess flow would be relieved to the new tunnels. Under certain rain<br />
events, the tunnels will be large enough to contain the entire volume of flow such that<br />
there is no CSO overflow. Under extreme rain events, the tunnels will fill and then act as<br />
conveyance pipes to move flow from the neighborhoods to the river to prevent flooding.<br />
After the storm stops, the tunnel contents will be dewatered to BPWWTP for treatment.<br />
Flooding relief would be provided when all of these project components are completed.<br />
It is important to note that the tunnel parallel to the Northeast Boundary <strong>Sewer</strong> must be<br />
constructed prior to the short tunnels to the areas prone to flooding. This is because the<br />
Northeast Boundary <strong>Sewer</strong> has limited capacity. Construction of the short tunnels prior<br />
to the relieving the Northeast Boundary <strong>Sewer</strong> would exacerbate flooding downstream.<br />
The proposed tunnels have been sized to convey up to the 15-year storm without flooding<br />
in accordance with WASA’s design standards. There may be flooding for more extreme<br />
storms. In addition to the tunnels, some surface drainage improvements may be required<br />
to transport storm flows to the tunnel inlet structures.<br />
The existing Northeast Boundary <strong>Sewer</strong> outfall does not have adequate capacity to<br />
convey extreme storm events to the river. In order to provide flooding relief, the existing<br />
outfall may need to be replaced or augmented for a short length. Depending on how the<br />
system is designed, is may be possible to reuse a short section of the existing outfall to<br />
eliminate the need for an entirely new outfall. Another approach would be to replace the<br />
existing outfall. The final approach will need to be worked out during detailed design.<br />
The outfall replacement/augmentation does not affect the overflow volume, frequency,<br />
water quality, etc.; it only affects whether the overflow gets to the river in the existing<br />
pipe or in a new pipe. As a result, the overflow predictions, the data in Table 9-3 and the<br />
water quality models and predictions are all correct for replacement/augmentation of the<br />
Northeast Boundary outfall. The proposed tunnel will control the Northeast Boundary<br />
overflows. Permitting approaches will depend on the approach taken in final design.<br />
The schedule for completion of these projects in the Draft LTCP is provided on pages 12-<br />
16 and 12-17.<br />
9.3 A commenter expressed concern about flooding in a basement caused by roots in a sewer<br />
lateral (140).<br />
\\Gh-wash\ENG 1160\LTCP\LTCP Final\App F-Resp to Com\Resp to Com.doc F-29 FINAL - July 2002
Responses to Comments<br />
WASA will clear blockages of sewer laterals in the public right of way. Contact<br />
Consumer services at 202-612-3400. Blockages of laterals on private property are the<br />
responsibility of the property owner. A licensed plumber should be contacted to address<br />
the problem.<br />
9.4 One commenter stated that WASA indicated a large quantity of rain fell on August 11,<br />
2001 but that National Airport reported a relatively small amount of rain (144).<br />
The rainfall on August 11, 2001 was extremely regional in nature. National Airport<br />
reports that rainfall totaled 0.92” that day. In contrast, certain areas of the District such<br />
as near McMillan Reservoir, Dupont Circle and along MacArthur Boulevard, NW<br />
received more than 4” of rain on August 11, 2001. The rainfall was not uniform and<br />
rainfall quantities and intensities depended on geographic location.<br />
9.5 Two commenters indicated that implementation of the LTCP was too long to wait for<br />
flooding relief in Northeast Boundary and that short term fixes should be implemented.<br />
(147, 149).<br />
WASA has a program to provide temporary flooding relief in certain areas of the<br />
Northeast Boundary, primarily those off of Florida Avenue. These projects are being<br />
performed in conjunction with the Department of Public Works and involve regrading<br />
and the addition/revision of catch basins and inlets. These projects will provide a<br />
measure of flooding relief in certain areas until the tunnels are completed.<br />
10. COMMENTS ON IMPLEMENTABILITY<br />
10.1 EPA asked to what degree the “implementability” of the recommended control plan been<br />
evaluated. EPA asked what permits or approvals might be required from the National<br />
Park Service (NPS) and if discussions been undertaken with NPS or LTCP comments had<br />
been received from them (150).<br />
Many alternatives were evaluated prior to selecting the Draft LTCP. These alternatives<br />
included surface storage facilities, treatment facilities or other measures that were<br />
determined unlikely to be implementable for a variety of reasons. These include lack of<br />
available land, public acceptance, need for permits and other operational and<br />
maintainability reasons. In contrast, the Draft LTCP was selected in part because it has a<br />
good likelihood of being implementable. Tunnels can be constructed with much less<br />
surface disruption and land requirements than many other alternatives and do not include<br />
the relatively complex operation and maintenance features of treatment and surface<br />
storage facilities.<br />
On September 10, 2001, WASA briefed the National Park Service on the Draft LTCP.<br />
The response of the NPS was generally favorable in that the Draft LTCP would require<br />
\\Gh-wash\ENG 1160\LTCP\LTCP Final\App F-Resp to Com\Resp to Com.doc F-30 FINAL - July 2002
Responses to Comments<br />
significantly less construction in the park than other alternatives. Some comments have<br />
been received from the NPS. Comments from the staff level at the National Park Service<br />
Rock Creek Office expressed concern over the Piney Branch tunnel and issues associated<br />
with construction access, tunnel location, whether the tunnel was needed, and others.<br />
WASA hopes to be able to work through these during preliminary engineering and<br />
design.<br />
10.2 EPA questioned if it would be necessary to obtain easements for the tunnels, who the<br />
affected property owners would be and if efforts had been made to reach agreement with<br />
them (151).<br />
Actual land/easement requirements will depend on the final alignment and configuration<br />
selected for the control facilities. Efforts will be made to select alignments in public<br />
right-of-ways where possible to minimize the need for easements. No efforts have been<br />
made to reach agreements with landowners since the alignments of the proposed tunnels<br />
have not been selected and since the LTCP has not been finalized or approved.<br />
Easement/land acquisition will be part of the design phase. A preliminary assessment of<br />
the possible land requirements is in Section 13 of the LTCP.<br />
11. COMMENTS ON TUNNELING<br />
11.1 Several commenters indicated that Milwaukee CSO tunnels have experienced significant<br />
leakage which has compromised their capacity. Others indicated that Chicago’s tunnels<br />
are undersized and have not performed as designed. Commenters indicated concern as to<br />
whether tunnels are a reliable and effective solution. Another commenter indicated that<br />
WASA should look at the lessons learned in other cities (345, 346, 347, 348, 15). EPA<br />
asked what degree of confidence WASA had that the tunnel sizing will be adequate to<br />
limit overflow events and avoid a situation such as that being experienced in Milwaukee<br />
where tunnels must be expanded due to continued CSO overflows and system backups.<br />
(369)<br />
This comment goes to whether tunnels are a reliable technology for CSO control.<br />
Tunnels have been used successfully in many CSO cities including Rochester, Chicago,<br />
St. Louis and San Francisco. Tunnels are also proposed for other CSO cities such as<br />
Atlanta. WASA has surveyed these other municipalities regarding their experience and<br />
will take this into consideration during design.<br />
Milwaukee’s control program started in 1977 and its tunnels went into service in 1993.<br />
The cost of the system was about $2.8 billion. The program included approximately 17<br />
miles of tunnels with diameters ranging from 12 to 32 feet, having a total storage volume<br />
of about 405 million gallons. In addition to CSOs, the tunnels were designed to control<br />
sanitary sewer overflows and to relieve the existing interceptors in the system. The<br />
\\Gh-wash\ENG 1160\LTCP\LTCP Final\App F-Resp to Com\Resp to Com.doc F-31 FINAL - July 2002
Responses to Comments<br />
design goals of the system were to reduce overflows from approximately 50 to 2 per<br />
average year. The tunnels were constructed in rock, with approximately 60% of the<br />
tunnel unlined.<br />
The performance of the system as reported by Milwaukee is as follows:<br />
Performance of Milwaukee CSO Tunnels<br />
Year Rainfall # of CSO Events Notes<br />
1991 68” 66<br />
1992 46” 46<br />
1993 65” 64<br />
1994 27” 1 Tunnels in service<br />
1995 31” 1<br />
1996 24” 1<br />
1997 33” 2<br />
1998 35” 2<br />
1999 38” 6<br />
2000 44” 5<br />
<strong>Long</strong> <strong>Term</strong> Average Rainfall = 31”<br />
The system is performing as designed. In dry years, the overflows were less than the<br />
average year and in wet years the number of overflows were more than the average year.<br />
There have been reports of infiltration of groundwater into the tunnel and exfiltration of<br />
CSO out of the tunnel at levels above what was expected. Milwaukee is in the process of<br />
performing an inspection to quantify the degree of infiltration. One of contributing<br />
factors may be that 60% of the tunnels are unlined. Lining tunnels significantly improves<br />
the ability to control infiltration. In the District, it is likely that tunnels will need to be<br />
lined since the majority are expected to be soft ground tunnels. Other measures such as<br />
synthetic barriers in conjunction with concrete can also be employed to control<br />
infiltration.<br />
Chicago is in the process of implementing the Tunnel and Reservoir <strong>Plan</strong> (TARP). It<br />
consists of 4 main tunnels and three reservoirs. Construction began in 1975 and is<br />
ongoing. The tunnels have been completed and hold approximately 2 billion gallons (bg)<br />
of CSO. The reservoirs are proposed to store in excess of 12 bg. Only one reservoir with<br />
a storage volume of 3.5 bg has been completed.<br />
There is no indication that the Chicago system is not performing properly. The level of<br />
performance is reported to be in keeping with the degree of completion of the tunnels and<br />
\\Gh-wash\ENG 1160\LTCP\LTCP Final\App F-Resp to Com\Resp to Com.doc F-32 FINAL - July 2002
Responses to Comments<br />
without the reservoir components in place. Prior to implementation, overflows occurred<br />
about every 4 days (90 times per year) and they have decreased to about once per month<br />
(12 times per year). The performance is expected to improve with completion of the<br />
majority of the storage volume, which is in the reservoirs.<br />
The technology of constructing tunnels has improved significantly since many of the<br />
earlier CSO tunnels were constructed. The District also has the advantage in that Metro<br />
has constructed many miles of subway tunnels. This experience will assist in the proper<br />
selection of construction methods to achieve reliable operating tunnels.<br />
11.2 Commenters indicated concerns about odors from the tunnel particularly when filling and<br />
emptying (351, 357).<br />
Tunnels are constructed very deep and there are limited points of access to the facilities.<br />
As a result, odors generated in the tunnels have a reduced potential for contact with the<br />
public when compared to a wastewater treatment plant or other above-ground wastewater<br />
facility. In addition, odor control facilities are sometimes employed to reduce the<br />
potential for odors. When they are being emptied, water is pumped out of the tunnels. In<br />
these conditions, air flows into the tunnels to replace the water that is being removed.<br />
This tends to minimize odors. During filling, air in the tunnels is displaced by the<br />
incoming CSO. The tunnel usually fill relatively quickly, reducing the time avalaibel for<br />
contact with odors. In addition, the tunnels fill during rain storms when there are few<br />
people about. Techniques to minimize odors include locating vents in areas where there<br />
is reduced opportunity for public contact, maintaining a slightly negative air pressure on<br />
the tunnels to prevent fugitive emissions, incorporating dampers or other controls to<br />
reduce fugitive emissions, and incorporating odor control. The specific techniques to<br />
apply to the proposed tunnels will depend on the alignment and configuration developed<br />
during detailed design.<br />
11.3 A commenter indicated a concern about the tunnel leaking and contaminating the<br />
groundwater or collapsing. (352). EPA also asked what measures would be taken in<br />
tunnel design and construction to monitor and control infiltration and exfiltration in the<br />
tunnels (370)<br />
Measures to control groundwater infiltration and exfiltration of tunnel contents will<br />
depend on the geology, groundwater chemistry, location and size of the tunnels. The<br />
exact measures to be employed will be selected during the detailed design phase when<br />
specific information is available for each tunnel section. It is possible that different<br />
measures will be employed along the length of the same tunnel as conditions change.<br />
Given that the tunnels are well below grade, are below the river level, and will be empty<br />
for much of the time, it is likely that groundwater infiltration will be the most significant<br />
\\Gh-wash\ENG 1160\LTCP\LTCP Final\App F-Resp to Com\Resp to Com.doc F-33 FINAL - July 2002
Responses to Comments<br />
concern. Measures to control both infiltration and exfiltration include lining the tunnel<br />
with concrete, incorporating a synthetic liner in conjunction with the concrete liner and<br />
grouting from inside the tunnel or from the surface to reduce the permeability of the<br />
ground immediately around the tunnel.<br />
11.4 One commenter recommended that a ground water flow system analysis be performed<br />
prior to construction consisting of 1). Investigating and describing the hydrogeologic<br />
framework (geology) 2). Understanding the inflows and outflows of the groundwater<br />
flow system, 3). Describing the hydraulic properties of the geologic media and its ability<br />
to groundwater to the tunnels, 4). Determining the interaction of the groundwater with the<br />
major surface water bodies in the District and 5). Studying the groundwater quality<br />
conditions in the District to assess the potential impact of storage tunnels on groundwater<br />
and surface water quality (355, 356, 359, 361, 363, 364 ).<br />
These types of evaluations are typically performed during the preliminary engineering<br />
phase where horizontal and vertical alignments for the tunnel are chosen. The impacts of<br />
the tunnel on groundwater and the selection of appropriate lining and waterproofing<br />
techniques for the tunnel are important elements of the design and will be performed in<br />
that phase of implementation.<br />
11.5 Concern was expressed about the lack of specificity as to the alignment of the Potomac<br />
tunnel, the location of shafts, the locations for hauling tunnel spoil, the disruptions<br />
associated with hauling such as traffic (349, 350, 365). Some commenters expressed<br />
concern over the possibility of adversely affecting existing structures during tunnel<br />
construction due to excavation of the tunnel or the ancillary activities such as truck<br />
traffic. Particular concern was expressed over possible effects on the Potomac Boat<br />
Club, Key Bridge, Whitehurst Freeway, Metro Tunnel, and the C&O Canal Park.<br />
Reference was made to shifting soils during construction of unspecified Metro tunnels<br />
(354, 360). A commenter asked for more details regarding Piney Branch such as details<br />
on construction methods, access locations, construction impacts to the park, impact on<br />
groundwater, if other alignments were considered, if the tunnel could be eliminated by<br />
using LID, etc (425, 426).<br />
The tunnel alignments presented in the draft LTCP are preliminary concepts. If<br />
approved, engineering studies would be performed to collect data necessary to site the<br />
tunnels and shafts. During this phase, data is collected on the location, depth and<br />
condition of existing structures. Consideration is also given to siting construction shafts<br />
where removal of excavated material is feasible and where access routes during<br />
construction will minimize nuisances to the public. WASA will select tunnel routes<br />
and/or construction methods to protect and preserve existing facilities and to minimize<br />
\\Gh-wash\ENG 1160\LTCP\LTCP Final\App F-Resp to Com\Resp to Com.doc F-34 FINAL - July 2002
Responses to Comments<br />
construction impacts such as traffic. The lessons learned by Metro will be valuable in<br />
assisting the successful construction of the proposed CSO tunnels.<br />
11.6 One commenter expressed concern over the possible interruption of sewer service<br />
associated with construction of the plan (353).<br />
The tunnels are proposed to be connected to the main interceptor sewers and outfalls in<br />
the system, typically well downstream of most residential and private sewer connections.<br />
As a result, it is unlikely there will be an interruption in sewer service for the vast<br />
majority of customers. In the unlikely event that an interruption in service is required, it<br />
would likely be of short duration and would affect a small number of customers.<br />
11.7 One commenter expressed concern about WASA’s ability to maintain the tunnels<br />
because of their depth and inaccessibility (358).<br />
Many other municipalities have tunnels for CSO control and other purposes. Review of<br />
the experience of these municipalities indicate that it is important to design the facilities<br />
in a manner that will facilitate maintenance and access in the future. Examples might<br />
include providing openings/shafts to the tunnel large enough to accommodate cleaning<br />
equipment and providing facilities for proper ventilation.<br />
11.8 EPA noted that the recommended plan for Rock Creek requires monitoring regulators for<br />
overflows. Connection of the Rock Creek Interceptor to the Potomac Tunnel may be<br />
required as a result. EPA asked if the Potomac Tunnel has been sized to accept the Rock<br />
Creek Interceptor flows initially (366)<br />
The Potomac Tunnel has been sized to relieve the Rock Creek Main Interceptor.<br />
11.9 EPA asked what cost estimation data was used to develop cost estimates for the<br />
proposed tunnels and asked for an assessment of WASA’s level of confidence in the<br />
estimates (368).<br />
WASA obtained construction cost data from Metro and from tunnels in other cities.<br />
WASA also retained a tunnel consultant to provide specific estimates for the tunnels as<br />
proposed. In addition, cost curves for tunnel projects in other municipalities were<br />
reviewed. Based on this data, cost curves were developed for tunnels in rock and tunnels<br />
in soft ground as a function of geology. The basis for the tunnel construction costs has<br />
been included in an appendix of the Final LTCP.<br />
In accordance with the Association for the Advancement of Cost Engineering definitions,<br />
cost opinions developed for the LTCP are considered to be concept screening level<br />
estimates, with an expected accuracy of +40%, -15%. Cost opinions are of this accuracy<br />
because alternatives have been prepared with a minimum of detailed design data for the<br />
\\Gh-wash\ENG 1160\LTCP\LTCP Final\App F-Resp to Com\Resp to Com.doc F-35 FINAL - July 2002
Responses to Comments<br />
purposes of relative comparison. This type of analysis is appropriate for comparisons<br />
between control programs.<br />
11.10 EPA inquired as to what preliminary geologic and hydrogeologic investigation had been<br />
done to determine feasibility and potential siting of underground storage tunnels (371).<br />
Data on soil borings from other projects were collected and reviewed by geotechnical and<br />
tunneling experts. Some data was available on other tunnels in the District such as the B<br />
Street/New Jersey Avenue relief sewer which terminates at the Main and O Street site.<br />
The largest amount of data demonstrating the feasibility of tunneling is Metro’s<br />
experience in constructing miles of tunnels in the <strong>DC</strong> area. Detailed site specific<br />
information will be collected as part of the facility planning investigations which will be<br />
conducted once the Final LTCP is approved.<br />
12. COMMENTS ON REGULATORY COMPLAINCE<br />
12.1 One commenter indicated that the recommended LTCP will still allow overflows every<br />
year and that such overflows will violate existing <strong>DC</strong> water quality standards. The<br />
commenter indicated that CSOs must comply with both the numerical and narrative<br />
portions of the standard. The commenter further indicated that the LTCP must<br />
demonstrate compliance the water quality standards under “all potential weather<br />
conditions”, not just the average year (318).<br />
The current District of Columbia water quality standards include both numeric and<br />
narrative components. The narrative components require, among other items, that<br />
discharges be “free of untreated sewage”. Given the current standards, no alternative<br />
short of complete separation can completely eliminate overflows (and thereby comply<br />
with current standards) during all conditions. Separation has a cost almost triple that of<br />
the recommended LTCP, would cause massive disruption and hardships, and results in<br />
worse water quality than the recommended LTCP. For these and other reasons,<br />
separation was not recommended.<br />
The CSO Policy requires development of controls based on average year conditions, not<br />
“all conditions”. It is difficult to conceive of any plan that can accommodate “all<br />
condition” since this would include hurricanes, 100 year storms, and the intense August<br />
11, 2001 rain event that occurred in the District.<br />
Given that separation is not feasible, there will be some remaining overflows for any<br />
CSO control plan. What remains to be decided is how big to make the facilities and how<br />
infrequent the CSO overflows will be. The higher the degree of CSO control, the higher<br />
the cost. The recommended plan was selected to provide an effective balance of<br />
overflow reduction, water quality improvement and cost. After implementation, it is<br />
\\Gh-wash\ENG 1160\LTCP\LTCP Final\App F-Resp to Com\Resp to Com.doc F-36 FINAL - July 2002
Responses to Comments<br />
predicted that CSOs will occur infrequently and that there will be very infrequent<br />
disruption of water quality due to CSO. This is consistent with the CSO Policy (now part<br />
of the Clean <strong>Water</strong> Act), which calls for an evaluation of what water quality standards are<br />
actually achievable and for revision of standards, where appropriate.<br />
12.2 A commenter indicated that the LTCP fails to comply with the CSO Policy because it<br />
does not address cost-effective expansion or retrofitting of the proposed system. EPA<br />
requested an explanation as to how cost effective expansion might be accomplished.<br />
(317, 317, 435)<br />
The LTCP is expandable and a section describing this is included in Section 13 of the<br />
LTCP.<br />
12.3 A commenter alleged that the draft LTCP violates the 2001 Anacostia <strong>Water</strong>shed<br />
Restoration Agreement and the Chesapeake Bay Agreement, which the District is a<br />
signatory (319).<br />
In 1991, the District of Columbia, State of Maryland, Montgomery County and Prince<br />
George’s County signed the Anacostia <strong>Water</strong>shed Restoration Agreement. The<br />
Agreement was reaffirmed in 1999 and again in 2001. The agreement has six main goals<br />
that call for improvement in water quality, ecological integrity, increased forest cover and<br />
public involvement. The attachment to the Agreement calls for initiation of long term<br />
CSO controls before 2010, a 95% reduction in CSO to the Anacostia with the LTCP<br />
determining the ultimate level of control and schedule for implementation. The LTCP is<br />
completely consistent with the agreement.<br />
In 1983 and 1987, Virginia, Maryland, Pennsylvania, the District of Columbia, the<br />
Chesapeake Bay Commission and EPA signed agreements establishing the Chesapeake<br />
Bay Program to protect and restore the Chesapeake Bay. In 2000, Chesapeake 2000 was<br />
signed which reaffirmed the commitments. The Agreement calls for many measures to<br />
improve the ecosystem such as habitat restoration, water quality protection and<br />
improvement, nutrient reduction, land conservation and other factors. The reductions in<br />
CSO overflow of more than 96 % for all receiving waters is a massive reduction in<br />
pollutants and is entirely consistent with the Chesapeake Bay Program Goals and<br />
Agreement.<br />
12.4 A commenter indicated that the LTCP does not adequately meet the CSO Policy<br />
requirements for including a post-construction monitoring plan. The commenter<br />
indicated that the plan provides inadequate details regarding the how, when and where<br />
such monitoring will be conducted. (321). EPA also indicated that more detail on the<br />
\\Gh-wash\ENG 1160\LTCP\LTCP Final\App F-Resp to Com\Resp to Com.doc F-37 FINAL - July 2002
Responses to Comments<br />
Post Construction monitoring plan should be included in the LTCP, including a schedule.<br />
(320).<br />
A post–construction monitoring program has been included in the LTCP.<br />
12.5 EPA indicated that a more detailed discussion of sensitive areas should be included for<br />
each of the three receiving waters. EPA indicated that the LTCP only addresses Rock<br />
Creek and does not explain how the Hay's Spring Amphipod will be protected by<br />
implementing CSO controls. EPA stated that a discussion of the actual impacts of CSOs<br />
and LTCP-related construction on each species (and mitigation efforts) is necessary.<br />
EPA noted that the Short Nosed Sturgeon was not been included in any discussion of<br />
sensitive areas for the Potomac. Since this endangered species has been known to reside<br />
in Potomac waters, EPA said it should be addressed in the plan along with the other<br />
threatened and/or endangered species (314). A second commenter indicated that the<br />
Anacostia and Potomac Rivers are waters with primary contact recreation as an existing<br />
use. The commenter attached photographs of people using the water body. The<br />
commenter indicated that this makes the Anacostia and Potomac Rivers sensitive areas as<br />
defined by the CSO Policy. The commenter indicated that the presence of the Hayes<br />
Spring Amphipod also makes this section of Rock Creek a sensitive area. The<br />
commenter indicated that the CSO Policy requires WASA to eliminate or relocate the<br />
outfalls on these water bodies unless it can demonstrate that it is not physically possible<br />
or economically achievable or that it would provide less environmental protection than<br />
additional treatment. The commenter further indicated that even if this determination<br />
could be made, the CSO Policy requires WASA to provide the level of treatment for<br />
remaining overflows necessary to protect existing and designated uses, which include<br />
primary contact recreation. (315)<br />
An extensive assessment of sensitive areas for all receiving waters was made in Study<br />
Memorandum 3-4: Sensitive Area. An overview of the analyses was included in the<br />
Draft LTCP on page 2-13. In the Final LTCP, the complete analyses from the study<br />
memorandum have been included.<br />
The analyses indicated that there were no sensitive areas in the Anacostia and the<br />
Potomac, and that the only potential sensitive areas were the occurrences of the Hayes<br />
Spring Amphipod in Rock Creek. In accordance with the CSO Policy, the analyses in<br />
Section 9 of the LTCP evaluate the feasibility of eliminating, relocating, or treating<br />
overflows to potential sensitive areas. The report concluded that these alternatives were<br />
not feasible and that the approach should be to provide the level of control necessary to<br />
protect designated uses and meet water quality standards. Actual construction activities<br />
will have no impact on the amphipod and the resulting water quality improvement will be<br />
of benefit to it.<br />
\\Gh-wash\ENG 1160\LTCP\LTCP Final\App F-Resp to Com\Resp to Com.doc F-38 FINAL - July 2002
Responses to Comments<br />
Regarding the Short Nosed Sturgeon, correspondence with the U.S. Fish and Wildlife<br />
Service does not indicate that this fish is a federally listed species in the District. The<br />
only reference that we can find to it is in the District’s MS4 Permit, which indicates that<br />
the fish may occur in the Potomac. In any case, the selected CSO controls will improve<br />
the water quality in the Potomac.<br />
Note that in comments on the Draft LTCP, the U.S. Fish and Wildlife Service has<br />
indicated that the proposed LTCP will have no adverse impacts on threatened or<br />
endangered species and is likely to be beneficial to them.<br />
Regarding primary contact recreation and existing uses, EPA defines an existing use as<br />
one which is actually attained in the water body on or after November 28, 1975. The<br />
waters of the District of Columbia do not have the water quality to support primary<br />
contact recreation in dry and wet weather most of the time. Indeed, the District instituted<br />
a ban on swimming 1971. This is also reflected in the District water quality standards<br />
which list primary contact recreation as a designed use, not an existing use. Thus, a<br />
water body does not attain the use of primary contact recreation just because some<br />
persons illegally elect to use the water body in that manner. Instead, the use of primary<br />
contact recreation is attained when the water quality that will allow safe swimming to<br />
occur is achieved and when the regulations allow it to occur. Primary contact recreation<br />
is thus not an existing use.<br />
12.6 The U.S. Fish and Wildlife Service commented that implementation of the Draft LTCP<br />
will likely have no adverse effects on endangered species and may actually be beneficial<br />
to them. (423)<br />
Comment noted.<br />
13. COMMENTS ON PUBLIC PARTICIPATION<br />
13.1 Several commenters called for more extensive public participation that involves more<br />
people and groups, and fosters public-private partnerships. One commenter indicated<br />
that there was inadequate citizen attendance at public meetings in that only about 50<br />
citizens participated. (307-310).<br />
WASA conducted an extensive public participation program designed to educate the<br />
affected public and to obtain their input and consultation in selecting the long term CSO<br />
controls. The public participation process included public meetings, establishment of a<br />
Stakeholder Advisory Panel, and an elaborate public information process. Four public<br />
meetings have been held to educate the public and to obtain feedback about CSO issues.<br />
At the request of the public during the first public meeting, a Stakeholder Advisory Panel<br />
\\Gh-wash\ENG 1160\LTCP\LTCP Final\App F-Resp to Com\Resp to Com.doc F-39 FINAL - July 2002
Responses to Comments<br />
was formed. The panel consisted of representatives from government agencies,<br />
regulatory agencies, citizens’ groups, and environmental advocacy groups that are<br />
concerned about water quality issues within the District. Twelve Panel meetings were<br />
held during development of the LTCP.<br />
In addition, the public outreach program included educational mailers in water and sewer<br />
bills, establishment of a CSO website, creation of a CSO mailing list, informational CSO<br />
newsletters, and establishment of public information depositories.<br />
After release of the Draft LTCP, nine neighborhood meeting were held throughout the<br />
District to explain the program and obtain public comments. The D.C. Council and<br />
WASA held public hearings on the plan. Informational mailers, WASA’s website and<br />
presentations to interested groups were also used to obtain input on plan. The Draft<br />
LTCP was well publicized and members of the public provided thoughtful comments.<br />
Over 2,300 comments were received on the Draft LTCP. This does not suggest a lack of<br />
public involvement.<br />
13.2 EPA indicated that the public participation section of the Draft LTCP (Section 10.7)<br />
should be expanded to include the preparation of a Public Responsiveness Document, its<br />
distribution, and information on how later versions of the LTCP will include additional<br />
information on the public participation process (311).<br />
The Final LTCP includes a description of the public participation efforts that have taken<br />
place after release of the Draft LTCP. This includes WASA’s public hearing, the D.C.<br />
Council’s public hearing, neighborhood civic association meetings, other efforts and<br />
preparation of the responsiveness summary. Once the LTCP is finalized and approved,<br />
no subsequent versions of the LTCP are currently planned. However, updates on<br />
implementation of the program or on modifications to the program will include<br />
descriptions of public participation as appropriate.<br />
13.3 EPA asked for information on what steps have been taken to ensure that public<br />
participation has effectively reached minority and low income populations (312).<br />
WASA has advertised public hearings and neighborhood meetings in newspapers which<br />
have an audience with a high proportion of minority and low income persons.<br />
Neighborhood meetings have also been held in every ward of the city, including those<br />
with a high proportion of minority and low income persons. Special effort was made to<br />
hold two neighborhood meetings in Ward 6, which spans the east and west sides of the<br />
Anacostia River. This was done to encourage minority and low-income participation.<br />
Public information depositories were also set up in libraries in these wards of the District.<br />
In addition, the informational mailer describing the Draft LTCP and requesting public<br />
\\Gh-wash\ENG 1160\LTCP\LTCP Final\App F-Resp to Com\Resp to Com.doc F-40 FINAL - July 2002
Responses to Comments<br />
comment was printed in both English and Spanish. Special mailings of the Spanish<br />
edition were made by the Washington Post to Spanish speaking households.<br />
13.4 EPA asked for information on what steps have been taken to evaluate the potential for<br />
disproportionately high and adverse human health or environmental effects on minority<br />
and low-income populations (313).<br />
Minority and low income populations make up a proportionally high share of the<br />
watershed of the Anacostia River in the District. The greatest CSO control benefit and<br />
the largest expenditures in the LTCP are directed toward improving the Anacostia River.<br />
Of the $1.265 billion program, $940 million or about 74% are directed toward improving<br />
the water quality of the Anacostia River. The LTCP is thus extremely responsive to those<br />
communities. Instead of having a negative impact, the LTCP will bring a much greater<br />
benefit to those communities.<br />
14. COMMENTS ON FINANCIAL CAPABILITY ASSESSMENT<br />
14.1 Several commenters opposed increasing rates to pay for CSO control. (82-85)<br />
<strong>Control</strong> of CSOs is required by the Clean <strong>Water</strong> Act and by WASA’s National Pollutant<br />
Discharge Elimination <strong>System</strong> (NPDES) Permit. Other communities in the nation also<br />
are facing this issue. One strategy that may mitigate rate increases is to seek financial<br />
assistance from the federal government.<br />
14.2 Many commenters indicated that the Federal Government should pay a significant<br />
portion of the cost of CSO control. Some commenters asked for Federal participation in<br />
the 75-90% range. Commenters offered the following as reasons why federal<br />
involvement was justified: (86, 88, 89, 93, 94, 109-123)<br />
<br />
<br />
<br />
<br />
<br />
<br />
The ACOE and Federal Government built the CSS and turned it over to the District.<br />
The Fed Gov should pay for fixing the problem it created<br />
The special relationship between the Federal Government and the District<br />
Government<br />
The large number of federal properties in the District and government institutions<br />
such as embassies, etc. that are exempt from taxes<br />
CSO control is an unfounded mandate<br />
Financial burden on the District is too high<br />
Other Cities have received significant help with CSO costs (Boston, Chicago). There<br />
is precedent.<br />
WASA is seeking financial assistance from the Federal Government for CSO control. In<br />
addition to paying water and sewer bills, the Federal Government bears a special<br />
responsibility to the District for the CSO system. This is because the Federal<br />
Government designed and constructed the combined sewer system and essentially left the<br />
\\Gh-wash\ENG 1160\LTCP\LTCP Final\App F-Resp to Com\Resp to Com.doc F-41 FINAL - July 2002
Responses to Comments<br />
District with the liability for CSO control. In addition, the Federal Government has in the<br />
past and continues to govern the District in all matters. This situation places a special<br />
responsibility on the Federal Government to mitigate CSO costs to District ratepayers.<br />
14.3 EPA questioned the method used to establish billings to the Federal Government and<br />
whether the current system properly allocates costs. EPA questioned whether changes<br />
should be made in the separate vs. combined sewer areas and if such changes would<br />
impact affordability (87).<br />
The Federal Government and other large users pay water and sewer bills in proportion to<br />
metered potable water used. <strong>Combined</strong> sewer costs are proportional to runoff, and water<br />
consumption is not a good indicator of runoff. An example would be a parking lot with a<br />
large amount of runoff but only minimal water usage. As a result, WASA is evaluating<br />
alternate rate structures that give some consideration to impervious area. It is unlikely<br />
that alternate rate structures will substantially affect affordability.<br />
In addition to water used and wastes/runoff generated, the Federal Government bears a<br />
special responsibility to the District for the CSO system. This is because the Federal<br />
Government designed and constructed the combined sewer system and essentially left the<br />
District with the liability for CSO control. In addition, the Federal Government has in the<br />
past and continues to govern the District in all matters. This situation places a special<br />
responsibility on the Federal Government to mitigate CSO costs to District ratepayers.<br />
14.4 Several commenters indicated that since Maryland and Virginia send flow to the District<br />
for treatment, they contribute to CSOs and should pay a fair share toward CSO control.<br />
One commenter suggested that some form of commuter tax be employed (90-97).<br />
In accordance with the Intermunicipal Agreement (IMA) of 1985, the surrounding<br />
jurisdictions pay WASA for the wastewater these jurisdictions sent to BPWWTP for<br />
treatment. The suburbs are currently within their average and peak flow limitations and<br />
the LTCP was prepared by assuming the suburbs were discharging at these limits. Under<br />
the current IMA, WASA cannot charge surrounding jurisdictions additional fees for CSO<br />
control since the suburbs are already paying for the wastewater they send to BPWWTP.<br />
Requiring the suburbs to pay an additional charge for CSO control would require<br />
justification and renegotiation of the IMA. This would be a long and involved political<br />
process with an uncertain outcome.<br />
14.5 Several commenters indicated that consideration should be given to an alternate rate<br />
structure that incorporates impervious area since impervious surface is what contributes<br />
runoff and CSOs (101, 103, 105, 106). Several commenters indicated that the rate<br />
\\Gh-wash\ENG 1160\LTCP\LTCP Final\App F-Resp to Com\Resp to Com.doc F-42 FINAL - July 2002
Responses to Comments<br />
structure should be revised to include incentives for promoting the reduction of storm<br />
water. (276, 277).<br />
WASA will give this consideration as the LTCP is implemented. However, changing the<br />
rate structure is unlikely to significantly affect affordability or the selection of the<br />
proposed CSO controls.<br />
14.6 Several commenters suggested that a “lifeline” rate or other mechanism be developed to<br />
protect low income and the elderly form elevated rates, especially upon implementation<br />
of the LTCP (102, 104, 107, 108).<br />
WASA will give this consideration as the LTCP is implemented.<br />
14.7 One commenter suggested putting CSO costs in perspective by comparing them to<br />
school, road or other <strong>DC</strong> budgets (100).<br />
Budgets for other programs might be considered large compared to the cost of CSO<br />
control. For example, the D.C. school budget for 2003 is reported to be about $5.7<br />
billion. However, the impact on rates is a better indicator of the true cost to rate payers of<br />
CSO controls. Households in the District have a limited amount of disposable income.<br />
The proposed CSO controls will raise the cost of wastewater service to very high<br />
amounts.<br />
14.8 Several commenters indicated that there was an overlap between the Draft LTCP and<br />
WASA’s Capital Improvement Program (CIP). The pumping station rehabilitations are<br />
included in both the LTCP and the CIP. One commenter suggested that this overlap<br />
resulted in double counting of the pump station coats and overstatement of the effect on<br />
rates (98, 99).<br />
The LTCP includes the following projects that are in the CIP: $127 million for pumping<br />
station rehabilitations and the $3 million for LID. Since these items are already<br />
budgeted, they were excluded from the cost of the LTCP for purposes of doing the<br />
financial analysis. Thus, these items are not “double counted” when evaluating the effect<br />
on rates.<br />
14.9 One commenter indicated that the analysis in the Draft LCTP overstates the costs in the<br />
early years because it assumes the entire cost of the program is bonded from year one.<br />
Typically, bonds will be issued over time so the rate impacts are phased-in (127).<br />
The affordability analysis in the LTCP was prepared according to the method proscribed<br />
by EPA. The analysis estimates the cost per household in terms of today’s dollars near<br />
the peak in the program. It is a method of assessing what the relative cost of the program<br />
will be compared to income. It is true that in the early years of any program, rate<br />
increases are typically gradual to build up to the amount required to finance they<br />
\\Gh-wash\ENG 1160\LTCP\LTCP Final\App F-Resp to Com\Resp to Com.doc F-43 FINAL - July 2002
Responses to Comments<br />
program. However, the EPA methodology is a good indicator of what real costs will be<br />
compared to income.<br />
14.10 One commenter indicated that a rate structure should be instituted so that non-profits<br />
such as the World Bank and Fannie Mae pay into the system. (81)<br />
Non-profits and the Federal Government all pay water and sewer bills and thus contribute<br />
to the cost of the infrastructure including CSO control.<br />
14.11 EPA commented that the Draft LTCP does not indicate when higher residential customer<br />
rates would be seen. EPA recommended that the projected phase-in of the rate increase<br />
be presented. (124)<br />
The phase in of rate increases depends on many factors including:<br />
<br />
<br />
<br />
<br />
<br />
Implementation schedule<br />
Availability of grant funding<br />
Other capital improvements in the system<br />
Other regulatory requirements<br />
Approval date of LTCP<br />
At this stage it is not possible to predict the actual rate increases necessary with a<br />
sufficient degree of accuracy. However, it is likely that rates increases will be small in<br />
the beginning, reach a peak near the middle of the program, and tail off near the end of<br />
the program.<br />
14.12 EPA commented that that the report indicates the District has a disproportionate number<br />
of low income households, but does not provide census or other information to support<br />
the statement. (125)<br />
The LTCP has been revised to compare the District’s income distribution to that of<br />
Maryland and Virginia.<br />
14.13 A commenter indicated that WASA needed a fall-back position if Federal Funding does<br />
not come through. (126)<br />
If no federal funding is provided, the schedule for implementation may be extended to<br />
lessen the impact on ratepayers.<br />
14.14 EPA indicated the LTCP should describe how much money will be needed to fund<br />
individual control plan elements based on the project schedule. They also requested that<br />
work be identified that has funding available. EPA also questions what was the<br />
significance that certain project elements were in the CIP (434).<br />
\\Gh-wash\ENG 1160\LTCP\LTCP Final\App F-Resp to Com\Resp to Com.doc F-44 FINAL - July 2002
Responses to Comments<br />
The estimated capital and operation and maintenance costs for the items in the schedule<br />
are shown in Section 13 of the LTCP. Items in the capital improvement program (CIP)<br />
have also been identified in this section. These are significant in that they have a<br />
schedule and budget in the program.<br />
14.15 A commenter indicated that WASA should consider opportunities for partnership with<br />
the Federal ISTEA program, EPA 319 grants and other federal programs. (431)<br />
Comment noted.<br />
15. COMMENTS ON SCHEDULE<br />
15.1 Several commenters advocated for a shorter schedule (322, 330-339). One commenter<br />
incorrectly indicated that the LTCP will take 30 years to build. (326). Another<br />
commenter indicated that the 20-year implementation time is not adequately justified in<br />
the plan (328).<br />
The projects in the LTCP can be divided into two categories: those in the existing Capital<br />
Improvement Program (CIP) and those not in the CIP. Projects in the CIP have been<br />
budgeted and scheduled and these projects will move forward without approval of the<br />
LTCP. These can generally be completed in about 6 years. For projects not in the CIP,<br />
an implementation schedule has been developed based on years after approval of the<br />
LTCP. Based on the financial capability assessment and the impact on rates, a 40-year<br />
implementation time is proposed for the entire recommended plan without any outside<br />
financial assistance. This is to mitigate the impact on rate payers of the large<br />
expenditures for CSO control. If significant outside financial assistance is obtained, it is<br />
technically feasible to accelerate the schedule to a 15-year implementation time frame.<br />
Significant outside assistance on the order of 75% would be required to achieve this<br />
schedule.<br />
15.2 Some commenters indicated that there were things that could be done immediately (like<br />
trash control) and that these should be implemented early because 20 years is too long to<br />
wait for trash control (327, 342).<br />
WASA has a nine minimum control program which includes the following measures to<br />
control solid and floatables control:<br />
<br />
<br />
<br />
Anacostia River Floatable Debris Program on the Anacostia River - this is a<br />
skimmer boat program which removes floating debris on the river. Note that this<br />
program removes debris from storm water and upstream Maryland sources in<br />
addition to CSO sources.<br />
End of pipe netting system on CSO 018 on the Anacostia River<br />
Catch basin cleaning<br />
\\Gh-wash\ENG 1160\LTCP\LTCP Final\App F-Resp to Com\Resp to Com.doc F-45 FINAL - July 2002
Responses to Comments<br />
<br />
Screening facility at the Northeast Boundary <strong>Sewer</strong> and the bar racks at the<br />
pumped overflows at the Main and ‘O’ Street Pumping Stations<br />
Additional floatables control will be provided as LTCP elements come on line. These<br />
elements will come on line throughout the duration of implementation period. It will not<br />
be necessary to wait until the end of the implementation period.<br />
15.3 One commenter indicated that the plan does not have fixed date schedules and thus does<br />
not comply with the CSO Policy (328).<br />
It is unknown when the LTCP will be approved for implementation. The schedules in the<br />
LTCP were thus developed in years after the date of approval. The CSO Policy does not<br />
require fixed date schedule. The CSO Policy says: “The permittee should include all<br />
pertinent information in the long term control plan necessary to develop the construction<br />
and financing schedule for implementation of CSO controls. Schedules for<br />
implementation of the CSO controls may be phased based on relative importance of<br />
adverse impacts on WQS and designated use, priority projects identified in the LTCP,<br />
and on the permittee’s financial capability.” The LTCP complies with these<br />
requirements.<br />
15.4 One commenter indicated that the Potomac tunnel is pushed too far out in the schedule.<br />
The commenter advocated for earlier implementation. (329)<br />
In accordance with the CSO Policy, the implementation schedule was developed giving<br />
consideration to public comments and to areas where water quality impacts due to CSOs<br />
were the greatest. The majority of the public and the regulatory agencies public indicated<br />
that the Anacostia River projects should be given priority. The Anacostia also receives<br />
the most CSO overflow volume and is the area where CSO impacts are the greatest.<br />
Given outside financial assistance, the Potomac CSO controls could be accelerated in the<br />
schedule.<br />
15.5 EPA commented that the constraints that prevent nearer-term completion of each major<br />
project component should be described. (325)<br />
This is included in Final LTCP.<br />
15.6 EPA questioned whether the first 2 segments of the Anacostia tunnel project would be<br />
independently operational in terms of providing useable storage and transmission<br />
immediately upon completion of construction. (343)<br />
There are three basic elements to the Anacostia system. They are listed from downstream<br />
to upstream as follows<br />
\\Gh-wash\ENG 1160\LTCP\LTCP Final\App F-Resp to Com\Resp to Com.doc F-46 FINAL - July 2002
Responses to Comments<br />
<br />
<br />
<br />
Tunnel from Poplar Point to Northeast Boundary Outfall<br />
Tunnel Parallel to Northeast Boundary <strong>Sewer</strong><br />
Short tunnels from flood areas to Northeast Boundary <strong>Sewer</strong><br />
The downstream facilities must be completed before upstream tunnels come on line.<br />
However, the downstream tunnels can come on line before upstream tunnels are<br />
complete. This will enable achieving some CSO benefit earlier than otherwise expected.<br />
15.7 A commenter and EPA suggested presenting year by year improvements in CSO<br />
reduction to demonstrate that CSO reduction is progressive and that the District will not<br />
have to wait 20 years to realize all the benefits of the plan (287, 341).<br />
This is included in Final LTCP.<br />
15.8 EPA commented that the draft plan identified early action items that are not dependent on<br />
LTCP approval. EPA indicated that a summary action plan should be prepared and<br />
submitted to implement the early action items (340).<br />
The schedule in the LTCP includes elements that can proceed without approval of the<br />
plan.<br />
15.9 One commenter indicated that WASA should be given more time to implement the LTCP<br />
if it includes more emphasis on non-engineered solutions (323).<br />
Comment noted.<br />
16. COMMENTS ON WATER QUALITY STANDARDS REVISIONS<br />
16.1 Several commenters expressed support for modifying the water quality standards as<br />
proposed in the LTCP to acknowledge discharges that would remain after<br />
implementation of the Draft LTCP (411-416). Many commenters opposed changes to the<br />
water quality standards proposed in the Draft LTCP (373-407).<br />
The current District of Columbia water quality standards include both numeric and<br />
narrative components. The narrative components require, among other items, that<br />
discharges be “free of untreated sewage”. Given the current standards, no alternative<br />
short of complete separation can completely eliminate overflows (and thereby comply<br />
with current standards) during all conditions. Separation has a cost almost triple that of<br />
the recommended LTCP, would cause massive disruption and hardships, and results in<br />
worse water quality than the recommended LTCP. For these and other reasons,<br />
separation was not recommended. Given that separation is not feasible, there will be<br />
some remaining overflows for any CSO control plan under some weather conditions.<br />
Given the large investment in the LTCP, water quality standards provisions need to be<br />
adopted to provide for the remaining discharges that will occur. While the goal of<br />
\\Gh-wash\ENG 1160\LTCP\LTCP Final\App F-Resp to Com\Resp to Com.doc F-47 FINAL - July 2002
Responses to Comments<br />
fishable and swimmable waterways should not be changed, there needs to be a<br />
recognition in the standards that there is an upper limit to the control provided by any<br />
CSO plan.<br />
16.2 A commenter indicated that instead of seeking to change the water quality standards,<br />
WASA could seek a variance for CSO and thereby not need to change them. (417)<br />
Variances are short-term modifications to the water quality standards that could be<br />
configured to allow CSOs. However, the District Standards and the CSO Policy indicate<br />
that variances are valid for 3 years and must be applied for and reviewed every 3 years.<br />
EPA guidance and practice indicate that variances are envisioned for short term<br />
application when some additional time is needed to ascertain a water quality impact or to<br />
develop a control approach. This is not the case for CSO controls, where implementation<br />
is expected to take 20 years and where there will be a lengthy period of evaluation of<br />
effectiveness after implementation. In addition, the renewal of a variance every 3 years is<br />
not guaranteed or certain. If the variance is not granted, the investment in the LTCP<br />
would be at risk and subject to lawsuits or regulatory action. It is not practical to risk the<br />
magnitude of the investment in the LTCP on the possibility of attaining many variances<br />
through the years.<br />
16.3 EPA questioned how the implementation of the WQS currently proposed by DOH would<br />
affect the plan (408)<br />
The District proposed revisions to the WQS in the October 12, 2001 D.C. Register. The<br />
revisions included several technical changes regarding light clarity and bacteriological<br />
standards, and a wet weather provision proposed to accommodate CSO. The District<br />
subsequently withdrew the proposed revisions and published an emergency rulemaking<br />
adopted on January 25, 2002. The emergency rule making included new numeric criteria<br />
for Secchi Depth, Chlorophyll a, Arsenic, and Ammonia, and made various other<br />
technical changes. The rule making did not propose any wet weather provisions or<br />
otherwise affect any portion of the standards pertaining to wet weather discharges.<br />
As a result, the assessments made in the Draft LTCP regarding the impact of the current<br />
water quality standards on CSO remain accurate. WQS provisions are also addressed in<br />
the Final LTCP.<br />
16.4 A commenter indicated that potable water was unsanitary and that higher water quality<br />
standards were needed to have safe drinking water (409). Another commenter indicated<br />
that CSOs affect our water supplies and that for this reason more CSO control is<br />
necessary. (302)<br />
\\Gh-wash\ENG 1160\LTCP\LTCP Final\App F-Resp to Com\Resp to Com.doc F-48 FINAL - July 2002
Responses to Comments<br />
The District withdraws potable water from the Potomac well upstream of any CSO<br />
discharges. In addition, no potable water supplies withdraw water from the Potomac<br />
River downstream of the District CSO areas. This is due to the salinity in the Potomac<br />
River. As a result, the District’s CSOs will not affect drinking water.<br />
16.5 Commenters indicated that WASA worked backwards by proposing to change the WQS<br />
to fit the preferred LTCP instead of trying to develop a plan to meet the existing water<br />
quality standards. Commenters further stated that WASA did not start off with a goal of<br />
meeting the existing water quality standards.(418-419)<br />
An evaluation was made of whether it was possible to meet the current water quality<br />
standards with any form of CSO control. The only plan that would meet the current<br />
standards is separation. In addition, separation provides worse real-world water quality<br />
than a high degree of CSO control. Due to the high cost, impracticality, and poor water<br />
quality performance of separation, an evaluation was made of other degrees of CSO<br />
control that provide an effective combination of performance, minimal disruption of the<br />
use of the water body, reasonable cost and practicality. This is in accordance with the<br />
approach described in EPA’s CSO Policy which is now part of the Clean <strong>Water</strong> Act.<br />
16.6 A commenter indicated that primary and secondary contact recreation are existing uses<br />
on each of the receiving waters and that the Clean <strong>Water</strong> Act legally prohibits changing<br />
the standards that would interfere with an existing use. (410)<br />
Primary contact recreation is not an existing use. Reference the discussion in the<br />
comments related to Sensitive Areas. The District of Columbia Department of Health has<br />
established the existing use of the waterways as Class B or secondary contact recreation.<br />
The LTCP will meet the bacteria geometric mean standard for the design condition<br />
specified in the CSO Policy (average year) for Class B waters.<br />
16.7 A commenter indicated that the net effect of changing the water quality standards as<br />
recommended in the LTCP would be to ban swimming in perpetuity. Without the<br />
existing water quality standards as a driving force, there would be no impetus to improve<br />
water quality and the people of the District deserve to be able to use the waters for<br />
recreation.<br />
The recommended plan for CSO control will meet the geometric mean bacteria standard<br />
in all receiving waters. If other sources were controlled in conjunction the recommended<br />
plan, the bacteria standard could be met in all receiving waters. The CSO plan is thus<br />
protective of swimming and the current water quality standards.<br />
After implementation, CSOs are projected to cause fecal coliform levels to rise above an<br />
average of 200MPN/100 ml for 7 days per year in the Anacostia, 5 of which occur in the<br />
\\Gh-wash\ENG 1160\LTCP\LTCP Final\App F-Resp to Com\Resp to Com.doc F-49 FINAL - July 2002
Responses to Comments<br />
period of likely recreational use from May to September. The LTCP is thus projected to<br />
be protective of swimming the remaining 358 days of the year or more than 98% of the<br />
time. The days when CSOs cause high bacteria levels will likely coincide with other<br />
natural conditions such as high water flows, severe thunder strorms, lightning and other<br />
conditions that would make use of the waterbody impractical or unsafe.<br />
17. MISCELLANEOUS COMMENTS<br />
17.1 A commenter indicated that WASA should consider the effects of global warming on<br />
long term rainfall patterns and determine if changes need to be made in the evaluation.<br />
(286).<br />
A report entitled Climate Change Impact on the United States (National Assessment<br />
Synthesis Team. 2001) was reviewed to assess the possible impact of changes in<br />
precipitation on modeling future rain events for the recommended <strong>Long</strong> <strong>Term</strong> <strong>Control</strong><br />
<strong>Plan</strong>. There are two major models, known as the Hadley Model and the Canadian Model<br />
that simulate and predict future precipitation in North America. Although both models<br />
predict an increase in the amount of precipitation in the Northeastern United States by the<br />
year 2100, the projected increase varies from 5% to 25%. Furthermore, additional studies<br />
offer conflicting results concerning the nature of precipitation in the future. Some studies<br />
predict more intense storms, while others predict less intense ones; some studies suggest<br />
an increase in the actual number of storms, while others suggest a decrease. There are<br />
also variations in the predicted tracks of storm events. Given the long time frame for a<br />
climate change and the lack of consistent and specific predictions regarding its effects, it<br />
impractical now to revise sizing of controls. If climate change does occur, the LTCP is<br />
expandable by techniques described in subsequent sections to accommodate any<br />
increased overflows.<br />
17.2 A commenter suggested developing a system to track and respond to environmental<br />
complaints such as suspicious discharges to waterways, street and basement flooding<br />
incidences, and others. The commenter suggested incorporating some reporting<br />
mechanism so the public understands the complaint and knows what action was taken.<br />
(288)<br />
WASA is responsible for the water and wastewater system in the District. The D.C.<br />
Department of Health and Police Department are responsible other discharges to<br />
waterways, illicit discharges, environmental crimes, and the like.<br />
17.3 A commenter indicated that WASA should keep a record of notice of violations (292).<br />
WASA submits discharge monitoring reports to EPA for Blue Plains and a quarterly<br />
report on the CSO system. These reports include information on permit violations. The<br />
CSO quarterly reports are available on WASA’s web site at www.dcwasa.com.<br />
\\Gh-wash\ENG 1160\LTCP\LTCP Final\App F-Resp to Com\Resp to Com.doc F-50 FINAL - July 2002
Responses to Comments<br />
17.4 Commenters indicated that continued CSOs present a health risk due to fish consumption<br />
and the potential for contact. The commenters indicated that the LTCP fails to<br />
adequately address this issue. (290,291)<br />
The fish advisories in District waters are for PCBs in fish tissue. During the monitoring<br />
program prepared for this study, no PCBs were detected in CSO discharges. In addition,<br />
the proposed CSO controls will reduce CSOs by a large amount. See the response to<br />
comment 16.7 regarding primary contact with the receiving waters.<br />
17.5 A commenter expressed a concern as to whether the LTCP would be competently and<br />
correctly implemented. (304)<br />
Once approved, WASA is committed to professionally implementing the LTCP. WASA<br />
was created in 1996 and since that time has made major strides in improving operations,<br />
financial management, and the water and wastewater systems. WASA is currently<br />
managing a $1.6 billion capital improvement program separate from the LTCP. WASA<br />
capabilities have been proven by the major changes in operations and performance since<br />
its creation in 1996.<br />
17.6 A commenter expressed concern that WASA was not forthcoming to the public and that<br />
WASA’s statements were not reliable. (303)<br />
WASA is committed to complete, truthful and timely responses to public inquiries and<br />
concerns. WASA’s performance since 1996 is evidence of this and demonstrates<br />
WASA’s commitment to these goals.<br />
17.7 EPA commented that the statement in the LTCP reading “In March 2001 the DOH<br />
released its first TMDL for the impaired waterbody.” is incorrect. The first TMDL was<br />
issued on January 12, 1999. The Anacostia BOD TMDL is the second (301).<br />
The report will be corrected to reflect that the oil and grease TMDL for Hickey Run, a<br />
tributary to the Anacostia, was issued prior to the BOD TMDL.<br />
17.8 EPA asked that the toxic pollution control benefits of the recommended plan be<br />
quantified, to the extent permitted by available information. EPA also asked for an<br />
estimate of the amount of toxics that will be captured and treated at Blue Plains WWTP<br />
that would otherwise be discharged if sewers were separated. (344)<br />
The Draft LTCP is predicted to remove toxics (metals, organics, etc.) in proportion to the<br />
amount of CSO overflow volume reduced. The Draft LTCP proposed a system-wide<br />
92% reduction in CSO overflow volume. The total discharge of toxics will be reduced<br />
proportionately. This is a conservative estimate since discharges that occur after<br />
\\Gh-wash\ENG 1160\LTCP\LTCP Final\App F-Resp to Com\Resp to Com.doc F-51 FINAL - July 2002
Responses to Comments<br />
implementation of the LTCP will typically occur well after the first flush when toxics<br />
concentrations are likely to be lower.<br />
Separation would result in a significant increase in untreated discharges to the receiving<br />
waters. The Table below summarizes untreated discharged (i.e. excluding Blue Plains<br />
discharged) from the combined and separate storm water systems in the District.<br />
Untreated Discharge Volumes in Average Year<br />
(Average of 1988-1990)<br />
Untreated<br />
CSO Overflow Storm <strong>Water</strong> % Change From<br />
Volume Discharges No Phase I<br />
(mg/yr) (mg/yr) <strong>Control</strong>s<br />
% Change<br />
From Draft<br />
LTCP<br />
Scenario<br />
No Phase I <strong>Control</strong>s 3,254 18,108 0%<br />
Draft LTCP 264 15,118 -17% 0%<br />
Separation 0 22,491 24% 49%<br />
The untreated discharges from the combined and separate storm water systems were<br />
found to have similar concentrations of toxics during the monitoring conducted as part of<br />
the LTCP. As a result, comparison of volumes alone is a good indicator of pollutants<br />
discharged. As indicated in the table, the Draft LTCP would result in a net 17%<br />
reduction in untreated volume discharged, while separation would result in an estimated<br />
24% increase in untreated discharges. When compared to the Draft LTCP, separation<br />
would result in an estimated 49% increase in untreated discharges.<br />
17.9 EPA asked if rehabilitation of the Potomac Pump Station would provide any additional<br />
screening of floatables (34).<br />
Rehabilitation of Potomac Pumping Station will restore the capacity of the station to its<br />
design rating of 460 mgd. This will increase the amount of CSO captured and treated and<br />
will thereby increase the amount of floatables material captured.<br />
17.10 A commenter recommended coordinating surface construction with the District Office of<br />
<strong>Plan</strong>ning for the possibility of integrating parks or other enhancements into the design.<br />
(422).<br />
WASA will seek opportunities to coordinate and collaborate with the Office of <strong>Plan</strong>ning<br />
throughout the implementation phase of the LTCP.<br />
17.11 One commenter requested the removal of references to upstream pollution sources being<br />
a significant source of water quality impairment (428).<br />
WASA’s NPDES permit requires the preparation of the LTCP in accordance with EPA<br />
CSO Policy which is now part of the Clean <strong>Water</strong> Act. The CSO Policy and EPA’s<br />
\\Gh-wash\ENG 1160\LTCP\LTCP Final\App F-Resp to Com\Resp to Com.doc F-52 FINAL - July 2002
Responses to Comments<br />
guidance documents indicate that since pollution sources other than CSOs can affect<br />
receiving water quality and the ability to attain water quality standards, they should be<br />
considered and assessed in the LTCP. As result, discussion of upstream pollution sources<br />
and their effect on water quality is unavoidable.<br />
\\Gh-wash\ENG 1160\LTCP\LTCP Final\App F-Resp to Com\Resp to Com.doc F-53 FINAL - July 2002
District of Columbia <strong>Water</strong> and <strong>Sewer</strong> Authority<br />
<strong>Combined</strong> <strong>Sewer</strong> <strong>System</strong> <strong>Long</strong> <strong>Term</strong> <strong>Control</strong> <strong>Plan</strong><br />
Table 1 - Summary of Comments on Draft LTCP<br />
No. Last Name First name Affiliation Address 1 Address 2 Forum Comment Category<br />
1 Bobreski Jim Citizen<br />
<strong>DC</strong> Council Pub<br />
Hearing<br />
Consider decentralized treatment and tell people it has to be<br />
in their backyard<br />
Alternatives<br />
2 Schulman Jim<br />
Sustainable<br />
Community<br />
Initiatives 631 E St NE<br />
Washington <strong>DC</strong><br />
20002 Questionnaire<br />
Consider eliminating wastewater systems that use clean<br />
water- use grey water, composting toilets, natural filtration,<br />
etc.<br />
Alternatives<br />
3 Stiehler Robert D. Citizen<br />
3234 Quesada St<br />
NW<br />
Washington <strong>DC</strong><br />
20015 Questionnaire<br />
Consider flood plains for storm water would reduce<br />
overflows<br />
Alternatives<br />
4 CItizen Neigh Mtg#12<br />
Consider innovative technologies to eliminate overflows<br />
entirely<br />
Alternatives<br />
5<br />
Clean <strong>Water</strong><br />
Campaign<br />
NR<strong>DC</strong> 1200 New<br />
York Ave., NW<br />
Washington <strong>DC</strong><br />
20005 Written Comments Consider near term consolidation of CSOs & disinfection Alternatives<br />
1726 St NW, Suite Washington <strong>DC</strong> <strong>DC</strong> Council Pub Consider not doing Potomac Tunnel and putting money into<br />
6 Wentworth Marchant Sierra Club 902<br />
20036<br />
Hearing<br />
Anacostia<br />
Alternatives<br />
7 Napier Maurice, J.<br />
The McCombie<br />
Napier<br />
Compant, Ltd Scotland Written Comments Consider old ship tankers for CSO storage Alternatives<br />
8 Heinrich Phil Citizen Written Comments<br />
Consider on-site storage of sanitary wastes to "share" CSO<br />
system<br />
Alternatives<br />
3730 Windom Washington <strong>DC</strong><br />
9 Wells Jeffrey R. Citizen Place, NW 20006 Written Comments Consider pollution prevention Alternatives<br />
Not<br />
Consider storm water management incentives and targeted<br />
10 Provided Not Provided Citizen Not Provided Not Provided Questionnaire separation<br />
Alternatives<br />
11 CItizen Neigh Mtg#3 Consider using CSO like greywater at golf courses Alternatives<br />
12 Number not used<br />
13 Number not used<br />
1809 Monroe St, Washington <strong>DC</strong><br />
14 Forsberg Ken Citizen NW<br />
20010 Questionnaire Find some ways of stopping overflows other than separation Alternatives<br />
15 Sanders Serita<br />
16 Fellows<br />
17 Fellows<br />
Andrew, and<br />
Paul<br />
Schwartz<br />
Andrew, and<br />
Paul<br />
Schwartz<br />
18 Whitehead Damon<br />
Bloomingdale<br />
Civic Assoc P.O. Box 92691<br />
Clean <strong>Water</strong><br />
Action<br />
Clean <strong>Water</strong><br />
Action<br />
Anacostia<br />
Riverkeeper<br />
4455 Connecticut<br />
Ave, NW, A-300<br />
4455 Connecticut<br />
Ave, NW, A-300<br />
1st & Potomac<br />
Avenue, SE<br />
19 Chanay Robin D CItizen 503 S St NW<br />
Washington, <strong>DC</strong><br />
20090 WASA Pub Hearing Look at lessons learned in other cities Alternatives<br />
Washington, <strong>DC</strong><br />
20008 WASA Pub Hearing<br />
20 CItizen Neigh Mtg#5<br />
21 Slowenski Kent Citizen NA NA WASA Pub Hearing<br />
Marchant,<br />
and Robert<br />
1726 St NW, Suite<br />
22 Wentworth Morris Sierra Club 902<br />
LTCP does not address SSOs and storm water pollution<br />
from separate sewer system<br />
Alternatives<br />
Washington, <strong>DC</strong><br />
20008 WASA Pub Hearing<br />
LTCP does not address water cross connections or<br />
water/sewer pipes crossing<br />
Alternatives<br />
Washington, <strong>DC</strong><br />
LTCP does not allow for any growth in District (IMA)<br />
20003 WASA Pub Hearing whereas suburbs have growth<br />
Alternatives<br />
Washington <strong>DC</strong><br />
20001 Written Comments LTCP will provide no WQ benefits Alternatives<br />
Maintenance: Concern that this plan does not address<br />
clogging in separate stsorm sewers/catch basin cleaning Alternatives<br />
Maintenance: Doesn't address maintenance of deteriorated<br />
sewer system<br />
Alternatives<br />
Washington <strong>DC</strong><br />
20036 Written Comments MD & VA should reduce their flows Alternatives<br />
1 of 23
No. Last Name First name Affiliation Address 1 Address 2 Forum Comment Category<br />
MD/VA - An alternative should be developed and evaluated Alternatives<br />
to temporarily reduce the input of flows from separated<br />
sewers during wet weather from Fairfax County, WSSC,<br />
and other currently separated portions of the District to the<br />
CSS. Options might include storage (in sewers or<br />
otherwise), satellite treatment, or conveyance past the<br />
Philadelphia, PA<br />
combined system directly to Blue Plains<br />
23 Hanmer Rebecca EPA Reg 3 1650 Arch Street 19103 Written Comments<br />
24 CItizen Neigh Mtg#5<br />
MD/VA - Concern that flows from MD/VA take up capacity in<br />
CSS, causing overflows<br />
Alternatives<br />
25 Glover Joseph Citizen<br />
1215 33rd Palce<br />
SE<br />
Washington <strong>DC</strong><br />
<strong>DC</strong> Council Pub<br />
Hearing<br />
MD/VA - <strong>DC</strong> should not pay for pollution control without<br />
MD/VA doing their share<br />
Alternatives<br />
Friends of the 1025 Vermont Washington, <strong>DC</strong><br />
MD/VA - Fed Gov, Maryland and Virginia should stop<br />
26 Blackwelder Brent Earth Avenue, NW 20005 WASA Pub Hearing polluting<br />
Alternatives<br />
Larry and<br />
Robert<br />
Anacostia<br />
<strong>Water</strong>shed 4302 Baltimore Bladensburg, MD<br />
MD/VA - Push for watershed approach to storm water in MD<br />
27 Silverman Boone Society Ave.<br />
20710 WASA Pub Hearing and put some money toward it<br />
Alternatives<br />
28 Sesil Joe Citizen 3421 N St NW Washington <strong>DC</strong> Questionnaire<br />
MD/VA - Recommends watershed protection program with<br />
counties<br />
Alternatives<br />
29 Baron David Earthjustice<br />
1625 Mass. Ave,<br />
NW Suite 702<br />
Washington <strong>DC</strong><br />
20036 Written Comments<br />
MD/VA - Suburban flows should be carried around CSS or<br />
MD/VA should pay proportionate share of CSO cost Alternatives<br />
1726 St NW, Suite Washington <strong>DC</strong><br />
MD/VA should conserve water/have storm water controls to<br />
30 Wentworth Marchant Sierra Club 902<br />
20036 WASA Pub Hearing reduce their peak flows<br />
Alternatives<br />
31 Baron David Earthjustice<br />
1625 Mass. Ave,<br />
NW Suite 702<br />
Washington <strong>DC</strong><br />
20036 Written Comments<br />
Model underpredicts overflows in some cases - is model<br />
accurate If so how will this be taken into account (i.e.<br />
increase storage )<br />
Alternatives<br />
Marchant,<br />
and Robert<br />
1726 St NW, Suite Washington <strong>DC</strong><br />
Myth of avg year: correlate overflows to return frequencies<br />
32 Wentworth Morris Sierra Club 902<br />
20036 Written Comments (most intense, 1-yr, 5-yr, 10 yr etc)<br />
Alternatives<br />
Marchant,<br />
and Robert<br />
1726 St NW, Suite Washington <strong>DC</strong><br />
Piney Branch: Consider trash trap & disinfection , they<br />
33 Wentworth Morris Sierra Club 902<br />
20036 Written Comments question WQ benefits of tunnel, consider intensive LID Alternatives<br />
Philadelphia, PA<br />
Potomac - Will rehabilitation of the Potomac Pump Station Alternatives<br />
34 Hanmer Rebecca EPA Reg 3 1650 Arch Street 19103 Written Comments provide any additional screening of floatables<br />
35 Whitehead Damon<br />
Anacostia<br />
Riverkeeper<br />
1st & Potomac<br />
Avenue, SE<br />
Washington, <strong>DC</strong><br />
20003<br />
<strong>DC</strong> Council Pub<br />
Hearing Rehab existing system Alternatives<br />
36 Sanders Serita<br />
Bloomingdale<br />
Civic Assoc P.O. Box 92691<br />
Washington, <strong>DC</strong><br />
20090 WASA Pub Hearing Rehab existing system Alternatives<br />
37 Chanay Robin D CItizen 503 S St NW<br />
Washington <strong>DC</strong><br />
20001 WASA Pub Hearing Rehab existing system Alternatives<br />
6231 Piney Branch Washington <strong>DC</strong><br />
38 Le Hall Elizabeth Citizen Road, NW 20011 Written Comments Rehab existing system Alternatives<br />
39 Slowenski Kent Citizen NA NA WASA Pub Hearing Rehab existing system Alternatives<br />
40 Fellows<br />
Andrew, and<br />
Paul<br />
Schwartz<br />
Clean <strong>Water</strong><br />
Action<br />
4455 Connecticut<br />
Ave, NW, A-300<br />
Washington, <strong>DC</strong><br />
20008 WASA Pub Hearing Rehab existing system Alternatives<br />
41 Norouzi Parisa<br />
42 New Gregory R.<br />
D.C.<br />
Environmental 1025 Vermont Washington <strong>DC</strong><br />
Network Avenue NW 3rd Flr 20005<br />
<strong>DC</strong> Federation<br />
of Civic<br />
Associations P.O. Box 4549<br />
Washington <strong>DC</strong><br />
20017 Written Comments<br />
<strong>DC</strong> Council Pub<br />
Hearing Rehab existing system Alternatives<br />
Rehab existing system: Is existing CSS in good enough<br />
shape<br />
Alternatives<br />
2 of 23
No. Last Name First name Affiliation Address 1 Address 2 Forum Comment Category<br />
43 Hanmer Rebecca EPA Reg 3 1650 Arch Street<br />
Philadelphia, PA<br />
19103 Written Comments<br />
Rock Creek - Data found in Chapter 3 shows sources of<br />
fecal coliform to Rock Creek to be 42% attributable to CSOs<br />
and 33% to <strong>DC</strong> storm water. Further, Rock Creek is<br />
expected to exceed the Class A standard for fecal coliform<br />
every month of the year (after implementation of CSO<br />
controls) and it is the habitat of an endangered species.<br />
This area appears to be a good candidate for selective<br />
separation or other remediation prior to installation of a<br />
deep tunnel that won’t be implemented for fourteen years.<br />
What other alternatives can be developed to correct SW<br />
and CSS overflows in this area<br />
Alternatives<br />
44 Wentworth<br />
45 Wentworth<br />
Marchant,<br />
and Robert<br />
Morris<br />
Marchant,<br />
and Robert<br />
Morris<br />
Sierra Club<br />
Sierra Club<br />
1726 St NW, Suite<br />
902<br />
1726 St NW, Suite<br />
902<br />
46 Hanmer Rebecca EPA Reg 3 1650 Arch Street<br />
Washington <strong>DC</strong><br />
20036 Written Comments<br />
Washington <strong>DC</strong><br />
20036 Written Comments<br />
Philadelphia, PA<br />
19103 Written Comments<br />
Philadelphia, PA<br />
19103 Written Comments<br />
Rock Creek: Conduct detailed I/I studies in Rock Creek.<br />
Two places for possible sewer leaks are: Ford at Military<br />
Rd, Dam upstream of Boulder Bridge<br />
Rock Creek: Redesign & close selected regulators: look at<br />
closing regulators at entrance to Zoo since it is area of most<br />
likely wading<br />
RTC - An alternative for RTC presupposes use of additional<br />
inflatable dams; however, past experience has shown that<br />
inflatable dams are subject to puncture. What other<br />
alternatives are there that can be implemented for RTC<br />
Satellite Treatment - is eliminated from further<br />
consideration based upon location, staffing and sludge<br />
generation. However further consideration should be given<br />
to satellite treatment of the high volume CSOs (such as<br />
CSO 010,019,022 and 049) where WQ impacts are the<br />
greatest. What would the stream impacts be by providing<br />
satellite treatment at critical locations Satellite treatment<br />
should be evaluated for short term to long term application.<br />
Alternatives<br />
Alternatives<br />
Alternatives<br />
Alternatives<br />
47 Hanmer Rebecca EPA Reg 3 1650 Arch Street<br />
Separation - areas other than luzon valley can and should<br />
48 CItizen Neigh Mtg#4<br />
be separated<br />
Alternatives<br />
Separation - Complete system separation is dismissed from Alternatives<br />
further consideration due to cost, disruption, and increased<br />
loading to the SW system. Alternatives should be<br />
developed and evaluated for separation of discrete areas<br />
where combined flows are high, possibly in combination with<br />
constructing new storm sewers and satellite treatment<br />
systems or satellite storage. Areas tributary to the CSS that<br />
could most readily be separated should be identified. For<br />
each such area, identify the volume of SW flows that could<br />
be eliminated from the CSS during wet weather, where<br />
those flows would be discharged (if they were not to be<br />
discharged to the CSS), and the effect that such discharges<br />
Philadelphia, PA<br />
would have on the receiving water body.<br />
49 Hanmer Rebecca EPA Reg 3 1650 Arch Street 19103 Written Comments<br />
Washington <strong>DC</strong><br />
Separation - cost is too high - EPA cost is $20-$60,000/<br />
50 Chanay Robin D CItizen 503 S St NW 20001 Written Comments acre<br />
Alternatives<br />
121 12th Street, SE Washington, <strong>DC</strong><br />
Separation - look at partial separation in Federal area &<br />
51 Culp David Citizen #403<br />
20003 WASA Pub Hearing make Fed Gov pay for it<br />
Alternatives<br />
52 CItizen Neigh Mtg#3 Separation - look at separation in upper Rock Creek Alternatives<br />
3 of 23
No. Last Name First name Affiliation Address 1 Address 2 Forum Comment Category<br />
53 Tibbetts David, A.<br />
Anacostia<br />
<strong>Water</strong>shed<br />
Society<br />
Treasurer<br />
4302 Baltimore<br />
Ave.<br />
Bladensburg, MD<br />
20710 Written Comments<br />
Separation - look at separation within existing combined<br />
sewers<br />
Alternatives<br />
54<br />
Clean <strong>Water</strong><br />
Campaign<br />
NR<strong>DC</strong> 1200 New<br />
York Ave., NW<br />
Washington <strong>DC</strong><br />
20005 Written Comments<br />
Separation - look at targeted separation at Ivy City/Trinidad<br />
flood areas (to prevent human contact w/sewage) Alternatives<br />
55 Slowenski Kent Citizen NA NA WASA Pub Hearing<br />
Separation - Need to replace infra structure anyway, so why<br />
not just separate<br />
Alternatives<br />
Philadelphia, PA<br />
Separation - Separation cost is included for Potomac & Alternatives<br />
56 Hanmer Rebecca EPA Reg 3 1650 Arch Street 19103 Written Comments Rock Creek, but not Anacostia - correct.<br />
Audubon<br />
Naturalist 8940 Jones Mill Chevy Chase, MD<br />
57 Fitzpatrick Neil Society Road<br />
20815 WASA Pub Hearing Separation - supports targeted separation Alternatives<br />
58<br />
Clean <strong>Water</strong><br />
Campaign<br />
NR<strong>DC</strong> 1200 New<br />
York Ave., NW<br />
Washington <strong>DC</strong><br />
20005 Written Comments<br />
Separation - WASA's separation costs are too high<br />
compared to Atlanta<br />
Alternatives<br />
59 Chanay Robin D CItizen 503 S St NW<br />
Washington <strong>DC</strong><br />
20001<br />
<strong>DC</strong> Council Pub<br />
Hearing Separation is the answer Alternatives<br />
60 Chanay Robin D CItizen 503 S St NW<br />
Washington <strong>DC</strong><br />
20001 WASA Pub Hearing Separation is the answer Alternatives<br />
61 Chanay Robin D CItizen 503 S St NW<br />
Washington <strong>DC</strong><br />
20001 Written Comments Separation is the Answer Alternatives<br />
62 Glover Joseph Citizen<br />
1215 33rd Palce<br />
SE Washington <strong>DC</strong> WASA Pub Hearing Separation is the answer Alternatives<br />
63 Osted Sarah Citizen<br />
4934 Eskridge<br />
Terrace, NW Washington, <strong>DC</strong> WASA Pub Hearing Separation is the answer Alternatives<br />
64 Chanay Robin D CItizen 503 S St NW<br />
Washington <strong>DC</strong><br />
20001 Written Comments<br />
Separation will eliminate flooding, reduce odors, replace old<br />
infrastructure and will allow WQS to be met<br />
Alternatives<br />
65 Hanmer Rebecca EPA Reg 3 1650 Arch Street<br />
Philadelphia, PA<br />
19103 Written Comments<br />
The discussion of solids and floatables on page 12-12<br />
alludes to new CSO regulators. Specifically, which<br />
regulators are to be replaced or modified under the LTCP<br />
What is the process that will be used to evaluate individual<br />
regulator performance<br />
Alternatives<br />
66 Fellows<br />
Andrew, and<br />
Paul<br />
Schwartz<br />
Clean <strong>Water</strong><br />
Action<br />
Audubon<br />
Naturalist<br />
Society<br />
4455 Connecticut<br />
Ave, NW, A-300<br />
Washington, <strong>DC</strong><br />
20008 WASA Pub Hearing<br />
<strong>Water</strong>shed - Need holistic, integrated approach that<br />
involves entire watershed<br />
Alternatives<br />
8940 Jones Mill Chevy Chase, MD<br />
67 Fitzpatrick Neil<br />
Road<br />
20815 WASA Pub Hearing <strong>Water</strong>shed approach - do something about it, don't just talk Alternatives<br />
<strong>Water</strong>shed approach -Work with upstream counties to<br />
68 Sesil Joe Citizen 3421 N St NW Washington <strong>DC</strong> Questionnaire improve their water quality<br />
Alternatives<br />
69 Jones Cy<br />
Washington<br />
Suburban<br />
Sanitary<br />
Commission<br />
Written Comments<br />
If the full process train is to be used, does <strong>DC</strong>WASA<br />
possess sufficient unused treatment capacity within its IMA<br />
allocation to handle the additional flow If not, how does the<br />
District intend to acquire the necessary additional capacity Blue Plains<br />
4 of 23
No. Last Name First name Affiliation Address 1 Address 2 Forum Comment Category<br />
70 Hanmer Rebecca EPA Reg 3 1650 Arch Street<br />
Philadelphia, PA<br />
19103 Written Comments<br />
Outfall 001 at BPWWTP has been characterized as a CSO<br />
under the existing NPDES permit, however, under the CSO<br />
policy it may be characterized as a bypass. Under the CSO<br />
Policy, approval of a CSO bypass requires that the LTCP, at<br />
a minimum, should provide justification for the cut-off point<br />
at which the flow will be diverted from the secondary<br />
treatment portion of the treatment plant and provide a costbenefit<br />
analysis demonstrating that conveyance of wet<br />
weather flow to the POTW for primary treatment is more<br />
beneficial than other CSO abatement alternatives such as<br />
storage and pump back for secondary treatment, sewer<br />
separation, or satellite treatment. The LTCP should include<br />
a section to include this demonstration.<br />
Blue Plains<br />
71 Hanmer Rebecca EPA Reg 3 1650 Arch Street<br />
Philadelphia, PA<br />
19103 Written Comments<br />
What is the predicted frequency and duration that<br />
denitrification will not be achieved due to high flow<br />
conditions With additional flows that will be sent to Blue<br />
Plains, what measures can be taken to optimize treatment<br />
at Blue Plains and assure maximum denitrification<br />
Blue Plains<br />
72 Jones Cy<br />
Washington<br />
Suburban<br />
Sanitary<br />
Commission<br />
Written Comments<br />
What modifications to Blue Plains, if any, would be<br />
required Would they be considered as joint-use or nonjoint<br />
use projects<br />
Blue Plains<br />
73 Jones Cy<br />
Washington<br />
Suburban<br />
Sanitary<br />
Commission Written Comments What would be the cost for the required modifications Blue Plains<br />
74 Jones Cy<br />
75 Jones Cy<br />
76 Jones Cy<br />
77 Jones Cy<br />
78 Cole Cynthia<br />
Washington<br />
Suburban<br />
Sanitary<br />
Commission<br />
Washington<br />
Suburban<br />
Sanitary<br />
Commission<br />
Washington<br />
Suburban<br />
Sanitary<br />
Commission<br />
Washington<br />
Suburban<br />
Sanitary<br />
Commission<br />
Potomac Boat<br />
Club<br />
79 Wentworth Marchant Sierra Club<br />
3530 <strong>Water</strong> Street<br />
NW<br />
1726 St NW, Suite<br />
902<br />
80 Hanmer Rebecca EPA Reg 3 1650 Arch Street<br />
Written Comments<br />
Written Comments<br />
Written Comments<br />
Written Comments<br />
Washington <strong>DC</strong><br />
20002 Written Comments<br />
Washington <strong>DC</strong> <strong>DC</strong> Council Pub<br />
20036<br />
Hearing<br />
Philadelphia, PA<br />
19103 Written Comments<br />
Whichever train is used, what would be the operational<br />
impacts of the additional flow and the plants ability to meet<br />
its permit limits<br />
Will the flow be treated by the full process train or the<br />
excess flow facility<br />
Would there be any increase in Blue Plains operational<br />
costs Would an increase be considered a <strong>DC</strong>WASA-only<br />
expense<br />
WSSC leases 95 mgd in Anacostia <strong>System</strong>. Can lease<br />
continue or does WASA need it back. Can WSSC acquire<br />
soem additional capacity in Anacostia <strong>System</strong><br />
Existing CSOs are located next to highly used areas of<br />
River<br />
Take extra effort to controls CSOs at Thompson Boathouse<br />
& Anacostia Marinas (pub contact)<br />
Will the recommended <strong>Plan</strong> eliminate (or consolidate)<br />
combined sewer outfalls to the point where they can be<br />
permanently sealed or the structures dismantled and<br />
removed from the receiving waterbody<br />
Blue Plains<br />
Blue Plains<br />
Blue Plains<br />
Blue Plains<br />
CSO Location<br />
CSO Location<br />
CSO Location<br />
5 of 23
No. Last Name First name Affiliation Address 1 Address 2 Forum Comment Category<br />
81 Caposi John Citizen 1619 G St SE Washington <strong>DC</strong> WASA Pub Hearing<br />
Nonprofits should pay somehow (e.g. World bank, Fannie<br />
Mae)<br />
Financial<br />
Impacts<br />
Patrick-<br />
813 West Va. Ave, Washington <strong>DC</strong><br />
Financial<br />
82 Jones Peggy Citizen NE<br />
20003 Written Comments Don't raise rates<br />
Impacts<br />
83 Wethered<br />
Suzanne &<br />
J.V. Anil<br />
Kumar Citizen<br />
3726 Kanawha St,<br />
NW<br />
Washington <strong>DC</strong><br />
20015 Written Comments Don't raise rates<br />
Financial<br />
Impacts<br />
84 CItizen Neigh Mtg#7 Don't raise rates<br />
Financial<br />
Impacts<br />
85 New Gregory R.<br />
<strong>DC</strong> Federation<br />
of Civic<br />
Associations P.O. Box 4549<br />
Washington <strong>DC</strong><br />
20017 Written Comments Don't raise rates<br />
Financial<br />
Impacts<br />
86 Stiehler Robert D. Citizen<br />
3234 Quesada St<br />
NW<br />
87 Hanmer Rebecca EPA Reg 3 1650 Arch Street<br />
Washington <strong>DC</strong><br />
20015 Questionnaire<br />
Philadelphia, PA<br />
19103 Written Comments<br />
Fed Gov - Costs need to be reduced unless federal Financial<br />
government pays 80% of costs<br />
Impacts<br />
Fed Gov - Describe the method used to establish billings to Financial<br />
the Federal government (and potentially to other major flow Impacts<br />
contributors). Does the current system properly and fully<br />
allocate O&M and capital needs for sanitary flow (in<br />
separated areas) and both sanitary and storm flow (in<br />
combined areas) What changes need to be made, by<br />
whom, and when What should be the impact of such<br />
changes on the affordability of the proposed project to<br />
District residents Can such changes make the project<br />
affordable to District residents without special<br />
appropriations<br />
Financial<br />
Impacts<br />
88 CItizen Neigh Mtg#8 Fed Gov - If ACOE/Fed built it, they should pay to fix it<br />
<strong>DC</strong> Federation<br />
of Civic<br />
Washington <strong>DC</strong><br />
89 New Gregory R. Associations P.O. Box 4549 20017 Written Comments Federal Government should pay 80%<br />
90 Baron David Earthjustice<br />
Larry and Anacostia<br />
Robert <strong>Water</strong>shed<br />
91 Silverman Boone Society<br />
1625 Mass. Ave,<br />
NW Suite 702<br />
4302 Baltimore<br />
Ave.<br />
Washington <strong>DC</strong><br />
20036<br />
<strong>DC</strong> Council Pub<br />
Hearing<br />
MD & VA cause CSOs, so they should pay<br />
Bladensburg, MD<br />
20710 WASA Pub Hearing MD & VA should pay<br />
92 CItizen Neigh Mtg#4 MD and VA should pay<br />
Clean <strong>Water</strong> NR<strong>DC</strong> 1200 New Washington <strong>DC</strong><br />
93<br />
Campaign York Ave., NW 20005 Written Comments MD, VA & Fed gov should pay<br />
Not<br />
MD/VA - Obtain commitments from MD, VA & Federal<br />
94 Provided Not Provided Citizen Not Provided Not Provided Questionnaire Government to pay<br />
95 CItizen Neigh Mtg#11 MD/VA - suburbs should pay<br />
96 Caposi John Citizen 1619 G St SE Washington <strong>DC</strong> WASA Pub Hearing MD/VA consider commuter tax<br />
Clean <strong>Water</strong> NR<strong>DC</strong> 1200 New Washington <strong>DC</strong><br />
97<br />
Campaign York Ave., NW 20005 Written Comments MD/VA should pay<br />
Bloomingdale<br />
Washington, <strong>DC</strong><br />
98 Sanders Serita Civic Assoc P.O. Box 92691 20090 WASA Pub Hearing Overlap between LTCP and CIP<br />
Clean <strong>Water</strong> NR<strong>DC</strong> 1200 New Washington <strong>DC</strong><br />
Overlap between LTCP and CIP - WASA double counted<br />
99<br />
Campaign York Ave., NW 20005 Written Comments P.S. costs & overstated rate impacts<br />
1809 Monroe St, Washington <strong>DC</strong><br />
Put CSO costs in perspective by comparing them to school,<br />
100 Forsberg Ken Citizen NW<br />
20010 Questionnaire road or other <strong>DC</strong> budgets<br />
Financial<br />
Impacts<br />
Financial<br />
Impacts<br />
Financial<br />
Impacts<br />
Financial<br />
Impacts<br />
Financial<br />
Impacts<br />
Financial<br />
Impacts<br />
Financial<br />
Impacts<br />
Financial<br />
Impacts<br />
Financial<br />
Impacts<br />
Financial<br />
Impacts<br />
Financial<br />
Impacts<br />
Financial<br />
Impacts<br />
6 of 23
No. Last Name First name Affiliation Address 1 Address 2 Forum Comment Category<br />
Not<br />
Rate Structure - Consider cost based on impervious land Financial<br />
101 Provided Not Provided Citizen Not Provided Not Provided Questionnaire and not water volume<br />
Impacts<br />
Rate structure - consider giving senior citizens discounts in Financial<br />
102 CItizen Neigh Mtg#3<br />
rates<br />
Impacts<br />
103 Silverman<br />
104 Fellows<br />
105 Wentworth<br />
Larry and<br />
Robert<br />
Boone<br />
Andrew, and<br />
Paul<br />
Schwartz<br />
Marchant,<br />
and Robert<br />
Morris<br />
Anacostia<br />
<strong>Water</strong>shed<br />
Society<br />
Clean <strong>Water</strong><br />
Action<br />
Sierra Club<br />
4302 Baltimore<br />
Ave.<br />
4455 Connecticut<br />
Ave, NW, A-300<br />
1726 St NW, Suite<br />
902<br />
Bladensburg, MD<br />
20710 WASA Pub Hearing Rate structure - consider impervious area<br />
Washington, <strong>DC</strong><br />
20008 WASA Pub Hearing<br />
Washington <strong>DC</strong><br />
20036 Written Comments<br />
106 CItizen Neigh Mtg#6<br />
1726 St NW, Suite Washington <strong>DC</strong> <strong>DC</strong> Council Pub<br />
107 Wentworth Marchant Sierra Club 902<br />
20036<br />
Hearing<br />
Clean <strong>Water</strong> 4455 Connecticut Washington, <strong>DC</strong> <strong>DC</strong> Council Pub<br />
108 Schwartz Paul Action Ave, NW, A-300 20008<br />
Hearing<br />
Larry and Anacostia<br />
Robert <strong>Water</strong>shed 4302 Baltimore Bladensburg, MD<br />
109 Silverman Boone Society Ave.<br />
110 Sanders Serita<br />
Bloomingdale<br />
Civic Assoc P.O. Box 92691<br />
Rate structure - implement a lifeline rate for low income<br />
households<br />
20710 WASA Pub Hearing Secure Federal assistance<br />
Washington, <strong>DC</strong><br />
20090 WASA Pub Hearing Secure Federal assistance<br />
111 Arner Robert L. Citizen 7209 Exfair Road Bethesda MD 20815 Written Comments Secure Federal assistance<br />
112 Caposi John Citizen 1619 G St SE Washington <strong>DC</strong> WASA Pub Hearing Secure Federal assistance<br />
1215 33rd Palce<br />
<strong>DC</strong> Council Pub<br />
113 Glover Joseph Citizen SE<br />
Washington <strong>DC</strong> Hearing<br />
Secure Federal assistance<br />
1215 33rd Palce<br />
114 Glover Joseph Citizen SE Washington <strong>DC</strong> WASA Pub Hearing Secure Federal assistance<br />
Patrick-<br />
813 West Va. Ave, Washington <strong>DC</strong><br />
115 Jones Peggy Citizen NE<br />
20003 Written Comments Secure Federal assistance<br />
<strong>DC</strong> Council Pub<br />
116 Pittman Robert Citizen<br />
Hearing<br />
Secure Federal assistance<br />
1727 P St NW, Apt Washington <strong>DC</strong><br />
117 Reusga Albert Citizen D<br />
20036 Written Comments Secure Federal assistance<br />
Suzanne &<br />
J.V. Anil<br />
3726 Kanawha St, Washington <strong>DC</strong><br />
118 Wethered Kumar Citizen NW<br />
20015 Written Comments Secure Federal assistance<br />
Clean <strong>Water</strong> NR<strong>DC</strong> 1200 New Washington <strong>DC</strong><br />
119<br />
Campaign York Ave., NW 20005 Written Comments Secure Federal assistance<br />
Friends of the 1025 Vermont Washington, <strong>DC</strong><br />
120 Blackwelder Brent Earth Avenue, NW 20005 WASA Pub Hearing Secure Federal assistance<br />
121 Wentworth Marchant Sierra Club<br />
Marchant,<br />
and Robert<br />
122 Wentworth Morris Sierra Club<br />
123 Wrin Bob Citizen<br />
1727 St NW, Suite<br />
902<br />
Washington <strong>DC</strong><br />
20037 WASA Pub Hearing Secure Federal assistance<br />
Financial<br />
Impacts<br />
Financial<br />
Impacts<br />
Rate structure - look at alternate funding options such as taxFinancial<br />
on impervious surfaces<br />
Impacts<br />
Rate structure - look at alternate rate structure taking into Financial<br />
account impervious area<br />
Impacts<br />
Financial<br />
Rate structure - Protect lower income households Impacts<br />
Rate structure-need lifeline rate for low income customers Financial<br />
like Philadelphia<br />
Impacts<br />
1727 St NW, Suite Washington <strong>DC</strong><br />
902<br />
20037 Written Comments Secure Federal assistance<br />
5509 Chevy Chase<br />
Seek Federal assistance at 75%-80% level - this is an<br />
Pkwy, NW Washington <strong>DC</strong> Questionnaire unfunded mandate<br />
Financial<br />
Impacts<br />
Financial<br />
Impacts<br />
Financial<br />
Impacts<br />
Financial<br />
Impacts<br />
Financial<br />
Impacts<br />
Financial<br />
Impacts<br />
Financial<br />
Impacts<br />
Financial<br />
Impacts<br />
Financial<br />
Impacts<br />
Financial<br />
Impacts<br />
Financial<br />
Impacts<br />
Financial<br />
Impacts<br />
Financial<br />
Impacts<br />
Financial<br />
Impacts<br />
Financial<br />
Impacts<br />
7 of 23
No. Last Name First name Affiliation Address 1 Address 2 Forum Comment Category<br />
Philadelphia, PA<br />
Table ES-4 analysis does not indicate when higher<br />
residential customer rates would be seen. What is the<br />
projected phase-in of the rate increase for customer rates Financial<br />
124 Hanmer Rebecca EPA Reg 3 1650 Arch Street 19103 Written Comments<br />
Impacts<br />
Philadelphia, PA<br />
19103 Written Comments<br />
The report suggest that the District has an disproportionate Financial<br />
number of low income households, presumably relative to Impacts<br />
other large urban centers. It does not however provide<br />
census or other information to support the statement. Such<br />
data, if included in the report, would strengthen the<br />
argument for outside assistance.<br />
125 Hanmer Rebecca EPA Reg 3 1650 Arch Street<br />
WASA needs a fall-back position if Federal funding does Financial<br />
126 CItizen Neigh Mtg#5<br />
not come through<br />
Impacts<br />
Clean <strong>Water</strong> NR<strong>DC</strong> 1200 New Washington <strong>DC</strong><br />
WASA overstates costs in early years by financing all bonds Financial<br />
127<br />
Campaign York Ave., NW 20005 Written Comments now<br />
Impacts<br />
Concern about flooding basement apartments and that the<br />
128 CItizen Neigh Mtg#6<br />
plan does not address these<br />
Flooding<br />
Concern that plan will not benefit flooding especially at 31st<br />
129 CItizen Neigh Mtg#8<br />
& K St in Georgetown<br />
Flooding<br />
Describe in greater detail how, and on what schedule, the Flooding<br />
Philadelphia, PA<br />
recommended plan will alleviate flooding experienced in the<br />
130 Hanmer Rebecca EPA Reg 3 1650 Arch Street 19103 Written Comments NE boundary.<br />
Flooding at West Virginia & Mt. Olivette is a problem, when<br />
131 CItizen Neigh Mtg#1<br />
will it be fixed<br />
Flooding<br />
Anacostia 1st & Potomac Washington, <strong>DC</strong><br />
132 Whitehead Damon Riverkeeper Avenue, SE 20003 WASA Pub Hearing Flooding complaint Flooding<br />
Bloomingdale<br />
Washington, <strong>DC</strong><br />
133 Sanders Serita Civic Assoc P.O. Box 92692 20091 <strong>DC</strong> Council Hearing Flooding complaint Flooding<br />
Bloomingdale<br />
Washington, <strong>DC</strong><br />
134 Sanders Serita Civic Assoc P.O. Box 92691 20090 WASA Pub Hearing Flooding complaint Flooding<br />
Washington <strong>DC</strong><br />
135 Chanay Robin D CItizen 503 S St NW 20001 WASA Pub Hearing Flooding complaint Flooding<br />
Washington <strong>DC</strong><br />
136 Mack Geterrius Citizen 1430 L St SE, #509 20003 Written Comments Flooding complaint Flooding<br />
137 CItizen Neigh Mtg#6 Flooding complaint Flooding<br />
Clean <strong>Water</strong> NR<strong>DC</strong> 1200 New Washington <strong>DC</strong><br />
138<br />
Campaign York Ave., NW 20005 Written Comments Flooding complaint Flooding<br />
Pallisades<br />
Citizens<br />
139 Strain Sally Assoc. Written Comments Flooding complaint Flooding<br />
6231 Piney Branch Washington <strong>DC</strong><br />
140 Le Hall Elizabeth Citizen Road, NW 20011 Written Comments Flooding in basement caused by roots in sewer lateral Flooding<br />
141<br />
Clean <strong>Water</strong><br />
Campaign<br />
NR<strong>DC</strong> 1200 New<br />
York Ave., NW<br />
Washington <strong>DC</strong><br />
20005 Written Comments<br />
LTCP does not explain how flooding will be alleviated in<br />
NEB, does not address flooding in other areas<br />
Flooding<br />
142 Whitehead Damon<br />
Anacostia<br />
Riverkeeper<br />
1st & Potomac<br />
Avenue, SE<br />
Washington, <strong>DC</strong><br />
20003 WASA Pub Hearing LTCP does not protect City form flooding everywhere Flooding<br />
Clean <strong>Water</strong> NR<strong>DC</strong> 1200 New Washington <strong>DC</strong><br />
143<br />
Campaign York Ave., NW 20005 Written Comments LTCP does not say if plan will fix the August 11, 2001 Flood Flooding<br />
Bloomingdale<br />
Washington, <strong>DC</strong><br />
National Airport gages did not read alot of rain- WASA said<br />
144 Sanders Serita Civic Assoc P.O. Box 92691 20090 WASA Pub Hearing it rained a lot on Aug 11<br />
Flooding<br />
145 Sanders Serita<br />
Bloomingdale<br />
Civic Assoc P.O. Box 92691<br />
Washington, <strong>DC</strong><br />
20090 WASA Pub Hearing <strong>Plan</strong> should address lessons learned Aug 11 Flooding<br />
8 of 23
No. Last Name First name Affiliation Address 1 Address 2 Forum Comment Category<br />
The recommended plan shows a new “relief outfall” into the Flooding<br />
Anacostia near the current NE Boundary swirl facility and<br />
outfall 019. It is stated that this is necessary for flooding<br />
protection. 1) What is the predicted frequency and duration<br />
of overflows for this outfall 2) Is it included in Table 9-3<br />
3) Are the flows part of the receiving stream model for the<br />
Anacostia 4) What are the impacts to water quality from<br />
the discharge 5) What controls will be placed on the new<br />
Philadelphia, PA<br />
outfall 6) How is the new outfall to be permitted<br />
146 Hanmer Rebecca EPA Reg 3 1650 Arch Street 19103 Written Comments<br />
Clean <strong>Water</strong> NR<strong>DC</strong> 1200 New Washington <strong>DC</strong><br />
147<br />
Campaign York Ave., NW 20005 Written Comments WASA must address immediate flooding problems Flooding<br />
148 Sanders Serita<br />
Bloomingdale<br />
Civic Assoc P.O. Box 92691<br />
Washington, <strong>DC</strong><br />
20090 <strong>DC</strong> Council Hearing WASA was not responsive during flooding Flooding<br />
149 Sanders Serita<br />
Bloomingdale<br />
Civic Assoc P.O. Box 92691<br />
Washington, <strong>DC</strong><br />
20090 <strong>DC</strong> Council Hearing What are short term fixes for flooding (Can't wait 20 yrs) Flooding<br />
To what degree has the “implementability” of the<br />
Implementability<br />
150 Hanmer Rebecca EPA Reg 3 1650 Arch Street<br />
Philadelphia, PA<br />
19103 Written Comments<br />
recommended control plan been evaluated What permits<br />
or approvals are contemplated to be necessary from the<br />
National Park Service in order to implement the plan Have<br />
discussions been undertaken with NPS or LTCP comments<br />
received from them<br />
Will it be necessary to obtain easements from owners of Implementability<br />
151 Hanmer Rebecca EPA Reg 3 1650 Arch Street<br />
Philadelphia, PA<br />
19103 Written Comments<br />
property above the tunnels If yes, who are the major<br />
property owners. What efforts have to be made to reach<br />
any needed agreements<br />
152 CItizen Neigh Mtg#2 Higher level of control - do not agree with cost/benefit Level of <strong>Control</strong><br />
153 Eisenhardt Julie<br />
154 Collier James R<br />
Sierra Club -<br />
Env. Justice<br />
Program<br />
<strong>DC</strong> Dept of<br />
Health<br />
Sierra Club -<br />
Env. Justice<br />
Program<br />
2568 Martin Luther Washington <strong>DC</strong><br />
King Jr. Ave, SE 20020 Written Comments<br />
51 N St NE Suite Washington <strong>DC</strong><br />
5010<br />
20002 Written Comments<br />
LTCP fails to reverse the old system of environmental<br />
injustice that has placed a disproportionate burden on the<br />
predominantly African-American communities on the East<br />
Side of <strong>DC</strong>. All <strong>DC</strong> waterways should achieve<br />
fishable/swimmable std<br />
Anacostia & RC: 1 OF in wet year only; Potomac 12<br />
OF/year is OK<br />
Level of <strong>Control</strong><br />
Level of <strong>Control</strong><br />
2568 Martin Luther Washington <strong>DC</strong><br />
155 Eisenhardt Julie<br />
King Jr. Ave, SE 20020 Written Comments Anacostia : should be as clean as Potomac Level of <strong>Control</strong><br />
Marchant,<br />
Anacostia: Endorse tunnels as laid out, <strong>Control</strong> to 25 year<br />
and Robert<br />
1726 St NW, Suite Washington <strong>DC</strong><br />
storm, upgrade P.S., expand LID, water conservation in<br />
156 Wentworth Morris Sierra Club 902<br />
20036 Written Comments NEB<br />
Level of <strong>Control</strong><br />
Anacostia<br />
<strong>Water</strong>shed 4302 Baltimore Bladensburg, MD <strong>DC</strong> Council Pub<br />
157 Connelly Jim Society Ave.<br />
20710<br />
Hearing<br />
Anacostia: Goal should be 0 overflows per year in AnacostiaLevel of <strong>Control</strong><br />
1726 St NW, Suite Washington <strong>DC</strong> <strong>DC</strong> Council Pub<br />
158 Wentworth Marchant Sierra Club 902<br />
20036<br />
Hearing Anacostia: Higher degree of control is recommended Level of <strong>Control</strong><br />
159 Caposi John Citizen 1619 G St SE Washington <strong>DC</strong> WASA Pub Hearing Anacostia: make Anacostia equal Potomac Level of <strong>Control</strong><br />
828 Mountain<br />
160 Harris Mitch Citizen Stream Lane Lakemont GA 30552 Written Comments Call for less pollution in general Level of <strong>Control</strong><br />
161 New Gregory R.<br />
<strong>DC</strong> Federation<br />
of Civic<br />
Associations P.O. Box 4549<br />
2113 N St NW<br />
162 Dwyer Stuart Citizen #201<br />
Washington <strong>DC</strong><br />
20017 Written Comments Come up with a plan that eliminates overflows Level of <strong>Control</strong><br />
Washington <strong>DC</strong><br />
20037 Questionnaire Consider downstream beneficiaries in cost/benefit analysis Level of <strong>Control</strong><br />
9 of 23
No. Last Name First name Affiliation Address 1 Address 2 Forum Comment Category<br />
2113 N St NW Washington <strong>DC</strong><br />
163 Dwyer Stuart Citizen #201<br />
20037 Questionnaire Err on the side of more control Level of <strong>Control</strong><br />
164 Whitehead Damon<br />
Anacostia<br />
Riverkeeper<br />
1st & Potomac<br />
Avenue, SE<br />
Washington, <strong>DC</strong><br />
20003<br />
<strong>DC</strong> Council Pub<br />
Hearing Higher level of control Level of <strong>Control</strong><br />
165 Whitehead Damon<br />
Anacostia<br />
Riverkeeper<br />
1st & Potomac<br />
Avenue, SE<br />
Washington, <strong>DC</strong><br />
20003 WASA Pub Hearing Higher level of control Level of <strong>Control</strong><br />
166 Connelly Jim<br />
Anacostia<br />
<strong>Water</strong>shed<br />
Society<br />
4302 Baltimore<br />
Ave.<br />
Bladensburg, MD<br />
20710<br />
<strong>DC</strong> Council Pub<br />
Hearing Higher level of control Level of <strong>Control</strong><br />
167 Siglin Douglas<br />
Chesapeake<br />
Bay<br />
Foundation<br />
717 E Street, NE<br />
Washington, <strong>DC</strong><br />
20002 WASA Pub Hearing Higher level of control Level of <strong>Control</strong><br />
168 Armsby Michelle Citizen #61 PO Box 18901 Rochester NY 14619 Written Comments Higher level of control Level of <strong>Control</strong><br />
169 Arner Robert L. Citizen 7209 Exfair Road Bethesda MD 20815 Written Comments Higher level of control Level of <strong>Control</strong><br />
170 Bouri S Citizen Written Comments Higher level of control Level of <strong>Control</strong><br />
171 Caposi John Citizen 1619 G St SE Washington <strong>DC</strong> WASA Pub Hearing Higher level of control Level of <strong>Control</strong><br />
121 12th Street, SE Washington, <strong>DC</strong><br />
172 Culp David CItizen #403<br />
20003 Neigh Mtg#3 Higher level of control Level of <strong>Control</strong><br />
121 12th Street, SE Washington, <strong>DC</strong><br />
173 Culp David Citizen #403<br />
20003 WASA Pub Hearing Higher level of control Level of <strong>Control</strong><br />
174 Forsberg Ken Citizen<br />
1809 Monroe St,<br />
NW<br />
Washington <strong>DC</strong><br />
20010 Questionnaire Higher level of control Level of <strong>Control</strong><br />
175 Hamilton Dawn, M. Citizen 126 16th St SE Washington <strong>DC</strong> Written Comments Higher level of control Level of <strong>Control</strong><br />
176 Ho Colisa Citizen<br />
7548 Clenmoor<br />
Lane<br />
Winter Park, FL<br />
32792 Written Comments Higher level of control Level of <strong>Control</strong><br />
640-B Croissant PL Washington <strong>DC</strong><br />
177 Hurtt Harold A Citizen SE<br />
20019 Questionnaire Higher level of control Level of <strong>Control</strong><br />
1444 Rhode Island Washington <strong>DC</strong><br />
178 Lindley George Citizen Ave, NW, # 615 20007 Written Comments Higher level of control Level of <strong>Control</strong><br />
179 Mayock Melanie Citizen<br />
501 Constitution<br />
Ave NE<br />
Washington <strong>DC</strong><br />
20003 Written Comments Higher level of control Level of <strong>Control</strong><br />
180 McCuran Elizabeth Citizen 216 K St, NE<br />
Washington <strong>DC</strong><br />
20003 Written Comments Higher level of control Level of <strong>Control</strong><br />
2321 Wisconsin Washington <strong>DC</strong><br />
181 Mirsky Jonathan, B. Citizen Ave, NW #208 20008 Written Comments Higher level of control Level of <strong>Control</strong><br />
3723 Winfield Lane Washington <strong>DC</strong><br />
182 Mitchell Jeanene Citizen NW<br />
20007 Questionnaire Higher level of control Level of <strong>Control</strong><br />
183 Nagi Suzanne Citizen<br />
4035 Highland Ct<br />
NW<br />
Washington <strong>DC</strong><br />
20008 Written Comments Higher level of control Level of <strong>Control</strong><br />
184 Niswander Ruth Citizen 623 Barbera Davis CA 95617 Written Comments Higher level of control Level of <strong>Control</strong><br />
Not<br />
185 Provided Not Provided Citizen Not Provided Not Provided Questionnaire Higher level of control Level of <strong>Control</strong><br />
4540 MacArthur Washington <strong>DC</strong><br />
186 Robertson Sean Citizen Blvd, NW Apt #81 20007 Written Comments Higher level of control Level of <strong>Control</strong><br />
187 Roepnack Beth Rene Citizen<br />
213 Lansdowne<br />
Ave Decatur, GA 30031 Written Comments Higher level of control Level of <strong>Control</strong><br />
188 Saidman Amy Citizen 1871 Engleside<br />
Washington <strong>DC</strong><br />
20010 Written Comments Higher level of control Level of <strong>Control</strong><br />
189 Tyler Joseph Citizen<br />
Georgetown<br />
University, Box<br />
573145<br />
Washington <strong>DC</strong><br />
20057 Written Comments Higher level of control Level of <strong>Control</strong><br />
190 Vogel Mary Citizen 3105 Crest Ave Cheverly Md 20785 Questionnaire Higher level of control Level of <strong>Control</strong><br />
10 of 23
No. Last Name First name Affiliation Address 1 Address 2 Forum Comment Category<br />
3730 Windom Washington <strong>DC</strong><br />
191 Wells Jeffrey R. Citizen Place, NW 20006 Written Comments Higher level of control Level of <strong>Control</strong><br />
192 CItizen Neigh Mtg#5 Higher level of control Level of <strong>Control</strong><br />
193<br />
Clean <strong>Water</strong><br />
Campaign<br />
NR<strong>DC</strong> 1200 New<br />
York Ave., NW<br />
Washington <strong>DC</strong><br />
20005 Written Comments Higher level of control Level of <strong>Control</strong><br />
D.C.<br />
Environmental 1025 Vermont Washington <strong>DC</strong> <strong>DC</strong> Council Pub<br />
194 Norouzi Parisa Network Avenue NW 3rd Flr 20005<br />
Hearing Higher level of control Level of <strong>Control</strong><br />
195 Baron David Earthjustice<br />
1625 Mass. Ave,<br />
NW Suite 702<br />
Washington <strong>DC</strong><br />
20036<br />
<strong>DC</strong> Council Pub<br />
Hearing Higher level of control Level of <strong>Control</strong><br />
1726 St NW, Suite Washington <strong>DC</strong><br />
902<br />
20036 WASA Pub Hearing Higher level of control Level of <strong>Control</strong><br />
196 Wentworth Marchant Sierra Club<br />
Sierra Club -<br />
Env. Justice<br />
197 Eisenhardt Julie Program<br />
2568 Martin Luther<br />
King Jr. Ave, SE<br />
Washington <strong>DC</strong><br />
20020 Written Comments Higher level of control Level of <strong>Control</strong><br />
Southeast Asia<br />
198 Niedzwieki W.R. "Max"<br />
Resource<br />
Action Center 1628 16th St NW<br />
Washington <strong>DC</strong><br />
20009 Written Comments Higher level of control Level of <strong>Control</strong><br />
199 Moore<br />
K. Ruth<br />
Anderson Citizen 4333 Yuma St NW<br />
Washington <strong>DC</strong><br />
20016 Written Comments Make things as clean as possible Level of <strong>Control</strong><br />
Marchant,<br />
and Robert<br />
1726 St NW, Suite Washington <strong>DC</strong><br />
Potomac - size Potomac Tunnels for the wettest year in 3-<br />
200 Wentworth Morris Sierra Club 902<br />
20036 Written Comments year period<br />
Level of <strong>Control</strong><br />
Potomac Boat 3530 <strong>Water</strong> Street Washington <strong>DC</strong><br />
Potomac level of control is too low compared to Anacostia &<br />
201 Cole Cynthia Club NW<br />
20002 Written Comments Rock Creek<br />
Level of <strong>Control</strong><br />
202 Webber Elizabeth A. Citizen<br />
2320 Wisconsin<br />
Ave., NW, #201<br />
Washington <strong>DC</strong><br />
20007 Written Comments<br />
Potomac River is a recreational Resource and is used by<br />
many and its use is expanding,<br />
Level of <strong>Control</strong><br />
Potomac Boat 3530 <strong>Water</strong> Street Washington <strong>DC</strong><br />
Potomac: Myth #1: Potomac is used only occassionally - it is<br />
203 Cole Cynthia Club NW<br />
20002 Written Comments highly used and its use is growing, examples cited Level of <strong>Control</strong><br />
Potomac Boat 3530 <strong>Water</strong> Street Washington <strong>DC</strong><br />
204 Cole Cynthia Club NW<br />
20002 Written Comments<br />
Potomac Boat 3530 <strong>Water</strong> Street Washington <strong>DC</strong><br />
205 Cole Cynthia Club NW<br />
20002 Written Comments<br />
1727 P St NW, Apt Washington <strong>DC</strong><br />
206 Reusga Albert Citizen D<br />
20036 Written Comments<br />
Potomac: Myth #2:Existing uses do not entail direct contact<br />
between humans & water (describes spashing & risk of craft<br />
upset, Dogs exercise in River & pet owners touch dogs) Level of <strong>Control</strong><br />
Potomac: plan will have adverse impact on Potomac<br />
members<br />
Level of <strong>Control</strong><br />
Prefer to pay more, have a longer schedule and fix the<br />
problem entirely,<br />
Level of <strong>Control</strong><br />
207 Niedzwieki W.R. "Max"<br />
Southeast Asia<br />
Resource<br />
Action Center 1628 16th St NW<br />
208 Amacker Hilda Citizen 1610 3rd St NW<br />
1444 Rhode Island<br />
209 Lindley George Citizen Ave, NW, # 615<br />
4540 MacArthur<br />
210 Robertson Sean Citizen Blvd, NW Apt #81<br />
1625 Mass. Ave,<br />
211 Baron David Earthjustice NW Suite 702<br />
Georgetown<br />
University, Box<br />
212 Tyler Joseph Citizen 573145<br />
Washington <strong>DC</strong><br />
20009 Written Comments<br />
Prefer to pay more, have alonger schedule and fix the<br />
problem entirely<br />
Level of <strong>Control</strong><br />
Washington <strong>DC</strong><br />
Recommendation - Advocates a permanent fix, no<br />
20001 Written Comments overflows<br />
Level of <strong>Control</strong><br />
Washington <strong>DC</strong><br />
20005 Written Comments Recommendation - Allow no overflows Level of <strong>Control</strong><br />
Washington <strong>DC</strong><br />
Recommendation - Fix the problem completely, I am willing<br />
20007 Written Comments to pay more<br />
Level of <strong>Control</strong><br />
Washington <strong>DC</strong> <strong>DC</strong> Council Pub<br />
20036<br />
Hearing Recommendation - get closer to 0 overflows Level of <strong>Control</strong><br />
Washington <strong>DC</strong><br />
20057 Written Comments<br />
Recommendation - Highest degree of control possible<br />
without separation<br />
Level of <strong>Control</strong><br />
11 of 23
No. Last Name First name Affiliation Address 1 Address 2 Forum Comment Category<br />
1726 St NW, Suite Washington <strong>DC</strong><br />
Recommendation - Support tunnels, but size for 0 overflows<br />
213 Wentworth Marchant Sierra Club 902<br />
20036 WASA Pub Hearing in wettest yr<br />
Level of <strong>Control</strong><br />
214 CItizen Neigh Mtg#4<br />
Recommendation: Objection to continued CSO discharges<br />
under any conditions<br />
Level of <strong>Control</strong><br />
215 CItizen Neigh Mtg#4 Recommendation: zero discharges per average year Level of <strong>Control</strong><br />
216 Siglin Douglas<br />
Chesapeake<br />
Bay<br />
Foundation 717 E Street, NE<br />
Washington, <strong>DC</strong><br />
20002 WASA Pub Hearing Support Collier's plan Level of <strong>Control</strong><br />
217 Dwyer Stuart Citizen<br />
2113 N St NW<br />
#201<br />
Washington <strong>DC</strong><br />
20037 Questionnaire Support LTCP as written Level of <strong>Control</strong><br />
218 Gallucci Jerry Citizen Westover PL, NW<br />
Washington <strong>DC</strong><br />
20016 Written Comments Support LTCP as written Level of <strong>Control</strong><br />
219 Hackney<br />
Lynn, &<br />
Kimberly<br />
Hoover Citizen<br />
1761 Church St<br />
NW<br />
Washington <strong>DC</strong><br />
20036 Written Comments Support LTCP as written Level of <strong>Control</strong><br />
Not<br />
220 Provided Not Provided Citizen Mt Pleasant Washington <strong>DC</strong> Questionnaire Support LTCP as Written Level of <strong>Control</strong><br />
221<br />
Not<br />
Provided Not Provided Citizen Not Provided Not Provided Questionnaire Support LTCP as Written Level of <strong>Control</strong><br />
222<br />
Not<br />
Provided Not Provided Citizen Not Provided Not Provided Questionnaire Support LTCP as Written Level of <strong>Control</strong><br />
223 Sesil Joe Citizen 3421 N St NW Washington <strong>DC</strong> Questionnaire Support LTCP as written Level of <strong>Control</strong><br />
224 Stiehler Robert D. Citizen<br />
3234 Quesada St<br />
NW<br />
Washington <strong>DC</strong><br />
20015 Questionnaire Support LTCP as written Level of <strong>Control</strong><br />
225 Wrin Bob Citizen<br />
5509 Chevy Chase<br />
Pkwy, NW Washington <strong>DC</strong> Questionnaire Support LTCP as written Level of <strong>Control</strong><br />
226 Wrin Bob Citizen<br />
5509 Chevy Chase<br />
Pkwy, NW Washington <strong>DC</strong> Questionnaire Support LTCP as Written Level of <strong>Control</strong><br />
227 Gallagher Patricia, E.<br />
National<br />
Capital<br />
<strong>Plan</strong>ning<br />
Commission<br />
228 Baron David Earthjustice<br />
401 9th St NW,<br />
North Lobby, Suite<br />
500<br />
1625 Mass. Ave,<br />
NW Suite 702<br />
229 Hanmer Rebecca EPA Reg 3 1650 Arch Street<br />
3723 Winfield Lane<br />
230 Mitchell Jeanene Citizen NW<br />
231 Silverman<br />
Larry and<br />
Robert<br />
Boone<br />
Anacostia<br />
<strong>Water</strong>shed<br />
Society<br />
4302 Baltimore<br />
Ave.<br />
Washington <strong>DC</strong><br />
20576 Written Comments Support LTCP as written Level of <strong>Control</strong><br />
Washington <strong>DC</strong> <strong>DC</strong> Council Pub This is an investment for the future, so cost is not the<br />
20036<br />
Hearing<br />
biggest consideration<br />
Level of <strong>Control</strong><br />
To what extent can increasing the diameters of the Level of control<br />
Anacostia tunnels increase the percent capture and<br />
Philadelphia, PA<br />
decrease the number of overflow events without significantly<br />
19103 Written Comments adding to the overall cost of the project<br />
Washington <strong>DC</strong><br />
20007 Questionnaire<br />
Bladensburg, MD<br />
20710 WASA Pub Hearing<br />
232 CItizen Neigh Mtg#4<br />
WASA should do all it can to reduce CSOs, even though it<br />
isn't the only polluter<br />
Level of <strong>Control</strong><br />
We are making decisions for 100yrs, so be bold and make it<br />
the right one<br />
Level of <strong>Control</strong><br />
We should not spend all this money because we don't get a<br />
big WQ benefit<br />
Level of <strong>Control</strong><br />
12 of 23
No. Last Name First name Affiliation Address 1 Address 2 Forum Comment Category<br />
A more thorough proposal for LID options should be LID/Source<br />
included in the LTCP. The plan should address the benefits <strong>Control</strong><br />
and calculate reductions and water quality impacts for the<br />
application of LID throughout the entire District, not just the<br />
benefits related to WASA’s facilities. A more complete<br />
explanation of program objectives and methods should be<br />
detailed, including coordination with stormwater<br />
management plans required by the MS-4 permit for the<br />
District. Specific mechanisms to implement District-wide<br />
LID should be identified (such as building codes, zoning<br />
ordinances, and permits) as well as institutional<br />
responsibilities. Also various levels of application for LID<br />
projects should be reviewed (such as new development, redevelopment,<br />
or retrofit of all development) to assess<br />
Philadelphia, PA<br />
stormwater flow reduction.<br />
233 Hanmer Rebecca EPA Reg 3 1650 Arch Street 19103 Written Comments<br />
234 Schwartz Paul<br />
Clean <strong>Water</strong><br />
Action<br />
4455 Connecticut<br />
Ave, NW, A-300<br />
Washington, <strong>DC</strong><br />
20008<br />
<strong>DC</strong> Council Pub<br />
Hearing<br />
Bldg codes need to change to allow more LID<br />
LID/Source<br />
<strong>Control</strong><br />
235 CItizen Neigh Mtg#9 Build LID instead of tunnel<br />
LID/Source<br />
<strong>Control</strong><br />
236 Schulman Jim<br />
Sustainable<br />
Community<br />
Initiatives 631 E St NE<br />
Washington <strong>DC</strong><br />
20002 Written Comments<br />
Do cost-benefit comparison of engineered to nonengineered<br />
solutions<br />
LID/Source<br />
<strong>Control</strong><br />
237 Schulman Jim<br />
Marchant,<br />
and Robert<br />
238 Wentworth Morris<br />
Sustainable<br />
Community<br />
Initiatives<br />
631 E St NE<br />
Washington <strong>DC</strong><br />
20002 Written Comments<br />
Explore less capital intensive solutions like source<br />
reduction, bldg code improvements & public eductaion<br />
1726 St NW, Suite Washington <strong>DC</strong><br />
Sierra Club 902<br />
20036 Written Comments Groundwater - Look at Federal groundwater pumpage<br />
Clean <strong>Water</strong> NR<strong>DC</strong> 1200 New Washington <strong>DC</strong><br />
239<br />
Campaign York Ave., NW 20005 Written Comments Groundwater - Reroute groundwater pumpage<br />
Groundwater - Table 8-2 and 8-3 show significant<br />
groundwater flows from existing sources and orphan storm<br />
sewers, but does not propose to remove them from the<br />
Philadelphia, PA<br />
system. What can be done to eliminate these flows from<br />
240 Hanmer Rebecca EPA Reg 3 1650 Arch Street 19103 Written Comments the system<br />
<strong>DC</strong> Green<br />
Groundwater : Those pumping ground water should pay<br />
241 Hanrahan Debra Party 1505 Q Street, NW Washington, <strong>DC</strong> WASA Pub Hearing their fair share<br />
<strong>DC</strong> Green<br />
242 Hanrahan Debra Party 1505 Q Street, NW Washington, <strong>DC</strong> WASA Pub Hearing Groundwater: Groundwater pumpage is a concern<br />
243 Baron David Earthjustice<br />
246 Deutsch Barbara Casey Trees<br />
Marchant,<br />
and Robert<br />
247 Wentworth Morris Sierra Club<br />
1625 Mass. Ave,<br />
NW Suite 702<br />
Washington <strong>DC</strong><br />
20036 Written Comments<br />
I/I & <strong>Water</strong> Conservation - Inadequate I/I reduction program<br />
WASA's own studies show show there is 118 mgd of flow<br />
(WW flow reduction + <strong>Water</strong> Conservation)<br />
I/I & <strong>Water</strong> Conservation - Incentives/water conservation<br />
should be a big part of program<br />
244 CItizen Neigh Mtg#4<br />
Clean <strong>Water</strong> NR<strong>DC</strong> 1200 New Washington <strong>DC</strong><br />
245<br />
Campaign York Ave., NW 20005 Written Comments I/I & <strong>Water</strong> Conservation - should be part of program<br />
1800 K St NW, Washington <strong>DC</strong><br />
Suite 622 20002 WASA Pub Hearing Increase funding for LID<br />
1726 St NW, Suite<br />
902<br />
Washington <strong>DC</strong><br />
20036 Written Comments Increase funding for LID<br />
LID/Source<br />
<strong>Control</strong><br />
LID/Source<br />
<strong>Control</strong><br />
LID/Source<br />
<strong>Control</strong><br />
LID/Source<br />
<strong>Control</strong><br />
LID/Source<br />
<strong>Control</strong><br />
LID/Source<br />
<strong>Control</strong><br />
LID/Source<br />
<strong>Control</strong><br />
LID/Source<br />
<strong>Control</strong><br />
LID/Source<br />
<strong>Control</strong><br />
LID/Source<br />
<strong>Control</strong><br />
LID/Source<br />
<strong>Control</strong><br />
13 of 23
No. Last Name First name Affiliation Address 1 Address 2 Forum Comment Category<br />
248<br />
Clean <strong>Water</strong><br />
Campaign<br />
NR<strong>DC</strong> 1200 New<br />
York Ave., NW<br />
Washington <strong>DC</strong><br />
20005 Written Comments<br />
LID: overstates cost, understates effectiveness, $3 mill is<br />
inadequate<br />
LID/Source<br />
<strong>Control</strong><br />
249 CItizen Neigh Mtg#8 Look at more BMPs to treat storm water<br />
LID/Source<br />
<strong>Control</strong><br />
250<br />
Clean <strong>Water</strong><br />
Campaign<br />
NR<strong>DC</strong> 1200 New<br />
York Ave., NW<br />
Washington <strong>DC</strong><br />
20005 Written Comments<br />
Look at <strong>Water</strong> conservation, roof leader disconnection,<br />
storm water reuse, green roofs, urban forest<br />
LID/Source<br />
<strong>Control</strong><br />
Not<br />
Low impact development alternatives have not been given a LID/Source<br />
251 Provided Not Provided Citizen Not Provided Not Provided Questionnaire fair evaluation<br />
<strong>Control</strong><br />
Low impact development could achieve CSO reduction and LID/Source<br />
252 Vogel Mary Citizen 3105 Crest Ave Cheverly Md 20785 Questionnaire beautify/ ecologically help City<br />
<strong>Control</strong><br />
253 Wentworth<br />
Marchant,<br />
and Robert<br />
Morris<br />
Sierra Club<br />
1726 St NW, Suite<br />
902<br />
254 Abrams Alan Citizen 808 Aspen St NW<br />
Washington <strong>DC</strong><br />
20036 Written Comments<br />
Washington <strong>DC</strong><br />
20013 Written Comments More emphasis on non-engineered solution<br />
Mandate LID/waterconservation in Rock Creek for<br />
Montgomery County, set enforceable bacteria milestones<br />
255 Armsby Michelle Citizen #61 PO Box 18901 Rochester NY 14619 Written Comments More emphasis on non-engineered solution<br />
Washington <strong>DC</strong><br />
256 Chanay Robin D CItizen 503 S St NW 20001 WASA Pub Hearing More emphasis on non-engineered solution<br />
Washington <strong>DC</strong><br />
257 Chanay Robin D CItizen 503 S St NW 20001 Written Comments More emphasis on non-engineered solution<br />
258 Hamilton Dawn, M. Citizen 126 16th St SE Washington <strong>DC</strong> Written Comments More emphasis on non-engineered solution<br />
7548 Clenmoor Winter Park, FL<br />
259 Ho Colisa Citizen Lane<br />
32792 Written Comments More emphasis on non-engineered solution<br />
501 Constitution Washington <strong>DC</strong><br />
260 Mayock Melanie Citizen Ave NE<br />
20003 Written Comments More emphasis on non-engineered solution<br />
Washington <strong>DC</strong><br />
261 McCuran Elizabeth Citizen 216 K St, NE 20003 Written Comments More emphasis on non-engineered solution<br />
2321 Wisconsin Washington <strong>DC</strong><br />
262 Mirsky Jonathan, B. Citizen Ave, NW #208 20008 Written Comments More emphasis on non-engineered solution<br />
4035 Highland Ct Washington <strong>DC</strong><br />
263 Nagi Suzanne Citizen NW<br />
20008 Written Comments More emphasis on non-engineered solution<br />
4035 Highland Ct Washington <strong>DC</strong><br />
264 Nagi Suzanne Citizen NW<br />
20008 Written Comments More emphasis on non-engineered solution<br />
265 Niswander Ruth Citizen 623 Barbera Davis CA 95617 Written Comments More emphasis on non-engineered solution<br />
Washington <strong>DC</strong><br />
266 Saidman Amy Citizen 1871 Engleside 20010 Written Comments More emphasis on non-engineered solution<br />
Andrew, and<br />
Paul Clean <strong>Water</strong> 4455 Connecticut Washington, <strong>DC</strong><br />
267 Fellows Schwartz Action Ave, NW, A-300 20008 WASA Pub Hearing More emphasis on non-engineered solution<br />
Clean <strong>Water</strong> NR<strong>DC</strong> 1200 New Washington <strong>DC</strong> <strong>DC</strong> Council Pub<br />
268 Woodworth James Campaign York Ave., NW 20005<br />
Hearing<br />
More emphasis on non-engineered solution<br />
Clean <strong>Water</strong> NR<strong>DC</strong> 1200 New Washington <strong>DC</strong><br />
269<br />
Campaign York Ave., NW 20005 Written Comments More emphasis on non-engineered solution<br />
D.C.<br />
Environmental 1025 Vermont Washington <strong>DC</strong> <strong>DC</strong> Council Pub<br />
270 Norouzi Parisa Network Avenue NW 3rd Flr 20005<br />
Hearing<br />
More emphasis on non-engineered solution<br />
Friends of the 1025 Vermont Washington, <strong>DC</strong><br />
271 Blackwelder Brent Earth Avenue, NW 20005 WASA Pub Hearing More emphasis on non-engineered solution<br />
272 Wentworth Marchant Sierra Club<br />
1727 St NW, Suite<br />
902<br />
Washington <strong>DC</strong><br />
20037 WASA Pub Hearing More emphasis on non-engineered solution<br />
LID/Source<br />
<strong>Control</strong><br />
LID/Source<br />
<strong>Control</strong><br />
LID/Source<br />
<strong>Control</strong><br />
LID/Source<br />
<strong>Control</strong><br />
LID/Source<br />
<strong>Control</strong><br />
LID/Source<br />
<strong>Control</strong><br />
LID/Source<br />
<strong>Control</strong><br />
LID/Source<br />
<strong>Control</strong><br />
LID/Source<br />
<strong>Control</strong><br />
LID/Source<br />
<strong>Control</strong><br />
LID/Source<br />
<strong>Control</strong><br />
LID/Source<br />
<strong>Control</strong><br />
LID/Source<br />
<strong>Control</strong><br />
LID/Source<br />
<strong>Control</strong><br />
LID/Source<br />
<strong>Control</strong><br />
LID/Source<br />
<strong>Control</strong><br />
LID/Source<br />
<strong>Control</strong><br />
LID/Source<br />
<strong>Control</strong><br />
LID/Source<br />
<strong>Control</strong><br />
LID/Source<br />
<strong>Control</strong><br />
14 of 23
No. Last Name First name Affiliation Address 1 Address 2 Forum Comment Category<br />
Chesapeake<br />
Bay<br />
Washington, <strong>DC</strong><br />
LID/Source<br />
273 Siglin Douglas Foundation 717 E Street, NE 20002 WASA Pub Hearing More LID<br />
<strong>Control</strong><br />
274 Morris Bob Sierra Club 413 5th Street, NE<br />
Washington, <strong>DC</strong><br />
20002 WASA Pub Hearing More LID<br />
LID/Source<br />
<strong>Control</strong><br />
275 CItizen Neigh Mtg#4 Public education should be part of program<br />
LID/Source<br />
<strong>Control</strong><br />
276 Schulman Jim<br />
Sustainable<br />
Community<br />
Initiatives 631 E St NE<br />
Washington <strong>DC</strong><br />
20002 Written Comments<br />
Rate Structure - Consider fee-incentives such as property<br />
tax credits to promote source reduction of storm water<br />
LID/Source<br />
<strong>Control</strong><br />
277 CItizen Neigh Mtg#10<br />
Anacostia<br />
<strong>Water</strong>shed 4302 Baltimore Bladensburg, MD <strong>DC</strong> Council Pub<br />
278 Connelly Jim Society Ave.<br />
20710<br />
Hearing<br />
279 Fellows<br />
Andrew, and<br />
Paul<br />
Schwartz<br />
Clean <strong>Water</strong><br />
Action<br />
280 Hurtt Harold A Citizen<br />
Friends of the<br />
281 Blackwelder Brent Earth<br />
282 Hogan Sheila Casey Trees<br />
283 Hogan Sheila Casey Trees<br />
284 Hogan Sheila Casey Trees<br />
285 Deutsch Barbara Casey Trees<br />
286 Forsberg Ken Citizen<br />
Larry and Anacostia<br />
Robert <strong>Water</strong>shed<br />
287 Silverman Boone Society<br />
Marchant,<br />
and Robert<br />
288 Wentworth Morris Sierra Club<br />
Rate Structure - Consider incentives in water/sewer rates to<br />
encourage LID<br />
Rate structure - <strong>Plan</strong> should creat incentives for LID (City<br />
Council should do it)<br />
4455 Connecticut<br />
Ave, NW, A-300<br />
Washington, <strong>DC</strong><br />
20008 WASA Pub Hearing<br />
Support an integrated planning process e.g. street<br />
sweeping, eduction, water cons., grey water, etc<br />
640-B Croissant PL Washington <strong>DC</strong><br />
SE<br />
20019 Questionnaire Supports LID<br />
1025 Vermont Washington, <strong>DC</strong><br />
Supports source control (Wat. conserv., street sweeping,<br />
Avenue, NW 20005 WASA Pub Hearing tree planting, LID, water reuse<br />
1800 K St NW,<br />
Suite 622<br />
1800 K St NW,<br />
Suite 622<br />
1800 K St NW,<br />
Suite 622<br />
1800 K St NW,<br />
Suite 622<br />
1809 Monroe St,<br />
NW<br />
4302 Baltimore<br />
Ave.<br />
Washington <strong>DC</strong><br />
20002 Written Comments<br />
Trees - <strong>DC</strong> has experienced a 64% decrease in tree cover<br />
since 1973 and a resulting 34% increase in storm water<br />
Washington <strong>DC</strong><br />
Trees - If tree cover were restored to 1970 levels, could<br />
20002 Written Comments reduce storm water runoff by 826 mg/yr<br />
Washington <strong>DC</strong><br />
Trees - LTCP has not adequately addressed tree loss &<br />
20002 Written Comments using it to control CSO<br />
Washington <strong>DC</strong><br />
20002 WASA Pub Hearing Trees - Make trees a critical component of LID<br />
Washington <strong>DC</strong><br />
Consider effects of global warming on long term rain<br />
20036 Written Comments intensity/patterns<br />
Bladensburg, MD<br />
20710 WASA Pub Hearing Demonstrate year by year improvements Misc<br />
1726 St NW, Suite Washington <strong>DC</strong><br />
Devise system to track & respond to Environmental<br />
902<br />
20036 Written Comments complaints<br />
Misc<br />
1727 P St NW, Apt Washington <strong>DC</strong><br />
289 Reusga Albert Citizen D<br />
20036 Written Comments Do not do anything unless other polluters do their share Misc<br />
290 Fellows<br />
Andrew, and<br />
Paul<br />
Schwartz<br />
Clean <strong>Water</strong><br />
Action<br />
4455 Connecticut<br />
Ave, NW, A-300<br />
Washington, <strong>DC</strong><br />
20008 WASA Pub Hearing<br />
Health effects - Continued CSOs are a health risk due to<br />
fish consumption<br />
Misc<br />
291 Whitehead Damon<br />
Anacostia<br />
Riverkeeper<br />
1st & Potomac<br />
Avenue, SE<br />
Washington, <strong>DC</strong><br />
20003<br />
<strong>DC</strong> Council Pub<br />
Hearing Health Effects - fails to recognize health effects Misc<br />
292 Sesil Joe Citizen 3421 N St NW Washington <strong>DC</strong> Questionnaire Keep recording notice of violations Misc<br />
293 DeGroot Allison Citizen Washington, <strong>DC</strong> WASA Pub Hearing No comments Misc<br />
294 Wentworth Marchant Sierra Club<br />
Marchant,<br />
and Robert<br />
295 Wentworth Morris Sierra Club<br />
1726 St NW, Suite<br />
902<br />
1726 St NW, Suite<br />
902<br />
Washington <strong>DC</strong><br />
20036 WASA Pub Hearing Public notification - add system in short term Misc<br />
Washington <strong>DC</strong><br />
20036 Written Comments<br />
Public notification - Given long implementation time, take<br />
steps to advise people of CSOs (examples given)<br />
LID/Source<br />
<strong>Control</strong><br />
LID/Source<br />
<strong>Control</strong><br />
LID/Source<br />
<strong>Control</strong><br />
LID/Source<br />
<strong>Control</strong><br />
LID/Source<br />
<strong>Control</strong><br />
LID/Source<br />
<strong>Control</strong><br />
LID/Source<br />
<strong>Control</strong><br />
LID/Source<br />
<strong>Control</strong><br />
LID/Source<br />
<strong>Control</strong><br />
Misc<br />
Misc<br />
15 of 23
No. Last Name First name Affiliation Address 1 Address 2 Forum Comment Category<br />
1625 Mass. Ave, Washington <strong>DC</strong><br />
Public Notification - Visual notification system should have<br />
296 Baron David Earthjustice NW Suite 702 20036 Written Comments schedule in LTCP & be installed in 12 mos<br />
Misc<br />
297<br />
Clean <strong>Water</strong><br />
Campaign<br />
NR<strong>DC</strong> 1200 New<br />
York Ave., NW<br />
Washington <strong>DC</strong><br />
20005 Written Comments<br />
Public notification - WASA must have immediate public<br />
notification system<br />
Misc<br />
298 Woodworth James<br />
Clean <strong>Water</strong><br />
Campaign<br />
NR<strong>DC</strong> 1200 New<br />
York Ave., NW<br />
Washington <strong>DC</strong><br />
20005 WASA Pub Hearing Same as written comments Misc<br />
299 Baron David Earthjustice<br />
1625 Mass. Ave,<br />
NW Suite 702<br />
Washington <strong>DC</strong><br />
20036 WASA Pub Hearing Same as written comments Misc<br />
300 Schulman Jim<br />
Sustainable<br />
Community<br />
Initiatives 631 E St NE<br />
Washington <strong>DC</strong><br />
20002 WASA Pub Hearing Same as written testimony Misc<br />
The statement, “In March 2001 the DOH released its first Misc<br />
301 Hanmer Rebecca EPA Reg 3 1650 Arch Street<br />
Philadelphia, PA<br />
19103 Written Comments<br />
TMDL for the impaired waterbody.” is incorrect. The first<br />
TMDL was issued on January 12, 1999. The Anacostia<br />
BOD TMDL is the second.<br />
Washington <strong>DC</strong><br />
302 Mack Geterrius Citizen 1430 L St SE, #509 20003 Written Comments This affects our water supplies Misc<br />
303 Bobreski Jim Citizen<br />
<strong>DC</strong> Council Pub<br />
Hearing WASA is not forthcoming to public Misc<br />
Washington <strong>DC</strong><br />
304 Battle C.A. Citizen 5503 13th St NW 20011 Written Comments Will the plan be implemented correctly Misc<br />
305 Hanmer Rebecca EPA Reg 3 1650 Arch Street<br />
Philadelphia, PA<br />
19103 Written Comments<br />
The LTCP should more fully describe WASA’s efforts to<br />
date, and plans to implement each of the NMCs. Since the<br />
overflow volume to be addressed by the LTCP can be<br />
reduced by maximizing NMC effectiveness, it is important<br />
that current NMC information be reported. Although a NMC<br />
Summary Report was complete in July 1999 and NMC<br />
Action <strong>Plan</strong> Report in February 2000, the plan should<br />
include up-to-date NMC efforts and a current schedule for<br />
full implementation of NMCs. What near-term plans are<br />
there for trash and floatables control Could any portions of<br />
the recommended <strong>Plan</strong> be reduced in size or eliminated<br />
through full implementation of the Nine Minimum <strong>Control</strong>s<br />
Also what real-time enhancements to the overflow event<br />
warning system are planned to satisfy public notification<br />
requirements<br />
NMC<br />
306<br />
307 Schulman Jim<br />
308 Norouzi Parisa<br />
309 Fellows<br />
310 Sanders Serita<br />
Andrew, and<br />
Paul<br />
Schwartz<br />
Clean <strong>Water</strong><br />
Campaign<br />
Sustainable<br />
Community<br />
Initiatives<br />
D.C.<br />
Environmental<br />
Network<br />
NR<strong>DC</strong> 1200 New<br />
York Ave., NW<br />
631 E St NE<br />
1025 Vermont Washington <strong>DC</strong><br />
Avenue NW 3rd Flr 20005<br />
Clean <strong>Water</strong> 4455 Connecticut<br />
Action Ave, NW, A-300<br />
Bloomingdale<br />
Civic Assoc P.O. Box 92691<br />
Washington <strong>DC</strong><br />
20005 Written Comments WASA must fully implement NMCs NMC<br />
Washington <strong>DC</strong><br />
20002 Written Comments<br />
Consider larger public involvement to bring in fresh<br />
perspectives & foster publci-private partnerships<br />
<strong>DC</strong> Council Pub<br />
Hearing Inadequate citizen attendance at public meetings (only 50)<br />
Washington, <strong>DC</strong><br />
20008 WASA Pub Hearing<br />
Washington, <strong>DC</strong><br />
20090 WASA Pub Hearing Need better public participation<br />
Need better public involvement process that includes all the<br />
players<br />
Public<br />
Participation<br />
Public<br />
Participation<br />
Public<br />
Participation<br />
Public<br />
Participation<br />
16 of 23
No. Last Name First name Affiliation Address 1 Address 2 Forum Comment Category<br />
Philadelphia, PA<br />
Section 10.7 should be expanded to include the process<br />
and preparation of Public Responsiveness Document and<br />
how it will be distributed through WASA’s website and other<br />
means. Also explain how later versions of the LTCP will<br />
include additional information on the public participation<br />
Public<br />
Participation<br />
311 Hanmer Rebecca EPA Reg 3 1650 Arch Street 19103 Written Comments process.<br />
312 Hanmer Rebecca EPA Reg 3 1650 Arch Street<br />
313 Hanmer Rebecca EPA Reg 3 1650 Arch Street<br />
314 Hanmer Rebecca EPA Reg 3 1650 Arch Street<br />
1625 Mass. Ave,<br />
315 Baron David Earthjustice NW Suite 702<br />
1625 Mass. Ave,<br />
316 Baron David Earthjustice NW Suite 702<br />
2113 N St NW<br />
317 Dwyer Stuart Citizen #201<br />
Philadelphia, PA<br />
19103 Written Comments<br />
Philadelphia, PA<br />
19103 Written Comments<br />
What steps have been taken to ensure that public<br />
participation has effectively reached minority and low<br />
income populations<br />
What steps have been taken to evaluate the potential for<br />
disproportionately high and adverse human health or<br />
environmental effects on minority and low-income<br />
populations What steps have been taken to avoid any<br />
such impacts<br />
Public<br />
Participation<br />
Public<br />
Participation<br />
A more detailed discussion of sensitive areas to include Regulatory<br />
each of the three receiving waterbodies is required.<br />
Presently, the LTCP only addresses the Rock Creek and<br />
does not explain how the Hay's Spring Amphipod will be<br />
protected by implementing CSO controls. A discussion of<br />
the actual impacts of CSOs and LTCP related construction<br />
on each species (and mitigation efforts) is necessary. The<br />
Short Nosed Sturgeon has not been included in any<br />
discussion of sensitive areas for the Potomac. Since this<br />
endangered species has been known to reside in Potomac<br />
waters, it should be addressed in the plan along with the<br />
Philadelphia, PA<br />
other threatened and/or endangered species.<br />
19103 Written Comments<br />
Washington <strong>DC</strong><br />
Anacostia, Pot. & RC are all sensitive areas and must be<br />
20036 Written Comments treated as such per CSO Policy<br />
Regulatory<br />
Washington <strong>DC</strong><br />
Expansion - CSO controls cannot be expanded as required<br />
20036 Written Comments by CSO Policy<br />
Regulatory<br />
Washington <strong>DC</strong><br />
20037 Questionnaire Expansion - Make sure system can be upgraded in future Regulatory<br />
318 Baron David Earthjustice<br />
1625 Mass. Ave,<br />
NW Suite 702<br />
Washington <strong>DC</strong><br />
20036 Written Comments<br />
LTCP should project water quality impacts of CSOs under<br />
"all potential weather conditions", not just average year. Regulatory<br />
319 Whitehead Damon<br />
Anacostia<br />
Riverkeeper<br />
1st & Potomac<br />
Avenue, SE<br />
Washington, <strong>DC</strong><br />
20003 WASA Pub Hearing<br />
LTCP violates Chesapeake Bay Agreement and 2001<br />
<strong>Water</strong>shed Restoration Agreement<br />
Regulatory<br />
Monitoring - More detail about the Post Construction Regulatory<br />
320 Hanmer Rebecca EPA Reg 3 1650 Arch Street<br />
Philadelphia, PA<br />
19103 Written Comments<br />
monitoring plan development should be included in the<br />
LTCP along with a schedule for plan development. A<br />
monitoring program (to include Post Construction<br />
monitoring) is expected during and after LTCP<br />
implementation to determine the effectiveness of the overall<br />
program using monitoring conducted during LTCP<br />
development as a baseline.<br />
321 Baron David Earthjustice<br />
1625 Mass. Ave,<br />
NW Suite 702<br />
Washington <strong>DC</strong><br />
20036 Written Comments<br />
Monitoring - Post-construction monitoring program has<br />
inadequate detail and no schedule per CSO Policy Regulatory<br />
322 CItizen Neigh Mtg#4 Can the plan be implemented faster Schedule<br />
323 Schulman Jim<br />
Sustainable<br />
Community<br />
Initiatives 631 E St NE<br />
Washington <strong>DC</strong><br />
20002 Questionnaire<br />
<strong>DC</strong> should be given more time to develop less of a "middle<br />
of the pipe" solution<br />
Schedule<br />
17 of 23
No. Last Name First name Affiliation Address 1 Address 2 Forum Comment Category<br />
EPA notes that the project schedule identifies the start of Schedule<br />
Philadelphia, PA<br />
design for the Rock Creek and Potomac tunnels in years 10<br />
and 13. We agree that the initial emphasis should be on the<br />
Anacostia elements. We further suggest that the proposed<br />
Rock Creek and Potomac tunnels be re-evaluated when the<br />
Anacostia tunnel (Poplar Point to NE Boundary Outfall) is<br />
completed, as part of the Anacostia post-construction<br />
324 Hanmer Rebecca EPA Reg 3 1650 Arch Street 19103 Written Comments monitoring plan.<br />
For each major project component, describe implementation Schedule<br />
325 Hanmer Rebecca EPA Reg 3 1650 Arch Street<br />
Philadelphia, PA<br />
19103 Written Comments<br />
schedule constraints that prevent nearer-term completion.<br />
Potomac Boat 3530 <strong>Water</strong> Street Washington <strong>DC</strong><br />
326 Cole Cynthia Club NW<br />
20002 Written Comments Misconception that plan will take 30 years to build Schedule<br />
327 Connelly Jim<br />
Anacostia<br />
<strong>Water</strong>shed<br />
Society<br />
4302 Baltimore<br />
Ave.<br />
Bladensburg, MD<br />
20710<br />
<strong>DC</strong> Council Pub<br />
Hearing<br />
<strong>Plan</strong> does not adequately address trash - too long to wait for<br />
tunnels<br />
Schedule<br />
328 Baron David Earthjustice<br />
1625 Mass. Ave,<br />
NW Suite 702<br />
Washington <strong>DC</strong><br />
20036 Written Comments<br />
<strong>Plan</strong> does not have fixed date schedules per CSO Policy<br />
and 20-yr time frame is not justified<br />
Schedule<br />
Potomac Boat 3530 <strong>Water</strong> Street Washington <strong>DC</strong><br />
329 Cole Cynthia Club NW<br />
20002 Written Comments Potomac is pushed out too far in schedule Schedule<br />
330 Whitehead Damon<br />
Anacostia<br />
Riverkeeper<br />
1st & Potomac<br />
Avenue, SE<br />
Washington, <strong>DC</strong><br />
20003<br />
<strong>DC</strong> Council Pub<br />
Hearing Shorter schedule Schedule<br />
331 Whitehead Damon<br />
Anacostia<br />
Riverkeeper<br />
1st & Potomac<br />
Avenue, SE<br />
Washington, <strong>DC</strong><br />
20003 WASA Pub Hearing Shorter schedule Schedule<br />
332 Connelly Jim<br />
Anacostia<br />
<strong>Water</strong>shed<br />
Society<br />
4302 Baltimore<br />
Ave.<br />
Bladensburg, MD<br />
20710<br />
<strong>DC</strong> Council Pub<br />
Hearing Shorter schedule Schedule<br />
333 Arner Robert L. Citizen 7209 Exfair Road Bethesda MD 20815 Written Comments Shorter schedule Schedule<br />
334 Caposi John Citizen 1619 G St SE Washington <strong>DC</strong> WASA Pub Hearing Shorter schedule Schedule<br />
335 Hamilton Dawn, M. Citizen 126 16th St SE Washington <strong>DC</strong> Written Comments Shorter schedule Schedule<br />
336 Woodworth James<br />
Clean <strong>Water</strong><br />
Campaign<br />
NR<strong>DC</strong> 1200 New<br />
York Ave., NW<br />
Washington <strong>DC</strong><br />
20005<br />
<strong>DC</strong> Council Pub<br />
Hearing Shorter schedule Schedule<br />
337<br />
338 Norouzi Parisa<br />
339 Blackwelder Brent<br />
Clean <strong>Water</strong><br />
Campaign<br />
D.C.<br />
Environmental<br />
Network<br />
Friends of the<br />
Earth<br />
NR<strong>DC</strong> 1200 New<br />
York Ave., NW<br />
340 Hanmer Rebecca EPA Reg 3 1650 Arch Street<br />
341 Hanmer Rebecca EPA Reg 3 1650 Arch Street<br />
Clean <strong>Water</strong> NR<strong>DC</strong> 1200 New<br />
342 Woodworth James Campaign York Ave., NW<br />
343 Hanmer Rebecca EPA Reg 3 1650 Arch Street<br />
Washington <strong>DC</strong><br />
20005 Written Comments Shorter schedule Schedule<br />
1025 Vermont<br />
Avenue NW 3rd Flr<br />
Washington <strong>DC</strong><br />
20005<br />
<strong>DC</strong> Council Pub<br />
Hearing Shorter schedule Schedule<br />
1025 Vermont Washington, <strong>DC</strong><br />
Avenue, NW 20005 WASA Pub Hearing Shorter schedule Schedule<br />
The draft plan identifies early action items that are not Schedule<br />
dependent on LTCP approval. A summary action plan<br />
Philadelphia, PA<br />
should be prepared and submitted to implement the early<br />
19103 Written Comments action items.<br />
Philadelphia, PA<br />
19103 Written Comments<br />
Washington <strong>DC</strong> <strong>DC</strong> Council Pub<br />
20005<br />
Hearing<br />
Philadelphia, PA<br />
19103 Written Comments<br />
The schedule should include a projection of the incremental Schedule<br />
progress in terms of increase in percent capture (1 or 2 year<br />
increments suggested) throughout the course of the<br />
proposed schedule.<br />
Things should be done immediately - trash control, better O<br />
& M, LID, wat conserv<br />
Schedule<br />
Will the first 2 segments of the Anacostia tunnel project be Schedule<br />
independently operational in terms of providing useable<br />
storage and transmission immediately upon completion of<br />
construction<br />
18 of 23
No. Last Name First name Affiliation Address 1 Address 2 Forum Comment Category<br />
Quantify, to the extent that currently available information Toxics<br />
Philadelphia, PA<br />
allows, the toxic pollution control benefits of the<br />
recommended plan. Provide an estimate of toxics that will<br />
be captured and treated at Blue Plains WWTP that would<br />
otherwise be discharged if sewers are separated.<br />
344 Hanmer Rebecca EPA Reg 3 1650 Arch Street 19103 Written Comments<br />
345 Chanay Robin D CItizen 503 S St NW<br />
Washington <strong>DC</strong><br />
20001 Written Comments<br />
Chicago & Milwaukee - Milwaukee tunnels leak, Chicago<br />
tunnels are undersized<br />
Tunnel<br />
346 Whitehead Damon<br />
Anacostia<br />
Riverkeeper<br />
1st & Potomac<br />
Avenue, SE<br />
Washington, <strong>DC</strong><br />
20003 WASA Pub Hearing<br />
Chicago & Milwaukee - WASA did not look at other tunnels<br />
that failed (Chicago, Milwaukee)<br />
Tunnel<br />
347 Chanay Robin D CItizen 503 S St NW<br />
Washington <strong>DC</strong><br />
20001<br />
<strong>DC</strong> Council Pub<br />
Hearing Chicago & Milwaukee have problems w/their tunnels Tunnel<br />
348 Chanay Robin D CItizen 503 S St NW<br />
Washington <strong>DC</strong><br />
20001 WASA Pub Hearing Chicago & Milwaukee have problems w/their tunnels Tunnel<br />
349 CItizen Neigh Mtg#6<br />
Concern about hauling tunnel spoil and traffic messes at<br />
Georgetown<br />
Tunnel<br />
Potomac Boat 3530 <strong>Water</strong> Street Washington <strong>DC</strong><br />
Concern about lack of details regarding tunnel (where will<br />
350 Cole Cynthia Club NW<br />
20002 Written Comments muck be removed, disturbance of existing structures, Tunnel<br />
351 CItizen Neigh Mtg#6 Concern about odors in the tunnel Tunnel<br />
352 CItizen Neigh Mtg#8<br />
Concern about tunnel leaking, contaminating groundwater,<br />
collapsing<br />
Tunnel<br />
353 CItizen Neigh Mtg#8<br />
Concern regarding interruption of sewer service and<br />
disruption associated with <strong>Plan</strong><br />
Tunnel<br />
354 Webber Elizabeth A. Citizen<br />
2320 Wisconsin<br />
Ave., NW, #201<br />
Washington <strong>DC</strong><br />
20007 Written Comments<br />
Construction will adversely affect existing structures (Key<br />
Bridge, canal, etc due to shaking, etc<br />
Tunnel<br />
355 Gerhart James M.<br />
U.S.<br />
Geological<br />
Survey<br />
8987 Yellow Brick<br />
Road Baltimore MD 21237 Written Comments<br />
Describe hydraulic properties of geologic media (ability to<br />
transmit groundwater to tunnels)<br />
Tunnel<br />
356 Gerhart James M.<br />
U.S.<br />
Geological<br />
Survey<br />
8987 Yellow Brick<br />
Road Baltimore MD 21237 Written Comments Determine interaction of groundwater with surface waters Tunnel<br />
357 Slowenski Kent Citizen NA NA WASA Pub Hearing How will odors be controlled when tunnels fill and empty Tunnel<br />
358 Slowenski Kent Citizen NA NA WASA Pub Hearing How will WASA maintain tunnels Tunnel<br />
359 Gerhart James M.<br />
U.S.<br />
Geological<br />
Survey<br />
8987 Yellow Brick<br />
Road Baltimore MD 21237 Written Comments Investigate & describe hydrogeologic framwork (geology) Tunnel<br />
360 CItizen Neigh Mtg#2<br />
Metro caused shifting soils. What are you going to do to<br />
prevent this<br />
Tunnel<br />
361 Gerhart James M.<br />
362 Connelly Jim<br />
363 Gerhart James M.<br />
364 Gerhart James M.<br />
U.S.<br />
Geological<br />
Survey<br />
Anacostia<br />
<strong>Water</strong>shed<br />
Society<br />
U.S.<br />
Geological<br />
Survey<br />
U.S.<br />
Geological<br />
Survey<br />
365 Webber Elizabeth A. Citizen<br />
8987 Yellow Brick<br />
Road Baltimore MD 21237 Written Comments<br />
4302 Baltimore<br />
Ave.<br />
Bladensburg, MD<br />
20710<br />
8987 Yellow Brick<br />
Road Baltimore MD 21237 Written Comments<br />
Perform groundwater flow system analysis prior to designing<br />
tunnel<br />
Tunnel<br />
<strong>DC</strong> Council Pub<br />
Hearing Storage tunnels good first step Tunnel<br />
Study groundwater quality conditions & evaluate effect of<br />
tuinnels on ground water and surface water quality<br />
Tunnel<br />
8987 Yellow Brick<br />
Road Baltimore MD 21237 Written Comments Understand inflows & outflows of groundwater sysetm Tunnel<br />
2320 Wisconsin Washington <strong>DC</strong><br />
Where will tunnel muck be removed, won’t it cause a<br />
Ave., NW, #201 20007 Written Comments disruption<br />
Tunnel<br />
19 of 23
No. Last Name First name Affiliation Address 1 Address 2 Forum Comment Category<br />
Philadelphia, PA<br />
The recommended plan for the Rock Creek requires<br />
monitoring regulators for overflows. Connection of the Rock<br />
Creek Interceptor to the Potomac Tunnel may be required<br />
as a result. Is the Potomac Tunnel being sized to accept<br />
Tunnels<br />
366 Hanmer Rebecca EPA Reg 3 1650 Arch Street 19103 Written Comments the RC Interceptor flows initially<br />
367 Hanmer Rebecca EPA Reg 3 1650 Arch Street<br />
368 Hanmer Rebecca EPA Reg 3 1650 Arch Street<br />
369 Hanmer Rebecca EPA Reg 3 1650 Arch Street<br />
370 Hanmer Rebecca EPA Reg 3 1650 Arch Street<br />
371 Hanmer Rebecca EPA Reg 3 1650 Arch Street<br />
Anacostia 1st & Potomac<br />
372 Whitehead Damon Riverkeeper Avenue, SE<br />
Potomac Boat 3530 <strong>Water</strong> Street<br />
373 Cole Cynthia Club NW<br />
121 12th Street, SE<br />
#403<br />
374 Culp David CItizen<br />
Sustainable<br />
Community<br />
375 Schulman Jim Initiatives<br />
Anacostia<br />
376 Whitehead Damon Riverkeeper<br />
Anacostia<br />
377 Whitehead Damon Riverkeeper<br />
Larry and Anacostia<br />
Robert <strong>Water</strong>shed<br />
378 Silverman Boone Society<br />
379 Tibbetts David, A.<br />
Anacostia<br />
<strong>Water</strong>shed<br />
Society<br />
Treasurer<br />
631 E St NE<br />
1st & Potomac<br />
Avenue, SE<br />
1st & Potomac<br />
Avenue, SE<br />
4302 Baltimore<br />
Ave.<br />
4302 Baltimore<br />
Ave.<br />
What additional solids handling facilities will be included in Tunnels<br />
Philadelphia, PA<br />
19103 Written Comments<br />
the tunnel system and at Blue Plains to handle increased<br />
flows<br />
What cost estimation data was used to develop cost Tunnels<br />
estimates for installation of the proposed tunnels in <strong>DC</strong><br />
Philadelphia, PA<br />
What is WASA’s level of confidence in the cost estimates<br />
19103 Written Comments for the tunnels<br />
What degree of confidence does WASA have that the Tunnels<br />
tunnel sizing will be adequate to limit overflow events and<br />
avoid a situation such as that being experienced in<br />
Milwaukee where tunnels must be expanded due to<br />
continued CSO overflows and system backups. Has WASA<br />
Philadelphia, PA<br />
reviewed installation of tunnels in other cities and evaluated<br />
19103 Written Comments their problems and successes<br />
What measures will be taken in tunnel design &<br />
Tunnels<br />
Philadelphia, PA<br />
construction to monitor and control infiltration and<br />
19103 Written Comments exfiltration in the underground tunnels<br />
What preliminary geologic and hydrogeologic investigation Tunnels<br />
Philadelphia, PA<br />
has been done to determine feasibility and potential siting<br />
19103 Written Comments of underground storage tunnels<br />
Washington, <strong>DC</strong><br />
Changing WQS & the proposed LTCP would ban swimming<br />
20003 WASA Pub Hearing in perpetuity<br />
WQS<br />
Washington <strong>DC</strong><br />
20002 Written Comments Concern about changing WQS WQS<br />
Washington, <strong>DC</strong><br />
20003 Neigh Mtg#3 Don’t change WQS WQS<br />
Washington <strong>DC</strong><br />
20002 Questionnaire Don’t change WQS WQS<br />
Washington, <strong>DC</strong> <strong>DC</strong> Council Pub<br />
20003<br />
Hearing Don't change WQS WQS<br />
Washington, <strong>DC</strong><br />
20003 WASA Pub Hearing Don't change WQS WQS<br />
Bladensburg, MD<br />
20710 WASA Pub Hearing Don't change WQS WQS<br />
Bladensburg, MD<br />
20710 Written Comments Don't change WQS WQS<br />
380 Armsby Michelle Citizen #61 PO Box 18900 Rochester NY 14618 Written Comments Don't change WQS WQS<br />
121 12th Street, SE Washington, <strong>DC</strong><br />
381 Culp David Citizen #403<br />
20003 WASA Pub Hearing Don't change WQS WQS<br />
382 Forsberg Ken Citizen<br />
1809 Monroe St,<br />
NW<br />
Washington <strong>DC</strong><br />
20010 Questionnaire Don't change WQS WQS<br />
383 Ho Colisa Citizen<br />
7548 Clenmoor<br />
Lane<br />
Winter Park, FL<br />
32792 Written Comments Don't change WQS WQS<br />
20 of 23
No. Last Name First name Affiliation Address 1 Address 2 Forum Comment Category<br />
640-B Croissant PL Washington <strong>DC</strong><br />
384 Hurtt Harold A Citizen SE<br />
20019 Questionnaire Don't change WQS WQS<br />
Washington <strong>DC</strong><br />
385 Mack Geterrius Citizen 1430 L St SE, #509 20003 Written Comments Don't change WQS WQS<br />
386 Mayock Melanie Citizen<br />
501 Constitution<br />
Ave NE<br />
Washington <strong>DC</strong><br />
20003 Written Comments Don't change WQS WQS<br />
387 McCuran Elizabeth Citizen 216 K St, NE<br />
Washington <strong>DC</strong><br />
20003 Written Comments Don't change WQS WQS<br />
3723 Winfield Lane Washington <strong>DC</strong><br />
388 Mitchell Jeanene Citizen NW<br />
20007 Questionnaire Don't change WQS WQS<br />
389 Morgan James Citizen 4618 Bass Pl., SE Washington <strong>DC</strong> Questionnaire Don't change WQS WQS<br />
390 Nagi Suzanne Citizen<br />
4035 Highland Ct<br />
NW<br />
Washington <strong>DC</strong><br />
20008 Written Comments Don't change WQS WQS<br />
391 Niswander Ruth Citizen 623 Barbera Davis CA 95617 Written Comments Don't change WQS WQS<br />
Not<br />
392 Provided Not Provided Citizen Not Provided Not Provided Questionnaire Don't change WQS WQS<br />
393<br />
Not<br />
Provided Not Provided Citizen Not Provided Not Provided Questionnaire Don't change WQS WQS<br />
Washington <strong>DC</strong><br />
394 Saidman Amy Citizen 1871 Engleside 20010 Written Comments Don't change WQS WQS<br />
395 Sesil Joe Citizen 3421 N St NW Washington <strong>DC</strong> Questionnaire Don't change WQS WQS<br />
396 Tyler Joseph Citizen<br />
Georgetown<br />
University, Box<br />
573145<br />
Washington <strong>DC</strong><br />
20057 Written Comments Don't change WQS WQS<br />
397 Vogel Mary Citizen 3105 Crest Ave Cheverly Md 20785 Questionnaire Don't change WQS WQS<br />
398 Wells Jeffrey R. Citizen<br />
Andrew, and<br />
Paul Clean <strong>Water</strong><br />
399 Fellows Schwartz Action<br />
Clean <strong>Water</strong><br />
400 Woodworth James Campaign<br />
Clean <strong>Water</strong><br />
401<br />
Campaign<br />
D.C.<br />
Environmental<br />
402 Norouzi Parisa Network<br />
3730 Windom<br />
Place, NW<br />
4455 Connecticut<br />
Ave, NW, A-300<br />
NR<strong>DC</strong> 1200 New<br />
York Ave., NW<br />
NR<strong>DC</strong> 1200 New<br />
York Ave., NW<br />
403 New Gregory R.<br />
<strong>DC</strong> Federation<br />
of Civic<br />
Associations P.O. Box 4549<br />
1625 Mass. Ave,<br />
404 Baron David Earthjustice NW Suite 702<br />
Friends of the 1025 Vermont<br />
405 Blackwelder Brent Earth Avenue, NW<br />
406 Eisenhardt Julie<br />
407 Schulman Jim<br />
Sierra Club -<br />
Env. Justice<br />
Program<br />
Sustainable<br />
Community<br />
Initiatives<br />
1025 Vermont Washington <strong>DC</strong><br />
Avenue NW 3rd Flr 20005<br />
2568 Martin Luther<br />
King Jr. Ave, SE<br />
631 E St NE<br />
408 Hanmer Rebecca EPA Reg 3 1650 Arch Street<br />
Washington <strong>DC</strong><br />
20006 Written Comments Don't change WQS WQS<br />
Washington, <strong>DC</strong><br />
20008 WASA Pub Hearing Don't change WQS WQS<br />
Washington <strong>DC</strong> <strong>DC</strong> Council Pub<br />
20005<br />
Hearing Don't change WQS WQS<br />
Washington <strong>DC</strong><br />
20005 Written Comments Don't change WQS WQS<br />
<strong>DC</strong> Council Pub<br />
Hearing Don't change WQS WQS<br />
Washington <strong>DC</strong><br />
20017 Written Comments Don't change WQS WQS<br />
Washington <strong>DC</strong> <strong>DC</strong> Council Pub<br />
20036<br />
Hearing Don't change WQS WQS<br />
Washington, <strong>DC</strong><br />
20005 WASA Pub Hearing Don't change WQS WQS<br />
Washington <strong>DC</strong><br />
20020 Written Comments Don't Change WQS WQS<br />
Washington <strong>DC</strong><br />
20002 Written Comments Don't Change WQS WQS<br />
Philadelphia, PA<br />
How would implementation of the WQS currently proposed WQS<br />
19103 Written Comments by DOH affect the plan<br />
21 of 23
No. Last Name First name Affiliation Address 1 Address 2 Forum Comment Category<br />
Washington <strong>DC</strong><br />
Potable water is unsanitary, need higher WQS to have safe<br />
409 Miller Emily Citizen 4109 12th St, NE 20017 Written Comments drinking water<br />
WQS<br />
410 Baron David Earthjustice<br />
1625 Mass. Ave,<br />
NW Suite 702<br />
Washington <strong>DC</strong><br />
20036 Written Comments<br />
Primary contact & secondary contact are existing uses.<br />
WQS cannot legally be changed to interfere with existing<br />
uses.<br />
WQS<br />
411 Dwyer Stuart Citizen<br />
2113 N St NW<br />
#201<br />
Washington <strong>DC</strong><br />
20037 Questionnaire Supports changing WQS WQS<br />
Not<br />
412 Provided Not Provided Citizen Mt Pleasant Washington <strong>DC</strong> Questionnaire Supports changing WQS WQS<br />
413<br />
Not<br />
Provided Not Provided Citizen Not Provided Not Provided Questionnaire Supports changing WQS WQS<br />
414<br />
Not<br />
Provided Not Provided Citizen Not Provided Not Provided Questionnaire Supports changing WQS WQS<br />
5509 Chevy Chase<br />
415 Wrin Bob Citizen Pkwy, NW Washington <strong>DC</strong> Questionnaire Supports changing WQS WQS<br />
416<br />
Not<br />
Provided Not Provided Citizen Not Provided Not Provided Questionnaire<br />
Supports changing WQS - Some kind of recognition in<br />
water quality standards that allows a few overflows is OK WQS<br />
Anacostia 1st & Potomac Washington, <strong>DC</strong><br />
WASA could seek a variance from the WQS - they don't<br />
417 Whitehead Damon Riverkeeper Avenue, SE 20003 WASA Pub Hearing need to change them<br />
WQS<br />
418 Fitzpatrick Neil<br />
Audubon<br />
Naturalist<br />
Society<br />
8940 Jones Mill<br />
Road<br />
Chevy Chase, MD<br />
20815 WASA Pub Hearing<br />
WASA worked backwards - adjusted WQS to fit plan and<br />
did not try to meet stds<br />
WQS<br />
419 Whitehead Damon<br />
Anacostia<br />
Riverkeeper<br />
1st & Potomac<br />
Avenue, SE<br />
Washington, <strong>DC</strong><br />
20003 WASA Pub Hearing<br />
WASA worked backwards - WASA did not start off with a<br />
goal of achieving WQS<br />
WQS<br />
420 Altman Andrew<br />
Office of<br />
<strong>Plan</strong>ning<br />
801 N. Capitol St,<br />
NE Ste 4000<br />
Washington, <strong>DC</strong><br />
20002 Written Comments<br />
Consider collaborative efforts in public education, orphaned<br />
storm sewers, stomr water retention, LID<br />
Alternatives<br />
421 Altman Andrew<br />
Office of<br />
<strong>Plan</strong>ning<br />
801 N. Capitol St,<br />
NE Ste 4000<br />
Washington, <strong>DC</strong><br />
20002 Written Comments Support relocation of Main & O P.S., retain as option Alternatives<br />
422 Altman Andrew<br />
Office of<br />
<strong>Plan</strong>ning<br />
801 N. Capitol St,<br />
NE Ste 4000<br />
Washington, <strong>DC</strong><br />
20002 Written Comments<br />
Coordinate surface construction with Office of <strong>Plan</strong>ning,<br />
possibly integrate parks into designs<br />
Alternatives<br />
423 Wolflin John P.<br />
U.S. Fish &<br />
Wildlife<br />
Service<br />
177 Admiral<br />
Cochrane Drive Annapolis MD 21401 Written Comments<br />
Implementation of Draft LTCP will have no adverse effects<br />
on Endangered Speciaes and may be beneficial to them Misc<br />
424 Robinson Carole<br />
Arlington<br />
Boathouse<br />
Foundation,<br />
Inc.<br />
177 Admiral<br />
Cochrane Drive Annapolis MD 21401 Written Comments<br />
Potomac level of control is too low - design plan to virtually<br />
eliminate risk of overflows<br />
Level of <strong>Control</strong><br />
425 Curtis Doug<br />
National Park<br />
Service - Rock<br />
Creek Park N/A N/A Written Comments<br />
Piney Branch Tunnel - Want more details on construction<br />
methods, access locations, construction impacts to park,<br />
etc<br />
Tunnel<br />
426 Curtis Doug<br />
427 Wynkocp, Jr Samuel E.<br />
428 Wynkocp, Jr Samuel E.<br />
National Park<br />
Service - Rock<br />
Creek Park N/A N/A Written Comments<br />
Prince<br />
George's<br />
County<br />
Prince<br />
George's<br />
County<br />
Piney Branch Tunnel - Were other alignments considered,<br />
what is impact on groundwater, could LID decrease the<br />
size of proposed facilities<br />
Inglewood Center<br />
Three, 9400<br />
Peppercorn Place Largo MD 20774 Written Comments Concern about LTCP taking up Blue Plains capacity Blue Plains<br />
Inglewood Center<br />
Three, 9400<br />
Peppercorn Place Largo MD 20775 Written Comments<br />
Remove references to upstream contributors being a<br />
significant source of watershed impairment<br />
Tunnel<br />
Misc<br />
22 of 23
No. Last Name First name Affiliation Address 1 Address 2 Forum Comment Category<br />
Prince<br />
George's<br />
Inglewood Center<br />
Three, 9400<br />
What will be the effect of dewatering tunnels on Blue Plains,<br />
429 Wynkocp, Jr Samuel E. County Peppercorn Place Largo MD 20776 Written Comments performance, O & M costs, etc<br />
Blue Plains<br />
430 Wynkocp, Jr Samuel E.<br />
431 Wynkocp, Jr Samuel E.<br />
Prince<br />
George's<br />
County<br />
Prince<br />
George's<br />
County<br />
Inglewood Center<br />
Three, 9400<br />
Peppercorn Place Largo MD 20776 Written Comments<br />
Inglewood Center<br />
Three, 9400<br />
Peppercorn Place Largo MD 20776 Written Comments<br />
Questions use of IMA numbers for District given that District<br />
is above IMA allocation<br />
Blue Plains<br />
Consider opportunities for partnership with Federal ISTEA<br />
program, EPA 319 grants and others<br />
Misc<br />
432 Wynkocp, Jr Samuel E.<br />
Prince<br />
George's<br />
County<br />
Inglewood Center<br />
Three, 9400<br />
Peppercorn Place Largo MD 20776 Written Comments<br />
LID 0.5" assumption wrong, costs too high, did not consider<br />
timing, funding of LID wrong, time too long, maintenance<br />
costs are lower, ecommends an LID demonstration project<br />
LID/Source<br />
<strong>Control</strong><br />
433 Hanmer Rebecca EPA Reg 3 1650 Arch Street<br />
434 Hanmer Rebecca EPA Reg 3 1650 Arch Street<br />
435 Hanmer Rebecca EPA Reg 3 1650 Arch Street<br />
\\Gh-wash\ENG 1160\LTCP\LTCP Final\App F-Resp to Com\[Internal Com Sum.xls]Comments<br />
Philadelphia, PA<br />
19103 Written Comments<br />
Philadelphia, PA<br />
19103 Written Comments<br />
Philadelphia, PA<br />
19103 Written Comments<br />
It is unclear how benefits from LTCP implementation will<br />
translate to protection of designated and existing uses. How<br />
severe a storm will have to be to trigger overflows, and what<br />
the resultant water quality impacts will be (assuming of<br />
course that other point sources and NPS are controlled as<br />
envisioned in the BOD TMDL). 1. What magnitude storm<br />
[5 (or whatever) year storm, defined as so many inches per<br />
hour, for a given amount of time, spread over a defined<br />
area] will cause overflows to the Anacostia (post<br />
implementation of the draft LTCP) How severe would a<br />
storm have to be to result in sufficient overflows to exceed<br />
numeric water quality criteria How much of a CSO load<br />
would it take to cause such an exceedance 2. How many<br />
days of water body use, if any, do the models suggest would<br />
be lost in an average year to such exceedances (post<br />
implementation of the draft LTCP)3. Please repeat the<br />
above for the LTCP scenario suggested by DOH, in which<br />
there would be no overflows to the Anacostia in an average<br />
year.<br />
Level of <strong>Control</strong><br />
The LTCP should describe how much money will be needed<br />
to fund individual control plan elements based on the project<br />
schedule (Figure 12-4). Identify work that already has<br />
funding available (especially for the "early action items").<br />
Identify work on an approved CIP, and explain the<br />
significance of being included on the CIP (does that mean<br />
that funds are committed).<br />
Demonstrate how the recommended LTCP can be cost<br />
effectively expanded in accordance with the CSO Policy<br />
Financial<br />
Impacts<br />
Regulatory<br />
23 of 23
District of Columbia <strong>Water</strong> and <strong>Sewer</strong> Authority<br />
<strong>Combined</strong> <strong>Sewer</strong> <strong>System</strong> <strong>Long</strong> <strong>Term</strong> <strong>Control</strong> <strong>Plan</strong><br />
APPENDIX G<br />
Genera Manager’s Letter to WASA Board<br />
J:\1160\LTCP\LTCP Final\Report\App G-JNJ Letter\Appendix G.DOC FINAL – July 2002
DISTRICT OF COLUMBIA<br />
WATER AND SEWER AUTHORITY<br />
Serving the Public • Protecting the Environment<br />
www.dcwasa.com