PISCES biogeochemical model - NEMO
PISCES biogeochemical model - NEMO
PISCES biogeochemical model - NEMO

You also want an ePaper? Increase the reach of your titles
YUMPU automatically turns print PDFs into web optimized ePapers that Google loves.
where<br />
∆(O 2 ) = min<br />
(<br />
1, 0.4 6 − O )<br />
2<br />
O2 min + O 2<br />
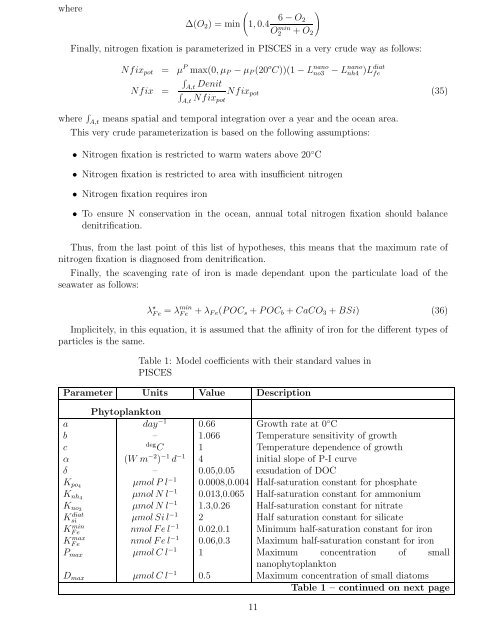
Finally, nitrogen fixation is parameterized in <strong>PISCES</strong> in a very crude way as follows:<br />
Nfix pot = µ P max(0, µ P − µ P (20 o C))(1 − L nano<br />
no3 − L nano<br />
nh4 )L diat<br />
fe<br />
∫<br />
A,t<br />
Nfix =<br />
Denit<br />
∫<br />
A,t Nfix Nfix pot (35)<br />
pot<br />
where ∫ A,t means spatial and temporal integration over a year and the ocean area.<br />
This very crude parameterization is based on the following assumptions:<br />
• Nitrogen fixation is restricted to warm waters above 20 ◦ C<br />
• Nitrogen fixation is restricted to area with insufficient nitrogen<br />
• Nitrogen fixation requires iron<br />
• To ensure N conservation in the ocean, annual total nitrogen fixation should balance<br />
denitrification.<br />
Thus, from the last point of this list of hypotheses, this means that the maximum rate of<br />
nitrogen fixation is diagnosed from denitrification.<br />
Finally, the scavenging rate of iron is made dependant upon the particulate load of the<br />
seawater as follows:<br />
λ ⋆ F e = λ min<br />
F e + λ F e (P OC s + P OC b + CaCO 3 + BSi) (36)<br />
Implicitely, in this equation, it is assumed that the affinity of iron for the different types of<br />
particles is the same.<br />
Table 1: Model coefficients with their standard values in<br />
<strong>PISCES</strong><br />
Parameter Units Value Description<br />
Phytoplankton<br />
a day −1 0.66 Growth rate at 0 ◦ C<br />
b – 1.066 Temperature sensitivity of growth<br />
c deg C 1 Temperature dependence of growth<br />
α (W m −2 ) −1 d −1 4 initial slope of P-I curve<br />
δ – 0.05,0.05 exsudation of DOC<br />
K po4 µmol P l −1 0.0008,0.004 Half-saturation constant for phosphate<br />
K nh4 µmol N l −1 0.013,0.065 Half-saturation constant for ammonium<br />
K no3 µmol N l −1 1.3,0.26 Half-saturation constant for nitrate<br />
Ksi diat µmol Si l −1 2 Half saturation constant for silicate<br />
KF min<br />
e nmol F e l −1 0.02,0.1 Minimum half-saturation constant for iron<br />
KF max<br />
e nmol F e l −1 0.06,0.3 Maximum half-saturation constant for iron<br />
P max µmol C l −1 1 Maximum concentration of small<br />
nanophytoplankton<br />
D max µmol C l −1 0.5 Maximum concentration of small diatoms<br />
Table 1 – continued on next page<br />
11