PISCES biogeochemical model - NEMO
PISCES biogeochemical model - NEMO
PISCES biogeochemical model - NEMO

You also want an ePaper? Increase the reach of your titles
YUMPU automatically turns print PDFs into web optimized ePapers that Google loves.
L nano<br />
nh4 =<br />
L nano<br />
K nano<br />
no3<br />
Knh4<br />
nano<br />
lim = min(L nano<br />
po4<br />
K nano<br />
no3 NH 4<br />
+ K nano<br />
nh4<br />
, L nano<br />
F e<br />
, L nano<br />
no3<br />
NO 3 + Kno3 nano NH 4<br />
+ L nano<br />
nh4 ) (3)<br />
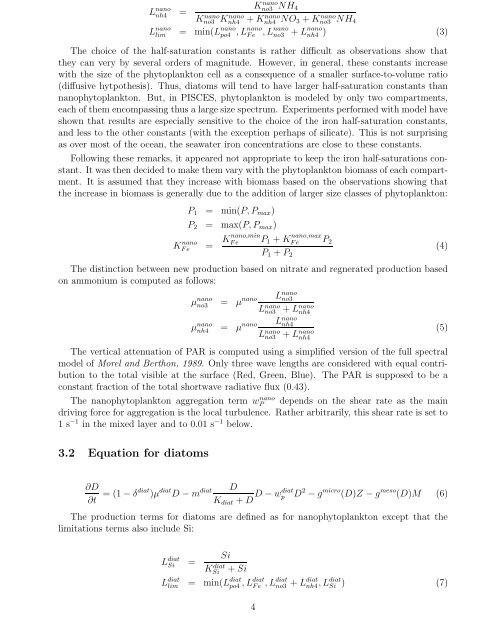
The choice of the half-saturation constants is rather difficult as observations show that<br />
they can very by several orders of magnitude. However, in general, these constants increase<br />
with the size of the phytoplankton cell as a consequence of a smaller surface-to-volume ratio<br />
(diffusive hytpothesis). Thus, diatoms will tend to have larger half-saturation constants than<br />
nanophytoplankton. But, in <strong>PISCES</strong>, phytoplankton is <strong>model</strong>ed by only two compartments,<br />
each of them encompassing thus a large size spectrum. Experiments performed with <strong>model</strong> have<br />
shown that results are especially sensitive to the choice of the iron half-saturation constants,<br />
and less to the other constants (with the exception perhaps of silicate). This is not surprising<br />
as over most of the ocean, the seawater iron concentrations are close to these constants.<br />
Following these remarks, it appeared not appropriate to keep the iron half-saturations constant.<br />
It was then decided to make them vary with the phytoplankton biomass of each compartment.<br />
It is assumed that they increase with biomass based on the observations showing that<br />
the increase in biomass is generally due to the addition of larger size classes of phytoplankton:<br />
P 1 = min(P, P max )<br />
P 2 = max(P, P max )<br />
KF nano<br />
e = Knano,min F e<br />
P 1 + K nano,max<br />
F e P 2<br />
(4)<br />
P 1 + P 2<br />
The distinction between new production based on nitrate and regnerated production based<br />
on ammonium is computed as follows:<br />
no3 = µ nano L nano<br />
no3<br />
L nano<br />
no3 + L nano<br />
nh4<br />
nh4 = µ nano L nano<br />
nh4<br />
L nano<br />
no3 + L nano<br />
nh4<br />
µ nano<br />
µ nano<br />
The vertical attenuation of PAR is computed using a simplified version of the full spectral<br />
<strong>model</strong> of Morel and Berthon, 1989. Only three wave lengths are considered with equal contribution<br />
to the total visible at the surface (Red, Green, Blue). The PAR is supposed to be a<br />
constant fraction of the total shortwave radiative flux (0.43).<br />
The nanophytoplankton aggregation term wP<br />
nano depends on the shear rate as the main<br />
driving force for aggregation is the local turbulence. Rather arbitrarily, this shear rate is set to<br />
1 s −1 in the mixed layer and to 0.01 s −1 below.<br />
3.2 Equation for diatoms<br />
(5)<br />
∂D<br />
∂t = (1 − δdiat )µ diat D − m diat D<br />
K diat + D D − wdiat p D 2 − g micro (D)Z − g meso (D)M (6)<br />
The production terms for diatoms are defined as for nanophytoplankton except that the<br />
limitations terms also include Si:<br />
L diat<br />
Si =<br />
K diat<br />
Si<br />
Si<br />
+ Si<br />
L diat<br />
lim = min(Ldiat po4 , Ldiat F e , Ldiat no3 + Ldiat nh4 , Ldiat Si ) (7)<br />
4