Belgian onshore and offshore wind energy - Edora
Belgian onshore and offshore wind energy - Edora
Belgian onshore and offshore wind energy - Edora

Create successful ePaper yourself
Turn your PDF publications into a flip-book with our unique Google optimized e-Paper software.
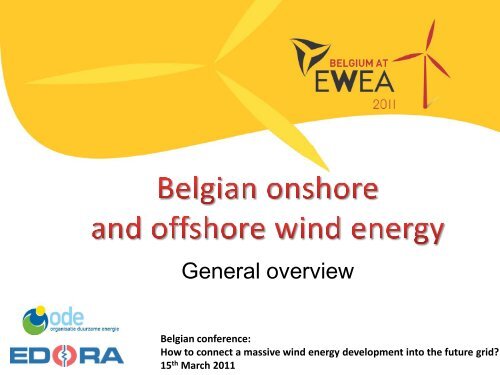
General overview<br />
<strong>Belgian</strong> conference:<br />
How to connect a massive <strong>wind</strong> <strong>energy</strong> development into the future grid<br />
15 th March 2011
Electricity production mix<br />
0,50%<br />
Currently, <strong>wind</strong><br />
farms production<br />
covers about 2,5%<br />
of the <strong>Belgian</strong><br />
electricity<br />
production<br />
6,50%<br />
31%<br />
8,40%<br />
53,70%<br />
Nuclear<br />
Gas<br />
Solid fuels<br />
Liquid fuels<br />
Renewables<br />
SPF Economie, Gross electricity<br />
production in 2008
Feb 2011<br />
Installed<br />
capacity<br />
(MW)<br />
Estimated<br />
production<br />
(GWh/y)<br />
Household<br />
consumption<br />
equiv<br />
CO2 emission<br />
prevention (MT)<br />
Onshore<br />
Wallonia 442 972 277.829 0,443<br />
Onshore<br />
Fl<strong>and</strong>ers 264 581 165.943 0,265<br />
Onshore<br />
Total 706 1.553 443.771 0,708<br />
Offshore 195 644 183.857 0,293<br />
Total 901 MW 2.197 GWh/y 627.629 1,002 MT
MW of <strong>wind</strong> <strong>energy</strong> capacity in Belgium<br />
1000<br />
900<br />
800<br />
700<br />
600<br />
500<br />
400<br />
300<br />
200<br />
100<br />
0<br />
Wind installation exponential growth<br />
during the last decennia<br />
1994 1996 1998 2000 2002 2004 2006 2008 2010 2012<br />
APERe, 2011
MW of <strong>wind</strong> <strong>energy</strong> capacity per 1000 km2 (2010)<br />
100,0<br />
90,0<br />
80,0<br />
70,0<br />
60,0<br />
50,0<br />
40,0<br />
30,0<br />
20,0<br />
10,0<br />
0,0<br />
<strong>Belgian</strong> installed <strong>wind</strong> capacity<br />
in EU perspective (2010)<br />
DK DE NL PT ES BE UK IE EU IT LU AT FR EL CY SE PL EE BG HU CZ LT RO FI LV SK SI MT<br />
1. Higher BE <strong>wind</strong> capacity/km 2 than EU average<br />
2. BE in top4 EU countries for <strong>offshore</strong> <strong>wind</strong> capacity<br />
EWEA, 2011
KW of <strong>wind</strong> <strong>energy</strong> capacity per 1000 inhab.(2010)<br />
800,0<br />
700,0<br />
600,0<br />
500,0<br />
400,0<br />
300,0<br />
200,0<br />
100,0<br />
0,0<br />
3. Lower BE <strong>wind</strong> capacity/inhabitants than EU average<br />
<strong>Belgian</strong> installed <strong>wind</strong> capacity<br />
in EU perspective (2010)<br />
DK ES PT IE DE SE EU NL AT EE EL CY IT FR UK BE LU BG LT FI HU PL RO CZ LV SK SI MT<br />
EWEA, 2011
27% renewable electricity is<br />
feasible in 2020<br />
More than 50% of renewable<br />
electricity provided by <strong>wind</strong><br />
Wind <strong>energy</strong> = 4,8 million<br />
household equivalent<br />
Wind <strong>energy</strong> = ¼ of a BE -20%<br />
GHG emission reduction target<br />
covered by <strong>wind</strong> (ref. 1990)<br />
Projections<br />
EDORA/ODE RES-E potential for 2020<br />
2020 MW GWh/y<br />
Wind <strong>onshore</strong> 3.500 7.700<br />
Wind <strong>offshore</strong> 2.825 9.061<br />
PV 3.440 2.924<br />
Biomassa 1.703 8.873<br />
Geothermal 59 494<br />
Hydro 157 480<br />
Total 11.685 29.532<br />
Reference: total <strong>Belgian</strong> installed<br />
capacity for electricity generation in<br />
2010 was 16.000 MW
Wind electricity share potential<br />
2,50%<br />
2011 2020<br />
15,70%<br />
2050<br />
97,50%<br />
Wind<br />
Others<br />
84,30%<br />
50%<br />
50% <br />
The 2020 targets are socio-economically feasible,<br />
it only requires adapted political measures.<br />
EDORA/ODE projections
2010 installations <strong>and</strong> projections<br />
2010 (MW) 2010 growth rate Cumul (MW) 2020 project. (MW)<br />
Fl<strong>and</strong>ers 20 7,80% 264 1500<br />
Wallonia 164 58,80% 442 2000<br />
Total 184 34,50% 706 3500<br />
New opportunity to build in agricultural regions from 2009<br />
on in Fl<strong>and</strong>ers will boost installations from 2011.<br />
Major constraints<br />
• Grid development (see panel discussions)<br />
• Aeronautical constraints<br />
• Environmental constraints<br />
• Administrative constraints
Aeronautical<br />
constraints
Aeronautical constraints : political dem<strong>and</strong>s<br />
• Defense protection zones impact the <strong>wind</strong> farm building in huge territories<br />
(e.g. 40% of Wallonia)<br />
Redesign the military training exclusion zones<br />
• New eurocontrol guidelines allow <strong>wind</strong> farm plants until 500m from a radar<br />
(under conditions)<br />
Military authorities <strong>and</strong> Belgocontrol must apply the Eurocontrol<br />
guidelines<br />
•Airport zones<br />
Military authorities <strong>and</strong> Belgocontrol must redesign CTR <strong>and</strong> refine<br />
the impact assessment of <strong>wind</strong>farms in CTR
Walloon <strong>onshore</strong> <strong>wind</strong> specificities<br />
• One-stop shop<br />
• Efficient support system based on green certificates <strong>and</strong> quota system<br />
Necessity to maintain an efficient <strong>and</strong> predictable support<br />
system<br />
• Environmental constraints<br />
Necessity to allow <strong>wind</strong> farms in the vicinity of the forest line<br />
<strong>and</strong> inside the forest under clear <strong>and</strong> scientific rules (EIE<br />
clarification)
Walloon <strong>onshore</strong> <strong>wind</strong> specificities<br />
• Opportunity of a new <strong>wind</strong> <strong>energy</strong> regulation framework<br />
The new framework expected in 2011 (« cadre de référence<br />
éolien ») must be linked to ambitious <strong>wind</strong> installation targets <strong>and</strong><br />
to watering down of existing constraints (federal + regional ones)<br />
• Opportunity of an ambitious renewable <strong>energy</strong> <strong>and</strong> a pro-active renewable<br />
electricity targets<br />
Wallonia pledges to reach 20% RES consumption by 2020 (compared to the<br />
13% BE m<strong>and</strong>atory target)<br />
Wallonia pledges to reach at least 8 TWh/y of renewable electricity in 2020
Échantillon total : riverains et non riverains petites localités et zones rurales<br />
Marge d’erreur de 2,2%<br />
Walloon <strong>onshore</strong> <strong>wind</strong> specificities<br />
Major support from <strong>wind</strong> farm neighbors<br />
(opinion poll IPSOS – error margin: 2,2%)<br />
86% of the <strong>wind</strong>farm neighbors support <strong>wind</strong> <strong>energy</strong><br />
Q. 1 Globalement quelle est votre opinion par rapport à l’énergie éolienne <br />
Base : échantillon total riverains + non riverains<br />
habitant des petites localités et des<br />
zones rurales – n=1000<br />
Favorable<br />
86%<br />
Marge d’erreur :<br />
83,8%
Walloon <strong>onshore</strong> <strong>wind</strong> specificities<br />
Wind farm neighbors positiveness increases by 40% after living nearby <strong>wind</strong> turbines<br />
Q.13) Avant que vous ne deveniez riverain d’un parc<br />
éolien, quelle était votre opinion générale par<br />
rapport à l’énergie éolienne <br />
Q.1)<br />
Base : riverains qui ont vu un parc s’installer près de chez eux – n=432<br />
Globalement quelle est votre opinion par rapport<br />
à l’énergie éolienne <br />
Marge d’erreur de 4,7%<br />
Opinion<br />
favorable<br />
62%<br />
Opinion<br />
favorable<br />
86%<br />
Opinion<br />
défavorable<br />
5%<br />
Opinion<br />
défavorable<br />
5%<br />
Pas d'opinion<br />
31%<br />
Pas d'opinion<br />
8%<br />
Ne se rappelle<br />
pas<br />
2%<br />
NSP/SR<br />
1%
Flemish <strong>onshore</strong> <strong>wind</strong> specificities<br />
• Net installed in 2010: 7 turbines or 19,9 MW<br />
• Background: administrative barriers<br />
• 2009: political decision – rural area available for turbines<br />
• Prospects 2011: 45 turbines or 100 MW<br />
Politics can make a huge change !
Flemish <strong>onshore</strong> <strong>wind</strong> specificities<br />
Ambitious goals, political support<br />
• 1500 MW by 2020<br />
• Strong focus on grid development<br />
• One stop shop<br />
• A suitable system of green certificates<br />
• Clear priorities in spatial planning<br />
• Guidelines for environmental <strong>and</strong> safety issues in Vlarem<br />
• Positive communication
<strong>Belgian</strong> <strong>offshore</strong> <strong>wind</strong> status <strong>and</strong> perspectives<br />
Installed capacity:<br />
Year 2009 2010<br />
Total installed 30 MW 195 MW<br />
• 2015: + 580 MW<br />
2020: 2825 MW (REPAP)<br />
• BE in Top 4 of EU countries for <strong>offshore</strong> <strong>wind</strong> <strong>energy</strong> capacity
<strong>Belgian</strong> <strong>offshore</strong> <strong>wind</strong> status <strong>and</strong> perspectives
<strong>Belgian</strong> <strong>offshore</strong> <strong>wind</strong> specificities<br />
• Grid reinforcements, short <strong>and</strong> long term<br />
• Offshore connection point<br />
• North Sea grid<br />
• Onshore grid reinforcement<br />
• Compensate lost area of 7 th concession<br />
• New <strong>offshore</strong> <strong>wind</strong> <strong>energy</strong> zones<br />
• Stable support system to attract investment<br />
• Plan logistical support <strong>and</strong> space in ports to avoid bottlenecks<br />
during construction
<strong>Belgian</strong> <strong>wind</strong> <strong>energy</strong> must power the future<br />
• Wind can deliver a lot of electricity in the future, up to 50% of the<br />
renewable electricity in 2020<br />
• 2000 : 0,01 % <strong>wind</strong> <strong>energy</strong> power share<br />
• 2011 : 2,5 % <strong>wind</strong> <strong>energy</strong> power share<br />
• 2020 : 15,7 % <strong>wind</strong> <strong>energy</strong> power share<br />
• To reach this goal:<br />
• Reinforcement of grids + stimulating rules for grid connection <strong>and</strong><br />
injection<br />
• Reduce administrative barriers<br />
• Suitable <strong>and</strong> predictable green certificates system<br />
• Reduce <strong>and</strong> clarify aeronautical <strong>and</strong> environmental constraints<br />
Together we can make the future
The slides will be available<br />
on www.edora.be <strong>and</strong> www.ode.be<br />
Thank you for you attention