Misr J. Ag. Eng., 26(3) - Misr Journal Of Agricultural Engineering ...
Misr J. Ag. Eng., 26(3) - Misr Journal Of Agricultural Engineering ...
Misr J. Ag. Eng., 26(3) - Misr Journal Of Agricultural Engineering ...

Create successful ePaper yourself
Turn your PDF publications into a flip-book with our unique Google optimized e-Paper software.
<strong>Misr</strong> J. <strong>Ag</strong>. <strong>Eng</strong>., <strong>26</strong>(3): 1223- 1244<br />
IRRIGATION AND DRAINAGE<br />
PERFORMANCE OF LANDSCAPEING IRRIGATION<br />
SYSTEMS UNDER TREATED SEWAGE WATER<br />
CONDITIONS<br />
Aboamera, M.A (1) Gomaa, A.H (1) Atta, Y.M.M (2)<br />
ABSTRACT<br />
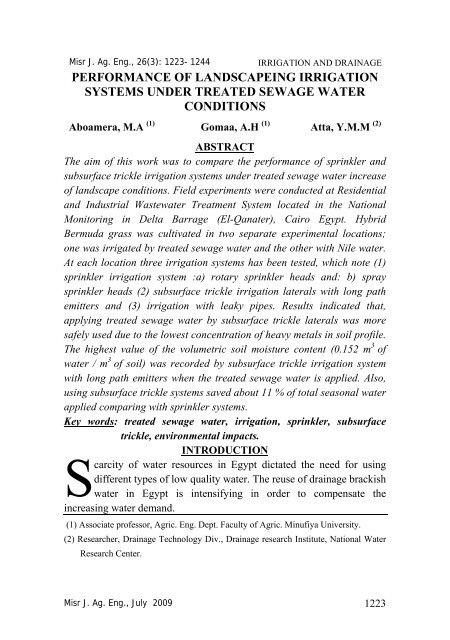
The aim of this work was to compare the performance of sprinkler and<br />
subsurface trickle irrigation systems under treated sewage water increase<br />
of landscape conditions. Field experiments were conducted at Residential<br />
and Industrial Wastewater Treatment System located in the National<br />
Monitoring in Delta Barrage (El-Qanater), Cairo Egypt. Hybrid<br />
Bermuda grass was cultivated in two separate experimental locations;<br />
one was irrigated by treated sewage water and the other with Nile water.<br />
At each location three irrigation systems has been tested, which note (1)<br />
sprinkler irrigation system :a) rotary sprinkler heads and: b) spray<br />
sprinkler heads (2) subsurface trickle irrigation laterals with long path<br />
emitters and (3) irrigation with leaky pipes. Results indicated that,<br />
applying treated sewage water by subsurface trickle laterals was more<br />
safely used due to the lowest concentration of heavy metals in soil profile.<br />
The highest value of the volumetric soil moisture content (0.152 m 3 of<br />
water / m 3 of soil) was recorded by subsurface trickle irrigation system<br />
with long path emitters when the treated sewage water is applied. Also,<br />
using subsurface trickle systems saved about 11 % of total seasonal water<br />
applied comparing with sprinkler systems.<br />
Key words: treated sewage water, irrigation, sprinkler, subsurface<br />
trickle, environmental impacts.<br />
INTRODUCTION<br />
Scarcity of water resources in Egypt dictated the need for using<br />
different types of low quality water. The reuse of drainage brackish<br />
water in Egypt is intensifying in order to compensate the<br />
increasing water demand.<br />
(1) Associate professor, <strong>Ag</strong>ric. <strong>Eng</strong>. Dept. Faculty of <strong>Ag</strong>ric. Minufiya University.<br />
(2) Researcher, Drainage Technology Div., Drainage research Institute, National Water<br />
Research Center.<br />
<strong>Misr</strong> J. <strong>Ag</strong>. <strong>Eng</strong>., July 2009 1223
Due to the use of low quality water, irrigation needs to be managed with<br />
highly and effective conditions in order to prevent salt build up in soils<br />
with low natural salinity that effect on the crop yield and<br />
environment.Use of marginal quality water requires more complex<br />
management practices and more stringent monitoring than when good<br />
quality water is used (Pescod, 1992).<br />
Martijin and Huibers (2001) reported that, pressurized irrigation methods<br />
that may be applicable with treated wastewater can be classified into<br />
localized irrigation (Drip and bubbler) and sprinkler irrigation (Gun<br />
sprinkler and center pivot).<br />
Shelef (1977) pointed out that, the higher the level of treatment, the<br />
higher the quality of the effluent and consequently, its value. However, a<br />
more advanced treatment involves higher costs for construction,<br />
maintenance, operation and energy consumption, and the costs rise<br />
steeply with each advance in treatment level. Primary treatment removes<br />
coarse organic and inorganic solids, grease and oils from wastewater by<br />
screening settling and flotation processes. Secondary treatment involves<br />
both aerobic and anaerobic biological processes, in which organic matter<br />
in the wastewater is decomposed or oxidized by microorganisms. Tertiary<br />
treatment, employing chlorination micro screening or filtration,<br />
coagulation, precipitation and activated carbon adsorption, further<br />
removes suspended particles, biological oxygen demand BOD, nutrients,<br />
eutrophication factors and turbidity, and virtually eliminates residual<br />
pathogens. Quaternary or advanced treatment aims at upgrading the<br />
effluent to the level of fresh potable water and employs techniques such<br />
as ultra filtration, ion exchange, reverse osmosis, electro dialysis or<br />
distillation, by which any undesirable constituent including excess salinity<br />
can be removed from the water.<br />
Asano (1998) reported that, for effluent sprinkler irrigation system, it is<br />
recommended to select low sprinklers with low pressure nozzles.<br />
However it recommended to irrigate during periods of low wind velocity<br />
and during hours when people are least expected in the vicinity of the<br />
irrigated field.. During hot weather, sprinkler irrigation, particularly when<br />
using high salinity water, may cause leaf burn. Hence irrigation at night<br />
when evaporation is low is preferable.<br />
<strong>Misr</strong> J. <strong>Ag</strong>. <strong>Eng</strong>., July 2009 1224
El-Sayed (1997) showed that, the unpolluted water typically have 2 mg/l<br />
of Biological Oxygen Demand (BOD). Raw sewage has 600mg/l of BOD,<br />
whereas the treated sewage effluents have BOD values ranged between<br />
20 to 100 mg/l depending on the level of treatment. Chemical Oxygen<br />
Demand (COD) is widely used as a measure of the sensitivity to oxidation<br />
of the organic and inorganic materials, which are present in water bodies<br />
and effluent from sewage and industrial plants. The high (COD/BOD)<br />
ratio could be an indicator of presence of toxins. The ratio of sewage is<br />
usually about 2:1. The concentration of COD observed in surface water<br />
ranges from 20 mg/l or less in unpolluted water to greater than 200 mg/l<br />
in water receiving effluents.<br />
Shuval et al (1986) suggested high levels of immunity against most<br />
viruses endemic in the community essentially block environmental<br />
transition by wastewater reuse (FAO1992). This basically depends the<br />
world health Organization WHO, (1989) guidelines but does not consider<br />
what happens when cultivated crops are exported outside of the<br />
community . Labeling of produce, to identify the quality of water used for<br />
its irrigation, is not common practice (after Shiekh et al 1998).<br />
The objective of this research was to compare the performance of both<br />
sprinkler and subsurface trickle irrigation systems under treated sewage<br />
water for irrigating of landscape and their performance under Nile water.<br />
The comparison was concerned with crop water requirement, volumetric<br />
soil moisture content distribution, accumulation of salts in soil profile and<br />
environmental impacts due to applying treated sewage water on both the<br />
cultivated soil and the growing plant.<br />
MATERIALS AND METHODS<br />
Field experiments were carried out at Residential and Industrial<br />
Wastewater Treatment plant which located in the National Monitoring in<br />
Delta Barrage (El-Kanater), Cairo Egypt. The experimental area was<br />
planted by Hybrid Bermuda grass and divided into two main separate<br />
experiments; each was located at a separate site. First site was irrigated by<br />
treated sewage water and the second by Nile water. The area of each<br />
experiment was divided into four treatments and in each individual<br />
treatment, an irrigation system was constructed. Consequently, the<br />
<strong>Misr</strong> J. <strong>Ag</strong>. <strong>Eng</strong>., July 2009 1225
differentiation between the performance of the three tested systems of<br />
irrigation either with Nile water or with treated sewage one will support<br />
the suitable irrigation system to be used with treated sewage water. The<br />
three irrigation systems has been tested, which note (1) sprinkler<br />
irrigation system :a) rotary sprinkler heads and (b) spray sprinkler heads<br />
(2) subsurface trickle irrigation laterals with long path emitters and (3)<br />
irrigation with leaky pipes<br />
1. Treatment plant<br />
Purification of sewage water passes through a number of treatment units<br />
which is so called treatment plant: and it deals with both industrial<br />
wastewater and domestic sewage effluent. The treatment plant includes<br />
two separate treatment units, one is chemical treatment unit and the other<br />
is treatment plant of sewage water.<br />
The chemical treatment unit consists of the following components in<br />
arrange.<br />
a) Equalization tank: used just to collect wastewater without<br />
sedimentation of contaminated chemicals,<br />
b) Chemical mixing tank: the function of this tank is to collect<br />
wastewater to be injected with both chemical solutions and alkaline,<br />
c) Settling tank: separate the periodical sedimentation from the<br />
wastewater,<br />
d) Service tank: adjust the value of pH of wastewater and<br />
e) Metoxy reactors: absorb heavy metals from wastewater.<br />
The sewage treatment unit consists of the following components in<br />
arrange.<br />
a. Receiving tank: used just to collect sewage water and industrial<br />
wastewater after passes in the chemical unit,<br />
b. Bioxy biological tractors tower: the tower is constructed for<br />
biological oxidation,<br />
c. Bioxy biological reactors: carrying out the interaction between the<br />
survivals bacteria which exist in the bioxy media and the mixed<br />
effluent,<br />
d. Service tank: the water passes from the biological reactors to this<br />
tank to be pumped to the biofilter,<br />
<strong>Misr</strong> J. <strong>Ag</strong>. <strong>Eng</strong>., July 2009 12<strong>26</strong>
e. Biofilter: the biofilter filled with bioxy media in small size to insure<br />
the biological filtration for the water pumped to the biofilter,<br />
f. Chlorination: the water injected with chlorine solution after delivers<br />
from the biofilter and<br />
g. De-chlorination: water pulled through two pumps after chlorination<br />
and passes to a carbon filter to reduce the concentration of chlorine in<br />
the water before delivered to the irrigation system.<br />
Water pumped form the sewage treatment unit was treated and its<br />
chemical analysis was listed in Table (1) which represents the chemical<br />
analysis of untreated sewage water, treated sewage water and Nile water.<br />
The analysis was concerned with the contamination of physicochemical,<br />
major anions, and cations, microbiological parameters and the trace<br />
elements .<br />
2. Layout of the tested irrigation systems<br />
The total experimental area of the rotary sprinkler irrigation system was<br />
900 m 2 (30 m * 30 m) and was 324 m 2 (18 m * 18 m) for the spray<br />
sprinkler irrigation system. For the subsurface system (long path emitters)<br />
and the irrigation with leaky system, each consists of eight laterals with<br />
25m long and spaced 50cm apart. The laterals were provided by the<br />
required number of emitters at a distance of 25cm and were buried at a<br />
depth of 20 cm beneath the soil surface. The value of the emission<br />
uniformity (EU) for the two systems was laboratory estimated and it was<br />
96% for the long path emitters and was 97 % for the leaky pipes laterals.<br />
Figures (1 and 2) illustrate the tested field irrigation systems under treated<br />
sewage water delivered from the treatment plan and the Nile water. For<br />
both rotary and spray sprinkler irrigation equipments, the spacing<br />
between sprinkler heads was selected according to the value of<br />
Christiansen coefficient of uniformity (CU) based on the low quarter<br />
values of the collected water which was measured prior with sewage<br />
treated water and it was 84 % for rotary sprinkler head and 80 % for spray<br />
sprinkler heads at 200 kPa of the operating pressure. This was obtained<br />
with an overlapping percent of 65 % for the two sprinkler heads. The<br />
calculated spacing between sprinkler heads in case of rotary sprinkler<br />
irrigation system was 10 m and also was 10 m between laterals; hence the<br />
sprinkler heads were arranged in square vertices. In case of spray<br />
<strong>Misr</strong> J. <strong>Ag</strong>. <strong>Eng</strong>., July 2009 1227
sprinkler irrigation system, the spacing between sprinkler heads and<br />
lateral lines was 6m.<br />
Sprinkler Irrigation System<br />
Rotary Sprinkler<br />
Lateral Line (32mm)<br />
Spray Sprinkler<br />
Lateral Line (32mm)<br />
Pressure<br />
Relief valve<br />
Gauge<br />
Chemical treatment<br />
plant unit<br />
Pump<br />
Screen Filter<br />
( 150 mesh)<br />
Sand Filter<br />
sub-main Line( 63 mm)<br />
Main Line( 63 mm)<br />
control unit<br />
Lateral Line (32 mm)<br />
Emitter (Long Path)<br />
Leakage Pipe<br />
Lateral Line (32 mm)<br />
Emitter (Long Path)<br />
Subsurface irrigation system (Long path emitter)<br />
Leakage Pipe<br />
Leakage irrigation system<br />
Sewage treatment<br />
Figure (1): Experimental irrigation systems irrigated under treated sewage<br />
water.<br />
Sprinkler Irrigation System<br />
Rotary Sprinkler<br />
Lateral Line (32mm)<br />
Spray Sprinkler<br />
Lateral Line (32mm)<br />
Nile River<br />
Pressure<br />
Relief valve<br />
Gauge<br />
Pump<br />
Screen Filter<br />
( 150 mesh)<br />
Sand Filter<br />
sub-main Line( 63 mm)<br />
Main Line( 63 mm)<br />
control unit<br />
Lateral Line (32 mm)<br />
Emitter (Long Path)<br />
Leakage Pipe<br />
Lateral Line (32 mm)<br />
Emitter (Long Path)<br />
Subsurface irrigation system (Long path emitter)<br />
Leakage Pipe<br />
Leakage irrigation system<br />
Figure (2): Field experimental irrigation systems under Nile water.<br />
<strong>Misr</strong> J. <strong>Ag</strong>. <strong>Eng</strong>., July 2009 1228
Table(1):Chemical analysis of untreated sewage water, treated<br />
sewage water and Nile water.<br />
Water type<br />
Physicochemical parameters<br />
Major cation<br />
EC<br />
(dS/cm)<br />
pH<br />
CO 3<br />
--<br />
(mg/l)<br />
HCO 3<br />
-<br />
(mg/l)<br />
TDS (mg/l)<br />
Ca ++<br />
(mg/l)<br />
K +<br />
(mg/l)<br />
Mg ++<br />
(mg/l)<br />
Na + (mg/l)<br />
Untreated sewage<br />
0.96 7.50 --- 280 545<br />
69 11.36 22.6 79.88<br />
Treated sewage (second<br />
treatment)<br />
Nile water<br />
Water type<br />
Untreated sewage<br />
Treated sewage<br />
Nile water<br />
0.85 7.82 --- 280 546<br />
0.30 8.20 --- 280 212<br />
Major anions<br />
Cl - No - 2 No - 3 Po -- 4<br />
--<br />
So 4<br />
0.2 80.64 0.51 39.62 < 93.72<br />
0.2 80.54 3.47 40.00
3. Calculations of the crop water requirements and field water<br />
supply.<br />
The CROPWAT program based on windows version 4.3 (FAO 1998),<br />
which uses Penman-Monteith method for calculating the reference<br />
evapotranspiration (ET 0 ) and published by FAO (1992), was used for<br />
estimating the daily crop water requirement and field water supply. The<br />
program uses a flexible menu system and file handling with extensive use<br />
of graphics. Graphics of the input data (climate and cropping pattern) and<br />
the output results (crop water requirement, and soil moisture deficit) can<br />
be drown and printed with ease.<br />
4. Detection of Soil and plant analysis chemical concentration.<br />
The concentration of soluble cations and anions in soil sample were<br />
determined in the extract of the soil sample with ratio 1:2.5 of soil to<br />
water. The cations were determined using Inductively Coupled Plasma<br />
(ICP) and the anions were determined using Ion Chromatography (IC).<br />
Major anions such as chloride (Cl), nitrite (NO 2 ), nitrates ( NO 3 ),<br />
phosphate (PO 4 ) and Sulphate (SO 4 ) were determined using Ion<br />
Chromatography (IC). While Carbonate (CO 3 ) and bicarbonate (HCO 3 )<br />
were determined by titration method using 0.02 of NH 2 CO 3 with<br />
phenolphthalein and methyl orange as indicators.<br />
Major cations such as boron (b), calcium (Ca), potassium (K), magnesium<br />
(Mg) and sodium (Na) in addition to heavy metals such as Arsenic (As),<br />
chromium (Cr), copper (Cu), iron (Fe), nickel (Ni), lead (Pb) and zinc<br />
(Zn) were determined using the Inductively Coupled Plasma – Emission<br />
spectrometry (ICP – ES) with Ultra Sonic Nobulizer (USN). This<br />
Nebulizer decrease the instrumental detection limits by 10%. Soil sample<br />
were filtered by filtration system through membrane filter of pore size<br />
0.45 micrometer before analysis.<br />
As mentioned, before the analysis of plant samples was carried out for<br />
measuring total coliform density (TCD) and fecal coliform density (FCD)<br />
in addition to measuring the concentration of heavy metals in both leaves<br />
roots. Total coliform density (TCD) and fecal coliform density (FCD)<br />
were determined using membrane filter technique according to standard<br />
method No.9222B (APHA, 1992). Both TCD and FCD were measured in<br />
100 ml of filtered sample.<br />
<strong>Misr</strong> J. <strong>Ag</strong>. <strong>Eng</strong>., July 2009 1230
RESULTS AND DISCUSSION<br />
1. Crop water requirement (ETc), crop coefficient (Kc) and field<br />
water supply (FWS)<br />
Figure (3) represents the trend of monthly changing of the output results<br />
of CROP WAT program, which is field water supply (FWS), crop<br />
evapotranspiration (ETc), and the crop coefficient (Kc) in addition to the<br />
reference evapotranspiraion (ET 0 ) recorded at each experimental location.<br />
The value of field water supply for the four tested systems of irrigation<br />
depended upon the measured value of the irrigation application efficiency<br />
of the system (Ea). The measured application efficiency for sprinkler<br />
irrigation systems was 80% with both rotary and spray sprinkler heads,<br />
and was 90% for the subsurface trickle irrigation system with long path<br />
emitters and also for irrigation with leaky pipes. The data presented in<br />
figure (3) showed that, the peak monthly field water supply (FWS) was<br />
211.41 mm/month observed with sprinkler irrigation systems in July, the<br />
lowest was 35.31 mm/month observed with subsurface trickle system and<br />
leaky pipes laterals in December. The trend of changing the value of crop<br />
coefficient (Kc) reflects the four known growing stages of Bermuda<br />
grass; (initial stage, crop development, mid-season and harvesting),<br />
however the average value of (Kc) for each stage was not greatly<br />
changed. The figure also showed that, the monthly plant water<br />
requirement (ETc) was less than the monthly required field water supply<br />
(FWS) for the three systems of irrigation. This obviously was due to the<br />
higher average monthly value of crop coefficient (Kc) for Bermuda grass.<br />
The results represented in Fig. (3) was calculated and plotted according to<br />
the value of monthly reference Evapotranspiration (ET 0 ) which obtain<br />
form CROPWAT program version 4.3 (1998) as mentioned before.<br />
The total seasonal field water supply per fedden was 1354 mm with<br />
subsurface trickle system and leaky pipes laterals, while it was 1523 mm<br />
for the two tested sprinkler head. Therefore, applying the irrigation water<br />
(Nile or treated sewage) by subsurface trickle system will save a<br />
remarkable amount of seasonal water requirements (about 170<br />
mm/season) which represents about 11% of total seasonal water applied<br />
<strong>Misr</strong> J. <strong>Ag</strong>. <strong>Eng</strong>., July 2009 1231
250<br />
0.96<br />
ET0, ETc and FWS in (mm)<br />
200<br />
150<br />
100<br />
50<br />
0.95<br />
0.94<br />
0.93<br />
0.92<br />
0.91<br />
0.90<br />
crop coefficient (Kc)<br />
0<br />
0.89<br />
1-Dec-2005<br />
1-Nov-2005<br />
1-Oct-2005<br />
1-Sep-2005<br />
1-Aug-2005<br />
1-Juḻ2005<br />
1-Jun-2005<br />
1-May-2005<br />
1-Apr-2005<br />
1-Mar-2005<br />
1-Feb-2005<br />
1-Jan-2005<br />
Eto (mm/month)<br />
Etc (mm/month)<br />
Date in (Month)<br />
FWS for sprinkler irrigaton systems (mm/month) ( appl. Effic. 80% )<br />
FWS for sub-surface irrigaton systems (mm/month) (appl. Effic 90 % )<br />
Crop coefficient (Kc)<br />
Figure (3): Average monthly evapotranspiration (ET 0 ), plant<br />
evapotranspiration (ETc) and flied water supply (FWS) recorded<br />
along the growing season of Bermuda grass<br />
2. Volumetric soil moisture content distribution<br />
The volumetric soil moisture content decreased with soil depth after 2<br />
hours from irrigation for the sprinkler systems (rotary and spray heads)<br />
and the two types of irrigation water (Nile and treated sewage) as<br />
presented in table (2). However, after 48 and 72 hours, it increased at a<br />
depth of 30 cm and then decreased at a depth of 50 cm with the treated<br />
sewage water and the two tested sprinkler heads. For the two types of<br />
water applied, the volumetric soil moisture content decreased with time<br />
<strong>Misr</strong> J. <strong>Ag</strong>. <strong>Eng</strong>., July 2009 1232
for all soil layers. After three days from irrigation with rotary sprinkler<br />
head, the highest average volumetric soil moisture content (0.113 m 3<br />
water /m 3 of soil) was observed with the treated sewage While the lowest<br />
value was (0.104 m 3 water /m 3 of soil) with Nile with spray sprinkler<br />
head. This may be due to the best uniform distribution of water produced<br />
by rotary heads<br />
Table (2): Volumetric soil moisture content in (m 3 of water /m 3 of<br />
soil) with soil depth for sprinkler irrigation system (rotary<br />
and spary) after different times from irrigation.<br />
Volumetric Soil moisture content (m 3 of water/m 3 of soil)<br />
rotary sprinkler head<br />
spray sprinkler head<br />
Soil depth (cm)<br />
Nile water<br />
Treated sewage<br />
water<br />
Nile water<br />
Treated sewage<br />
water<br />
Time after<br />
Time after<br />
Time after<br />
Time after<br />
irrigation (hr)<br />
irrigation (hr)<br />
irrigation (hr)<br />
irrigation (hr)<br />
2 48 72 2 48 72 2 48 72 2 48 72<br />
0-20 0.148 0.108 0.100 0.144 0.116 0.104 0.128 0.122 0.104 0.136 0.122 0.104<br />
20-40 0.136 0.128 0.124 0.128 0.128 0.124 0.124 0.120 0.116 0.128 0.120 0.116<br />
40-60 0.112 0.108 0.104 0.120 0.116 0.112 0.096 0.092 0.092 0.116 0.116 0.112<br />
Average 0.132 0.115 0.109 0.131 0.120 0.113 0.116 0.111 0.104 0.127 0.119 0.110<br />
Table (3) represents the variation of volumetric soil moisture content<br />
with soil depth for the subsurface trickle irrigation system and leaky pipes<br />
laterals. For all treatments, the volumetric soil moisture content decreased<br />
with the elapsed time from irrigation application at the three depths of<br />
soil profile. The highest values of volumetric soil moisture content were<br />
recorded by the treated sewage water for the two systems. The highest<br />
average value 0.14 m 3 water /m 3 of soil) was observed with the treated<br />
sewage water when it applied by subsurface trickle laterals with long bath<br />
emitters. While the lowest (0.101m 3 of water/m 3 of soil) was observed<br />
with Nile water when it applied by the same system. Leaky pipes laterals<br />
produce a higher average volumetric soil moisture content comparing<br />
<strong>Misr</strong> J. <strong>Ag</strong>. <strong>Eng</strong>., July 2009 1233
with long path emitters. This may be due the sufficient of water which<br />
stripped horizontally with soil layers occurred by leaky pips laterals<br />
Table (3): Volumetric soil moisture content in (m 3 water /m 3 of soil)<br />
with soil depth for leaky pipes laterals and subsurface<br />
trickle with longpath emitters.<br />
Volumetric Soil moisture content (m 3 water /m 3 soil)<br />
leaky pipes laterals<br />
Long path emitters<br />
Soil depth (cm) Nile water Treated sewage Nile water Treated sewage<br />
water<br />
water<br />
Time after Time after Time after Time after<br />
irrigation (hr) irrigation (hr) irrigation (hr) irrigation (hr)<br />
2 48 72 2 48 72 2 48 72 2 48 72<br />
0-20 0.128 0.104 0.092 0.132 0.108 0.096 0.128 0.104 0.092 0.124 0.108 0.096<br />
20-40 0.144 0.120 0.112 0.148 0.120 0.112 0.144 0.112 0.104 0.144 0.116 0.108<br />
40-60 0.136 0.120 0.112 0.144 0.124 0.116 0.144 0.116 0.108 0.152 0.120 0.112<br />
Average. 0.136 0.115 0.105 0.141 0.117 0.108 0.139 0.111 0.101 0.140 0.115 0.105<br />
3. Statistical coefficient of variation of the volumetric soil moisture content<br />
The statistical coefficient of variation (CV) of the volumetric soil<br />
moisture content is the ratio between the standard deviation of the sample<br />
and the mean value of this sample. Therefore, it can be computed for<br />
shallow depths up to 10 cm and also for deeper depth greater than or<br />
equal to 50 cm. Table (4) represents the different values of the statistical<br />
coefficient of variation of soil moisture content and its changes with both<br />
the elapsed time from irrigation application and the type of irrigation<br />
water applied. Irrigation system operated with leaky pipes laterals gave<br />
the lower coefficient of variation of soil moisture content when the<br />
treated sewage water is applied (0.80 %) after 2 hours from irrigation<br />
application at the shallow soil depths. The lower values of statistical<br />
coefficient of variation indicate more stability of soil moisture content.<br />
The highest value of CV (23.60%) was obtained at the deeper depth with<br />
sprinkler irrigation system with rotary sprinkler heads when the treated<br />
sewage water is applied. While the lowest value (0.3%) was observed<br />
<strong>Misr</strong> J. <strong>Ag</strong>. <strong>Eng</strong>., July 2009 1234
with leaky pipes laterals when the treated sewage water is applied after<br />
three days from irrigation application. Irrigation system with leaky pipes<br />
kept the stability of soil moisture content either in shallow depth or<br />
deeper depth, where the coefficient of variation (CV) remains at lower<br />
value comparing with the other systems when the treated sewage water is<br />
applied. The presented results in table (4) also showed that, at any system<br />
of irrigation, the treated sewage water resulted more stability of soil<br />
moisture content than Nile water. This occurred at the three elapsed times<br />
from irrigation application except with subsurface trickle irrigation<br />
system with long path emitters after 2 and 72 hrs from irrigation<br />
application in shallow soil depths.<br />
Table (4): Statistical coefficient of variation of the volumetric soil<br />
moisture content (CV) and its change with elapsed time from<br />
irrigation and the applied water.<br />
Irrigation<br />
system<br />
Sprinkler<br />
(rotary)<br />
Sprinkler<br />
( spray)<br />
(leaky pipe)<br />
laterals<br />
Subsurface<br />
(long path<br />
emitters)<br />
Type of<br />
water<br />
applied<br />
SVM<br />
CV<br />
(%)<br />
Elapsed time from irrigation<br />
2 hours 48 hours 72 hours<br />
DVM<br />
CV<br />
(%)<br />
SVM<br />
CV<br />
(%)<br />
DVM CV<br />
(%)<br />
SVM<br />
CV<br />
(%)<br />
DVM<br />
Nile 0.148 6.60 0.122 10.6 0.108 7.10 0.108 7.4 0.100 10.2 0.104 0.50<br />
Treated<br />
sewage<br />
CV<br />
(%)<br />
0.144 1.30 0.120 3.6 0.116 5.00 0.116 3.7 0.104 1.7 0.112 3.40<br />
Nile 0.128 12.6 0.096 23.6 0.112 4.80 0.092 5.9 0.104 4.8 0.092 3.40<br />
Treated<br />
sewage<br />
0.136 2.60 0.116 2.1 0.112 2.40 0.116 1.1 0.104 2.1 0.116 1.10<br />
Nile 0.128 0.90 0.136 1.7 0.104 1.60 0.120 1.5 0.092 0.9 0.112 0.30<br />
Treated<br />
sewage<br />
0.132 0.80 0.144 3.3 0.108 0.20 0.124 0.7 0.096 0.3 0.116 0.60<br />
Nile 0.128 1.10 0.144 2.3 0.104 0.50 0.116 1.7 0.092 0.5 0.108 2.30<br />
Treated<br />
sewage<br />
0.124 1.80 0.152 0.4 0.108 0.50 0.120 1.8 0.096 0.4 0.112 1.80<br />
*SVM= Shallow volumetric moisture (m 3 water /m 3 of soil<br />
*DVM= deep volumetric moisture (m 3 water /m 3 of soil<br />
<strong>Misr</strong> J. <strong>Ag</strong>. <strong>Eng</strong>., July 2009 1235
4. Accumulation of salts in soil profile<br />
Figure (4) illustrates the variation of the average value of electrical<br />
conductivity (EC) in dS/m with soil depth for all the tested treatments. It<br />
showed that, applying treated sewage water produced higher values of EC<br />
in soil surface layers with all the used irrigation systems. In contrast, with<br />
Nile water, the accumulation of salts decreased with time where the<br />
average value of EC reached to its lowest value (0.85 ds/m) at a depth of<br />
10 cm of soil layer with all tested systems . Applying treated sewage<br />
water with sprinkler irrigation systems (rotary and spray heads)led to<br />
increasing the accumulation of salts with time. At the end of the growing<br />
season the salts accumulates sharply specially at the soil surface layers<br />
and it reaches 1.5 dS/m at a depth of 10 cm for the two sprinkler heads<br />
The least accumulation of salts at the end of the growing season was<br />
observed with Nile water under subsurface trickle with long path emitters<br />
and leaky pipes laterals. The value of EC reached to 1 dS/m with leaky<br />
pipes laterals and to 0.9 dS/m with long path emitters. With treated<br />
sewage water, the salts accumulate slightly from the beginning to the end<br />
of the growing season, where the value of EC reached to 1.3 dS/m with<br />
leaky pipes laterals while it remains constant at 1.2 dS/m for subsurface<br />
trickle with long path emitters. It also evident that, subsurface trickle<br />
irrigation system with long path emitters help in decreasing the<br />
accumulation of salts more than sprinkler systems. This may be due to the<br />
sufficient of water in soil profile that achieved with subsurface trickle<br />
irrigation system.<br />
5. Environmental impacts due to applying treated sewage water<br />
Reuse of the treated sewage water, as a new source of irrigation water<br />
will be accompanied with a number of environmental impacts on soil,<br />
plant and consequently on human body. Environmental impacts either in<br />
the cultivated soil or in the growing plant basically focused upon the<br />
change of the concentration of the existed heavy metals due to applying<br />
the treated sewage water.<br />
(a)Impacts on the cultivated soil<br />
Table (5) represents the average concentration of heavy metals in soil<br />
after applying treated sewage water and the standard concentration<br />
reported by World Health Organization WHO 1995 for each metal. It<br />
<strong>Misr</strong> J. <strong>Ag</strong>. <strong>Eng</strong>., July 2009 1236
showed that, the concentration of some heavy metals, such as Cobalt,<br />
Chromium, Copper, Nickel and lead was lower than the standard values<br />
for all the tested systems. It also showed that, the concentration of some<br />
metals varied according to the used system of irrigation. Some metals<br />
such as Aluminum, Iron and Manganese existed in extremely higher<br />
concentration and varied slightly due to the used system of irrigation.<br />
Subsurface trickle irrigation with long path emitters caused a reduction in<br />
the concentration of Aluminum, Iron Manganese, Nickle and lead<br />
compared with the other tested systems. Therefore it can be concluded<br />
that applying treated sewage water by subsurface trickle system with long<br />
path emitter may be more safely than the sprinkler irrigation system for<br />
the irrigation of landscape. This was due to the lowest concentrations of<br />
heavy metals recorded by the both subsurface trickle system with long<br />
path emitters and leaky pips laterals compared with the two sprinkler<br />
heads.<br />
<strong>Misr</strong> J. <strong>Ag</strong>. <strong>Eng</strong>., July 2009 1237
soil depth in (m)<br />
0<br />
-0.2<br />
-0.4<br />
Electrical conductivity(Ec) in (ds/m)<br />
0.0 0.4 0.8 1.2 1.6<br />
Rotary sprinkler with<br />
Nile water<br />
Soil depth in (m)<br />
0<br />
-0.2<br />
-0.4<br />
Rotary sprinkler with treated<br />
sewage water<br />
Electrical conductivity(Ec) in (ds/m)<br />
0.0 0.4 0.8 1.2 1.6<br />
Soil depth in (m)<br />
-0.6<br />
0<br />
-0.2<br />
-0.4<br />
Beginning season mid season End season<br />
Electrical conductivity(Ec) in (ds/m)<br />
0.0 0.4 0.8 1.2 1.6<br />
Spray sprinkler with<br />
Nile water<br />
(a)<br />
Soil depth in (m)<br />
-0.6<br />
0<br />
-0.2<br />
-0.4<br />
Beginning season mid season End season<br />
Spray sprinkler with treated<br />
sewage water<br />
Electrical conductivity(Ec) in (ds/m)<br />
(b)<br />
0.0 0.4 0.8 1.2 1.6<br />
-0.6<br />
Beginning season mid season End season<br />
(c)<br />
Electrical conductivity(Ec) in (ds/m)<br />
-0.6<br />
Beginning season mid season End season<br />
Electrical conductivity(Ec) in (ds/m)<br />
(d)<br />
Soil depth in (m)<br />
0<br />
-0.2<br />
-0.4<br />
0.0 0.4 0.8 1.2 1.6<br />
Leaky pipe with<br />
Nile water<br />
Soil depth in (m)<br />
0<br />
-0.2<br />
-0.4<br />
0.0 0.4 0.8 1.2 1.6<br />
Leaky pipe with treated<br />
sewage water<br />
Soil depth in (m)<br />
-0.6<br />
0<br />
-0.2<br />
-0.4<br />
Beginning season mid season End season<br />
0.0 0.4 0.8 1.2 1.6<br />
Long path emitter with<br />
Nile water<br />
(e)<br />
Electrical conductivity(Ec) in (ds/m)<br />
Soil depth in (m)<br />
-0.6<br />
0<br />
-0.2<br />
-0.4<br />
Beginning season mid season End season<br />
Electrical conductivity(Ec) in (ds/m)<br />
0.0 0.4 0.8 1.2 1.6<br />
Long path emitter with treated<br />
sewage water<br />
(f)<br />
-0.6<br />
Beginning season mid season End season<br />
-0.6<br />
Beginning season mid season End season<br />
(g)<br />
(h)<br />
Figure (4): Average electrical conductivity (EC) with soil depth recorded at stage three different stage along<br />
the growing season for both Nile and treated sewage water.<br />
a- rotary sprinkler with Nile water b- rotary sprinkler with treated sewage water<br />
c- spray sprinkler with Nile water d- spray sprinkler with treated sewage water<br />
e- leaky pipe with Nile water f- leaky pipe with treated sewage water<br />
g- long path emitter with Nile water h- long path emitter with treated sewage water<br />
<strong>Misr</strong> J. <strong>Ag</strong>. <strong>Eng</strong>., July 2009 1238
(b) Impacts on the growing plant<br />
Concentrations of 17 heavy metals were measured two times in both<br />
leaves and roots of Bermuda grass. One was before applying the irrigation<br />
water and the other was at the end of the growing season. The obtained<br />
data were listed in table (6). The concentration of each individual metal in<br />
both leaves and roots increased at the end of the growing season for the<br />
two types of the irrigation water except the concentration of Chromium,<br />
Iron and Nickel where it decreased sharply especially in roots.<br />
Lead is considered as the most harmful element which causes dangerous<br />
diseases if its concentration was high. The presented data in table (6) also<br />
showed that, the changing percent of the concentration of lead in roots<br />
were 120% and zero% in case of applying Nile water and treated sewage<br />
water respectively. While it was 400% and 540% in leaves with Nile and<br />
treated sewage water, respectively.<br />
Table (5): Average concentrations of some heavy metals in soil profile<br />
irrigated by treated sewage water (mg/kg) and the standard values<br />
reported by World Health Organization (WHO, 1995).<br />
Element<br />
standard concentration<br />
reported<br />
by (WHO1995)<br />
Average concentration of heavy metal (mg/kg) in soil sample .irrigated by treated sewage water<br />
average concentration average concentration average concentration average concentration<br />
recorded with sprinkler recorded with sprinkler recorded with (leaky recorded with Subsurface<br />
system (rotary)<br />
system (spray)<br />
pipes laterals) trickle (long path emitters)<br />
Aluminum, Al. ------ 43991.70 42578.30 47766.70 42041.70<br />
Barium, Ba. 290 306.90 324.00 400.50 297.70<br />
Cadmium,Cd. 7 16.00 15.40 13.10 14.10<br />
Cobalt, Co. 50 27.80 24.00 32.60 <strong>26</strong>.20<br />
Chromium,Cr. 3200 87.70 91.30 142.30 105.40<br />
Copper, Cu. 140 60.30 63.20 82.90 90.00<br />
Iron, Fe. 300 40625.00 40766.70 50608.30 38150.00<br />
Manganese,Mn 100 815.80 769.30 996.80 693.50<br />
Nickel, Ni. 850 91.30 89.50 91.70 73.00<br />
Lead, Pb. 150 38.90 41.10 53.30 38.40<br />
Strontium, Sr. ------ 175.10 172.20 219.60 198.10<br />
Zinc,Zn. 200 149.00 130.00 145.50 246.20<br />
<strong>Misr</strong> J. <strong>Ag</strong>. <strong>Eng</strong>., July 2009 1239
Table (6) also showed that, there were some metals which its<br />
concentration was increased sharply at the end of the growing season in<br />
both roots and leaves. These metals were Aluminum, Barium,<br />
Molybdenum and Strontium and this was occurred with both Nile and<br />
sewage water. The concentration of heavy metals in leaves and roots did<br />
not depend upon the used system of irrigation. It affected only by the<br />
quality of the irrigation water. With treated sewage water some metals<br />
decreased sharply such as Cadmium, Chromium, Iron and Neckline in<br />
both leaves and roots. Others increased sharply such as Aluminum,<br />
Barium, Molybdenum and Strontium, therefore, applying treated sewage<br />
water might be carried out with care.<br />
Table (6): Average concentrations of some heavy metals in both<br />
leaves and roots of Bermuda plant (mg/kg) before and<br />
after applying both Nile and treated sewage water.<br />
Average concentration of heavy metal (mg/kg) at the end of the growing season.<br />
Elements<br />
Concentration of<br />
heavy metals<br />
before applying<br />
irrigation water<br />
Concentration of<br />
heavy metals at<br />
the end of the<br />
growing season<br />
(mg/kg)<br />
Changing<br />
percent (%)<br />
Concentration of<br />
heavy metals at the<br />
end of the growing<br />
season (mg/kg)<br />
Changing<br />
percent (%)<br />
(mg/kg)<br />
Nile water<br />
Treated sewage<br />
water<br />
Leaves Roots Leaves Roots Leaves Roots Leaves Roots Leaves Roots<br />
Aluminum, Al. < 2 < 2 758 290 37800 14400 448 242 22300 12000<br />
Arsenic, As. < 2 < 2 < 2 < 2 0.00 0.00 < 2 < 2 0.00 0.00<br />
Barium, Ba. < 1 < 1 18 15 1700 1400 13.60 20.00 1<strong>26</strong>0 1900<br />
Cadmium,Cd. 1.20 0.40 1.20 0.60 0.00 50 < 0.10 < 0.10 -91.67 -75.00<br />
Cobalt, Co. < 1 < 1 2.00 < 1 100 0.00 2.20 < 1 120.00 0.00<br />
Chromium,Cr. 63.00 59.60 < 0.40 < 0.40 -99.37 -99.33 < 0.40 < 0.40 -99.37 -99.33<br />
Copper, Cu. 20.60 12.60 30.40 19.60 47.57 55.56 23.00 13.60 11.65 7.94<br />
Iron, Fe. 982 640 980 420 -0.20 -34.38 546 344 -44.40 -46.25<br />
Manganese,Mn 21.40 76.00 68.00 40.00 217.76 -47.37 73.20 63.60 242.06 -16.32<br />
<strong>Misr</strong> J. <strong>Ag</strong>. <strong>Eng</strong>., July 2009 1240
Molybdenum < 2 < 2 634 4<strong>26</strong> 31600 21200 446 682 22200 34000<br />
Nickel, Ni. 50.60 51.60 1.60 1.20 -96.84 -97.67 2.40 4.00 -95.<strong>26</strong> -92.25<br />
Lead, Pb. < 1 < 1 5.00 2.20 400 120 6.40 < 1 540.00 0.00<br />
Selenium,Se. < 6 < 6 < 6 < 6 0.00 0.00 < 6 < 6 0.00 0.00<br />
Tin , Sn < 6 < 6 < 6 < 6 0.00 0.00 < 6 < 6 0.00 0.00<br />
Strontium, Sr. < 1 < 1 30.40 28.00 2940 2700 18.20 23.20 1720 2220<br />
Vanadium ,V. < 1 < 1 < 1 < 1 0.00 0.00 < 1 < 1 0.00 0.00<br />
Zinc,Zn. 50.50 36.20 67.40 44.80 33.47 23.76 86.00 52.00 70.30 43.65<br />
Table (7) represents the total fical density (TCD) and fecal coliform count<br />
(FCC) on Bermuda leaves before and after applying treated sewage and<br />
Nile water At the end of the growing season, the total fecal coliform<br />
density increased by 900% with treated sewage water, while it increased<br />
only by 10.13% when the Nile water was applied. As for the count of<br />
fecal coliform, it increased by 900% with treated sewage water, while<br />
decreased by 83.18% with Nile water. It is evident that, applying the<br />
treated sewage water caused a biological harm due to the great number of<br />
coliform that lives on leaves and it was extremely greater than that caused<br />
by the Nile water.<br />
Table (7): Concentration of the total coliform density and fecal<br />
coliform Count on Bermuda leaves with Nile and treated<br />
sewage water.<br />
Before applying water<br />
After applying water<br />
Changing (%) percent<br />
Elements<br />
Treated<br />
sewage water<br />
Nile water<br />
Treated<br />
sewage water<br />
Nile water<br />
Treated<br />
sewage water<br />
Nile<br />
water<br />
Total coliform<br />
density TCD<br />
(mg/kg)<br />
Fecal coliform<br />
count FCC<br />
1.2 × 10 5 227 × 10 3 12 × 10 5 250 × 10 3 900 10.13<br />
0.07 × 10 5 107 × 10 3 0.7 × 10 5 18 × 10 3 900 -83.18<br />
<strong>Misr</strong> J. <strong>Ag</strong>. <strong>Eng</strong>., July 2009 1241
REFERANCES<br />
Asano, T. (Ed), 1998, Water Quality Management/ Library. Volume 10/,<br />
Wastewater Reclamation and Reuse. Technomic Publishing Company,<br />
Inc Lancaster, Pennsylvania, U.S.A<br />
Ayers, R.S. and Westcot D.w., 1985,. Water Quality for <strong>Ag</strong>riculture. Rev.Edn.<br />
FAO, Irrig. and Drain. Paper 29 Rome 174pp.<br />
Darwish, M.R., El-Awar, F.A., Sharara, M. and Hamdar, B. 1999, Economic-<br />
Environmental Approach for Optimum Wastewater Utilization in<br />
Irrigation: A Case Study in Lebanon. Applied <strong>Eng</strong>ineering<br />
El–Sayed, A., 1997. Water Quality Management of Drainage Systems in<br />
Eastern Nile, Delta. Ph.D. Thesis, Ain Shams University, Cairo, Egypt.<br />
FAO, 1992, Wastewater Treatment and Uuse in <strong>Ag</strong>riculture. Pescod Mb,<br />
Irrigation and Drainage Paper 47. Food and <strong>Ag</strong>riculture Organization,<br />
Rome, Italy.<br />
Martijn, E.J. and Huibers F.P., 2001, Use of Treated Wastewater in Irrigated<br />
<strong>Ag</strong>riculture: A design Framework Development of Cost-Effective<br />
Reclamation Technologies for Domestic Wastewater and the<br />
Appropriate <strong>Ag</strong>ricultural Use of the Treated Effluent under semi-Arid<br />
Climate Conditions (CORETECH) Working, Document, WP4-3.<br />
Wageningen, Netherlands, 33 pp.<br />
Pescod, M.B., 1992, Wastewater Treatment and Use in <strong>Ag</strong>riculture. University<br />
of Newcastle- Upon- Tyne, UK, FAO irrigation and Drainage Paper<br />
No.47<br />
Shelef, G. 1977, Water Reuse in Israel. In: Shuval Hi (Ed), Water renovation<br />
and reuse, Academic Press. New York, pp: 311-332<br />
Sheikh, B., Cort, R., Cooper, R.C., and Jaques, R.S., 1998, Tertiary Treated<br />
Reclaimed water for irrigation of Raw Eaten Vegetables. In: Asano T<br />
(ed), (1998) pp; 779-8<strong>26</strong>.<br />
Shuval, H.I., Adin, A., Faattal, B., Rawitz, E. and Yekutiel, P., 1986,<br />
Wastewater Irrigation in Developing Countries. Health Effect and<br />
Technical Solutions. World Bank Tech. Paper 51, 324 pp.<br />
<strong>Misr</strong> J. <strong>Ag</strong>. <strong>Eng</strong>., July 2009 1242
الملخص العربي<br />
أداء نظم ري المسطحات الخضراء تحت ظروف مياه الصرف الصحي المعالج<br />
د.<br />
١<br />
محمد علي أبوعميره<br />
د.<br />
١<br />
أحمد حسن جمعه<br />
د.<br />
٢<br />
ياسر محمد محروس عطا<br />
أجريت ھذه الدراسة بالمزرعة التجريبية للمركز القومي لبحوث المياه والملحق بھا محطة معالجة<br />
لمياه الصرف الصحي والتابعة للمعامل المركزية للرصد البيئي بالقناطر الخيرية لوزارة الموارد<br />
المائية والرى بجمھورية مصر العربية.<br />
واستھدفت مقارنة أداء نظامى الرى بالرش والتنقيط التحت سطحى تحت مياه صرف صحى<br />
معالج لري المسطحات الخضراء بأدائھما مع مياه النيل من خالل المتطلبات المائية تحت كل<br />
نظام ، توزيع المحتوي الرطوبي الحجمي في التربة ، حركة األمالح وتراكمھا في قطاع التربة<br />
باإلضافة إلي التأثيرات البيئية علي كل من التربة تحت كل نظام والنبات المنزرع نتيجة استخدام<br />
مياه صرف صحي معالج تحت كل نظام.<br />
ولتحقيق ذلك استخدم نظام للري بالرش أحدھما يستخدم رأس رشاش دوار<br />
تم تركيبه في مساحة ٩٠٠ م واآلخر يستخدم رأس رشاش الرزاز<br />
ركب في مساحة ٣٢٤ م وإستخدام أيضاً نظامين للرى بالتنقيط التحت<br />
واآلخر يستخدم أنابيب<br />
سطحي أحدھما يستخدم نقاطات طويلة المسار<br />
كخطوط ري فرعية وركب كل نظام في مساحة مقدارھا ١٠٠ م حيث<br />
رشح<br />
كانت محطة معالجة مياه الصرف الصحي ھي المصدر الرئيسي لمياه الصرف الصحي المعالج<br />
واستخدمت نفس نظم الري الثالثة السابقة بنفس المساحة المخصصة لكل نظام حيث رويت كل<br />
مساحة بمياه النيل واستخدم برنامج CROPWAT لحساب قيمة البخر نتح المرجعي في أرض<br />
التجربة.<br />
وتوصلت الدراسة إلي النتائج اآلتية:<br />
أدي استخدام نظام الري بالتنقيط التحت سطحي مع النقاطات طويلة المسار إلي توفير في<br />
كمية المياه السنوية المضافة لكل من مياه الصرف الصحي المعالج ومياه النيل بلغت قيمته<br />
مقارنة بنظام الري بالرش مع كل من الرشاشات الدوارة ورشاشات الرذاذ.<br />
أدي استخدم مياه الصرف الصحي المعالج في ري المسطحات الخضراء بواسطة كل من<br />
نظام الري بالرش ونظام الري بالتنقيط التحت سطحي إلي زيادة تركيز األمالح في قطاع<br />
بينما كانت 0.8dS/m<br />
التربة حيث بلغت قيمة معامل التوصيل الكھربي<br />
عند استخدام مياه النيل أي بزيادة قدرھا ٧٥% مما ينصح معه إعطاء رية غسيل بمياه النيل<br />
عند استخدام مياه الصرف الصحي المعالج.<br />
أستاذ مساعد بقسم الھندسة الزراعية كلية الزراعة – جامعة المنوفية.<br />
باحث بقسم تقنيات الصرف معھد بحوث الصرف المركز القومى لبحوث المياه.<br />
Rotary<br />
Spray )<br />
٢<br />
)<br />
(Long path emitters)<br />
1.4dS/m (EC)<br />
–<br />
٢<br />
٢<br />
-<br />
–<br />
(sprinkler head<br />
(sprinkler head<br />
(Leaky pipes)<br />
%١١<br />
-١<br />
-٢<br />
-١<br />
-٢<br />
<strong>Misr</strong> J. <strong>Ag</strong>. <strong>Eng</strong>., July 2009 1243
-٣<br />
-٤<br />
-٥<br />
تحقق أقل تركيز للمعادن الثقيلة في قطاع التربة تحت نظام الري بالتنقيط التحت سطحي<br />
بنقاطات طويلة المسار وذلك لكل المعادن الثقيلة المقاسة باستثناء الكروم، النحاس، والزنك<br />
فى حالة إستخدام مياه الصرف الصحى المعالج.<br />
أظھر تحليل وحساب تركيز المعادن الثقيلة في أوراق وجذور المسطحات الخضراء زيادة<br />
كبيرة في نسبة التغير الموسمية في تركيز بعض المعادن مثل األلومنيوم والنحاس في حالة<br />
استخدام مياه النيل عنھا عند استخدام مياه الصرف الصحي المعالج.<br />
توصي الدراسة باستخدام نظام الري بالتنقيط التحت سطحي بنقاطات طويلة المسار مع مياه<br />
الصرف الصحي المعالج وذلك في ري المسطحات الخضراء نظراً للتوصل إلي قيم عالية<br />
لعوامل أداء الري بالتنقيط التحت سطحي تحت ھذا النظام.<br />
<strong>Misr</strong> J. <strong>Ag</strong>. <strong>Eng</strong>., July 2009 1244