(1990). Ties and Bonds. Connections, 13 (3) - INSNA
(1990). Ties and Bonds. Connections, 13 (3) - INSNA
(1990). Ties and Bonds. Connections, 13 (3) - INSNA
Create successful ePaper yourself
Turn your PDF publications into a flip-book with our unique Google optimized e-Paper software.
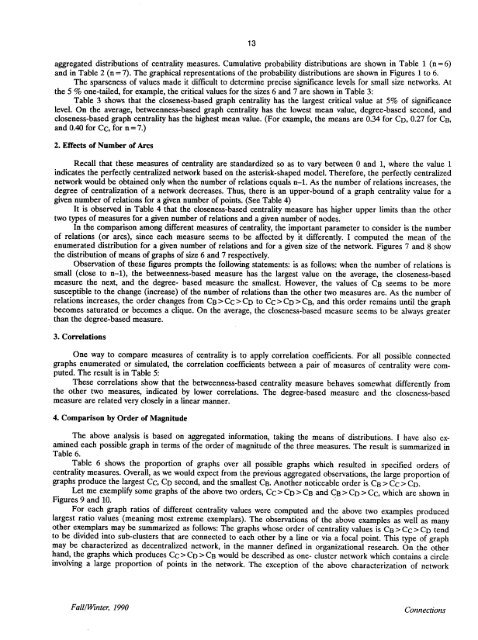
aggregated distributions of centrality measures . Cumulative probability distributions are shown in Table 1 (n = 6)<br />
<strong>and</strong> in Table 2 (n = 7) . The graphical representations of the probability distributions are shown in Figures 1 to 6 .<br />
The sparseness of values made it difficult to determine precise significance levels for small size networks . At<br />
the 5 % one-tailed, for example, the critical values for the sizes 6 <strong>and</strong> 7 are shown in Table 3 :<br />
Table 3 shows that the closeness-based graph centrality has the largest critical value at 5% of significance<br />
level . On the average, betweenness-based graph centrality has the lowest mean value, degree-based second, <strong>and</strong><br />
closeness-based graph centrality has the highest mean value . (For example, the means are 0 .34 for CD, 0 .27 for CB,<br />
<strong>and</strong> 0 .40 for Cc, for n = 7 .)<br />
2 . Effects of Number of Arcs<br />
Recall that these measures of centrality are st<strong>and</strong>ardized so as to vary between 0 <strong>and</strong> 1, where the value 1<br />
indicates the perfectly centralized network based on the asterisk-shaped model . Therefore, the perfectly centralized<br />
network would be obtained only when the number of relations equals n-1 . As the number of relations increases, the<br />
degree of centralization of a network decreases . Thus, there is an upper-bound of a graph centrality value for a<br />
given number of relations for a given number of points . (See Table 4)<br />
It is observed in Table 4 that the closeness-based centrality measure has higher upper limits than the other<br />
two types of measures for a given number of relations <strong>and</strong> a given number of nodes .<br />
In the comparison among different measures of centrality, the important parameter to consider is the number<br />
of relations (or arcs), since each measure seems to be affected by it differently . I computed the mean of the<br />
enumerated distribution for a given number of relations <strong>and</strong> for a given size of the network . Figures 7 <strong>and</strong> 8 show<br />
the distribution of means of graphs of size 6 <strong>and</strong> 7 respectively .<br />
Observation of these figures prompts the following statements : is as follows: when the number of relations is<br />
small (close to n-i), the betweenness-based measure has the largest value on the average, the closeness-based<br />
measure the next, <strong>and</strong> the degree- based measure the smallest . However, the values of CB seems to be more<br />
susceptible to the change (increase) of the number of relations than the other two measures are . As the number of<br />
relations increases, the order changes from CB > Cc > CD to CC > CD > CB, <strong>and</strong> this order remains until the graph<br />
becomes saturated or becomes a clique. On the average, the closeness-based measure seems to be always greater<br />
than the degree-based measure .<br />
3 . Correlations<br />
One way to compare measures of centrality is to apply correlation coefficients . For all possible connected<br />
graphs enumerated or simulated, the correlation coefficients between a pair of measures of centrality were computed.<br />
The result is in Table 5 :<br />
These correlations show that the betweenness-based centrality measure behaves somewhat differently from<br />
the other two measures, indicated by lower correlations . The degree-based measure <strong>and</strong> the closeness-based<br />
measure are related very closely in a linear manner .<br />
4. Comparison by Order of Magnitude<br />
<strong>13</strong><br />
The above analysis is based on aggregated information, taking the means of distributions . I have also examined<br />
each possible graph in terms of the order of magnitude of the three measures . The result is summarized in<br />
Table 6.<br />
Table 6 shows the proportion of graphs over all possible graphs which resulted in specified orders of<br />
centrality measures. Overall, as we would expect from the previous aggregated observations, the large proportion of<br />
graphs produce the largest Cc, CD second, <strong>and</strong> the smallest CB . Another noticeable order is CB > CC > CD .<br />
Let me exemplify some graphs of the above two orders, Cc > CD > CB <strong>and</strong> CB > CD > Cc, which are shown in<br />
Figures 9 <strong>and</strong> 10 .<br />
For each graph ratios of different centrality values were computed <strong>and</strong> the above two examples produced<br />
largest ratio values (meaning most extreme exemplars) . The observations of the above examples as well as many<br />
other exemplars may be summarized as follows : The graphs whose order of centrality values is CB > CC > CD tend<br />
to be divided into sub-clusters that are connected to each other by a line or via a focal point . This type of graph<br />
may be characterized as decentralized network, in the manner defined in organizational research . On the other<br />
h<strong>and</strong>, the graphs which produces Cc > CD > CB would be described as one- cluster network which contains a circle<br />
involving a large proportion of points in the network . The exception of the above characterization of network<br />
Fall/Winter, <strong>1990</strong><br />
<strong>Connections</strong>


