Performance of Tillage Implements in a Stubble Mulch System. I ...
Performance of Tillage Implements in a Stubble Mulch System. I ...
Performance of Tillage Implements in a Stubble Mulch System. I ...

You also want an ePaper? Increase the reach of your titles
YUMPU automatically turns print PDFs into web optimized ePapers that Google loves.
46 AGRONOMY JOURNAL<br />
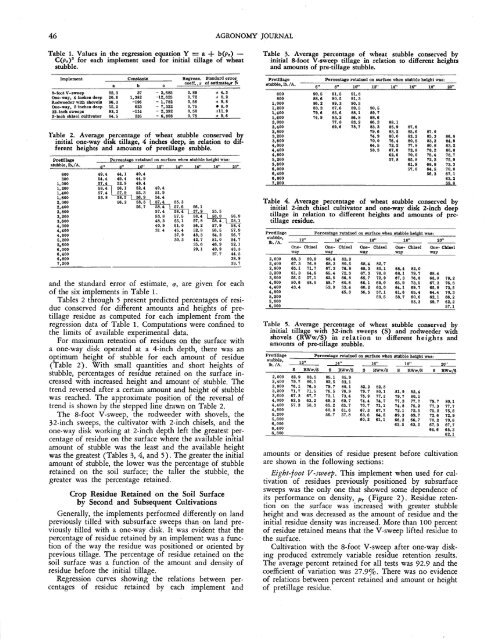
Table 1. Values <strong>in</strong> the regression equation Y = a + b(~r) -<br />
C(pr)' for each implement used for <strong>in</strong>itial tillage <strong>of</strong> wheat<br />
stubble.<br />
Table 3. Average percentage <strong>of</strong> wheat stubble conserved by<br />
<strong>in</strong>itial &foot V-sweep tillage <strong>in</strong> relation to different heights<br />
and amounts <strong>of</strong> pre-tillage stubble.<br />
Implement Constants Regress. Standard error<br />
coeff., r <strong>of</strong> estlmateq %<br />
a b c -<br />
8-foot V-sweep 92.3 37 - 3,685 0.89 * 4.3<br />
One-way, 4 <strong>in</strong>ches deep 20.6 1,382 -12,625 0.72 * 8.2<br />
Rodweeder with shovels 96.3 -196 - 1,782 0.56 + 9.8<br />
One-way, 2 <strong>in</strong>ches deep 55.2 623 - 7,322 0.75 8.0<br />
32-<strong>in</strong>ch sweeps 93.2 -114 - 2.392 0.50 ill. 9<br />
2-<strong>in</strong>ch chisel cultivator 84.5 235 - 6,808 0.75 i 9.6<br />
Pretlllage<br />
Percentage reta<strong>in</strong>ed on surface when stubble height was:<br />
stubble, lb./A. 6,t lo,, 12,t 1411 16" 18" 2@<br />
'Cable 2. Average percentage <strong>of</strong> wheat stubble conserved by<br />
<strong>in</strong>itial one-way disk tillage, 4 <strong>in</strong>ches deep, <strong>in</strong> relation to different<br />
heights and amounts <strong>of</strong> pretillage stubble.<br />
Pretillage<br />
stubble, lb./A.<br />
600<br />
800<br />
1,000<br />
1,200<br />
1.400<br />
1,600<br />
2,000<br />
2,400<br />
2,800<br />
3,200<br />
3,600<br />
4,000<br />
4,400<br />
4,800<br />
5,200<br />
5.600<br />
6,000<br />
6,400<br />
6.800<br />
7.200<br />
Percentage reta<strong>in</strong>ed on surface when stubble height was:<br />
6" 8" 10" 12" 14" 16" 18" 20"<br />
49.4 44.1 40.4<br />
54.4 49.4 44.9<br />
57.4 52.9 49.4<br />
58.4 56.1 52.4 49.4<br />
and the standard error <strong>of</strong> estimate, a, are given for each<br />
<strong>of</strong> the six implements <strong>in</strong> Table 1.<br />
Tables 2 through 5 present predicted percentages <strong>of</strong> residue<br />
conserved for different amounts and heights <strong>of</strong> pretillage<br />
residue as computed for each implement from the<br />
regression data <strong>of</strong> Table 1. Computations were conf<strong>in</strong>ed to<br />
the limits <strong>of</strong> available experimental data.<br />
For maximum retention <strong>of</strong> residues on the surface with<br />
a one-way disk operated at a 4-<strong>in</strong>ch depth, there was an<br />
optimum height <strong>of</strong> stubble for each amount <strong>of</strong> residue<br />
(Table 2). With small quantities and short heights <strong>of</strong><br />
stubble, percentages <strong>of</strong> residue reta<strong>in</strong>ed on the surface <strong>in</strong>creased<br />
with <strong>in</strong>creased height and amount <strong>of</strong> stubble. The<br />
trend reversed after a certa<strong>in</strong> amount and height <strong>of</strong> stubble<br />
was reached. The approximate position <strong>of</strong> the reversal <strong>of</strong><br />
trend is shown by the stepped l<strong>in</strong>e drawn on Table 2.<br />
The %foot V-sweep, the rodweeder with shovels, the<br />
32-<strong>in</strong>ch sweeps, the cultivator with 2-<strong>in</strong>ch chisels, and the<br />
one-way disk work<strong>in</strong>g at 2-<strong>in</strong>ch depth left the greatest percentage<br />
<strong>of</strong> residue on the surface where the available <strong>in</strong>itial<br />
amount <strong>of</strong> stubble was the least and the available height<br />
was the greatest (Tables 3, 4, and 5). The greater the <strong>in</strong>itial<br />
amount <strong>of</strong> stubble, the lower was the percentage <strong>of</strong> stubble<br />
reta<strong>in</strong>ed on the soil surface; the taller the stubble, the<br />
greater was the percentage reta<strong>in</strong>ed.<br />
Crop Residue Reta<strong>in</strong>ed on the Soil Surface<br />
by Second and Subsequent Cultivations<br />
Generally, the implements performed differently on land<br />
previously tilled with subsurface sweeps than.on land previously<br />
tilled with a one-way disk. It was evident that the<br />
percentage <strong>of</strong> residue reta<strong>in</strong>ed by an implement was a function<br />
<strong>of</strong> the way the residue was positioned or oriented by<br />
previous tillage. The percentage <strong>of</strong> residue reta<strong>in</strong>ed on the<br />
soil surface was a function <strong>of</strong> the amount and density <strong>of</strong><br />
residue before the <strong>in</strong>itial tillage.<br />
Regression curves show<strong>in</strong>g the relations between percentages<br />
<strong>of</strong> residue reta<strong>in</strong>ed by each implement and<br />
Table 4. Average percentage <strong>of</strong> wheat stubble conserved by<br />
<strong>in</strong>itial 2-<strong>in</strong>ch chisel cultivator and one-way disk %<strong>in</strong>ch deep<br />
tillage <strong>in</strong> relation to different heights and amounts <strong>of</strong> pretillage<br />
residue.<br />
Pretillage<br />
Percentage reta<strong>in</strong>ed on surface when stubble height was:<br />
stubble, 12,v<br />
lb. /A.<br />
14" 16"<br />
18" 20"<br />
One- Chisel One- One-el One- Chisel One- Chisel One- Chisel<br />
way way way way way<br />
2,000 68.3 80.9 68.4 83.3<br />
2,400 67.3 76.8 68.3 80..5 68.4 82.7<br />
2,800 65.1 71.7 67.3 76.8 68.3 80.1 68.4 82.0<br />
3.200 61.3 64.6 65.4 72.3 67.3 76.8 68.1 79.7 68.4<br />
3,600 56.5 57.1 62.5 66.8 65.7 72.9 67.3 76.8 68.0 79.2<br />
4,000 50.6 48.5 58.7 60.6 66.1 69.0 65.9 73.5 67.3 76.8<br />
4,400 43.4 53.9 53.4 60.2 63.0 64.1 69.7 65.9 73.5<br />
4,800 45.3 56.5 57.1 61.6 65.4 64.4 70.3<br />
5,200 50.5 58.7 60.6 62.1 66.2<br />
5,600 55.3 59.7 62.2<br />
6,000 57.1<br />
Table 5. Average percentage <strong>of</strong> wheat stubble conserved by<br />
<strong>in</strong>itial tillage with 32-<strong>in</strong>ch sweeps (S) and rodweeder with<br />
shovels (RWw/S) <strong>in</strong> relation to different heights and<br />
amounts <strong>of</strong> pre-tillage stubble.<br />
PretiHage<br />
stubble,<br />
lb. /A.<br />
Percentage reta<strong>in</strong>ed on surface when stubble height was:<br />
12w<br />
--- 14" 16" 18"<br />
20"<br />
S RWW/S S RWw/S S RWw/S S RWw/S S RWw/S<br />
2,000 82.9 83.5 85.1 85.9<br />
2.400 79.7 80.1 82.5 83.1<br />
2,800 76.1 76.5 79.7 80.1 82.2 82.8<br />
3,200 71.7 71.5 76.5 76.9 79.7 80.1 81.9 82.4<br />
3,600 67.3 67.7 73.1 73.4 76.9 77.3 79.7 80.1<br />
4,000 62.5 63.2 69.3 69.7 74.4 74.7 77.3 77.7 79.7 80.1<br />
4,400 57.3 58.3 65.2 65.7 70.7 71.1 74.8 75.2 77.3 77.7<br />
4,800 60.8 61.6 67. 3 67.7 72.1 72.5 75.2 75.6<br />
5,200 56.7 57.8 63.6 64.2 69.3 69.7 72.6 72.9<br />
5,600 60.2 61.1 66.2 .66.7 70.2 70.6<br />
6,000 62.5 63.2 67.3 67.7<br />
6,400 64.6 65.3<br />
amounts or densities <strong>of</strong> residue present before cultivation<br />
are shown <strong>in</strong> the follow<strong>in</strong>g sectiok:<br />
Eight-foot V- weep. This implement when used for cultivation<br />
<strong>of</strong> residues previously positioned by subsurface<br />
sweeps was the only one that showed some dependence <strong>of</strong><br />
its performance on density,. pr (Figure 2). Residue retention<br />
on the surface was Increased with greater stubble<br />
height and was decreased as the amount <strong>of</strong> residue and the<br />
<strong>in</strong>i6al residue density was <strong>in</strong>creased. More than 100 percent<br />
<strong>of</strong> residue reta<strong>in</strong>ed means that the V-sweep lifted reGdue to<br />
L<br />
the surface.<br />
Cultivation with the &foot V-sweep after one-way disk<strong>in</strong>g<br />
produced extremely variable resihue retention iesults.<br />
The average percent reta<strong>in</strong>ed for all tests was 92.9 and the<br />
coefficient <strong>of</strong> variation was 27.9%. There was no evidence<br />
<strong>of</strong> relations between percent reta<strong>in</strong>ed and amount or height<br />
<strong>of</strong> pretillage residue.