Performance of Tillage Implements in a Stubble Mulch System. I ...
Performance of Tillage Implements in a Stubble Mulch System. I ...
Performance of Tillage Implements in a Stubble Mulch System. I ...

You also want an ePaper? Increase the reach of your titles
YUMPU automatically turns print PDFs into web optimized ePapers that Google loves.
Purchased by Agricultural Research Service,<br />
U. S. Department <strong>of</strong> Agriculture, for <strong>of</strong>ficial use.<br />
Repr<strong>in</strong>ted from the AGRONOMY JOURNAL<br />
VO~. 57:45-49, 1965.<br />
<strong>Performance</strong> <strong>of</strong> <strong>Tillage</strong> <strong>Implements</strong> <strong>in</strong> a <strong>Stubble</strong> <strong>Mulch</strong> <strong>System</strong>. I. Residue Conservation1<br />
W. S. Chepil and F. H. Siddoway2<br />
SYNOPSIS. Dur<strong>in</strong>g <strong>in</strong> i t i a 1 tillage <strong>of</strong> w<strong>in</strong>ter wheat<br />
stubble, the amount <strong>of</strong> crop residue reta<strong>in</strong>ed on the soil<br />
surface by a given implement varied with height <strong>of</strong><br />
stubble, amount <strong>of</strong> p r e t i 11 age residue, and spac<strong>in</strong>g<br />
between stubble rows. Dur<strong>in</strong>g subsequent tillage, the<br />
amount <strong>of</strong> residue reta<strong>in</strong>ed on the surface was very<br />
slightly affected by height or length <strong>of</strong> residue, moderately<br />
affected by amount <strong>of</strong> pretillage residue, but<br />
strongly <strong>in</strong>fluenced by previous method <strong>of</strong> tillage.<br />
TUBBLE mulch farm<strong>in</strong>g is a year-round system <strong>of</strong> man-<br />
S ag<strong>in</strong>g crop residues so that the soil surface is protected<br />
at all times aga<strong>in</strong>st erosion hazards (4). <strong>Stubble</strong> mulch<strong>in</strong>g<br />
requires special tillage implements which will till the land<br />
and yet ma<strong>in</strong>ta<strong>in</strong> a protective cover <strong>of</strong> residues on the surface.<br />
These requirements are best met by subsurface implements<br />
that cut vegetation roots and loosen the soil without<br />
major surface disturbance, or by disk and chisel implements<br />
that stir the soil without <strong>in</strong>version.<br />
Results <strong>of</strong> a three- ear field study <strong>of</strong> the residue conservation<br />
characteristics <strong>of</strong> six different implements commonly<br />
used <strong>in</strong> stubble mulch farm<strong>in</strong>g are presented. The paper is<br />
concerned with crop residue conservation us<strong>in</strong>g different<br />
implements <strong>in</strong>dividually for <strong>in</strong>itial and subsequent tillage<br />
operations. Subsequent papers will deal with effects <strong>of</strong><br />
these implements on soil clodd<strong>in</strong>ess and with the <strong>in</strong>fluence<br />
<strong>of</strong> different comb<strong>in</strong>ations <strong>of</strong> these implements on crop residues,<br />
soil clodd<strong>in</strong>ess, weed control and wheat yields.<br />
IMPLEMENTS AND PROCEDURES<br />
Studies were conducted at Alliance, Nebraska, <strong>in</strong> 1959, 1960,<br />
and 1961 on a Keith very f<strong>in</strong>e sandy loam. A tillage season ran<br />
from May 1 when <strong>in</strong>itial tillage <strong>of</strong> undisturbed wheat stubble was<br />
performed to September 1 when the last rodweeder operation was<br />
completed. A 12-foot one-way disk equipped with 20-<strong>in</strong>ch disks<br />
spaced 8 <strong>in</strong>ches apart and operated at approximately a 38" angle,<br />
a 12-foot chisel mach<strong>in</strong>e equipped with 2-<strong>in</strong>ch chisels spaced 12<br />
<strong>in</strong>ches apart, a 12-foot sweep implement equipped with five 32-<br />
<strong>in</strong>ch V-sweeps, and 8-foot s<strong>in</strong>gle V-sweep, and a 12-foot rodweeder<br />
equipped with 8-<strong>in</strong>ch duckfoot shovels were used as <strong>in</strong>itial<br />
tillage mach<strong>in</strong>es. Photographs and descriptions <strong>of</strong> these mach<strong>in</strong>es<br />
are found <strong>in</strong> a previous publication by Fenster (3).<br />
A pla<strong>in</strong> rodweeder and all <strong>of</strong> the above-mentioned implements<br />
except the 2-<strong>in</strong>ch chisels were used <strong>in</strong> cultivations spaced about 1<br />
month apart throughout the tillage season. One-way and 8-foot<br />
V-sweep tillage was performed on 6-, 8-, lo-, 12-, 14-, and 19-<strong>in</strong>ch<br />
stubble. The rema<strong>in</strong>der <strong>of</strong> the implements were used on 12-, 14-,<br />
and W<strong>in</strong>ch stubble. Plots were 50 feet wide by 80 feet long. All<br />
treatments were replicated three times. Depth <strong>of</strong> <strong>in</strong>itial tillage was<br />
4 <strong>in</strong>ches for all implements except the one-way, which was oper-<br />
Contribution from the Soil and Water Conservation Research<br />
Division, ARS, USDA, and the Kansas and Nebraska Agricultural<br />
Experiment Stations. Published with the approval <strong>of</strong> the Directors<br />
as Paper Numbers 847 and 1520, Journal Series, Kansas and<br />
Nebraska Agricultural Experiment Station, respectively. Received<br />
Mty 28: 1964.<br />
Agricultural Eng<strong>in</strong>eer, Research Investigations Leader (deceased),<br />
and Soil Scientist, respectively, USDA, Manhattan, Kansas.<br />
Extension Agronomist, Box Butte Experiment Station, University<br />
<strong>of</strong> Nebraska, L<strong>in</strong>coln, Nebraska. Grateful acknowledgement is<br />
made to D. W. Fryrear and Leon Lyles, Agricultural Eng<strong>in</strong>eers,<br />
USDA; to D. V. Armbrust, Soil Scientist, USDA; and to Paul<br />
Ehlers, Super<strong>in</strong>tendent <strong>of</strong> the Box Butte Experiment Station, University<br />
<strong>of</strong> Nebraska, for their assistance and cooperation <strong>in</strong> conduct<strong>in</strong>g<br />
these experiments.<br />
USDA, ARS 41-68, July 1962.<br />
ated at both a 4- and 2-<strong>in</strong>ch depth. Tractor speed was 4.0 to 4.5<br />
miles per hour.<br />
Surface residues were measured just before <strong>in</strong>itial tillage and<br />
immediately after each tillage operation. Three square-yard samples<br />
were taken from each plot, each sampl<strong>in</strong>g giv<strong>in</strong>g a total <strong>of</strong> 9<br />
samples per treatment. Sampl<strong>in</strong>g and process<strong>in</strong>g <strong>of</strong> residues were<br />
performed <strong>in</strong> accordance with Agricultural Research Service Standardized<br />
Pr~cedure.~ Quantities <strong>of</strong> stand<strong>in</strong>g wheat stubble residue<br />
before Initial tillage were expressed <strong>in</strong> units <strong>of</strong> density (pounds<br />
per cubic foot), and quantities <strong>of</strong> residue before subsequent cultivation<br />
tillage were expressed <strong>in</strong> terms <strong>of</strong> pounds per acre. Density<br />
as def<strong>in</strong>ed here is the weight <strong>of</strong> residue <strong>in</strong> pounds divided by the<br />
volume <strong>in</strong> cubic feet <strong>in</strong> which the residue is conta<strong>in</strong>ed. The volume<br />
has a vertical dimension equal to the height <strong>of</strong> the stubble.<br />
Thus, density is affected by height and weight <strong>of</strong> stubble and the<br />
spac<strong>in</strong>g between rows <strong>of</strong> stubble. The proportion <strong>of</strong> residue rema<strong>in</strong><strong>in</strong>g<br />
on the land surface after a given tillage operation was expressed<br />
as a percentage <strong>of</strong> that just before the <strong>in</strong>itial tillage or that<br />
just after the previous tillage operation. Thus, the comb<strong>in</strong>ed <strong>in</strong>fluence<br />
<strong>of</strong> both the tillage operation and the decomposition between<br />
each tillage operation is evaluated.<br />
L<strong>in</strong>ear and curvil<strong>in</strong>ear regression procedures were used to establish<br />
relations between percentage <strong>of</strong> residue rema<strong>in</strong><strong>in</strong>g after each<br />
tillage operation with respect to amount or density <strong>of</strong> pretillage<br />
residue.<br />
RESULTS<br />
Crop Residues Rema<strong>in</strong><strong>in</strong>g on the Soil Surface<br />
After Initial <strong>Tillage</strong><br />
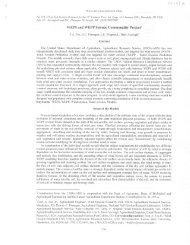
Amount <strong>of</strong> residue conserved by a given implement was<br />
affected by density <strong>of</strong> pretillage residue, p, (Figure 1).<br />
The percentage <strong>of</strong> residue rema<strong>in</strong><strong>in</strong>g on the surface after<br />
<strong>in</strong>itial tillage, Y, can be expressed by a second degree curve<br />
Y = a + bp - pr2, where p, is residue density and a, b,<br />
and c are constants determ<strong>in</strong>ed by regression procedures.<br />
Examples <strong>of</strong> two such curves are shown <strong>in</strong> Figure 1. The<br />
values <strong>of</strong> constants a, b, and c, the regression coefficient, r,<br />
W<br />
(3<br />
l OOr<br />
RESIDUE<br />
8' V- SWEE P<br />
ONE-WAY. 4' DEEP<br />
DENSITY, $ IN LBS./FT.~<br />
Figure 1. Percentage <strong>of</strong> residue reta<strong>in</strong>ed on land surface after<br />
<strong>in</strong>itial tillage with the &foot V-sweep and the one-way<br />
implements as related to density <strong>of</strong> pretillage residue.
46 AGRONOMY JOURNAL<br />
Table 1. Values <strong>in</strong> the regression equation Y = a + b(~r) -<br />
C(pr)' for each implement used for <strong>in</strong>itial tillage <strong>of</strong> wheat<br />
stubble.<br />
Table 3. Average percentage <strong>of</strong> wheat stubble conserved by<br />
<strong>in</strong>itial &foot V-sweep tillage <strong>in</strong> relation to different heights<br />
and amounts <strong>of</strong> pre-tillage stubble.<br />
Implement Constants Regress. Standard error<br />
coeff., r <strong>of</strong> estlmateq %<br />
a b c -<br />
8-foot V-sweep 92.3 37 - 3,685 0.89 * 4.3<br />
One-way, 4 <strong>in</strong>ches deep 20.6 1,382 -12,625 0.72 * 8.2<br />
Rodweeder with shovels 96.3 -196 - 1,782 0.56 + 9.8<br />
One-way, 2 <strong>in</strong>ches deep 55.2 623 - 7,322 0.75 8.0<br />
32-<strong>in</strong>ch sweeps 93.2 -114 - 2.392 0.50 ill. 9<br />
2-<strong>in</strong>ch chisel cultivator 84.5 235 - 6,808 0.75 i 9.6<br />
Pretlllage<br />
Percentage reta<strong>in</strong>ed on surface when stubble height was:<br />
stubble, lb./A. 6,t lo,, 12,t 1411 16" 18" 2@<br />
'Cable 2. Average percentage <strong>of</strong> wheat stubble conserved by<br />
<strong>in</strong>itial one-way disk tillage, 4 <strong>in</strong>ches deep, <strong>in</strong> relation to different<br />
heights and amounts <strong>of</strong> pretillage stubble.<br />
Pretillage<br />
stubble, lb./A.<br />
600<br />
800<br />
1,000<br />
1,200<br />
1.400<br />
1,600<br />
2,000<br />
2,400<br />
2,800<br />
3,200<br />
3,600<br />
4,000<br />
4,400<br />
4,800<br />
5,200<br />
5.600<br />
6,000<br />
6,400<br />
6.800<br />
7.200<br />
Percentage reta<strong>in</strong>ed on surface when stubble height was:<br />
6" 8" 10" 12" 14" 16" 18" 20"<br />
49.4 44.1 40.4<br />
54.4 49.4 44.9<br />
57.4 52.9 49.4<br />
58.4 56.1 52.4 49.4<br />
and the standard error <strong>of</strong> estimate, a, are given for each<br />
<strong>of</strong> the six implements <strong>in</strong> Table 1.<br />
Tables 2 through 5 present predicted percentages <strong>of</strong> residue<br />
conserved for different amounts and heights <strong>of</strong> pretillage<br />
residue as computed for each implement from the<br />
regression data <strong>of</strong> Table 1. Computations were conf<strong>in</strong>ed to<br />
the limits <strong>of</strong> available experimental data.<br />
For maximum retention <strong>of</strong> residues on the surface with<br />
a one-way disk operated at a 4-<strong>in</strong>ch depth, there was an<br />
optimum height <strong>of</strong> stubble for each amount <strong>of</strong> residue<br />
(Table 2). With small quantities and short heights <strong>of</strong><br />
stubble, percentages <strong>of</strong> residue reta<strong>in</strong>ed on the surface <strong>in</strong>creased<br />
with <strong>in</strong>creased height and amount <strong>of</strong> stubble. The<br />
trend reversed after a certa<strong>in</strong> amount and height <strong>of</strong> stubble<br />
was reached. The approximate position <strong>of</strong> the reversal <strong>of</strong><br />
trend is shown by the stepped l<strong>in</strong>e drawn on Table 2.<br />
The %foot V-sweep, the rodweeder with shovels, the<br />
32-<strong>in</strong>ch sweeps, the cultivator with 2-<strong>in</strong>ch chisels, and the<br />
one-way disk work<strong>in</strong>g at 2-<strong>in</strong>ch depth left the greatest percentage<br />
<strong>of</strong> residue on the surface where the available <strong>in</strong>itial<br />
amount <strong>of</strong> stubble was the least and the available height<br />
was the greatest (Tables 3, 4, and 5). The greater the <strong>in</strong>itial<br />
amount <strong>of</strong> stubble, the lower was the percentage <strong>of</strong> stubble<br />
reta<strong>in</strong>ed on the soil surface; the taller the stubble, the<br />
greater was the percentage reta<strong>in</strong>ed.<br />
Crop Residue Reta<strong>in</strong>ed on the Soil Surface<br />
by Second and Subsequent Cultivations<br />
Generally, the implements performed differently on land<br />
previously tilled with subsurface sweeps than.on land previously<br />
tilled with a one-way disk. It was evident that the<br />
percentage <strong>of</strong> residue reta<strong>in</strong>ed by an implement was a function<br />
<strong>of</strong> the way the residue was positioned or oriented by<br />
previous tillage. The percentage <strong>of</strong> residue reta<strong>in</strong>ed on the<br />
soil surface was a function <strong>of</strong> the amount and density <strong>of</strong><br />
residue before the <strong>in</strong>itial tillage.<br />
Regression curves show<strong>in</strong>g the relations between percentages<br />
<strong>of</strong> residue reta<strong>in</strong>ed by each implement and<br />
Table 4. Average percentage <strong>of</strong> wheat stubble conserved by<br />
<strong>in</strong>itial 2-<strong>in</strong>ch chisel cultivator and one-way disk %<strong>in</strong>ch deep<br />
tillage <strong>in</strong> relation to different heights and amounts <strong>of</strong> pretillage<br />
residue.<br />
Pretillage<br />
Percentage reta<strong>in</strong>ed on surface when stubble height was:<br />
stubble, 12,v<br />
lb. /A.<br />
14" 16"<br />
18" 20"<br />
One- Chisel One- One-el One- Chisel One- Chisel One- Chisel<br />
way way way way way<br />
2,000 68.3 80.9 68.4 83.3<br />
2,400 67.3 76.8 68.3 80..5 68.4 82.7<br />
2,800 65.1 71.7 67.3 76.8 68.3 80.1 68.4 82.0<br />
3.200 61.3 64.6 65.4 72.3 67.3 76.8 68.1 79.7 68.4<br />
3,600 56.5 57.1 62.5 66.8 65.7 72.9 67.3 76.8 68.0 79.2<br />
4,000 50.6 48.5 58.7 60.6 66.1 69.0 65.9 73.5 67.3 76.8<br />
4,400 43.4 53.9 53.4 60.2 63.0 64.1 69.7 65.9 73.5<br />
4,800 45.3 56.5 57.1 61.6 65.4 64.4 70.3<br />
5,200 50.5 58.7 60.6 62.1 66.2<br />
5,600 55.3 59.7 62.2<br />
6,000 57.1<br />
Table 5. Average percentage <strong>of</strong> wheat stubble conserved by<br />
<strong>in</strong>itial tillage with 32-<strong>in</strong>ch sweeps (S) and rodweeder with<br />
shovels (RWw/S) <strong>in</strong> relation to different heights and<br />
amounts <strong>of</strong> pre-tillage stubble.<br />
PretiHage<br />
stubble,<br />
lb. /A.<br />
Percentage reta<strong>in</strong>ed on surface when stubble height was:<br />
12w<br />
--- 14" 16" 18"<br />
20"<br />
S RWW/S S RWw/S S RWw/S S RWw/S S RWw/S<br />
2,000 82.9 83.5 85.1 85.9<br />
2.400 79.7 80.1 82.5 83.1<br />
2,800 76.1 76.5 79.7 80.1 82.2 82.8<br />
3,200 71.7 71.5 76.5 76.9 79.7 80.1 81.9 82.4<br />
3,600 67.3 67.7 73.1 73.4 76.9 77.3 79.7 80.1<br />
4,000 62.5 63.2 69.3 69.7 74.4 74.7 77.3 77.7 79.7 80.1<br />
4,400 57.3 58.3 65.2 65.7 70.7 71.1 74.8 75.2 77.3 77.7<br />
4,800 60.8 61.6 67. 3 67.7 72.1 72.5 75.2 75.6<br />
5,200 56.7 57.8 63.6 64.2 69.3 69.7 72.6 72.9<br />
5,600 60.2 61.1 66.2 .66.7 70.2 70.6<br />
6,000 62.5 63.2 67.3 67.7<br />
6,400 64.6 65.3<br />
amounts or densities <strong>of</strong> residue present before cultivation<br />
are shown <strong>in</strong> the follow<strong>in</strong>g sectiok:<br />
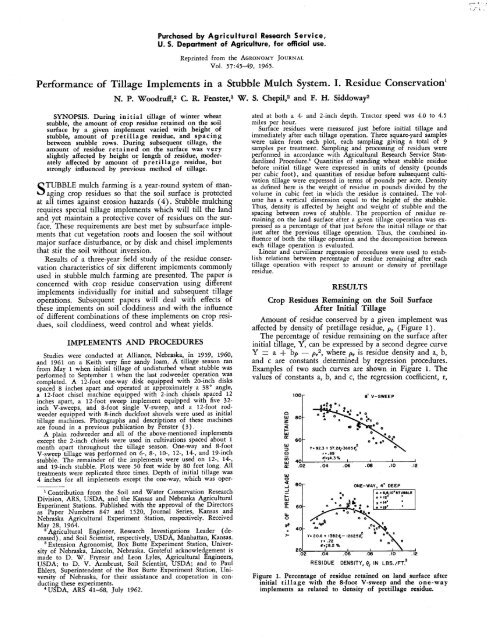
Eight-foot V- weep. This implement when used for cultivation<br />
<strong>of</strong> residues previously positioned by subsurface<br />
sweeps was the only one that showed some dependence <strong>of</strong><br />
its performance on density,. pr (Figure 2). Residue retention<br />
on the surface was Increased with greater stubble<br />
height and was decreased as the amount <strong>of</strong> residue and the<br />
<strong>in</strong>i6al residue density was <strong>in</strong>creased. More than 100 percent<br />
<strong>of</strong> residue reta<strong>in</strong>ed means that the V-sweep lifted reGdue to<br />
L<br />
the surface.<br />
Cultivation with the &foot V-sweep after one-way disk<strong>in</strong>g<br />
produced extremely variable resihue retention iesults.<br />
The average percent reta<strong>in</strong>ed for all tests was 92.9 and the<br />
coefficient <strong>of</strong> variation was 27.9%. There was no evidence<br />
<strong>of</strong> relations between percent reta<strong>in</strong>ed and amount or height<br />
<strong>of</strong> pretillage residue.
WOODRUFF ET AL.: *PERFORMANCE OF IMPLEMENTS IN STUBBLE MULCH SYSTEM. I.<br />
8' V-SWEEP CULTIVATION<br />
AFTER<br />
SUESURFACE SWEEPING<br />
0<br />
.RODWEEDER<br />
W/SHOVEL CULTIVATION<br />
u 100<br />
K<br />
rx.88<br />
, , HEIGHT IN INCHES W4S:<br />
I500 116<br />
3000 58 60 87 97<br />
4000 44 59 66 73<br />
5000 40 45 50 56<br />
01 1 1 I I 1<br />
0 .02 .04 .06 .08 .I0<br />
RESIDUE DENSITY, Qr IN LBS./FT<br />
Figure 2. Percentage <strong>of</strong> residue reta<strong>in</strong>ed on land surface after<br />
cultivation tillage <strong>of</strong> subsurface positioned residue with an<br />
8-foot V-sweep as related to density <strong>of</strong> precultivation cover.<br />
401 I I I I I J<br />
1000 1500 2000 2500 3000 3500 4000<br />
AMOUNT OF RESIDUE, A IN LBS./ACRE<br />
Figure 4. Residue reta<strong>in</strong>ed on land surface after cultivation<br />
tillage <strong>of</strong> subsurface and one-way positioned residue with a<br />
rodweeder with shovels as related to amount <strong>of</strong> precultivation<br />
residue.<br />
8 140p .a. 32" SWEEP CULTIVATION<br />
\ /-<br />
AFTER ONE-WAYING<br />
Y * 137.8 - .Ol9 A<br />
6 = 14.4<br />
r m.7 7<br />
O\<br />
:I<br />
40 500 loo0 1500 2000 2500 3000 3500 4000 4500<br />
AMOUNT OF RESIDUE, A IN<br />
LBS./ACRE<br />
Figure 3. R,esidue reta<strong>in</strong>ed on land surface after cultivation<br />
tillage <strong>of</strong> one-way positioned residue with 32-<strong>in</strong>ch sweeps<br />
as related to amount <strong>of</strong> precultivation residue.<br />
Y(<br />
W<br />
110-<br />
W<br />
so-<br />
'C<br />
u.<br />
O 70 -<br />
#<br />
I,<br />
><br />
50 -<br />
.<br />
OW* ONE-WAY DISK<br />
Nn 8' V-SWEEP<br />
S= 32' SWEEPS<br />
cn= RODWEEDER WISHOVELS<br />
One-way disk. This implement used after tillage with a<br />
one-way disk and subsurface sweeps also produced extremely<br />
variable results. The average percentage <strong>of</strong> residue<br />
reta<strong>in</strong>ed with a one-way after the land was previously onewayed<br />
was 70.1. The coefficient <strong>of</strong> variation was 30.5%.<br />
The average percent reta<strong>in</strong>ed with a one-way on land previously<br />
tilled with an 8-foot V-sweep was 52.7. The coefficient<br />
<strong>of</strong> variation was 38.1 %. The one-way disk never<br />
<strong>in</strong>creased the amount <strong>of</strong> residue on the surface but the<br />
percentage it buried varied with the k<strong>in</strong>d <strong>of</strong> implement<br />
used previous to one-way disk<strong>in</strong>g.<br />
Thirty-two-<strong>in</strong>ch sweeps. This implement used after oneway<strong>in</strong>g<br />
gave reasonably uniform results (Figure 3). The<br />
greater the amount <strong>of</strong> residue before cultivation with this<br />
implement, the lower the percentage <strong>of</strong> residue conserved<br />
on the surface.<br />
Thirty-two-<strong>in</strong>ch sweeps used after previous subsurface<br />
sweep tillage produced variable results. No def<strong>in</strong>ite relations<br />
between percentage reta<strong>in</strong>ed and amount <strong>of</strong> precultivation<br />
residue were evident. The average percentage reta<strong>in</strong>ed<br />
from tests work<strong>in</strong>g <strong>in</strong> residue quantities vary<strong>in</strong>g<br />
from 1,500 to 4,000 ounds per acre was 86.3. The coefficient<br />
<strong>of</strong> variation o the data was 20.6%.<br />
P<br />
AMOUNT OF RESIDUE, A IN LBSJACRE<br />
RODWEEDER attar 2 mirad<br />
operations, 8.g.(OW-S) etc.<br />
Figure 5. Percentage <strong>of</strong> residue reta<strong>in</strong>ed on land surface after<br />
cultivation tillage with a pla<strong>in</strong> rodweeder as related to<br />
amount <strong>of</strong> precultivation residue.
48 AGRONOMY JOURNAL<br />
Rodweedev with shovels. This implement used after previous<br />
subsurface sweep<strong>in</strong>g and after one-way disk<strong>in</strong>g produced<br />
reasonably uniform results (Figure 4). The greater<br />
the amount <strong>of</strong> residue, the smaller the percentage <strong>of</strong> residue<br />
conserved on the surface. The rodweeder with shovels<br />
lifted the residue and <strong>in</strong>creased the amount at the surface<br />
when work<strong>in</strong>g <strong>in</strong> amounts less than about 1,500 pounds<br />
per acre (Figure 4).<br />
Pla<strong>in</strong> rodweeder. Analyses <strong>of</strong> data from cultivation with<br />
the pla<strong>in</strong> rodweeder <strong>in</strong>dicated that different results were obta<strong>in</strong>ed<br />
with this implement under different sequences <strong>of</strong><br />
tillage. The data were grouped accord<strong>in</strong>g to the follow<strong>in</strong>g<br />
five tillage sequences :<br />
1. First rodweeder operation after the land had received<br />
a one-way disk-subsurface sweep sequence<br />
<strong>of</strong> tillage.<br />
2. First rodweeder operatio<strong>in</strong> after the land had received<br />
a sweep-sweep sequence <strong>of</strong> tillage.<br />
3. Last tillage with rodweeder after a sweep-sweepsweep<br />
sequence <strong>of</strong> tillage.<br />
4. Last tillage with rodweeder after a one-way-sweepsweep<br />
sequence <strong>of</strong> tillage.<br />
5. Second rodweeder operation follow<strong>in</strong>g rodweed<strong>in</strong>g.<br />
The relations between percentage <strong>of</strong> residue reta<strong>in</strong>ed and<br />
amount <strong>of</strong> precultivation residue for sequences 1, 3, and 4<br />
on the previous page are shown <strong>in</strong> Figure 5.<br />
No def<strong>in</strong>ite relations between percentages reta<strong>in</strong>ed and<br />
amount <strong>of</strong> precultivation residue were evident for sequences<br />
<strong>of</strong> tillage 3 and 5. The average percentage reta<strong>in</strong>ed<br />
was 92.1 with a coefficient <strong>of</strong> variation <strong>of</strong> 19.0% for sequence<br />
3 and 93.5% with a coefficient <strong>of</strong> variation <strong>of</strong><br />
25.2% for sequence 5.<br />
DISCUSSION<br />
Initial <strong>Tillage</strong><br />
Data from this study help to estimate how much crop<br />
residue can be reta<strong>in</strong>ed on the soil surface with an 8-foot<br />
V-sweep, a 2-<strong>in</strong>ch chisel-po<strong>in</strong>t cultivator, and a one-way<br />
disk. The regression equation for the %foot V-sweep accounts<br />
for about 80% <strong>of</strong> the variability. Somewhat less<br />
confidence can be placed on the one-way 2- and 4-<strong>in</strong>ch<br />
depths <strong>of</strong> tillage and on the 2-<strong>in</strong>ch chisel data because the<br />
regression equations account for only 50 to 60% <strong>of</strong> the<br />
variability. The rodweeder with shovels and the 32-<strong>in</strong>chsweep<br />
data were extremely variable and the prediction<br />
equation could be expected to be correct only about 25 to<br />
30% <strong>of</strong> the time. The poor correlation with rodweeder and<br />
32-<strong>in</strong>ch sweeps may be due to lack <strong>of</strong> sufficient data; however,<br />
Anderson (2) has also reported considerable variation<br />
<strong>in</strong> residue conservation patterns for these implements.<br />
The data on the one-way disk used at a 4-<strong>in</strong>ch depth<br />
showed the effects <strong>of</strong> the one-way used on short, small<br />
quantities <strong>of</strong> residue and tall, large quantities. The results<br />
are <strong>in</strong> fair agreement with the short-stubble, low-quantity<br />
data <strong>of</strong> Anderson (2) which show an <strong>in</strong>creased percentage<br />
<strong>of</strong> residue reta<strong>in</strong>ed for <strong>in</strong>creased amounts <strong>of</strong> orig<strong>in</strong>al cover.<br />
A reversal <strong>of</strong> the percent reta<strong>in</strong>ed <strong>in</strong> relation to <strong>in</strong>itial stubble<br />
is shown for 12- to 14-<strong>in</strong>ch-high stubble at amounts <strong>of</strong><br />
2,000 and 2,400 pounds per acre. However, the data <strong>of</strong><br />
Anderson for 2,800 and 3,400 pounds per acre with 13-<br />
<strong>in</strong>ch-high stubble show an <strong>in</strong>creas<strong>in</strong>g percent <strong>in</strong> relation to<br />
<strong>in</strong>itial stubble.<br />
Figure 2 and Tables 2 through 5 show that differences <strong>in</strong><br />
percentage <strong>of</strong> residue reta<strong>in</strong>ed on the soil surface are be-<br />
tween mix<strong>in</strong>g and subsurface types <strong>of</strong> implements; i.e.,<br />
there is little difference <strong>in</strong> the percentage <strong>of</strong> residue reta<strong>in</strong>ed<br />
by an 8-foot V-sweep, a 32-<strong>in</strong>ch sweep, or a rodweeder<br />
with shovels, but there are substantial differences<br />
between results from those mach<strong>in</strong>es and one-ways.<br />
Comparable figures for these mach<strong>in</strong>es reported by other<br />
<strong>in</strong>vestigators are:<br />
1. Anderson (1, 2)-80 to 95% reta<strong>in</strong>ed with large<br />
sweeps work<strong>in</strong>g <strong>in</strong> 1,200- to 3,700-pound-per-acre<br />
residues; 44 to 58% with one-ways work<strong>in</strong>g <strong>in</strong><br />
1,350- to 3,400-pound-per-acre residues; and 30 to<br />
50% with small sweeps (16-<strong>in</strong>ch) work<strong>in</strong>g <strong>in</strong><br />
1,080 to 3,100-pound-per-acre residues.<br />
2. Fenster (3)-90% reta<strong>in</strong>ed with straight-blade<br />
implements, 50 to 75% percent with V-sweeps, 40<br />
to 60% with rodweeders with shovels, 30 to 70%<br />
with one-way disks, 50 to 70% with chisels, and<br />
90% with rodweeders.<br />
3. Siddoway et al. (6)-60% reta<strong>in</strong>ed with a oneway<br />
disk when residues were as much as 4,000<br />
pounds per acre.<br />
4. Krall et al. (5)-65 to 70% reta<strong>in</strong>ed with oneway<br />
work<strong>in</strong>g <strong>in</strong> 4,000-pound-per-acre residues.<br />
5. Woodruff and Chepil (7)-50% reta<strong>in</strong>ed with<br />
one-way disk and 85% with 8-foot V-sweep when<br />
work<strong>in</strong>g <strong>in</strong> 2,000-pound-per-acre residues.<br />
Second and Subsequent Cultivations<br />
The cultivation results <strong>of</strong> the different implements were<br />
more variable than the data obta<strong>in</strong>ed from <strong>in</strong>itial tillage.<br />
Previous position<strong>in</strong>g <strong>of</strong> residue by tillage <strong>in</strong>fluences the<br />
amounts <strong>of</strong> residue reta<strong>in</strong>ed dur<strong>in</strong>g cultivation. Amounts<br />
<strong>of</strong> precultivation residue are important with some <strong>of</strong> the<br />
mach<strong>in</strong>es. An effect <strong>of</strong> stubble height was evident with 8-<br />
foot V-sweep cultivation <strong>of</strong> residues previously positioned<br />
with sweeps.<br />
The prediction equation obta<strong>in</strong>ed for the pla<strong>in</strong> rodweeder<br />
used after 3 sweep operations and for the 8-foot<br />
V-sweep used after the V-sweep operations accounted for<br />
86 and 78%, respectively, <strong>of</strong> the variability. Regressions<br />
for the 32-<strong>in</strong>ch sweeps after one-way disk<strong>in</strong>g accounted<br />
for 60%; rodweeder with shovels after one-way<strong>in</strong>g, 61%;<br />
and the pla<strong>in</strong> rodweeder after 3 mixed operations, 54% <strong>of</strong><br />
the variability. Other prediction equations are <strong>of</strong> limited<br />
value because they account for only about 37% <strong>of</strong> the<br />
variability.<br />
Figure 5 <strong>in</strong>dicates that the pla<strong>in</strong> rodweeder varies <strong>in</strong><br />
performance, depend<strong>in</strong>g upon conditions and sequence <strong>of</strong><br />
operation. When used early <strong>in</strong> the tillage season after 2<br />
mixed tillage operations (lower graph, Figure 5) the percentage<br />
<strong>of</strong> residue reta<strong>in</strong>ed <strong>in</strong>creases with <strong>in</strong>creased<br />
amounts <strong>of</strong> precultivation residue. Later <strong>in</strong> the season follow<strong>in</strong>g<br />
3 mixed (top graph, Figure 5) or all sweep (middle<br />
graph, Figure 5) operations, percentages reta<strong>in</strong>ed decrease<br />
with <strong>in</strong>creas<strong>in</strong>g amounts <strong>of</strong> precultivation residue.<br />
SUMMARY<br />
Results <strong>of</strong> a 3-year study <strong>of</strong> the residue conservation<br />
characteristics <strong>of</strong> 6 different implements used <strong>in</strong> stubble<br />
mulch farm<strong>in</strong>g are presented.<br />
The percentage <strong>of</strong> residue rema<strong>in</strong><strong>in</strong>g on the surface after<br />
<strong>in</strong>itial tillage varied with height and amount <strong>of</strong> residue and<br />
with spac<strong>in</strong>g between stubble rows. Regression relations<br />
were obta<strong>in</strong>ed between percentage <strong>of</strong> residue reta<strong>in</strong>ed and<br />
residue density. These equations can be used to predict the
WOODRUFF ET AL.: PERFORMANCE OF IMPLEMENTS IN STUBBLE MULCH SYSTEM I. 49<br />
amounts <strong>of</strong> wheat residue that could be conserved on the<br />
soil surface by different implements.<br />
Variation <strong>of</strong> the residue retention data from <strong>in</strong>itial tillage<br />
was relatively low for the 8-foot V-sweep, the one-way<br />
disk, and the 2-<strong>in</strong>ch-chisel cultivator. The rodweeder with<br />
shovels and the 32-<strong>in</strong>ch sweeps produced erratic results,<br />
and only limited confidence can be placed <strong>in</strong> values computed<br />
from the prediction equations.<br />
For maximum retention <strong>of</strong> residues on the surface dur<strong>in</strong>g<br />
<strong>in</strong>itial tillage with a one-way disk there was an optimum<br />
height <strong>of</strong> stubble for each amount <strong>of</strong> residue.<br />
A comparison <strong>of</strong> mach<strong>in</strong>e performance dur<strong>in</strong>g <strong>in</strong>itial tillage<br />
showed substantial differences <strong>in</strong> surface residue retention<br />
between the subsurface implements and one-way<br />
disks.<br />
Previous position<strong>in</strong>g <strong>of</strong> the residue had an important<br />
effect on amounts <strong>of</strong> residue reta<strong>in</strong>ed on the land surface<br />
dur<strong>in</strong>g second and subsequent cultivation. Amounts <strong>of</strong> precultivation<br />
residue are important with some mach<strong>in</strong>es and<br />
seem to make no difference with others. Height <strong>of</strong> stubble<br />
had an effect only with 8-foot V-sweep cultivation <strong>of</strong> land<br />
that had been tilled previously with subsurface implements.<br />
The subsurface implements <strong>in</strong>creased residues when used<br />
after some tillage implements, and decreased residues when<br />
used after others. Actual percentages <strong>of</strong> residue reta<strong>in</strong>ed on<br />
the surface depended on the amount <strong>of</strong> residue which the<br />
implements were work<strong>in</strong>g and on previous position<strong>in</strong>g <strong>of</strong><br />
the residue.<br />
The pla<strong>in</strong> rodweeder reta<strong>in</strong>ed vary<strong>in</strong>g amounts <strong>of</strong> residue,<br />
depend<strong>in</strong>g on previous tillage sequences. Data are presented<br />
on effects <strong>of</strong> five different tillage sequences.<br />
LITERATURE CITED<br />
1. ANDERSON, D. T. Handl<strong>in</strong>g straw and trash cover. Agr. Inst.<br />
Rev. 8: 13-15. September-October 1953.<br />
2. . Surface trash conservation with tillage mach<strong>in</strong>es.<br />
Canad. J. Soil Sci. 41:99-114. 1961.<br />
3. FENSTER, C. R. <strong>Stubble</strong> mulch<strong>in</strong>g with various types <strong>of</strong> mach<strong>in</strong>ery.<br />
Soil Sci. Soc. Am. Proc. 24:51&523. 1960.<br />
,<br />
4. -- , DULEY, F. L., and SWINBANK, J. C. Questions<br />
and answers about stubble mulch<strong>in</strong>g. Nebraska Ext. Cir. 58-<br />
123. Revised 1959.<br />
5. KRALL, JAMES L., POWER, JAMES F., and MASSEE, TRUMAN W.<br />
Summer fallow<strong>in</strong>g methods related to erosion and wheat production.<br />
Montana Agr. Exp. Sta. Bul. 540, 34 pages. 1958.<br />
6. SIDDOWAY, F. H., MCKAY, H. C., and KLAGES, K. H. Dryland<br />
tillage methods and implements. Idaho Agr. Exp. Sta. Bul. 252,<br />
46 pages. 1956.<br />
7. WOODRUFF, N. P., and CHEPIL, W. S. Influence <strong>of</strong> one-waydisk<br />
and subsurface-sweep tillage on factors affect<strong>in</strong>g w<strong>in</strong>d erosion.<br />
Trans. Am. Soc. Agr. Eng<strong>in</strong>. 1:81-85. 1958.