Soil Conservation: Principles of Erosion by Wind - USDA-ARS Wind ...
Soil Conservation: Principles of Erosion by Wind - USDA-ARS Wind ...
Soil Conservation: Principles of Erosion by Wind - USDA-ARS Wind ...
- No tags were found...
Create successful ePaper yourself
Turn your PDF publications into a flip-book with our unique Google optimized e-Paper software.
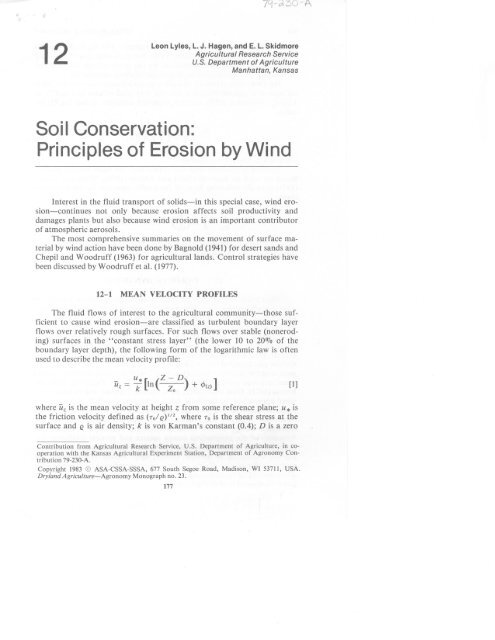
SOIL CONSERVATION: PRINCIPLES OF EROSION BY WIND 17912-2.1 SuspensionSuspension <strong>of</strong> particulates <strong>by</strong> wind erosion <strong>of</strong>ten causes loss <strong>of</strong> productivityon the eroding field (Lyles, 1975), transport causes visibility andhealth hazards, and deposition causes chemical and sediment pollution. Thesuspended particles can range in size from about 2 to 100 pm, with massmedian diameter <strong>of</strong> about 50 pm in an eroding field (Chepil, 1957a; Gilletteand Walker, 1977). However, in long-distance transport, particles less than20 pm in diameter predominate, because the larger particles have significantsedimentation velocities (Gillette, 1977). Some suspension-size particles arepresent in the soil, but many are created <strong>by</strong> abrasive breakdown during erosion.Some <strong>of</strong> the smallest are carried in crevices on the larger particles andare shed on impact (Rosinski et al., 1976).Vertical flux (F,) <strong>of</strong> suspension-size particles is <strong>of</strong>ten described <strong>by</strong>where u* is friction velocity, Fo is a reference flux at a reference frictionvelocity u*~, and P is a power that can range from about 2 to 6 (Englemannand Sehmel, 1976). Some evidence shows that P is about 3 on sandy soils(Le., vertical flux increases at the same rate as horizontal), but P may belarger on finer-textured soils (Gillette, 1977). The value <strong>of</strong> Fo is also uncertain.Chepil (1945) reported that 3 to 38% <strong>of</strong> the eroding soil could becarried in suspension, depending on soil texture. Generally, the vertical fluxis less than 10% <strong>of</strong> the horizontal (Gillette, 1977, 1978).Concentration pr<strong>of</strong>iles <strong>of</strong> suspended particulates can be easily predictedonly for equilibrium conditions. When net vertical flux is zero,where V, is settling velocity and x is concentration. If particulate eddy diffusivity(K) is equal to that for momentum, K = u,kZ, where k z 0.4 andZ is height above the surface, the solution <strong>of</strong> Eq. [5] isx = x, (z/z,)- Vs’’*k. 161Measurements during soil erosion confirm that these concentration pr<strong>of</strong>ilesfrequently occur (Chepil and Woodruff, 1957).Widespread wind erosion causes dust storms, whose climatology in thecontiguous USA has been studied <strong>by</strong> Orgill and Sehmel(l976). Highest dustfrequency (with visibility less than 11 km) occurs in the Southern GreatPlains, where most <strong>of</strong> the area is affected <strong>by</strong> dust 1% <strong>of</strong> the time. A smallpart <strong>of</strong> the area is affected <strong>by</strong> dust 3% <strong>of</strong> the time. Secondary dust frequencymaxima occur in the western states, Northern Great Plains,Southern Coastal Pacific and inland valleys, and the Southeast. Highest frequenciesoccur in the afternoon between 1200 and 2000 local standard time.In the Great Plains, Hagen and Woodruff (1973) found the average dust
180 LYLES, HAGEN, & SKIDMOREstorm to last 6.6 h and estimated the median dust concentration to be 4.83mg/m3 at observer height. Dusty hours vary widely from year to year, butthe 2-year mean precipitation was correlated (r2 = 0.76) with the annualhours <strong>of</strong> dust in the Great Plains. Pollard (1977), who investigated themeteorology <strong>of</strong> Southern Great Plains dust storms, found that wind speedand direction were correlated with their occurrence but that antecedentmoisture was not.From visibility and wind speed data, approximate calculations showedthat in the Great Plains during the 1950's, 221 million t <strong>of</strong> dust was suspendedannually and in the 1960's, 70 million t (Hagen and Woodruff,1975). These calculations correlated well with dust depositions measured <strong>by</strong>Smith et al. (1970). These results suggest that particulate suspension fromwind erosion exceeds that from all other sources (both natural and artificial)-the latter source accounts for about 31.9 million t annually in the USA(Walther, 1972).The primary ambient air quality standard for total suspended particulatesis 75 pg/m2 (annual geometric mean) and 260 pg/m3 (maximum 24-hour average) (Federal Register, 1971). Because <strong>of</strong> the high concentration<strong>of</strong> coarse particles in dust storms, rural areas <strong>of</strong>ten fail to meet this standard(USEPA, 1976), and several investigators (e.g., Corn, 1971; Husar, 1976)have suggested that they be changed to reflect the health hazards posed <strong>by</strong>the size and chemical composition <strong>of</strong> the particulates.Suspended particulates are best reduced <strong>by</strong> good wind erosion controlpractices. Tall vegetation can sometimes be used to trap particulates alreadysuspended (Hagen and Skidmore, 1977; Smith, 1977).12-2.2 SaltationThe characteristics <strong>of</strong> saltation (jumping) particles in wind have beendescribed <strong>by</strong> several research workers (Free, 191 1; Bagnold, 1941; Chepil,1945; Zingg, 1953). However, theoretical understanding <strong>of</strong> the saltationprocess is at present incomplete (White and Schulz, 1977). In saltation, individualparticles lift <strong>of</strong>f the surface (eject) and follow distinctive trajectoriesunder the influence <strong>of</strong> air resistance and gravity. Such particles (100to 500 pm) rise at fairly steep angles but are too large to be suspended <strong>by</strong> theflow; they return to the surface either to rebound or to embed themselvesand initiate movement <strong>of</strong> other particles. The bulk <strong>of</strong> total transport,roughly 50 to 8070, is <strong>by</strong> saltation. Saltating particles rise less than 120 cm;most rise less than 30 cm.Chepil(l945) reported lift-<strong>of</strong>f angles <strong>of</strong> 75 to 90" and impact angles <strong>of</strong>6 to 12" from the horizontal. White and Schulz (1977), using microbeads tostudy particle trajectories in a wind tunnel, reported an average lift-<strong>of</strong>fangle <strong>of</strong> 50 f 20" for 57 filmed observations and average impact angle <strong>of</strong>14 f 3" for 43 observations.Many investigations have shown the importance <strong>of</strong> lifting forces insaltation (White and Schulz, 1977). Because <strong>of</strong> the large differences betweendensities <strong>of</strong> air and sand (soil) particles, Owen (1964) suggested that the liftforce due to interaction between particle motion and environmental vortici-
SOIL CONSERVATION: PRINCIPLES OF EROSION BY WIND 1811ty does not play a significant part in determining the motion <strong>of</strong> a particle(see Tennekes and Lumley, 1972, for the role <strong>of</strong> vorticity in turbulence dynamics).He did note that a lift force could result from the spin <strong>of</strong> a particle.White and Schulz (1977) have shown that considering the lift associatedwith particle rotation-called the Magnus effect-greatly improves theagreement between theoretical trajectories calculated from the equations <strong>of</strong>particle motion and those filmed in a wind tunnel. From photographs <strong>of</strong>saltation flow, Chepil (1954) found appreciable particle rotation <strong>of</strong> 200 tolo00 revolutions/s. From changes in light reflection <strong>of</strong> microbeads on film,White and Schulz (1977) estimated spinning rates <strong>of</strong> 115 to 500 revolutions/s.Chepil(l945) reported that ratios <strong>of</strong> height <strong>of</strong> rise (h) to length <strong>of</strong> path(L) for saltating soil particles were about 1:lO for all the agricultural soilsstudied. From solutions <strong>of</strong> the equations <strong>of</strong> particle motion, White andSchulz (1977) indicated that h/L is a function <strong>of</strong> particle diameter (at constantu*), with larger ratios associated with the smaller diameters in thesaltation size range and decreasing to approach those <strong>of</strong> Chepil at 500 pm.Finally, Owen (1964) stated that Bagnold deduced that lift-<strong>of</strong>f velocities(EL) <strong>of</strong> saltating particles were comparable with u*. White and Schulz(1977) reported EL = 69.3 cm/s when u, = 39.6 cm/s, although about 18%<strong>of</strong> the particles examined from filmed trajectories had velocities between 20and 40 cm/s. Thus, Bagnold’s deduction is not unrealistic based on limiteddata.12-2.3 Surface CreepMineral soil (sand) particles 500 to 1000 pm in diameter, too large toleave the surface in ordinary erosive winds, are set in motion <strong>by</strong> the impacts<strong>of</strong> saltating particles. In high winds, the whole sand surface appears to becreeping slowly forward at speeds 4 2.5 cm/s-pushed and rolled (driven)<strong>by</strong> the saltation flow. The rippling <strong>of</strong> windblown sand has been attributedto unevenness in surface creep flow (Bagnold, 1941). Reportedly, surfacecreep constitutes 7 to 25% <strong>of</strong> total transport (Bagnold, 1941; Chepil, 1945;Horikawa and Shen, 1960). Factors affecting the proportion <strong>of</strong> total transportin surface creep seem to be wind speed, particle size distribution, andsurface geometry (roughness).12-3 THRESHOLD CONDITIONSBagnold (1941) used an experimental coefficient, A, to describe thethreshold friction velocity, u*~ (the minimum at which the flow has sufficientenergy to initiate particle movement). The equation isu*~ = A (ag dP)’” [71where (Y is immersed density ratio, (ep - e)/@, g is the gravitational acceleration,dp is particle diameter, ep is particle density, and e is air density.In air, A has a value <strong>of</strong> 0.08 to 0.12, perhaps as great as 0.2 without salta-
182 LYLES, HAGEN, & SKIDMOREtion flow. Iversen et al. (1973) and Wood et al. (1974) noted that A is afunction <strong>of</strong> the particle friction Reynolds number Rf = u, dp/v, where v iskinematic viscosity <strong>of</strong> air. In Wood’s summary <strong>of</strong> previous research, Aranged from 0.08 to 0.22 for Rfgreater than 0.7; however, most values werebetween 0.08 and 0.12. Iversen et al. (1976) extended Bagnold’s equation toinclude interparticle forces (due to moisture, electrostatic effects, and otherforces <strong>of</strong> cohesion) for estimating threshold values for small particles and inlow-density atmospheres (extraterrestrial). Their estimates resulted in somewhatlower minimum values for uet in the fine particle range than thosegiven <strong>by</strong> Eq. [7]. Those estimates and recent low air-density experiments(unpublished) also showed that the coefficient A is not a unique function <strong>of</strong>Rf for small particles, but because <strong>of</strong> interparticle forces, it is smaller forlarger values <strong>of</strong> a. Some question remains concerning what value to use fordp in materials <strong>of</strong> wide particle size range. Also, no standard method <strong>of</strong> determiningu ,~ has been used or specified. Theoretically, u ,~ = u , for q =0 (where q is particle flux), but it is difficult to measure experimentally(Lyles, 1977).We suggest that threshold consideration be limited to flow and particleproperties and exclude boundary geometry. There is a growing tendency toextend the threshold concept to include the presence <strong>of</strong> nonerodible roughness(elements)-thus making it dependent on many physical dimensionsand geometric patterns <strong>of</strong> those elements. A clearer approach would be topartition the shear stress between erodible and nonerodible material andthus avoid confounding the threshold concept.12-4 PARTICLE FLUXWhen considering particle flux (flow rates), we must distinguish betweencases in which all the erodible particles are less than 1000 pm andcases in which there are mixtures <strong>of</strong> erodible particles and nonerodible elements,e.g., aggregates or clods greater than 1000 pm and vegetative materials.Before we proceed, however, a brief review <strong>of</strong> soil avalanching(Chepil, 1957b) is appropriate.On an unprotected eroding field, the particle flux is zero on the windwardedge and increases with distance downwind until, if the field is largeenough, the flux reaches the maximum amount that a given wind cansustain. This increase <strong>of</strong> particle flux with distance downwind has beencalled “soil avalanching.” The more erodible the surface, the shorter thedistance in which maximum flux is reached.12-4.1 All Erodible ParticlesThe simplest case involves all erodible particles where several equationshave been developed to predict soil (sand) flux from an area under specificsoil and wind conditions. Most equations, empirically developed, relatemass <strong>of</strong> soil moved to surface-shear stress or friction velocity <strong>of</strong> the windand erodibility characteristics <strong>of</strong> the soil.
SOIL CONSERVATION: PRINCIPLES OF EROSION BY WIND 183The functional form <strong>of</strong> those equations isq = f[(soil properties)‘, (flow proper tie^)^] 181where q is particle flux (mass per unit width per unit time) and a and b areconstants. The soil properties term may include size, density, and shape; theflow properties term may include mean wind speed at some reference height(E,) or more commonly the friction velocity (u,) for the flow in question,air density, and, rarely, a turbulence parameter. Specific flux equations forall erodible particles are contained in reports <strong>by</strong> O’Brien and Rindlaub(1936), Bagnold (1941); Kawamura (1951), Zingg (1953), Owen (1964),Kadib (1965), Makaveev (1967), and Iversen et al. (1976). The flux variesconsiderably among the equations because <strong>of</strong> different values found for theconstants and for coefficients introduced in explicit equations. Because itcontains a turbulence term, the Makaveev’s (1967) equation is the only onegiven here:where Ut is threshold mean wind speed at reference height z, a, is the rootmean square (RMS) <strong>of</strong> the longitudinal velocity fluctuations (turbulence),and other terms are as previously defined. Substituting Eq. [l] into Eq. [9]and reducing givewhich shows the well-known cubic relationship between friction velocityand particle flux and further supports why u, is so <strong>of</strong>ten used to indicate thewind’s capability to erode soil particles. Substituting the relationship u, =C,u, (Lumley and Pan<strong>of</strong>sky, 1964) into Eq. [lo] givesUQ = c 2 epdp(’)’ u *t(u, - U*t),which indicates particle flux is proportional to u ,~ and illustrates the ability<strong>of</strong> u, to characterize some turbulent properties <strong>of</strong> flow. All the previousparticle flux equations assume steady or stationary mean flow. Fan andDisrud (1977) suggested that mean wind velocities are not generally stationaryand that steady-flow flux equations may underpredict actual erosion.12-4.2 Mixtures <strong>of</strong> Erodible Particles and Nonerodible ElementsField soils seldom contain only erodible-size particles; mixtures <strong>of</strong>erodible and nonerodible elements are the more common and more complexcase. An equation for transport <strong>of</strong> field soils is complicated <strong>by</strong> factors other
184 LYLES, HAGEN, & SKIDMOREthan erodible particle size gradation, e.g., proportion and size <strong>of</strong> nonerodiblefractions, field roughness, vegetation, and soil moisture content. No reliableequations have been developed to express field soil flux for short timeperiods or for single erosive windstorms.The protective role <strong>of</strong> nonerodible elements in the erosion process hasbeen characterized <strong>by</strong> Lyles et al. (1974) in wind tunnel studies. For example,a soil initially with buried nonerodible elements like clods is eroded<strong>by</strong> a wind <strong>of</strong> characteristic friction velocity, u,. As the erodible material isremoved, the roughness is increased (because <strong>of</strong> exposure <strong>of</strong> portions <strong>of</strong> thenonerodible material), which increases the total friction velocity. The frictionvelocity (or drag) may be thought <strong>of</strong> as being divided between the nonerodibleelements and the erodible soil (intervening surface). Thus, as moreerodible material is removed from the initially smooth, erodible surface,more drag is absorbed <strong>by</strong> nonerodible elements and less is absorbed <strong>by</strong> theerodible soil. After sufficient time, enough soil is eroded so that the interveningsurface drag decreases to the threshold where erosion ceases and thesoil is stabilized. Stabilizing agricultural fields <strong>by</strong> nonerodible elements iscomplicated <strong>by</strong> variation in speed, direction, and duration <strong>of</strong> winds pluspossible generation <strong>of</strong> erodible-size particles from larger aggregates <strong>by</strong>abrasion. However, the role <strong>of</strong> nonerodible elements is clearly to absorbpart <strong>of</strong> the total wind drag-reducing the drag on erodible particles.From wind tunnel studies, Lyles and Allison (1976) published a regressionequation that predicts the degree <strong>of</strong> protection provided <strong>by</strong> standingcrop residues and nonerodible soil aggregates:NAS LYAt L,= 1.638 + 17.044- - 0.117 - + [(1.0236)' - I]1121where (u,/u *,), is called the critical friction velocity ratio, because erosionbegins when this value is exceeded; the larger the ratio, the greater the winderosion protection. The term u, is the total friction velocity for a stable surfaceat a given free stream velocity, and is the threshold friction velocityfor the erodible particles in question. The other parameters are N/A,, number<strong>of</strong> stalks in area A,; A,, average silhouette area (projected area facingflow) <strong>of</strong> a single stalk; Ly, distance (center to center) between stalks normalto wind direction; L,, the corresponding distance in the wind direction; andc, percentage <strong>of</strong> dry soil aggregates greater than 1 .O mm in diameter (limitedto 5 50%). Research is needed to test Eq. I121 under field conditions.12-5 PRINCIPLES AND GENERAL STRATEGIES OF CONTROLTwo general principles <strong>of</strong> wind erosion control are obvious: (i) reducewind forces on erodible particles or (ii) create particles resistant to windforces. From knowledge <strong>of</strong> erosion processes and mechanics, four specificprinciples <strong>of</strong> wind erosion control have been identified (Woodruff et al. ,1977):
SOIL CONSERVATION: PRINCIPLES OF EROSION BY WIND 1851. Establish and maintain vegetation or vegetative residues.2. Produce or bring to the soil surface nonerodible aggregates or clods.3. Reduce field width along prevailing wind erosion direction.4. Roughen the land surface.These principles are unchanging, but the control practices that grow out <strong>of</strong>them (which are discussed in subsequent sections) vary in space (from placeto place) and may change over time along with cropping and managementsystems. Any present or proposed (future) control strategy should beevaluated on how it influences the four principles. Those four principlesplus a factor for climate were used <strong>by</strong> Woodruff and Siddoway (1965) todevelop the now well-known wind erosion equation that predicts potentialannual erosion rates:where E is the potential annual soil loss rate, I is the soil erodibility, K is thesoil ridge roughness factor, C is the climatic factor, L is the unshelteredmedian travel distance <strong>of</strong> the wind across a field, and I/ is the equivalentvegetative cover. Briefly, the soil erodibility index I is the potential soil lossin t(ha y)-' from a wide unsheltered, isolated field with a bare, smooth, noncrustedsurface based on climatic conditions near Garden City, Kansas. It isrelated to surface soil cloddiness greater than 0.84 mm and may be determined<strong>by</strong> dry sieving and use <strong>of</strong> a table given <strong>by</strong> Woodruff and Siddoway(1965). Values range from 0 to 695 t/ha as surface aggregates greater than0.84 mm decrease to 1%. For convenience, the U.S. <strong>Soil</strong> <strong>Conservation</strong>Service uses wind erodibility groups based primarily on soil texture as aguide for selecting I factors.<strong>Soil</strong> ridge roughness factor K is a measure <strong>of</strong> the effects <strong>of</strong> ridges onerosion amounts relative to a smooth surface. It is determined from theheight-spacing measurement <strong>of</strong> ridg,es caused <strong>by</strong> tillage implements andthen consulting a chart given <strong>by</strong> Woodruff and Siddoway (1965). It variesfrom 0.5 for ridged surfaces to 1 .O for smooth surfaces.The local wind erosion climatic factor C characterizes the erosive potential<strong>of</strong> climate (wind speed, precipitation, and air temperature) at aparticular location relative to Garden City, Kansas, which has an annualvalue <strong>of</strong> 100% based on long-term data. Equations for computing thefactor and a map giving general ranges <strong>of</strong> annual values for the western half<strong>of</strong> the USA are given <strong>by</strong> Chepil et al. (1962). Monthly climatic factors formost <strong>of</strong> the USA are presented <strong>by</strong> Skidmore and Woodruff (1968).The equivalent field width L in the equation recognizes that the rate <strong>of</strong>soil flow increases with distance downwind across an eroding field untilreaching the transport capacity <strong>of</strong> a given wind and that winds have a prevailingdirection and a preponderance in the prevailing direction. It may bedetermined from field size and orientation and data on prevailing winddirection and preponderance in the prevailing wind erosion direction given<strong>by</strong> Skidmore and Woodruff (1968).The vegetative cover factor Vconsiders the quantity, kind, and orientation<strong>of</strong> vegetation or vegetative residues on erosion amounts. All vegetative
SOIL CONSERVATION: PRINCIPLES OF EROSION BY WIND 187Free, E. E. 1911. The movement <strong>of</strong> soil material <strong>by</strong> the wind. <strong>USDA</strong> Bureau <strong>of</strong> <strong>Soil</strong>s Bull. no.68.Gillette, D. A. 1977. Fine-particle emissions due to wind erosion. Trans. ASAE 202390-897.Gillette, D. A. 1978. A wind tunnel simulation <strong>of</strong> the erosion soil: Effect <strong>of</strong> soil texture,sandblasting, windspeed, and soil consolidation on dust production. Atmos. Environ. 12:1735-1743.Gillette, D. A., and T. R. Walker. 1977. Characteristics <strong>of</strong> airborne particles produced <strong>by</strong>wind erosion <strong>of</strong> sandy soil, high plains <strong>of</strong> West Texas. <strong>Soil</strong> Sci. 123:97-110.Hagen, L. J., and E. L. Skidmore. 1977. <strong>Wind</strong> erosion and visibility problems. Trans. ASAE20: 898-903.Hagen, L. J., and N. P. Woodruff. 1973. Air pollution from duststorms in the Great Plains.Atmos. Environ. 7:323-332.Hagen, L. J., and N. P. Woodruff. 1975. Particulate loads caused <strong>by</strong> wind erosion in the GreatPlains. J. Air Pollut. Control Assoc. 25:860-861.Horikawa, K., and H. W. Shen. 1960. Sand movement <strong>by</strong> wind action. Beach <strong>Erosion</strong> Board,Corps <strong>of</strong> Engineers, Tech. Memo. no. 119.Husar, R. B. 1976. Fine particle standard: An assessment <strong>of</strong> the need and an attempt <strong>of</strong> itsformulation. p. 1-32. In ASME Air Pollution Control Div., Fourth Natl. Symp., St.Louis, Mo.Iversen, J. D., R. Greeley, J. B. Pollack, and B. R. White. 1973. Simulation <strong>of</strong> Martian eolianphenomena in the atmospheric wind tunnel. p. 191-213. In Seventh Conf. on Space Simulation,NASA, SP-336.Iversen, J. D., R. Greeley, B. R. White, and J. B. Pollack. 1976. The effect <strong>of</strong> vertical distortionin the modeling <strong>of</strong> sedimentation phenomena: Martian crater wake streaks. J.Geophys. Res. 81:4846-4856.Iversen, J. D., J. B. Pollack, R. Greeley, and B. R. White. 1976. Saltation threshold on Mars:The effect <strong>of</strong> interparticle force, surface roughness, and low atmospheric density. Icarus29:38 1-393.Kadib, A. A. 1965. A function for sand movement <strong>by</strong> wind. Univ. <strong>of</strong> California HydraulicEngineering Laboratory Tech. Report no. HEL-212.Kawamura, R. 1951. Study on soil movement <strong>by</strong> wind. Inst. <strong>of</strong> Sci. and Tech. Report no. 5,Tokyo, p. 95-112.Lumley, J. L., and H. A. Pan<strong>of</strong>sky. 1964. The structure <strong>of</strong> atmospheric turbulence. Interscience,New York.Lyles, L. 1975. Possible effects <strong>of</strong> wind erosion on soil productivity. J. <strong>Soil</strong> Water Conserv.30:279-283.Lyles, L. 1977. <strong>Wind</strong> erosion: Processes and effect on soil productivity. Trans. ASAE 20:880-884.Lyles, L., and B. E. Allison. 1976. <strong>Wind</strong> erosion: The protective role <strong>of</strong> simulated standingstubble. Trans. ASAE 19:61-64.Lyles, L., and B. E. Allison. 1980. Range grasses and their small grain equivalents for winderosion control. J. Range Manage. 33: 143-146.Lyles, L., and B. E. Allison. 1981. Equivalent wind-erosion protection from selected cropresidues. Trans. ASAE 24:405-408.Lyles, L., and R. K. Krauss. 1971. Threshold velocities and initial particle motion as influenced<strong>by</strong> air turbulence. Trans. ASAE 14:563-566.Lyles, L., R. L. Schrandt, and N. F. Schmeidler. 1974. How aerodynamic roughness elementscontrol sand movement. Trans. ASAE 17: 134-139.Makaveev, V. M. 1967. The movement <strong>of</strong> solid particles in turbulent stream flow. (In Russian.)Tr. Koord. Soveshch. Gidrotekh. 36:ll-18.Nikuradse, J. 1950. Law <strong>of</strong> flow in rough pipe. Natl. Advisory Comm. for Aeronautics Tech.Memo. no. 1292. (Transl. <strong>of</strong> 1933 paper <strong>of</strong> Nikuradse.)O’Brien, M. P., and B. P. Rindlaub. 1936. The transport <strong>of</strong> sand <strong>by</strong> wind. Civ. Eng. (N.Y.)6:325.Orgill, M. M., and G. A. Sehmel. 1976. Frequency and diurnal variation <strong>of</strong> duststorms in thecontiguous USA. Atmos. Environ. 10:813-825.
188 LYLES, HAGEN, & SKIDMOREOwen, P. R. 1964. Saltation <strong>of</strong> uniform grains in air. J. Fluid Mech? 20:225-242.Pollard, M. C. 1977. An investigation <strong>of</strong> duststorm generation in the southern Great Plains.Air Force Inst. <strong>of</strong> Technology, Wright-Patterson Air Force Base, Ohio, Report no. AFIT-CI-78-46.Rosinski, J., G. Langer, C. T. Nagamoto, and J. S. Bogard. 1976. Generation <strong>of</strong> secondaryparticles from single large soil particles upon impact. p. 638-647. In R. J. Engleman andG. A. Sehmel (ed.) Proc. Conf. on Atmospheric-Surface Exchange <strong>of</strong> Particulate andGaseous Pollutants, Richland, Wash. 4-6 Sept. 1974. Energy Res. Development AdministrationSymp. Series 38, CONF-740921, Dep. <strong>of</strong> Commerce, Natl. Tech. InformationService, Springfield, Va.Skidmore, E. L., P. S. Fisher, and N. P. Woodruff. 1970. <strong>Wind</strong> erosion equation: Computersolution and application. <strong>Soil</strong> Sci. SOC. Am. Proc. 34:931-935.Skidmore, E. L., and N. P. Woodruff. 1968. <strong>Wind</strong> erosion forces in the United States andtheir use in predicting soil loss. <strong>USDA</strong>-<strong>ARS</strong> Agric. Handbook no. 346.Smith, R. M., P. C. Twiss, R. K. Krauss, and M. J. Brown. 1970. Dust deposition in relationto site, season, and climatic variables. <strong>Soil</strong> Sci. SOC. Am. Proc. 34:112-117.Smith, W. H. 1977. Removal <strong>of</strong> atmospheric particulates <strong>by</strong> urban vegetation: Implicationsfor human and vegetative health. Yale J. Biol. Med. 50:185-197.Steams, C. R. 1970. Determining surface roughness and displacement height. Boundary-Layer Meteorol. 1:102-111.Tennekes, H., and J. L. Lumley. 1972. A first course in turbulence. The M.I.T. Press, Cambridge,Mass.U.S. Environmental Protection Agency. 1976. Monitoring and air quality trends report, 1974.USEPA Report no. EPA-450/1-76-001, Research Triangle Park, N.C.Walther, E. G. 1972. A rating <strong>of</strong> the major air pollutants and their sources <strong>by</strong> effect. J. AirPollut. Control Assoc. 22:352-355.White, B. R., and J. C. Schulz. 1977. Magnus effect in saltation. J. Fluid Mech. 81:497-512.Wood, G. P., W. R. Weaver, and R. M. Henry. 1974. The minimum free-stream windspeedfor initiating motion <strong>of</strong> surface material on Mars. NASA Report no. TMX-71959.Woodruff, N. P., L. Lyles, F. H. Siddoway, and D. W. Fryrear. 1977. How to control winderosion. Rev. ed. <strong>USDA</strong> Agric. Information Bull. no. 354.Woodruff, N. P., and F. H. Siddoway. 1965. A wind erosion equation. <strong>Soil</strong> Sci. SOC. Am.Proc. 29502-608.Zingg, A. W. 1953. <strong>Wind</strong>-tunnel studies <strong>of</strong> the movement <strong>of</strong> sedimentary material. p. 111-135. In Proc. Fifth Hydraulogy Conference Bull. no. 34, State Univ. <strong>of</strong> Iowa Studies inEngineering.


