The E-Book of Technical Market Indicators
The E-Book of Technical Market Indicators
The E-Book of Technical Market Indicators

Create successful ePaper yourself
Turn your PDF publications into a flip-book with our unique Google optimized e-Paper software.
<strong>The</strong> E-<strong>Book</strong> <strong>of</strong> <strong>Technical</strong> <strong>Market</strong> <strong>Indicators</strong><br />
www.wallstreetcourier.com<br />
<strong>The</strong> E-<strong>Book</strong> <strong>of</strong><br />
<strong>Technical</strong> <strong>Market</strong><br />
<strong>Indicators</strong><br />
by<br />
Wall Street Courier<br />
Version 1.1<br />
<strong>of</strong>fice@wallstreetcourier.com<br />
www.wallstreetcourier.com<br />
Page 1
<strong>The</strong> E-<strong>Book</strong> <strong>of</strong> <strong>Technical</strong> <strong>Market</strong> <strong>Indicators</strong><br />
www.wallstreetcourier.com<br />
Preface<br />
<strong>The</strong> transparency <strong>of</strong> the American markets <strong>of</strong>fers an array <strong>of</strong> indicators and allows<br />
deep insights <strong>of</strong> prevailing sentiment. You find the activities <strong>of</strong> NYSE members like<br />
specialists and floor traders, public and odd lot short sales, the Short Interest Ratio as well<br />
as the large block transactions <strong>of</strong> the institutional investors published every week. Other<br />
tools for technical analysis include trend indicators, daily advances and declines, daily new<br />
highs and lows, volume, indices, put/call ratios and other useful information like Stochastics,<br />
RSI, MACD, TICK and more. <strong>The</strong> problem is only that all these indicators contradict each<br />
other most <strong>of</strong> the time. Countless books have been written on this subject, and no matter<br />
how many will be written in the future: always be aware that there is no such thing as the<br />
Holy Grail <strong>of</strong> the stock market. But some people are more successful than others and the<br />
answer is quite simple:<br />
No indicator is right all the time and you don't have to be right all the time. Just be<br />
right a higher percentage <strong>of</strong> the time than wrong. Choose some reliable indicators and stick<br />
to them. Don't follow some indicators for a while and switch to some others if they fail. Don't<br />
be a technician in the first half <strong>of</strong> the year and a fundamentalist the next half. Be consistent<br />
and disciplined in your approach. Don't abandon a good indicator because you think this<br />
time everything is different.<br />
It takes <strong>of</strong> course a lot <strong>of</strong> guts because the opinions <strong>of</strong> the most widely quoted gurus<br />
<strong>of</strong> Wall Street are usually contrary to your indicators at that time. This is much easier if you<br />
don't use margin. You will sleep a lot better if you buy fifty shares <strong>of</strong> IBM with the money<br />
you can spare than two hundred shares on credit.<br />
Happy Trading<br />
Wall Street Courier<br />
www.wallstreetcourier.com<br />
Page 2
<strong>The</strong> E-<strong>Book</strong> <strong>of</strong> <strong>Technical</strong> <strong>Market</strong> <strong>Indicators</strong><br />
www.wallstreetcourier.com<br />
Table <strong>of</strong> Content<br />
Advance-Decline <strong>Indicators</strong>...................................................................................................5<br />
Advance-Decline Line ........................................................................................................5<br />
Advance-Decline Ratio.......................................................................................................7<br />
Upside-Downside Volume Ratio ........................................................................................8<br />
Upside-Downside Volume Line ..........................................................................................9<br />
Upside-Downside Volume Net Difference ........................................................................11<br />
Advance-Decline Net Difference ......................................................................................12<br />
Global Futures Advance-Decline Index............................................................................13<br />
Global Futures Upside-Downside Volume Index..............................................................13<br />
<strong>Market</strong> <strong>Indicators</strong> .................................................................................................................14<br />
High-Low Differential Index ..............................................................................................14<br />
High-Low Ratio ................................................................................................................15<br />
Global Futures High-Low Index........................................................................................16<br />
Global Futures Bottom Indicator ......................................................................................16<br />
Cycles ..............................................................................................................................19<br />
Large Block Index ............................................................................................................19<br />
Short Term Trading Index (ARMS Index or TRIN) ...........................................................20<br />
Trend Indicator.................................................................................................................22<br />
CBOE Volatility Index (VIX)..............................................................................................23<br />
Index Options Put/Call Ratio ............................................................................................23<br />
Call/Put Ratio ...................................................................................................................24<br />
Global Futures Put/Volume Ratio.....................................................................................25<br />
Smart Money Flow Index .................................................................................................26<br />
Global Futures Timing Indicator .......................................................................................27<br />
Global Futures <strong>Market</strong> Timer Index..................................................................................28<br />
Global Futures Fear Indicator ..........................................................................................29<br />
Wall Street Courier Index .................................................................................................29<br />
Global Futures Trading Index...........................................................................................30<br />
Global Futures Speculation Index ....................................................................................31<br />
Program Trading ..............................................................................................................32<br />
Calendar Spread..............................................................................................................33<br />
Odd-Lot Differential Index ................................................................................................34<br />
Page 3
<strong>The</strong> E-<strong>Book</strong> <strong>of</strong> <strong>Technical</strong> <strong>Market</strong> <strong>Indicators</strong><br />
www.wallstreetcourier.com<br />
Short Sales Statistics...........................................................................................................35<br />
<strong>The</strong> NYSE Short Interest Ratio ........................................................................................35<br />
Odd-Lot Short Sales Ratio ...............................................................................................36<br />
Floor Traders Short Sales Ratio.......................................................................................36<br />
Specialist Short Sales Ratio.............................................................................................37<br />
NYSE Member Short Sales Ratio ....................................................................................38<br />
Public Short Sales Ratio ..................................................................................................38<br />
Odd-Lot Balance Index ....................................................................................................39<br />
Odd-Lot/Floor Trader Short Sales Ratio...........................................................................40<br />
Global Futures Odd-Lot/Specialist Short Sales Ratio.......................................................40<br />
Global Futures Public/Member Short Sales Ratio............................................................41<br />
Public/Specialists Short Sales Ratio ................................................................................42<br />
High readings indicate heavy shorting by the public (the so called crowd) and therefore<br />
bottoms, low readings indicate tops. ................................................................................42<br />
Global Futures NYSE Member Trading Indicator.............................................................43<br />
Sentiment <strong>Indicators</strong>............................................................................................................44<br />
Investor Sentiment ...........................................................................................................44<br />
Commitments <strong>of</strong> Traders Report......................................................................................46<br />
Appendix..............................................................................................................................48<br />
Dow Jones Industrial........................................................................................................48<br />
S&P 500...........................................................................................................................48<br />
Risk Statement ....................................................................................................................49<br />
Page 4
<strong>The</strong> E-<strong>Book</strong> <strong>of</strong> <strong>Technical</strong> <strong>Market</strong> <strong>Indicators</strong><br />
www.wallstreetcourier.com<br />
Advance-Decline <strong>Indicators</strong><br />
Advance-Decline Line<br />
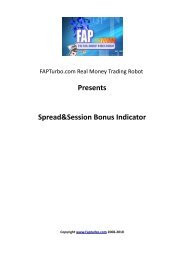
<strong>The</strong> Advance-Decline Line is a market breadth indicator and should be compared to<br />
the other market indices like the Dow Jones or S&P 500. Daily or weekly NYSE data is<br />
used in the calculation. Because the Advance-Decline Line reflects the action <strong>of</strong> the general<br />
market, any divergences are watched closely by market technicians. As long as the Dow<br />
and the Advance-Decline Line are moving in the same direction the trend will continue. If<br />
the Dow makes a new high which is not confirmed by a high <strong>of</strong> the Advance-Decline Line,<br />
caution is warranted. Vice versa, if the Dow makes a new low and the Advance-Decline<br />
Line doesn't you should cover your short sales.<br />
© WallStreetCourier.com<br />
160000<br />
ADVANCE - DECLINE LINE WEEKLY<br />
140000<br />
120000<br />
100000<br />
96-01-05<br />
96-03-01<br />
96-04-26<br />
96-06-21<br />
96-08-16<br />
96-10-11<br />
96-12-06<br />
97-01-31<br />
97-03-28<br />
97-05-23<br />
97-07-18<br />
97-09-12<br />
97-11-07<br />
98-01-02<br />
98-02-27<br />
98-04-24<br />
98-06-19<br />
98-08-14<br />
98-10-09<br />
98-12-04<br />
99-01-29<br />
99-03-26<br />
99-05-21<br />
99-07-16<br />
99-09-10<br />
99-11-05<br />
99-12-31<br />
00-02-25<br />
00-04-21<br />
00-06-16<br />
00-08-11<br />
00-10-06<br />
00-12-01<br />
01-01-26<br />
01-03-23<br />
01-05-18<br />
To calculate your own weekly Advance-Decline Line is very simple and you can<br />
begin your calculations at any time. Just pick a large enough base number like 100000.<br />
<strong>The</strong>n you calculate each week (or day) the difference between advances and declines by<br />
adding the advances and subtracting the declines. If you have 1269 advances and 1457<br />
declines on your first week, the reading <strong>of</strong> your newly created weekly Advance-Decline Line<br />
would be 99812 (example below).<br />
Page 5
<strong>The</strong> E-<strong>Book</strong> <strong>of</strong> <strong>Technical</strong> <strong>Market</strong> <strong>Indicators</strong><br />
www.wallstreetcourier.com<br />
Date Advances Declines A-D Line<br />
100000<br />
09.06.95 1269 1457 99812<br />
16.06.95 1714 975 100551<br />
23.06.95 1591 1148 100994<br />
30.06.95 1346 1348 100992<br />
07.07.95 2032 692 102332<br />
14.07.95 1507 1191 102648<br />
21.07.95 894 1875 101667<br />
28.07.95 1891 845 102713<br />
04.08.95 1404 1291 102826<br />
11.08.95 1187 1489 102524<br />
18.08.95 1624 1043 103105<br />
25.08.95 1486 1176 103415<br />
01.09.95 1656 1011 104060<br />
08.09.95 1903 759 105204<br />
<strong>The</strong> Advance-Decline Line gave a useful example in 1999. During the strong bull<br />
market the advance was quite broad and the A/D Line moved in tandem with the Dow. But<br />
when the Dow made new highs in the beginning <strong>of</strong> 1999 the A/D Line was already lagging<br />
behind, indicating a weakening <strong>of</strong> the general market. Internet mania and technology craze<br />
kept the market going for a while.<br />
Page 6
<strong>The</strong> E-<strong>Book</strong> <strong>of</strong> <strong>Technical</strong> <strong>Market</strong> <strong>Indicators</strong><br />
www.wallstreetcourier.com<br />
Advance-Decline Ratio<br />
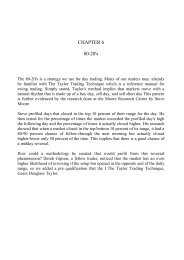
<strong>The</strong> Advance-Decline Ratio is also market breadth indicator. It is calculated by<br />
dividing the number <strong>of</strong> advancing issues by the number <strong>of</strong> declining issues using daily or<br />
weekly NYSE data. It works very well as an overbought/oversold indicator and as a<br />
momentum indicator. A moving average should be used to smooth out the swings.<br />
Date Advances Declines A/D * 100 10-Week MA<br />
09.06.95 1269 1457 87<br />
16.06.95 1714 975 176<br />
23.06.95 1591 1148 139<br />
30.06.95 1346 1348 100<br />
07.07.95 2032 692 294<br />
14.07.95 1507 1191 127<br />
21.07.95 894 1875 48<br />
28.07.95 1891 845 224<br />
04.08.95 1404 1291 109<br />
11.08.95 1187 1489 80 138<br />
18.08.95 1624 1043 156 145<br />
25.08.95 1486 1176 126 140<br />
01.09.95 1656 1011 164 143<br />
08.09.95 1903 759 251 158<br />
This chart shows you the weekly NYSE Advance-Decline Ratio on a 10-week moving<br />
average. Readings below 90 indicate intermediate bottoms and readings above 170 tops.<br />
© WallStreetCourier.com<br />
2,40<br />
ADVANCE-DECLINE RATIO<br />
10-DAY MOVING AVERAGE<br />
2,00<br />
1,60<br />
1,20<br />
0,80<br />
0,40<br />
95-08-11<br />
95-10-06<br />
95-12-01<br />
96-01-26<br />
96-03-22<br />
96-05-17<br />
96-07-12<br />
96-09-06<br />
96-11-01<br />
96-12-27<br />
97-02-21<br />
97-04-18<br />
97-06-13<br />
97-08-08<br />
97-10-03<br />
97-11-28<br />
98-01-23<br />
98-03-20<br />
98-05-15<br />
98-07-10<br />
98-09-04<br />
98-10-30<br />
98-12-25<br />
99-02-19<br />
99-04-16<br />
99-06-11<br />
99-08-06<br />
99-10-01<br />
99-11-26<br />
00-01-21<br />
00-03-17<br />
00-05-12<br />
00-07-07<br />
00-09-01<br />
00-10-27<br />
00-12-22<br />
01-02-16<br />
01-04-13<br />
01-06-08<br />
Page 7
<strong>The</strong> E-<strong>Book</strong> <strong>of</strong> <strong>Technical</strong> <strong>Market</strong> <strong>Indicators</strong><br />
www.wallstreetcourier.com<br />
Upside-Downside Volume Ratio<br />
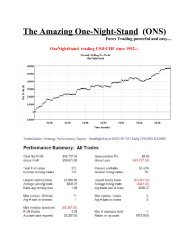
<strong>The</strong> Upside-Downside Volume Ratio is also market breadth indicator. It is calculated<br />
by dividing the volume <strong>of</strong> advancing issues by the volume <strong>of</strong> declining issues, using daily or<br />
weekly NYSE data. It works very well as an overbought/oversold indicator and as well as a<br />
momentum indicator. A moving average should be used to smooth out the swings.<br />
Date Adv. Volume Decl. Volume AV/DV*100 10-Week MA<br />
09.06.95 673210 732827 92<br />
16.06.95 943121 565840 167<br />
23.06.95 964871 666807 145<br />
30.06.95 674725 765076 88<br />
07.07.95 867512 353025 246<br />
14.07.95 945574 756197 125<br />
21.07.95 755969 1027248 74<br />
28.07.95 1008468 584579 173<br />
04.08.95 733204 703285 104<br />
11.08.95 565588 669580 84 130<br />
18.08.95 796723 615752 129 133<br />
25.08.95 629338 603130 104 127<br />
01.09.95 727349 553140 131 126<br />
08.09.95 746298 418632 178 135<br />
© WallStreetCourier.com<br />
180<br />
UPSIDE/DOWNSIDE VOLUME RATIO<br />
160<br />
140<br />
120<br />
100<br />
80<br />
96-01-05<br />
96-03-01<br />
96-04-26<br />
96-06-21<br />
96-08-16<br />
96-10-11<br />
96-12-06<br />
97-01-31<br />
97-03-28<br />
97-05-23<br />
97-07-18<br />
97-09-12<br />
97-11-07<br />
98-01-02<br />
98-02-27<br />
98-04-24<br />
98-06-19<br />
98-08-14<br />
98-10-09<br />
98-12-04<br />
99-01-29<br />
99-03-26<br />
99-05-21<br />
99-07-16<br />
99-09-10<br />
99-11-05<br />
99-12-31<br />
00-02-25<br />
00-04-21<br />
00-06-16<br />
00-08-11<br />
00-10-06<br />
00-12-01<br />
01-01-26<br />
01-03-23<br />
01-05-18<br />
Page 8
<strong>The</strong> E-<strong>Book</strong> <strong>of</strong> <strong>Technical</strong> <strong>Market</strong> <strong>Indicators</strong><br />
www.wallstreetcourier.com<br />
Upside-Downside Volume Line<br />
<strong>The</strong> Upside-Downside Volume Line is a market breadth indicator and should be<br />
compared to the other market indices like the Dow Jones or S&P 500. Daily or weekly<br />
NYSE data is used in the calculation. Because the Upside-Downside Volume Line reflects<br />
the action <strong>of</strong> the general market, any divergences are watched closely by market<br />
technicians. As long as the Dow and the Upside-Downside Volume Line are moving in the<br />
same direction the trend will continue. If the Dow makes a new high which is not confirmed<br />
by a high <strong>of</strong> the Upside-Downside Volume Line, caution is warranted. It is more affirmative<br />
than the Advance-Decline Line and it gave a perfect sell signal in January 2000, when the<br />
Dow made a new high and the Upside-Downside Volume Line lagged behind (charts<br />
below). Vice versa, if the Dow makes a new low and the Upside-Downside Volume Line<br />
doesn't, you should cover your short sales. To calculate your own weekly Upside-Downside<br />
Volume Line is very simple and you can begin your calculations at any time. Just pick a<br />
large enough base number like 1000000. <strong>The</strong>n you calculate each week (or day) the<br />
difference between the upside volume and downside volume by adding the volume <strong>of</strong><br />
advancing issues and subtracting the volume <strong>of</strong> declining issues. If you have an upside<br />
volume <strong>of</strong> 673210 and a downside volume <strong>of</strong> 732827 on your first week, the reading <strong>of</strong> your<br />
newly created weekly Upside-Downside Volume Line would be 940383 (example below).<br />
Date Upside Volume Downside Volume U-D Volume Line<br />
1000000<br />
09.06.95 673210 732827 940383<br />
16.06.95 943121 565840 1317664<br />
23.06.95 964871 666807 1615728<br />
30.06.95 674725 765076 1525377<br />
07.07.95 867512 353025 2039864<br />
14.07.95 945574 756197 2229241<br />
21.07.95 755969 1027248 1957962<br />
28.07.95 1008468 584579 2381851<br />
04.08.95 733204 703285 2411770<br />
11.08.95 565588 669580 2307778<br />
18.08.95 796723 615752 2488749<br />
25.08.95 629338 603130 2514957<br />
01.09.95 727349 553140 2689166<br />
08.09.95 746298 418632 3016832<br />
Page 9
<strong>The</strong> E-<strong>Book</strong> <strong>of</strong> <strong>Technical</strong> <strong>Market</strong> <strong>Indicators</strong><br />
www.wallstreetcourier.com<br />
Here is a beautiful example <strong>of</strong> the Upside-Downside Volume Line. Volume moves<br />
the markets and this indicator gave a perfect sell signal in December 1999, when the Dow<br />
made a new high and the Upside-Downside Volume Line didn't. It would have kept you also<br />
on the right side <strong>of</strong> the market right to the top.<br />
© WallStreetCourier.com<br />
25000000<br />
23000000<br />
21000000<br />
19000000<br />
17000000<br />
15000000<br />
13000000<br />
11000000<br />
9000000<br />
7000000<br />
5000000<br />
3000000<br />
1000000<br />
ADVANCE - DECLINE VOLUME LINE<br />
DIVERGENCE<br />
96-01-05<br />
96-03-01<br />
96-04-26<br />
96-06-21<br />
96-08-16<br />
96-10-11<br />
96-12-06<br />
97-01-31<br />
97-03-28<br />
97-05-23<br />
97-07-18<br />
97-09-12<br />
97-11-07<br />
98-01-02<br />
98-02-27<br />
98-04-24<br />
98-06-19<br />
98-08-14<br />
98-10-09<br />
98-12-04<br />
99-01-29<br />
99-03-26<br />
99-05-21<br />
99-07-16<br />
99-09-10<br />
99-11-05<br />
99-12-31<br />
00-02-25<br />
00-04-21<br />
00-06-16<br />
00-08-11<br />
00-10-06<br />
00-12-01<br />
01-01-26<br />
01-03-23<br />
01-05-18<br />
© WallStreetCourier.com<br />
12000<br />
DOW JONES WEEKLY CLOSE<br />
11000<br />
10000<br />
9000<br />
8000<br />
7000<br />
DIVERGENCE<br />
6000<br />
5000<br />
96-01-05<br />
96-03-01<br />
96-04-26<br />
96-06-21<br />
96-08-16<br />
96-10-11<br />
96-12-06<br />
97-01-31<br />
97-03-28<br />
97-05-23<br />
97-07-18<br />
97-09-12<br />
97-11-07<br />
98-01-02<br />
98-02-27<br />
98-04-24<br />
98-06-19<br />
98-08-14<br />
98-10-09<br />
98-12-04<br />
99-01-29<br />
99-03-26<br />
99-05-21<br />
99-07-16<br />
99-09-10<br />
99-11-05<br />
99-12-31<br />
00-02-25<br />
00-04-21<br />
00-06-16<br />
00-08-11<br />
00-10-06<br />
00-12-01<br />
01-01-26<br />
01-03-23<br />
01-05-18<br />
Page 10
<strong>The</strong> E-<strong>Book</strong> <strong>of</strong> <strong>Technical</strong> <strong>Market</strong> <strong>Indicators</strong><br />
www.wallstreetcourier.com<br />
Upside-Downside Volume Net Difference<br />
Another method used by market technicians is to calculate the net difference<br />
between the upside- and downside volume. Daily or weekly data can be used. <strong>The</strong> net<br />
difference between upside- and downside volume is calculated weekly and the result is<br />
added. To smooth out the swings, a 10-week moving average should be applied. Below<br />
there is an example for weekly calculations:<br />
Date Adv. Volume Decl. Volume Net Difference Cumulative<br />
0<br />
09.06.95 673210 732827 -59617 -59617<br />
16.06.95 943121 565840 377281 317664<br />
23.06.95 964871 666807 298064 615728<br />
30.06.95 674725 765076 -90351 525377<br />
07.07.95 867512 353025 514487 1039864<br />
14.07.95 945574 756197 189377 1229241<br />
21.07.95 755969 1027248 -271279 957962<br />
28.07.95 1008468 584579 423889 1381851<br />
04.08.95 733204 703285 29919 1411770<br />
11.08.95 565588 669580 -103992 1307778<br />
18.08.95 796723 615752 180971 1488749<br />
25.08.95 629338 603130 26208 1514957<br />
01.09.95 727349 553140 174209 1689166<br />
08.09.95 746298 418632 327666 2016832<br />
© WallStreetCourier.com<br />
1000000<br />
UP - DOWNVOLUME NET DIFFERENCE<br />
500000<br />
0<br />
-500000<br />
-1000000<br />
96-01-05<br />
96-03-01<br />
96-04-26<br />
96-06-21<br />
96-08-16<br />
96-10-11<br />
96-12-06<br />
97-01-31<br />
97-03-28<br />
97-05-23<br />
97-07-18<br />
97-09-12<br />
97-11-07<br />
98-01-02<br />
98-02-27<br />
98-04-24<br />
98-06-19<br />
98-08-14<br />
98-10-09<br />
98-12-04<br />
99-01-29<br />
99-03-26<br />
99-05-21<br />
99-07-16<br />
99-09-10<br />
99-11-05<br />
99-12-31<br />
00-02-25<br />
00-04-21<br />
00-06-16<br />
00-08-11<br />
00-10-06<br />
00-12-01<br />
01-01-26<br />
01-03-23<br />
01-05-18<br />
Page 11
<strong>The</strong> E-<strong>Book</strong> <strong>of</strong> <strong>Technical</strong> <strong>Market</strong> <strong>Indicators</strong><br />
www.wallstreetcourier.com<br />
Advance-Decline Net Difference<br />
Another method used by market technicians is to calculate the net difference<br />
between advances and declines. Daily or weekly data can be used. <strong>The</strong> net difference<br />
between advances and declines is calculated weekly and the result is added. To smooth<br />
out the swings, a 10-week moving average is applied. Below there is an example for weekly<br />
calculations:<br />
Date Advances Declines Net Differ. Cumulative 10-Week MA<br />
09.06.95 1269 1457 -188 -188<br />
16.06.95 1714 975 739 551<br />
23.06.95 1591 1148 443 1182<br />
30.06.95 1346 1348 -2 441<br />
07.07.95 2032 692 1340 1338<br />
14.07.95 1507 1191 316 1656<br />
21.07.95 894 1875 -981 -665<br />
28.07.95 1891 845 1046 65<br />
04.08.95 1404 1291 113 1159<br />
11.08.95 1187 1489 -302 -189 535,0<br />
18.08.95 1624 1043 581 279 581,7<br />
25.08.95 1486 1176 310 891 615,7<br />
01.09.95 1656 1011 645 955 593,0<br />
08.09.95 1903 759 1144 1789 727,8<br />
<strong>The</strong> chart went from extremely overbought in July 1997 to heavily oversold in September<br />
1998:<br />
©<br />
2000<br />
ADVANCE - DECLINE NET DIFFERENCE<br />
1500<br />
1000<br />
500<br />
0<br />
-500<br />
-1000<br />
-1500<br />
96-01-05<br />
96-03-01<br />
96-04-26<br />
96-06-21<br />
96-08-16<br />
96-10-11<br />
96-12-06<br />
97-01-31<br />
97-03-28<br />
97-05-23<br />
97-07-18<br />
97-09-12<br />
97-11-07<br />
98-01-02<br />
98-02-27<br />
98-04-24<br />
98-06-19<br />
98-08-14<br />
98-10-09<br />
98-12-04<br />
99-01-29<br />
99-03-26<br />
99-05-21<br />
99-07-16<br />
99-09-10<br />
99-11-05<br />
99-12-31<br />
00-02-25<br />
00-04-21<br />
00-06-16<br />
00-08-11<br />
00-10-06<br />
00-12-01<br />
01-01-26<br />
01-03-23<br />
01-05-18<br />
Page 12
<strong>The</strong> E-<strong>Book</strong> <strong>of</strong> <strong>Technical</strong> <strong>Market</strong> <strong>Indicators</strong><br />
www.wallstreetcourier.com<br />
Global Futures Advance-Decline Index<br />
This indicator is calculated by dividing the weekly number <strong>of</strong> advances and declines by the<br />
number <strong>of</strong> total issues traded. A 10-week moving average is applied to smooth out the<br />
swings.<br />
© WallStreetCourier.com<br />
0,60<br />
ADVANCE - DECLINE INDEX WEEKLY<br />
0,55<br />
0,50<br />
ADVANCES<br />
0,45<br />
0,40<br />
0,35<br />
DECLINES<br />
0,30<br />
96-01-05<br />
96-03-01<br />
96-04-26<br />
96-06-21<br />
96-08-16<br />
96-10-11<br />
96-12-06<br />
97-01-31<br />
97-03-28<br />
97-05-23<br />
97-07-18<br />
97-09-12<br />
97-11-07<br />
98-01-02<br />
98-02-27<br />
98-04-24<br />
98-06-19<br />
98-08-14<br />
98-10-09<br />
98-12-04<br />
99-01-29<br />
99-03-26<br />
99-05-21<br />
99-07-16<br />
99-09-10<br />
99-11-05<br />
99-12-31<br />
00-02-25<br />
00-04-21<br />
00-06-16<br />
00-08-11<br />
00-10-06<br />
00-12-01<br />
01-01-26<br />
01-03-23<br />
01-05-18<br />
Global Futures Upside-Downside Volume Index<br />
This indicator is calculated by dividing the weekly upside and downside volumes by the<br />
weekly total volume. A 10-week moving average is applied to smooth out the swings.<br />
© WallStreetCourier.com<br />
0,56<br />
0,54<br />
0,52<br />
0,50<br />
0,48<br />
0,46<br />
0,44<br />
0,42<br />
0,40<br />
0,38<br />
0,36<br />
UPSIDE - DOWNSIDE VOLUME INDEX WEEKLY<br />
UPSIDE VOLUME<br />
DOWNSIDE VOLUME<br />
96-01-05<br />
96-03-01<br />
96-04-26<br />
96-06-21<br />
96-08-16<br />
96-10-11<br />
96-12-06<br />
97-01-31<br />
97-03-28<br />
97-05-23<br />
97-07-18<br />
97-09-12<br />
97-11-07<br />
98-01-02<br />
98-02-27<br />
98-04-24<br />
98-06-19<br />
98-08-14<br />
98-10-09<br />
98-12-04<br />
99-01-29<br />
99-03-26<br />
99-05-21<br />
99-07-16<br />
99-09-10<br />
99-11-05<br />
99-12-31<br />
00-02-25<br />
00-04-21<br />
00-06-16<br />
00-08-11<br />
00-10-06<br />
00-12-01<br />
01-01-26<br />
01-03-23<br />
01-05-18<br />
y<br />
Page 13
<strong>The</strong> E-<strong>Book</strong> <strong>of</strong> <strong>Technical</strong> <strong>Market</strong> <strong>Indicators</strong><br />
www.wallstreetcourier.com<br />
<strong>Market</strong> <strong>Indicators</strong><br />
High-Low Differential Index<br />
Like the advance-decline line, the high-low indicators produce signals when they<br />
diverge from the action <strong>of</strong> the indices like the Dow Jones or the S&P 500. It is considered<br />
unhealthy for the market climate if the indices make new highs without many stocks<br />
reaching new highs at the same time. Chart technicians use various methods to spot<br />
divergences from the major market indices.<br />
<strong>The</strong> High-Low Differential Index produces good longer term signals when it diverges<br />
from the action <strong>of</strong> the Dow over a prolonged period <strong>of</strong> time. Daily or weekly data may be<br />
used and the calculation <strong>of</strong> this indicator is very simple; just subtract the daily or weekly<br />
new lows from the new highs to get the differential and apply a moving average to smooth<br />
out the swings. If you have 479 new highs and 31 new lows on your first week, the reading<br />
<strong>of</strong> your newly created weekly High-Low Differential Index would be 448 (example below).<br />
Date Highs Lows Differential 10-week MA<br />
09.06.95 479 31 448<br />
16.06.95 371 42 329<br />
23.06.95 491 56 435<br />
30.06.95 292 42 250<br />
07.07.95 485 29 456<br />
14.07.95 635 36 599<br />
21.07.95 331 50 281<br />
28.07.95 464 43 421<br />
04.08.95 402 42 360<br />
11.08.95 337 47 290 387<br />
18.08.95 338 53 285 371<br />
25.08.95 336 46 290 367<br />
01.09.95 397 50 347 358<br />
08.09.95 530 31 499 383<br />
15.09.95 664 43 621 399<br />
Page 14
<strong>The</strong> E-<strong>Book</strong> <strong>of</strong> <strong>Technical</strong> <strong>Market</strong> <strong>Indicators</strong><br />
www.wallstreetcourier.com<br />
© WallStreetCourier.com<br />
1500<br />
HIGH-LOW DIFFERENTIAL INDEX<br />
1000<br />
500<br />
0<br />
-500<br />
-1000<br />
-1500<br />
96-01-05<br />
96-03-01<br />
96-04-26<br />
96-06-21<br />
96-08-16<br />
96-10-11<br />
96-12-06<br />
97-01-31<br />
97-03-28<br />
97-05-23<br />
97-07-18<br />
97-09-12<br />
97-11-07<br />
98-01-02<br />
98-02-27<br />
98-04-24<br />
98-06-19<br />
98-08-14<br />
98-10-09<br />
98-12-04<br />
99-01-29<br />
99-03-26<br />
99-05-21<br />
99-07-16<br />
99-09-10<br />
99-11-05<br />
99-12-31<br />
00-02-25<br />
00-04-21<br />
00-06-16<br />
00-08-11<br />
00-10-06<br />
00-12-01<br />
01-01-26<br />
01-03-23<br />
01-05-18<br />
High-Low Ratio<br />
<strong>The</strong> High-Low Ratio is the number <strong>of</strong> new highs divided by the numbers <strong>of</strong> new lows. Daily<br />
or weekly data may be used in the calculation. Readings do get sometimes very distorted if<br />
there are for instance about 600 new highs and 5 new lows or vice versa. A long-period<br />
moving average should therefore be applied.<br />
© WallStreetCourier.com<br />
20<br />
18<br />
16<br />
14<br />
12<br />
10<br />
8<br />
6<br />
4<br />
2<br />
0<br />
HIGH-LOW RATIO WEEKLY<br />
96-01-05<br />
96-03-01<br />
96-04-26<br />
96-06-21<br />
96-08-16<br />
96-10-11<br />
96-12-06<br />
97-01-31<br />
97-03-28<br />
97-05-23<br />
97-07-18<br />
97-09-12<br />
97-11-07<br />
98-01-02<br />
98-02-27<br />
98-04-24<br />
98-06-19<br />
98-08-14<br />
98-10-09<br />
98-12-04<br />
99-01-29<br />
99-03-26<br />
99-05-21<br />
99-07-16<br />
99-09-10<br />
99-11-05<br />
99-12-31<br />
00-02-25<br />
00-04-21<br />
00-06-16<br />
00-08-11<br />
00-10-06<br />
00-12-01<br />
01-01-26<br />
01-03-23<br />
01-05-18<br />
Page 15
<strong>The</strong> E-<strong>Book</strong> <strong>of</strong> <strong>Technical</strong> <strong>Market</strong> <strong>Indicators</strong><br />
www.wallstreetcourier.com<br />
Global Futures High-Low Index<br />
This indicator is calculated by dividing the weekly number <strong>of</strong> highs and lows by the<br />
number <strong>of</strong> total issues traded. A 10-week moving average is applied to smooth out the<br />
swings. Like the advance-decline line, this indicator produces signals when it diverges from<br />
the action <strong>of</strong> the indices like the Dow Jones or the S&P 500. It is considered unhealthy for<br />
the market climate if the indices make new highs without many stocks reaching new highs<br />
at the same time.<br />
© WallStreetCourier.com<br />
0,25<br />
0,23<br />
0,21<br />
0,19<br />
0,17<br />
0,15<br />
0,13<br />
0,11<br />
0,09<br />
0,07<br />
0,05<br />
0,03<br />
0,01<br />
HIGHS<br />
HIGH -LOW INDEX<br />
10- WEEK MOVING AVERAGE<br />
LOWS<br />
96-01-05<br />
96-03-01<br />
96-04-26<br />
96-06-21<br />
96-08-16<br />
96-10-11<br />
96-12-06<br />
97-01-31<br />
97-03-28<br />
97-05-23<br />
97-07-18<br />
97-09-12<br />
97-11-07<br />
98-01-02<br />
98-02-27<br />
98-04-24<br />
98-06-19<br />
98-08-14<br />
98-10-09<br />
98-12-04<br />
99-01-29<br />
99-03-26<br />
99-05-21<br />
99-07-16<br />
99-09-10<br />
99-11-05<br />
99-12-31<br />
00-02-25<br />
00-04-21<br />
00-06-16<br />
00-08-11<br />
00-10-06<br />
00-12-01<br />
01-01-26<br />
01-03-23<br />
01-05-18<br />
Global Futures Bottom Indicator<br />
<strong>The</strong> Global Futures Bottom Indicator was developed by R. Koch <strong>of</strong> Wall Street<br />
Courier. To our knowledge there is no previous mentioning <strong>of</strong> this indicator in any financial<br />
publication. It does not appear very <strong>of</strong>ten but it is extremely reliable when the market is at a<br />
turning point. It prevents long-term investors from buying at the wrong time and works<br />
especially well for option traders because <strong>of</strong> its incredibly perfect timing. Unfortunately this<br />
indicator does not tell you when to sell. Set yourself a limit if you trade options, or use<br />
trailing stop-loss orders if you are a long-term investor.<br />
Page 16
<strong>The</strong> E-<strong>Book</strong> <strong>of</strong> <strong>Technical</strong> <strong>Market</strong> <strong>Indicators</strong><br />
www.wallstreetcourier.com<br />
Check BARRON`S every Monday for the weekly:<br />
• CALLS ADVANCES<br />
• CALLS DECLINES<br />
• PUTS ADVANCES<br />
• PUTS DECLINES<br />
• (CBOE MARKET REPORT)<br />
It takes you only five minutes every week to calculate the Global Futures Bottom Indicator:<br />
• Divide the number <strong>of</strong> calls advancing by the number <strong>of</strong> calls declining<br />
• Divide the number <strong>of</strong> puts declining by the number <strong>of</strong> puts advancing<br />
• Subtract the result <strong>of</strong> calls adv./decl. from the result <strong>of</strong> puts decl./adv.<br />
• Plot the difference on a chart and ignore the decimal.<br />
Example Calls Adv. Calls Decl. Unch. Puts Adv. Puts Decl. Unch.<br />
Prev.Week 23000 11000 8000 7000 25000 10000<br />
This Week 9000 26000 6000 24000 8000 7000<br />
You calculate as follows:<br />
23000 : 11000 = 2,09 25000 : 7000 = 3,57 Difference = 148 (357 minus 209)<br />
9000 : 26000 = 0,34 8000 : 24000 = 0,33 Difference = - 1 ( 33 minus 34)<br />
Date<br />
Calls<br />
Adv.<br />
Calls<br />
Decl.<br />
Calls A/D<br />
Puts<br />
Adv.<br />
Puts<br />
Decl.<br />
Puts D/A<br />
Bottom<br />
Indicator<br />
09.06.95 12656 14215 0,89 9590 13879 1,45 56<br />
16.06.95 17696 9818 1,80 5647 18431 3,26 146<br />
23.06.95 14390 8550 1,68 6014 13839 2,30 62<br />
30.06.95 10933 17902 0,61 12571 11735 0,93 32<br />
07.07.95 21611 7779 2,78 4894 20146 4,12 134<br />
14.07.95 17819 12190 1,46 8627 15531 1,80 34<br />
21.07.95 9071 22844 0,40 15943 9405 0,59 19<br />
28.07.95 18152 7554 2,40 4748 17237 3,63 123<br />
04.08.95 11159 21092 0,53 14649 11905 0,81 28<br />
11.08.95 13081 19336 0,68 12100 14522 1,20 52<br />
18.08.95 19594 12741 1,54 6930 20184 2,91 137<br />
25.08.95 9760 16547 0,59 10368 11238 1,08 49<br />
Page 17
<strong>The</strong> E-<strong>Book</strong> <strong>of</strong> <strong>Technical</strong> <strong>Market</strong> <strong>Indicators</strong><br />
www.wallstreetcourier.com<br />
© WallStreetCourier.com<br />
475<br />
425<br />
375<br />
325<br />
275<br />
225<br />
175<br />
125<br />
75<br />
25<br />
-25<br />
THE GLOBAL FUTURES BOTTOM INDICATOR<br />
96-01-05<br />
96-03-01<br />
96-04-26<br />
96-06-21<br />
96-08-16<br />
96-10-11<br />
96-12-06<br />
97-01-31<br />
97-03-28<br />
97-05-23<br />
97-07-18<br />
97-09-12<br />
97-11-07<br />
98-01-02<br />
98-02-27<br />
98-04-24<br />
98-06-19<br />
98-08-14<br />
98-10-09<br />
98-12-04<br />
99-01-29<br />
99-03-26<br />
99-05-21<br />
99-07-16<br />
99-09-10<br />
99-11-05<br />
99-12-31<br />
00-02-25<br />
00-04-21<br />
00-06-16<br />
00-08-11<br />
00-10-06<br />
00-12-01<br />
01-01-26<br />
01-03-23<br />
01-05-18<br />
© WallStreetCourier.com<br />
50,00<br />
40,00<br />
30,00<br />
THE GLOBAL FUTURES BOTTOM INDICATOR<br />
20,00<br />
10,00<br />
BUY<br />
0,00<br />
-10,00<br />
-20,00<br />
BOTTOM<br />
96-01-05<br />
96-03-01<br />
96-04-26<br />
96-06-21<br />
96-08-16<br />
96-10-11<br />
96-12-06<br />
97-01-31<br />
97-03-28<br />
97-05-23<br />
97-07-18<br />
97-09-12<br />
97-11-07<br />
98-01-02<br />
98-02-27<br />
98-04-24<br />
98-06-19<br />
98-08-14<br />
98-10-09<br />
98-12-04<br />
99-01-29<br />
99-03-26<br />
99-05-21<br />
99-07-16<br />
99-09-10<br />
99-11-05<br />
99-12-31<br />
00-02-25<br />
00-04-21<br />
00-06-16<br />
00-08-11<br />
00-10-06<br />
00-12-01<br />
01-01-26<br />
01-03-23<br />
01-05-18<br />
Any zero or minus reading indicates a bottom. Since this indicator was invented and<br />
developed it only failed twice on a minus reading if compared to the Dow Jones. This was<br />
due to panic selling on August 3rd and August 24th 1990 when Saddam invaded Kuwait.<br />
• Readings between 1 and 5 are also very reliable and indicate intermediate bottoms<br />
in bull markets.<br />
• Readings up to 25 may work but should be counterchecked with other indicators<br />
such as the Global Futures <strong>Market</strong> Timing Indicator.<br />
• Readings above 600 are good breadth indicators and show you that a powerful<br />
market move on the upside is to be expected.<br />
• Ignore all other readings.<br />
Page 18
<strong>The</strong> E-<strong>Book</strong> <strong>of</strong> <strong>Technical</strong> <strong>Market</strong> <strong>Indicators</strong><br />
www.wallstreetcourier.com<br />
For your convenience there is a track record attached (377 kb) back to 1985 for you<br />
to check the value <strong>of</strong> this indicator. Plot the numbers on a chart and compare it with<br />
previous market action. Feel free to make use <strong>of</strong> our indicator if you find it useful. Feel also<br />
free to publish it as long as you mention the source and call it the Global Futures Bottom<br />
Indicator. Download the track record at http://www.wallstreetcourier.com/technician/timingindicators/track-record.htm<br />
Cycles<br />
Cycle analysis has a long history and is also part <strong>of</strong> technical analysis. All markets<br />
appear to be subject to cyclical patterns and forces caused by economic influences and<br />
countless other factors. Stock market movements seem to take place with cyclical regularity<br />
and timing your trades to coincide with anticipated cyclical movements can be very<br />
rewarding. Wall Street Courier <strong>of</strong>fers some very reliable cycles for subscribers.<br />
Large Block Index<br />
<strong>The</strong> Large Block Index is calculated from the number <strong>of</strong> upticks and downticks in<br />
large block transactions <strong>of</strong> single trades <strong>of</strong> 10 000 shares and over. An uptick is at a price<br />
higher than the last previous trade and initiated by a buyer. A downtick is at a price lower<br />
than the previous trade and initiated by a seller. <strong>The</strong> rationale behind the Large Block Index<br />
is quite simple. It measures activities and extremes in institutional sentiment and behavior.<br />
When the ratio <strong>of</strong> upticks rises to very high levels, it indicates that the institutions are buying<br />
heavily, reaching a fully invested position and therefore lowering their cash reserves.<br />
Conversely, when the ratio <strong>of</strong> downticks rises to high levels, it indicates that the<br />
institutions are selling and are raising cash. When the institutional behaviour reaches<br />
extremes, the market will turn in a contrary direction. This indicator has <strong>of</strong>ten signaled major<br />
reversals and has also prevented investors from plunging into the market at the wrong time.<br />
<strong>The</strong> chart below shows you this indicator on a 10-day moving average.<br />
Page 19
<strong>The</strong> E-<strong>Book</strong> <strong>of</strong> <strong>Technical</strong> <strong>Market</strong> <strong>Indicators</strong><br />
www.wallstreetcourier.com<br />
© WallStreetCourier.com<br />
1,50<br />
1,45<br />
1,40<br />
1,35<br />
1,30<br />
1,25<br />
1,20<br />
1,15<br />
1,10<br />
1,05<br />
1,00<br />
0,95<br />
0,90<br />
0,85<br />
0,80<br />
SELL<br />
BUY<br />
THE GLOBAL FUTURES LARGE BLOCK INDEX<br />
10-DAY MOVING AVERAGE<br />
98-08-14<br />
98-09-11<br />
98-10-09<br />
98-11-06<br />
98-12-04<br />
99-01-01<br />
99-01-29<br />
99-02-26<br />
99-03-26<br />
99-04-23<br />
99-05-21<br />
99-06-18<br />
99-07-16<br />
99-08-13<br />
99-09-10<br />
99-10-08<br />
99-11-05<br />
99-12-03<br />
99-12-31<br />
00-01-28<br />
00-02-25<br />
00-03-24<br />
00-04-21<br />
00-05-19<br />
00-06-16<br />
00-07-14<br />
00-08-11<br />
00-09-08<br />
00-10-06<br />
00-11-03<br />
00-12-01<br />
00-12-29<br />
01-01-26<br />
01-02-23<br />
01-03-23<br />
01-04-20<br />
01-05-18<br />
01-06-15<br />
Short Term Trading Index (ARMS Index or TRIN)<br />
<strong>The</strong> Short Term Trading Index was invented over 30 years ago by Richard Arms and<br />
is also known as ARMS Index. It is calculated by dividing advancing issues by declining<br />
issues and advancing volume by declining volume. <strong>The</strong> first result is then divided by the<br />
latter and the result is the TRIN. If the index is above one, the average volume <strong>of</strong> stocks<br />
that fell on the NYSE was greater than the average volume <strong>of</strong> stocks that rose and vice<br />
versa. But it is most confirmative when it reaches extremes. This indicator rises sharply<br />
when the market is most depressed and selling is climaxing, and falls to very low levels<br />
during buying frenzies.<br />
Date Adv. Decl. A/D Upvol. Downvol. U/D Vol. TRIN 10- MA<br />
13.06.01 1521 1561 0,97 384035 657357 0,58 1,67<br />
14.06.01 927 2150 0,43 218634 997425 0,22 1,97<br />
15.06.01 1437 1588 0,90 649006 904083 0,72 1,26<br />
18.06.01 1309 1776 0,74 408501 682268 0,60 1,23<br />
19.06.01 1498 1541 0,97 543321 615409 0,88 1,10<br />
20.06.01 1823 1269 1,44 716273 610436 1,17 1,22<br />
21.06.01 1738 1352 1,29 905813 547728 1,65 0,78<br />
22.06.01 1243 1814 0,69 439011 722679 0,61 1,13<br />
25.06.01 1301 1777 0,73 332607 682239 0,49 1,50<br />
26.06.01 1778 1294 1,37 577414 605567 0,95 1,44 1,33<br />
27.06.01 1811 1268 1,43 462680 657256 0,70 2,03 1,37<br />
Page 20
<strong>The</strong> E-<strong>Book</strong> <strong>of</strong> <strong>Technical</strong> <strong>Market</strong> <strong>Indicators</strong><br />
www.wallstreetcourier.com<br />
28.06.01 1882 1211 1,55 877241 423609 2,07 0,75 1,24<br />
29.06.01 1938 1141 1,70 964950 759013 1,27 1,34 1,25<br />
02.07.01 1598 1468 1,09 694667 399965 1,74 0,63 1,19<br />
03.07.01 1592 1349 1,18 307258 304648 1,01 1,17 1,20<br />
© WallStreetCourier.com<br />
1,30<br />
BUY<br />
1,10<br />
SHORT TERM TRADING INDEX WEEKLY (TRIN)<br />
4-WEEK MOVING AVERAGE<br />
0,90<br />
0,70<br />
SELL<br />
96-01-05<br />
96-03-01<br />
96-04-26<br />
96-06-21<br />
96-08-16<br />
96-10-11<br />
96-12-06<br />
97-01-31<br />
97-03-28<br />
97-05-23<br />
97-07-18<br />
97-09-12<br />
97-11-07<br />
98-01-02<br />
98-02-27<br />
98-04-24<br />
98-06-19<br />
98-08-14<br />
98-10-09<br />
98-12-04<br />
99-01-29<br />
99-03-26<br />
99-05-21<br />
99-07-16<br />
99-09-10<br />
99-11-05<br />
99-12-31<br />
00-02-25<br />
00-04-21<br />
00-06-16<br />
00-08-11<br />
00-10-06<br />
00-12-01<br />
01-01-26<br />
01-03-23<br />
01-05-18<br />
© WallStreetCourier.com<br />
1,70<br />
TRIN DAILY<br />
10-DAY MOVING AVERAGE<br />
1,45<br />
BUY<br />
1,20<br />
0,95<br />
0,70<br />
SELL<br />
96-01-02<br />
96-02-27<br />
96-04-23<br />
96-06-18<br />
96-08-13<br />
96-10-08<br />
96-12-03<br />
97-01-28<br />
97-03-25<br />
97-05-20<br />
97-07-15<br />
97-09-09<br />
97-11-04<br />
97-12-30<br />
98-02-24<br />
98-04-21<br />
98-06-16<br />
98-08-11<br />
98-10-06<br />
98-12-01<br />
99-01-26<br />
99-03-23<br />
99-05-18<br />
99-07-13<br />
99-09-07<br />
99-11-02<br />
99-12-28<br />
00-02-22<br />
00-04-18<br />
00-06-13<br />
00-08-08<br />
00-10-03<br />
00-11-28<br />
01-01-23<br />
01-03-20<br />
01-05-15<br />
Page 21
<strong>The</strong> E-<strong>Book</strong> <strong>of</strong> <strong>Technical</strong> <strong>Market</strong> <strong>Indicators</strong><br />
www.wallstreetcourier.com<br />
Trend Indicator<br />
Why are some traders more successful than others <strong>The</strong>re are probably as many<br />
answers as there are traders out there. But you will undoubtedly agree that most <strong>of</strong> the<br />
money is being made in a trend, especially as far as options and futures are concerned. In<br />
options trading your biggest enemy by far is time. You need to have the patience and<br />
discipline to wait for a trend in the market in order to succeed on the long run. <strong>The</strong> same<br />
rule applies to any short-term oriented trader. <strong>The</strong> Global Futures Trend Index shows you<br />
clearly when to enter the market. This index is computed by dividing the daily highs by the<br />
sum <strong>of</strong> the daily highs and lows. A 10-week moving average is applied to smooth out the<br />
swings. As long as the readings <strong>of</strong> this index stay above the 80%-level there is a solid<br />
bullish trend in progress. Any weakness should be used to go long or to buy call options,<br />
preferably <strong>of</strong> stocks which are in a clear uptrend, or stock index options. Readings below 20<br />
indicate a bearish trend. Strong days should be used to short stocks which are already<br />
weak, or to buy put options. As long as this indicator is in neutral territory don't do anything<br />
unless you are a savvy stockpicker, insider or a long-term value investor.<br />
© WallStreetCourier.com<br />
1,00<br />
0,90<br />
0,80<br />
0,70<br />
0,60<br />
0,50<br />
0,40<br />
0,30<br />
0,20<br />
0,10<br />
0,00<br />
BULLISH TREND<br />
TRADING RANGE MARKET<br />
BEARISH TREND<br />
THE GLOBAL FUTURES TREND INDEX<br />
96-01-02<br />
96-02-27<br />
96-04-23<br />
96-06-18<br />
96-08-13<br />
96-10-08<br />
96-12-03<br />
97-01-28<br />
97-03-25<br />
97-05-20<br />
97-07-15<br />
97-09-09<br />
97-11-04<br />
97-12-30<br />
98-02-24<br />
98-04-21<br />
98-06-16<br />
98-08-11<br />
98-10-06<br />
98-12-01<br />
99-01-26<br />
99-03-23<br />
99-05-18<br />
99-07-13<br />
99-09-07<br />
99-11-02<br />
99-12-28<br />
00-02-22<br />
00-04-18<br />
00-06-13<br />
00-08-08<br />
00-10-03<br />
00-11-28<br />
01-01-23<br />
01-03-20<br />
01-05-15<br />
Page 22
<strong>The</strong> E-<strong>Book</strong> <strong>of</strong> <strong>Technical</strong> <strong>Market</strong> <strong>Indicators</strong><br />
www.wallstreetcourier.com<br />
CBOE Volatility Index (VIX)<br />
VIX computes volatility <strong>of</strong> four OEX contracts in two nearby months and is published<br />
daily by the CBOE. Options selected for this index are one call and one put just out <strong>of</strong> the<br />
money, and one call and one put just in the money, for each <strong>of</strong> the two front months <strong>of</strong> the<br />
OEX (S&P 100). Extremely high readings <strong>of</strong> VIX indicate bottoms and low readings tops.<br />
©<br />
50<br />
VOLATILITY INDEX (VIX) WEEKLY<br />
40<br />
30<br />
20<br />
10<br />
0<br />
96-01-05<br />
96-03-01<br />
96-04-26<br />
96-06-21<br />
96-08-16<br />
96-10-11<br />
96-12-06<br />
97-01-31<br />
97-03-28<br />
97-05-23<br />
97-07-18<br />
97-09-12<br />
97-11-07<br />
98-01-02<br />
98-02-27<br />
98-04-24<br />
98-06-19<br />
98-08-14<br />
98-10-09<br />
98-12-04<br />
99-01-29<br />
99-03-26<br />
99-05-21<br />
99-07-16<br />
99-09-10<br />
99-11-05<br />
99-12-31<br />
00-02-25<br />
00-04-21<br />
00-06-16<br />
00-08-11<br />
00-10-06<br />
00-12-01<br />
01-01-26<br />
01-03-23<br />
01-05-18<br />
Index Options Put/Call Ratio<br />
This indicator is calculated by dividing the weekly volume <strong>of</strong> S&P 100 call options by<br />
the weekly volume <strong>of</strong> S&P 100 put options. Big call volume appears at market tops and big<br />
put volume at bottoms. But call/put ratios <strong>of</strong> the indices like OEX and SPX are distorted and<br />
clouded by arbitrage and hedging and do therefore not always reflect true investor<br />
sentiment.<br />
Page 23
<strong>The</strong> E-<strong>Book</strong> <strong>of</strong> <strong>Technical</strong> <strong>Market</strong> <strong>Indicators</strong><br />
www.wallstreetcourier.com<br />
© WallStreetCourier.com<br />
CALL/PUT RATIO OEX<br />
1,15<br />
0,95<br />
SELL<br />
4-WEEK MOVING AVERAGE<br />
0,75<br />
0,55<br />
BUY<br />
0,35<br />
96-01-05<br />
96-03-01<br />
96-04-26<br />
96-06-21<br />
96-08-16<br />
96-10-11<br />
96-12-06<br />
97-01-31<br />
97-03-28<br />
97-05-23<br />
97-07-18<br />
97-09-12<br />
97-11-07<br />
98-01-02<br />
98-02-27<br />
98-04-24<br />
98-06-19<br />
98-08-14<br />
98-10-09<br />
98-12-04<br />
99-01-29<br />
99-03-26<br />
99-05-21<br />
99-07-16<br />
99-09-10<br />
99-11-05<br />
99-12-31<br />
00-02-25<br />
00-04-21<br />
00-06-16<br />
00-08-11<br />
00-10-06<br />
00-12-01<br />
01-01-26<br />
01-03-23<br />
01-05-18<br />
Call/Put Ratio<br />
This indicator is calculated by dividing the daily or weekly volume <strong>of</strong> call options by<br />
the daily or weekly volume <strong>of</strong> put options. Big call volume appears at market tops and big<br />
put volume at bottoms. Only CBOE equity options or all CBOE options should be used for<br />
this indicator. Call/put ratios <strong>of</strong> the indices like OEX and SPX are distorted and clouded by<br />
arbitrage and hedging and do therefore not always reflect true investor sentiment. <strong>The</strong> chart<br />
below shows you the weekly call/put ratio on a 4-week moving average to smooth out the<br />
swings.<br />
© WallStreetCourier.com<br />
2,50<br />
CALL/PUT RATIO ALL CBOE OPTIONS<br />
4-WEEK MOVING AVERAGE<br />
2,25<br />
2,00<br />
SELL<br />
1,75<br />
1,50<br />
1,25<br />
BUY<br />
1,00<br />
96-01-05<br />
96-03-01<br />
96-04-26<br />
96-06-21<br />
96-08-16<br />
96-10-11<br />
96-12-06<br />
97-01-31<br />
97-03-28<br />
97-05-23<br />
97-07-18<br />
97-09-12<br />
97-11-07<br />
98-01-02<br />
98-02-27<br />
98-04-24<br />
98-06-19<br />
98-08-14<br />
98-10-09<br />
98-12-04<br />
99-01-29<br />
99-03-26<br />
99-05-21<br />
99-07-16<br />
99-09-10<br />
99-11-05<br />
99-12-31<br />
00-02-25<br />
00-04-21<br />
00-06-16<br />
00-08-11<br />
00-10-06<br />
00-12-01<br />
01-01-26<br />
01-03-23<br />
01-05-18<br />
Page 24
<strong>The</strong> E-<strong>Book</strong> <strong>of</strong> <strong>Technical</strong> <strong>Market</strong> <strong>Indicators</strong><br />
www.wallstreetcourier.com<br />
© WallStreetCourier.com<br />
3,00<br />
CALL/PUT RATIO EQUITY OPTIONS<br />
4-WEEK MOVING AVERAGE<br />
SELL<br />
2,50<br />
2,00<br />
BUY<br />
1,50<br />
96-01-05<br />
96-03-01<br />
96-04-26<br />
96-06-21<br />
96-08-16<br />
96-10-11<br />
96-12-06<br />
97-01-31<br />
97-03-28<br />
97-05-23<br />
97-07-18<br />
97-09-12<br />
97-11-07<br />
98-01-02<br />
98-02-27<br />
98-04-24<br />
98-06-19<br />
98-08-14<br />
98-10-09<br />
98-12-04<br />
99-01-29<br />
99-03-26<br />
99-05-21<br />
99-07-16<br />
99-09-10<br />
99-11-05<br />
99-12-31<br />
00-02-25<br />
00-04-21<br />
00-06-16<br />
00-08-11<br />
00-10-06<br />
00-12-01<br />
01-01-26<br />
01-03-23<br />
01-05-18<br />
Global Futures Put/Volume Ratio<br />
<strong>The</strong> Global Futures Put/Volume Ratio is a market sentiment indicator. It is calculated<br />
by dividing the volume <strong>of</strong> CBOE equity put options by the NYSE volume on a weekly basis<br />
and is interpreted in a contrary fashion. High readings signify extreme pessimism and fear,<br />
sometimes outright panic and indicate very <strong>of</strong>ten bottoms. Low readings <strong>of</strong> this indicator<br />
result from the anticipation <strong>of</strong> higher prices ahead and are therefore considered bearish. It<br />
is in our opinion more affirmative than the widely used put/call ratio which has gained<br />
widespread notice.<br />
© WallStreetCourier.com<br />
45<br />
THE GLOBAL FUTURES PUT/VOLUME RATIO<br />
40<br />
35<br />
30<br />
25<br />
20<br />
15<br />
96-01-05<br />
96-03-01<br />
96-04-26<br />
96-06-21<br />
96-08-16<br />
96-10-11<br />
96-12-06<br />
97-01-31<br />
97-03-28<br />
97-05-23<br />
97-07-18<br />
97-09-12<br />
97-11-07<br />
98-01-02<br />
98-02-27<br />
98-04-24<br />
98-06-19<br />
98-08-14<br />
98-10-09<br />
98-12-04<br />
99-01-29<br />
99-03-26<br />
99-05-21<br />
99-07-16<br />
99-09-10<br />
99-11-05<br />
99-12-31<br />
00-02-25<br />
00-04-21<br />
00-06-16<br />
00-08-11<br />
00-10-06<br />
00-12-01<br />
01-01-26<br />
01-03-23<br />
01-05-18<br />
Page 25
<strong>The</strong> E-<strong>Book</strong> <strong>of</strong> <strong>Technical</strong> <strong>Market</strong> <strong>Indicators</strong><br />
www.wallstreetcourier.com<br />
Smart Money Flow Index<br />
<strong>The</strong> Smart Money Flow Index has long been one <strong>of</strong> the best kept secrets <strong>of</strong> Wall<br />
Street. Everybody knows the importance <strong>of</strong> a closing price and other last hour indicators<br />
like the Closing Tick, which we publish daily for free on our portal. <strong>The</strong> Smart Money Flow<br />
Index is therefore calculated by taking the action <strong>of</strong> the Dow in two time periods: the first 30<br />
minutes and the close. <strong>The</strong> first 30 minutes represent emotional buying, driven by greed<br />
and fear <strong>of</strong> the crowd based on good and bad news. <strong>The</strong>re is also a lot <strong>of</strong> buying on market<br />
orders and short covering at the opening. Smart money waits until the end and they very<br />
<strong>of</strong>ten test the market before by shorting heavily just to see how the market reacts. <strong>The</strong>n<br />
they move in the big way. <strong>The</strong>se heavy hitters also have the best possible information<br />
available to them and they do have the edge on all the other market participants. <strong>The</strong> Smart<br />
Money Indicator is calculated like the Advance-Decline Line. You can easily do it yourself if<br />
you don't want to pay our subscription rate <strong>of</strong> $1.50 weekly (based on a 6-month<br />
membership). Just start at any given day, subtract the price <strong>of</strong> the Dow at 10 AM from the<br />
previous day's close and add today's closing price. <strong>The</strong> result is plotted on a chart, together<br />
with the closing price <strong>of</strong> the Dow only. Whenever the Dow makes a high which is not<br />
confirmed by the SMI there is trouble ahead (chart below). Watch the divergence around<br />
June 1998, February 2000 and September 2000. Watching this indicator is like being on a<br />
plane and see the pilots jumping <strong>of</strong>f with parachutes. This indicator is suitable only for<br />
investors with a longer time horizon. Such investors should buy blue chips when the<br />
indicator gives a buy signal, and sell and sell short on a divergence.<br />
© WallStreetCourier.com<br />
12000<br />
SMART MONEY FLOW INDEX<br />
DOW JONES CLOSE<br />
10000<br />
Bearish<br />
Divergence<br />
Bearish<br />
Divergence<br />
8000<br />
SMART MONEY FLOW INDEX<br />
6000<br />
Bullish<br />
Divergence<br />
98-01-02<br />
98-01-30<br />
98-02-27<br />
98-03-27<br />
98-04-24<br />
98-05-22<br />
98-06-19<br />
98-07-17<br />
98-08-14<br />
98-09-11<br />
98-10-09<br />
98-11-06<br />
98-12-04<br />
99-01-01<br />
99-01-29<br />
99-02-26<br />
99-03-26<br />
99-04-23<br />
99-05-21<br />
99-06-18<br />
99-07-16<br />
99-08-13<br />
99-09-10<br />
99-10-08<br />
99-11-05<br />
99-12-03<br />
99-12-31<br />
00-01-28<br />
00-02-25<br />
00-03-24<br />
00-04-21<br />
00-05-19<br />
00-06-16<br />
00-07-14<br />
00-08-11<br />
00-09-08<br />
00-10-06<br />
00-11-03<br />
00-12-01<br />
00-12-29<br />
01-01-26<br />
01-02-23<br />
01-03-23<br />
01-04-20<br />
01-05-18<br />
01-06-15<br />
Page 26
<strong>The</strong> E-<strong>Book</strong> <strong>of</strong> <strong>Technical</strong> <strong>Market</strong> <strong>Indicators</strong><br />
www.wallstreetcourier.com<br />
Global Futures Timing Indicator<br />
This indicator, like the Global Futures Bottom Indicator, is unknown until now to the<br />
investment community and is not available anywhere else. To our knowledge there is no<br />
previous mentioning <strong>of</strong> this indicator in any financial publication. It was also developed by<br />
R. Koch <strong>of</strong> Wall Street Courier. <strong>The</strong> Global Futures Timing Indicator gives buy signals more<br />
<strong>of</strong>ten and is an excellent supplement to the Global Futures Bottom Indicator, especially<br />
when this one has readings between 6 and 25. It prevents investors from buying at the<br />
wrong time and it works also very well for option speculators and position traders because<br />
<strong>of</strong> its expert timing.<br />
Both indicators together should improve your trading substantially and will build you<br />
an estate in the years ahead. Just start buying good value stocks whenever the readings <strong>of</strong><br />
the Global Futures Timing Indicator shrink to single digit numbers. This takes <strong>of</strong> course a lot<br />
<strong>of</strong> guts because the opinions <strong>of</strong> the widely quoted gurus are usually contrary at this time.<br />
Minus readings indicate an intermediate bottom.<br />
© WallStreetCourier.com<br />
80,00<br />
70,00<br />
60,00<br />
50,00<br />
40,00<br />
30,00<br />
20,00<br />
10,00<br />
0,00<br />
-10,00<br />
-20,00<br />
THE GLOBAL FUTURES TIMING INDICATOR<br />
INTERMEDIATE BOTTOM<br />
START BUYING<br />
96-01-12<br />
96-02-23<br />
96-04-05<br />
96-05-17<br />
96-06-28<br />
96-08-09<br />
96-09-20<br />
96-11-01<br />
96-12-13<br />
97-01-24<br />
97-03-07<br />
97-04-18<br />
97-05-30<br />
97-07-11<br />
97-08-22<br />
97-10-03<br />
97-11-14<br />
97-12-26<br />
98-02-06<br />
98-03-20<br />
98-05-01<br />
98-06-12<br />
98-07-24<br />
98-09-04<br />
98-10-16<br />
98-11-27<br />
99-01-08<br />
99-02-19<br />
99-04-02<br />
99-05-14<br />
99-06-25<br />
99-08-06<br />
99-09-17<br />
99-10-29<br />
99-12-10<br />
00-01-21<br />
00-03-03<br />
00-04-14<br />
00-05-26<br />
00-07-07<br />
00-08-18<br />
00-09-29<br />
00-11-10<br />
00-12-22<br />
01-02-02<br />
01-03-16<br />
01-04-27<br />
01-06-08<br />
Page 27
<strong>The</strong> E-<strong>Book</strong> <strong>of</strong> <strong>Technical</strong> <strong>Market</strong> <strong>Indicators</strong><br />
www.wallstreetcourier.com<br />
Global Futures <strong>Market</strong> Timer Index<br />
<strong>The</strong> Global Futures <strong>Market</strong> Timer Index is a proprietary indicator <strong>of</strong> Global Futures<br />
and not available anywhere else. It was unknown until now to the investment community<br />
and to our knowledge there is no previous mentioning <strong>of</strong> this indicator in any financial<br />
publication. <strong>The</strong> Global Futures <strong>Market</strong> Timer Index gives buy signals when it has readings<br />
below 1,00 and sell signals above 1,20. Start buying good value stocks whenever the<br />
readings <strong>of</strong> this index fall below 1,00. This takes <strong>of</strong> course a lot <strong>of</strong> guts because the<br />
opinions <strong>of</strong> the widely quoted gurus are usually contrary at this time. Place close stops<br />
when readings go above 1,20.<br />
©<br />
1,40<br />
THE GLOBAL FUTURES MARKET TIMER INDEX<br />
1,20<br />
SELL<br />
1,00<br />
BUY<br />
0,80<br />
96-01-05<br />
96-03-01<br />
96-04-26<br />
96-06-21<br />
96-08-16<br />
96-10-11<br />
96-12-06<br />
97-01-31<br />
97-03-28<br />
97-05-23<br />
97-07-18<br />
97-09-12<br />
97-11-07<br />
98-01-02<br />
98-02-27<br />
98-04-24<br />
98-06-19<br />
98-08-14<br />
98-10-09<br />
98-12-04<br />
99-01-29<br />
99-03-26<br />
99-05-21<br />
99-07-16<br />
99-09-10<br />
99-11-05<br />
99-12-31<br />
00-02-25<br />
00-04-21<br />
00-06-16<br />
00-08-11<br />
00-10-06<br />
00-12-01<br />
01-01-26<br />
01-03-23<br />
01-05-18<br />
Page 28
<strong>The</strong> E-<strong>Book</strong> <strong>of</strong> <strong>Technical</strong> <strong>Market</strong> <strong>Indicators</strong><br />
www.wallstreetcourier.com<br />
Global Futures Fear Indicator<br />
<strong>The</strong> Global Futures Fear Indicator is a proprietary indicator <strong>of</strong> Global Futures and not<br />
available anywhere else. It was unknown until now to the investment community and to our<br />
knowledge there is no previous mentioning <strong>of</strong> this indicator in any financial publication. <strong>The</strong><br />
Global Futures Indicator gives buy signals when it has readings between 0 and 10.<br />
Start buying good value stocks whenever the readings <strong>of</strong> this index fall below 0. This<br />
takes <strong>of</strong> course a lot <strong>of</strong> guts because the opinions <strong>of</strong> the widely quoted gurus are usually<br />
contrary at this time. Unfortunately this indicator does not tell you when to sell. Set yourself<br />
a limit if you trade options or use trailing stop-loss orders if you are a long-term investor.<br />
© WallStreetCourier.com<br />
40,00<br />
THE GLOBAL FUTURES FEAR INDICATOR<br />
35,00<br />
30,00<br />
25,00<br />
20,00<br />
15,00<br />
10,00<br />
5,00<br />
0,00<br />
-5,00<br />
BUY<br />
PANIC<br />
96-01-05<br />
96-03-01<br />
96-04-26<br />
96-06-21<br />
96-08-16<br />
96-10-11<br />
96-12-06<br />
97-01-31<br />
97-03-28<br />
97-05-23<br />
97-07-18<br />
97-09-12<br />
97-11-07<br />
98-01-02<br />
98-02-27<br />
98-04-24<br />
98-06-19<br />
98-08-14<br />
98-10-09<br />
98-12-04<br />
99-01-29<br />
99-03-26<br />
99-05-21<br />
99-07-16<br />
99-09-10<br />
99-11-05<br />
99-12-31<br />
00-02-25<br />
00-04-21<br />
00-06-16<br />
00-08-11<br />
00-10-06<br />
00-12-01<br />
01-01-26<br />
01-03-23<br />
01-05-18<br />
Wall Street Courier Index<br />
<strong>The</strong> Wall Street Courier Index gives you a longer term picture <strong>of</strong> the stock market.<br />
Readings below 40 indicate a heavily oversold market which is ripe for an upturn. Readings<br />
above 50 flash a warning signal and you should use trailing stop-loss orders to protect your<br />
pr<strong>of</strong>its. This index serves longer-term oriented position traders very well. It is also a<br />
contrarian indicator and once again we would like to remind you that charts usually look<br />
most bullish at tops and most bearish at bottoms.This indicator has an excellent track<br />
record as you can see.<br />
Page 29
<strong>The</strong> E-<strong>Book</strong> <strong>of</strong> <strong>Technical</strong> <strong>Market</strong> <strong>Indicators</strong><br />
www.wallstreetcourier.com<br />
© WallStreetCourier.com<br />
0,60<br />
THE WALL STREET COURIER INDEX<br />
0,55<br />
SELL<br />
0,50<br />
0,45<br />
0,40<br />
BUY<br />
0,35<br />
96-01-05<br />
96-03-01<br />
96-04-26<br />
96-06-21<br />
96-08-16<br />
96-10-11<br />
96-12-06<br />
97-01-31<br />
97-03-28<br />
97-05-23<br />
97-07-18<br />
97-09-12<br />
97-11-07<br />
98-01-02<br />
98-02-27<br />
98-04-24<br />
98-06-19<br />
98-08-14<br />
98-10-09<br />
98-12-04<br />
99-01-29<br />
99-03-26<br />
99-05-21<br />
99-07-16<br />
99-09-10<br />
99-11-05<br />
99-12-31<br />
00-02-25<br />
00-04-21<br />
00-06-16<br />
00-08-11<br />
00-10-06<br />
00-12-01<br />
01-01-26<br />
01-03-23<br />
01-05-18<br />
Global Futures Trading Index<br />
<strong>The</strong> Global Futures Trading Index is a proprietary indicator <strong>of</strong> Global Futures. It<br />
shows bottoms and tops in trends and should be used together with the Global Futures<br />
Trend Index for exact timing. If the market is in a clear uptrend according to our trend index,<br />
go long if the Global Futures Trading Index shows a reading below 35. <strong>The</strong> reverse is true<br />
in a downtrend. Go short or buy puts if the index gives readings <strong>of</strong> 55 or above when the<br />
Global Futures Trend Index is below 20. Cover all your shorts if the index trades below 35<br />
in a bearish trend. Please bear in mind that this index is a contrary indicator and therefore<br />
when these signals are given, they will be most likely contrary to most <strong>of</strong> the news <strong>of</strong> the<br />
moment and the opinions <strong>of</strong> the well known and most widely quoted gurus <strong>of</strong> Wall Street.<br />
Page 30
<strong>The</strong> E-<strong>Book</strong> <strong>of</strong> <strong>Technical</strong> <strong>Market</strong> <strong>Indicators</strong><br />
www.wallstreetcourier.com<br />
© WallStreetCourier.com<br />
0,75<br />
0,70<br />
0,65<br />
0,60<br />
0,55<br />
0,50<br />
0,45<br />
0,40<br />
0,35<br />
0,30<br />
0,25<br />
SELL<br />
BUY<br />
THE GLOBAL FUTURES TRADING INDEX<br />
96-01-05<br />
96-03-01<br />
96-04-26<br />
96-06-21<br />
96-08-16<br />
96-10-11<br />
96-12-06<br />
97-01-31<br />
97-03-28<br />
97-05-23<br />
97-07-18<br />
97-09-12<br />
97-11-07<br />
98-01-02<br />
98-02-27<br />
98-04-24<br />
98-06-19<br />
98-08-14<br />
98-10-09<br />
98-12-04<br />
99-01-29<br />
99-03-26<br />
99-05-21<br />
99-07-16<br />
99-09-10<br />
99-11-05<br />
99-12-31<br />
00-02-25<br />
00-04-21<br />
00-06-16<br />
00-08-11<br />
00-10-06<br />
00-12-01<br />
01-01-26<br />
01-03-23<br />
01-05-18<br />
Global Futures Speculation Index<br />
This indicator is calculated by simply adding the number <strong>of</strong> the weekly CBOE equity calls<br />
and puts together and dividing the result by the weekly NYSE volume.<br />
© WallStreetCourier.com<br />
1,40<br />
THE GLOBAL FUTURES SPECULATION INDEX<br />
1,20<br />
1,00<br />
0,80<br />
0,60<br />
96-01-05<br />
96-03-01<br />
96-04-26<br />
96-06-21<br />
96-08-16<br />
96-10-11<br />
96-12-06<br />
97-01-31<br />
97-03-28<br />
97-05-23<br />
97-07-18<br />
97-09-12<br />
97-11-07<br />
98-01-02<br />
98-02-27<br />
98-04-24<br />
98-06-19<br />
98-08-14<br />
98-10-09<br />
98-12-04<br />
99-01-29<br />
99-03-26<br />
99-05-21<br />
99-07-16<br />
99-09-10<br />
99-11-05<br />
99-12-31<br />
00-02-25<br />
00-04-21<br />
00-06-16<br />
00-08-11<br />
00-10-06<br />
00-12-01<br />
01-01-26<br />
01-03-23<br />
01-05-18<br />
Page 31
<strong>The</strong> E-<strong>Book</strong> <strong>of</strong> <strong>Technical</strong> <strong>Market</strong> <strong>Indicators</strong><br />
www.wallstreetcourier.com<br />
Program Trading<br />
Program trading is the purchase or sale <strong>of</strong> at least 15 different stocks with a total<br />
value <strong>of</strong> $1 million or more. Some <strong>of</strong> Wall Streets biggest names are the players in this<br />
game and they are among others: Merrill Lynch, Bear Stearns, First Boston, Morgan<br />
Stanley, Deutsche Bank Sec, and Nomura. <strong>The</strong>re is a bullish tendency in the market<br />
whenever the Buy/Sell Ratio <strong>of</strong> program traders rises above 1,20 on a 4-week moving<br />
average. When program trading becomes excessive and accounts for more than about<br />
25% <strong>of</strong> total volume on a 4-week moving average, the market became vulnerable in the<br />
past.<br />
© WallStreetCourier.com<br />
1,80<br />
1,60<br />
NYSE PROGRAM TRADING - BUY/SELL RATIO<br />
4 - WEEK MOVING AVERAGE<br />
1,40<br />
1,20<br />
1,00<br />
0,80<br />
0,60<br />
96-01-05<br />
96-03-01<br />
96-04-26<br />
96-06-21<br />
96-08-16<br />
96-10-11<br />
96-12-06<br />
97-01-31<br />
97-03-28<br />
97-05-23<br />
97-07-18<br />
97-09-12<br />
97-11-07<br />
98-01-02<br />
98-02-27<br />
98-04-24<br />
98-06-19<br />
98-08-14<br />
98-10-09<br />
98-12-04<br />
99-01-29<br />
99-03-26<br />
99-05-21<br />
99-07-16<br />
99-09-10<br />
99-11-05<br />
99-12-31<br />
00-02-25<br />
00-04-21<br />
00-06-16<br />
00-08-11<br />
00-10-06<br />
00-12-01<br />
01-01-26<br />
01-03-23<br />
01-05-18<br />
© WallStreetCourier.com<br />
32<br />
PROGRAM TRADING IN % OF NYSE VOLUME<br />
4- WEEK MOVING AVERAGE<br />
26<br />
20<br />
14<br />
8<br />
96-01-05<br />
96-03-01<br />
96-04-26<br />
96-06-21<br />
96-08-16<br />
96-10-11<br />
96-12-06<br />
97-01-31<br />
97-03-28<br />
97-05-23<br />
97-07-18<br />
97-09-12<br />
97-11-07<br />
98-01-02<br />
98-02-27<br />
98-04-24<br />
98-06-19<br />
98-08-14<br />
98-10-09<br />
98-12-04<br />
99-01-29<br />
99-03-26<br />
99-05-21<br />
99-07-16<br />
99-09-10<br />
99-11-05<br />
99-12-31<br />
00-02-25<br />
00-04-21<br />
00-06-16<br />
00-08-11<br />
00-10-06<br />
00-12-01<br />
01-01-26<br />
01-03-23<br />
01-05-18<br />
Page 32
<strong>The</strong> E-<strong>Book</strong> <strong>of</strong> <strong>Technical</strong> <strong>Market</strong> <strong>Indicators</strong><br />
www.wallstreetcourier.com<br />
Global Futures Time Premium Index<br />
<strong>The</strong> Global Futures Time Premium Index is a sentiment indicator. <strong>The</strong> spread<br />
between the S&P 500 cash index and the S&P futures contracts (premium) shows high<br />
readings near market tops and low readings near market bottoms. <strong>The</strong> bold red lines on the<br />
chart below show you the futures contracts with the highest and lowest premiums <strong>of</strong> the last<br />
years on a 5-day moving average for comparison (6 months until expiration). If the index<br />
(premium <strong>of</strong> the nearby S&P 500 futures contract on a 5-day moving average) moves close<br />
to the upper line or above, bullish sentiment is prevailing which is a bearish indicator. <strong>The</strong><br />
reverse is true if the index moves near or below the lower line; it shows extreme pessimism<br />
by futures traders and indicates bottoms.<br />
© WallStreetCourier.com<br />
50<br />
GLOBAL FUTURES TIME PREMIUM INDEX<br />
40<br />
30<br />
20<br />
10<br />
0<br />
SP U1<br />
114<br />
112<br />
110<br />
108<br />
106<br />
104<br />
102<br />
100<br />
98<br />
96<br />
94<br />
92<br />
90<br />
88<br />
86<br />
84<br />
82<br />
80<br />
78<br />
76<br />
74<br />
72<br />
70<br />
68<br />
66<br />
64<br />
62<br />
60<br />
58<br />
56<br />
54<br />
52<br />
50<br />
48<br />
46<br />
44<br />
42<br />
40<br />
38<br />
36<br />
34<br />
32<br />
30<br />
28<br />
26<br />
24<br />
22<br />
20<br />
18<br />
16<br />
14<br />
12<br />
108642<br />
Calendar Spread<br />
A good sentiment indicator in the past has been the Calendar Spread . This is the<br />
premium spread <strong>of</strong> the two nearby S&P 500 futures contracts (for instance the difference<br />
between the June SP and September SP contracts on a 5- day moving average). It shows if<br />
futures traders are extremely bearish or bullish. When speculation peaked in June 2000<br />
and everybody was bullish, this indicator was as high as 23!<br />
Page 33
<strong>The</strong> E-<strong>Book</strong> <strong>of</strong> <strong>Technical</strong> <strong>Market</strong> <strong>Indicators</strong><br />
www.wallstreetcourier.com<br />
© WallStreetCourier.com<br />
23<br />
DAILY CALENDAR SPREAD<br />
5- DAY MOVING AVERAGE<br />
19<br />
15<br />
11<br />
7<br />
99-01-06<br />
99-02-03<br />
99-03-03<br />
99-03-31<br />
99-04-28<br />
99-05-26<br />
99-06-23<br />
99-07-21<br />
99-08-18<br />
99-09-15<br />
99-10-13<br />
99-11-10<br />
99-12-08<br />
00-01-05<br />
00-02-02<br />
00-03-01<br />
00-03-29<br />
00-04-26<br />
00-05-24<br />
00-06-21<br />
00-07-19<br />
00-08-16<br />
00-09-13<br />
00-10-11<br />
00-11-08<br />
00-12-06<br />
01-01-03<br />
01-01-31<br />
01-02-28<br />
01-03-28<br />
01-04-25<br />
01-05-23<br />
01-06-20<br />
01-07-18<br />
Odd-Lot Differential Index<br />
This index is simply calculated by subtracting the daily or weekly odd-lot sales from<br />
the daily or weekly odd-lot purchases. A 10-period moving average is applied to smooth out<br />
the swings. High readings appear near market tops and minus readings near bottoms.<br />
Introduced by Wall Street Courier, the Odd -Lot Differential Index indicates the market<br />
sentiment <strong>of</strong> small investors who purchase less than 100 shares <strong>of</strong> a stock. <strong>The</strong>se market<br />
participants are usually wrong about the direction <strong>of</strong> the market and this indicator is<br />
therefore considered to be a contrary opinion sentiment indicator.<br />
© WallStreetCourier.com<br />
3000<br />
ODD-LOT DIFFERENTIAL INDEX DAILY<br />
10-DAY MOVING AVERAGE<br />
2000<br />
1000<br />
0<br />
-1000<br />
02.01.2001<br />
05.01.2001<br />
10.01.2001<br />
16.01.2001<br />
19.01.2001<br />
24.01.2001<br />
29.01.2001<br />
01.02.2001<br />
06.02.2001<br />
09.02.2001<br />
14.02.2001<br />
20.02.2001<br />
23.02.2001<br />
28.02.2001<br />
05.03.2001<br />
08.03.2001<br />
13.03.2001<br />
16.03.2001<br />
21.03.2001<br />
26.03.2001<br />
29.03.2001<br />
03.04.2001<br />
06.04.2001<br />
11.04.2001<br />
17.04.2001<br />
20.04.2001<br />
25.04.2001<br />
30.04.2001<br />
03.05.2001<br />
08.05.2001<br />
11.05.2001<br />
16.05.2001<br />
21.05.2001<br />
24.05.2001<br />
30.05.2001<br />
04.06.2001<br />
07.06.2001<br />
12.06.2001<br />
15.06.2001<br />
20.06.2001<br />
25.06.2001<br />
28.06.2001<br />
Page 34
<strong>The</strong> E-<strong>Book</strong> <strong>of</strong> <strong>Technical</strong> <strong>Market</strong> <strong>Indicators</strong><br />
www.wallstreetcourier.com<br />
Short Sales Statistics<br />
<strong>The</strong> NYSE Short Interest Ratio<br />
Every short seller anticipates a declining stock market. Investors sell short stock<br />
when they anticipate its price going lower. Sooner or later they must cover their short sales<br />
by buying back the stock. A pr<strong>of</strong>it is made if the stock is bought back at a lower price than<br />
when it was sold short. <strong>Indicators</strong> based on short selling statistics are an important part <strong>of</strong><br />
technical analysis. Daily and weekly short sales are reported by the NYSE and published by<br />
financial sites all over the Internet. <strong>Market</strong> technicians watch the short selling activities <strong>of</strong> all<br />
the market participants very carefully. <strong>The</strong>y distinguish between the odd-lots and the<br />
general public, the so called crowd, and the well informed NYSE members, specialists, floor<br />
traders and corporate insiders. When a large amount <strong>of</strong> short selling activity is occurring,<br />
market participants obviously expect prices to head lower. <strong>The</strong> NYSE Short Interest Ratio is<br />
therefore a long-term contrary opinion sentiment indicator. It is calculated by dividing the<br />
monthly short interest figure released by the New York Stock Exchange by the average<br />
volume <strong>of</strong> trading per day. <strong>The</strong>se numbers get sometimes distorted by arbitrage<br />
transactions, but the short interest ratio is nevertheless a good indicator <strong>of</strong> optimism or<br />
pessimism in the market. Short sellers are potential buyers sooner or later and represent a<br />
lot <strong>of</strong> buying power when they have to scramble for cover in a sudden market turn. Contrary<br />
indicators require at least some degree <strong>of</strong> pessimism in order to function and therefore you<br />
should watch this ratio very carefully.<br />
© WallStreetCourier.com<br />
8<br />
THE NYSE SHORT INTEREST RATIO<br />
6<br />
4<br />
2<br />
Jan96<br />
Mar96<br />
May96<br />
Jul.96<br />
Sep.96<br />
Nov.96<br />
Jan97<br />
Mar97<br />
May97<br />
Jul.97<br />
Sep.97<br />
Nov.97<br />
Jan98<br />
Mar98<br />
May98<br />
Jul.98<br />
Sep.98<br />
Nov.98<br />
Jan99<br />
Mar99<br />
May99<br />
Jul.99<br />
Sep.99<br />
Nov.99<br />
Jan00<br />
Mar00<br />
May00<br />
Jul.00<br />
Sep.00<br />
Nov.00<br />
Jan01<br />
Mar 01<br />
May 01<br />
Page 35
<strong>The</strong> E-<strong>Book</strong> <strong>of</strong> <strong>Technical</strong> <strong>Market</strong> <strong>Indicators</strong><br />
www.wallstreetcourier.com<br />
Odd-Lot Short Sales Ratio<br />
<strong>The</strong> Odd-Lot Short Sales Ratio is calculated by dividing odd-lot short sales by the<br />
total number <strong>of</strong> short sales. For stocks, the generally accepted unit <strong>of</strong> trading is 100 shares<br />
(round lot). <strong>The</strong> Odd -Lot Short Ratio indicates the market sentiment <strong>of</strong> small investors who<br />
purchase less than 100 shares <strong>of</strong> a stock (odd-lot). <strong>The</strong>se market participants are usually<br />
wrong about the direction <strong>of</strong> the market and this indicator is therefore considered to be a<br />
contrary opinion sentiment indicator.<br />
© WallStreetCourier.com<br />
0,00045<br />
ODD-LOT SHORT SALES RATIO<br />
0,0004<br />
0,00035<br />
BUY<br />
0,0003<br />
0,00025<br />
0,0002<br />
0,00015<br />
SELL<br />
96-01-05<br />
96-03-01<br />
96-04-26<br />
96-06-21<br />
96-08-16<br />
96-10-11<br />
96-12-06<br />
97-01-31<br />
97-03-28<br />
97-05-23<br />
97-07-18<br />
97-09-12<br />
97-11-07<br />
98-01-02<br />
98-02-27<br />
98-04-24<br />
98-06-19<br />
98-08-14<br />
98-10-09<br />
98-12-04<br />
99-01-29<br />
99-03-26<br />
99-05-21<br />
99-07-16<br />
99-09-10<br />
99-11-05<br />
99-12-31<br />
00-02-25<br />
00-04-21<br />
00-06-16<br />
00-08-11<br />
00-10-06<br />
00-12-01<br />
01-01-26<br />
01-03-23<br />
01-05-18<br />
01-07-13<br />
Floor Traders Short Sales Ratio<br />
<strong>The</strong> Floor Traders Short Sales Ratio is computed by dividing the total floor traders<br />
short sales by total short sales. A moving average should be applied to smooth out the<br />
swings. Floor traders are normally right about the trend <strong>of</strong> the market and if they are<br />
shorting heavily the market is usually ripe for a correction. On the other hand, if they are<br />
doing relatively little shorting it is most likely that the market has hit bottom, especially if<br />
public- and odd-lot short sales increase at the same time.<br />
Page 36
<strong>The</strong> E-<strong>Book</strong> <strong>of</strong> <strong>Technical</strong> <strong>Market</strong> <strong>Indicators</strong><br />
www.wallstreetcourier.com<br />
© WallStreetCourier.com<br />
0,00165<br />
FLOOR TRADERS SHORT SALES RATIO<br />
0,00145<br />
0,00125<br />
0,00105<br />
0,00085<br />
0,00065<br />
0,00045<br />
0,00025<br />
96-01-05<br />
96-03-01<br />
96-04-26<br />
96-06-21<br />
96-08-16<br />
96-10-11<br />
96-12-06<br />
97-01-31<br />
97-03-28<br />
97-05-23<br />
97-07-18<br />
97-09-12<br />
97-11-07<br />
98-01-02<br />
98-02-27<br />
98-04-24<br />
98-06-19<br />
98-08-14<br />
98-10-09<br />
98-12-04<br />
99-01-29<br />
99-03-26<br />
99-05-21<br />
99-07-16<br />
99-09-10<br />
99-11-05<br />
99-12-31<br />
00-02-25<br />
00-04-21<br />
00-06-16<br />
00-08-11<br />
00-10-06<br />
00-12-01<br />
01-01-26<br />
01-03-23<br />
01-05-18<br />
Specialist Short Sales Ratio<br />
Specialists are responsible for balancing incoming buy and sell orders to maintain<br />
orderly markets in the stocks in which they specialize. <strong>The</strong> Specialist Short Sales Ratio is<br />
computed by dividing the total specialist short sales by total short sales. A moving average<br />
should be applied to smooth out the swings. Specialists are normally right about the trend<br />
<strong>of</strong> the market and if they are shorting heavily the market is usually ripe for a correction. On<br />
the other hand, if they are doing relatively little shorting it is most likely that the market has<br />
hit bottom, especially if public- and odd-lot short sales increase at the same time.<br />
© WallStreetCourier.com<br />
0,60<br />
SPECIALISTS SHORT SALES RATIO<br />
0,55<br />
0,50<br />
0,45<br />
0,40<br />
0,35<br />
0,30<br />
96-01-05<br />
96-03-01<br />
96-04-26<br />
96-06-21<br />
96-08-16<br />
96-10-11<br />
96-12-06<br />
97-01-31<br />
97-03-28<br />
97-05-23<br />
97-07-18<br />
97-09-12<br />
97-11-07<br />
98-01-02<br />
98-02-27<br />
98-04-24<br />
98-06-19<br />
98-08-14<br />
98-10-09<br />
98-12-04<br />
99-01-29<br />
99-03-26<br />
99-05-21<br />
99-07-16<br />
99-09-10<br />
99-11-05<br />
99-12-31<br />
00-02-25<br />
00-04-21<br />
00-06-16<br />
00-08-11<br />
00-10-06<br />
00-12-01<br />
01-01-26<br />
01-03-23<br />
01-05-18<br />
Page 37
<strong>The</strong> E-<strong>Book</strong> <strong>of</strong> <strong>Technical</strong> <strong>Market</strong> <strong>Indicators</strong><br />
www.wallstreetcourier.com<br />
NYSE Member Short Sales Ratio<br />
<strong>The</strong> NYSE Members Report is compiled by the SEC and issued about two weeks<br />
after the applicable date. This indicator is a useful tool to determine what the experts are<br />
doing. <strong>The</strong> NYSE Member Short Sales Ratio is computed by dividing the total member<br />
short sales by total short sales. A moving average should be applied to smooth out the<br />
swings. Members <strong>of</strong> the NYSE are pr<strong>of</strong>essionals and normally right about the trend <strong>of</strong> the<br />
market. If they are shorting heavily the market is usually ripe for a correction. On the other<br />
hand, if they are doing relatively little shorting it is most likely that the market has hit bottom,<br />
especially if public- and odd-lot short sales increase at the same time.<br />
© WallStreetCourier.com<br />
0,65<br />
NYSE MEMBER SHORT SALES RATIO<br />
0,6<br />
0,55<br />
0,5<br />
0,45<br />
96-01-05<br />
96-03-01<br />
96-04-26<br />
96-06-21<br />
96-08-16<br />
96-10-11<br />
96-12-06<br />
97-01-31<br />
97-03-28<br />
97-05-23<br />
97-07-18<br />
97-09-12<br />
97-11-07<br />
98-01-02<br />
98-02-27<br />
98-04-24<br />
98-06-19<br />
98-08-14<br />
98-10-09<br />
98-12-04<br />
99-01-29<br />
99-03-26<br />
99-05-21<br />
99-07-16<br />
99-09-10<br />
99-11-05<br />
99-12-31<br />
00-02-25<br />
00-04-21<br />
00-06-16<br />
00-08-11<br />
00-10-06<br />
00-12-01<br />
01-01-26<br />
01-03-23<br />
01-05-18<br />
Public Short Sales Ratio<br />
<strong>The</strong> NYSE Members Report is compiled by the SEC and issued about two weeks<br />
after the applicable date. This indicator is a useful tool to determine what the public or the<br />
so called crowd is doing. <strong>The</strong> Public Short Sales Ratio is computed by dividing the total<br />
public short sales by total short sales. A moving average should be applied to smooth out<br />
the swings. <strong>The</strong> public is usually wrong about the trend <strong>of</strong> the market. If they are shorting<br />
heavily the market is usually ripe for an upturn. On the other hand, if they are doing<br />
relatively little shorting it is most likely that the market is near a correction, especially if<br />
specialists short sales increase at the same time.<br />
Page 38
<strong>The</strong> E-<strong>Book</strong> <strong>of</strong> <strong>Technical</strong> <strong>Market</strong> <strong>Indicators</strong><br />
www.wallstreetcourier.com<br />
©<br />
0,55<br />
PUBLIC SHORT SALES RATIO<br />
0,5<br />
0,45<br />
0,4<br />
0,35<br />
96-01-05<br />
96-03-01<br />
96-04-26<br />
96-06-21<br />
96-08-16<br />
96-10-11<br />
96-12-06<br />
97-01-31<br />
97-03-28<br />
97-05-23<br />
97-07-18<br />
97-09-12<br />
97-11-07<br />
98-01-02<br />
98-02-27<br />
98-04-24<br />
98-06-19<br />
98-08-14<br />
98-10-09<br />
98-12-04<br />
99-01-29<br />
99-03-26<br />
99-05-21<br />
99-07-16<br />
99-09-10<br />
99-11-05<br />
99-12-31<br />
00-02-25<br />
00-04-21<br />
00-06-16<br />
00-08-11<br />
00-10-06<br />
00-12-01<br />
01-01-26<br />
01-03-23<br />
01-05-18<br />
Odd-Lot Balance Index<br />
This index is calculated by dividing daily or weekly odd-lot purchases by odd-lot<br />
sales. For stocks, the generally accepted unit <strong>of</strong> trading is 100 shares (round lot). <strong>The</strong> Odd -<br />
Lot Balance Index indicates the market sentiment <strong>of</strong> small investors who purchase less than<br />
100 shares <strong>of</strong> a stock (odd-lot). <strong>The</strong>se market participants are usually wrong about the<br />
direction <strong>of</strong> the market and this indicator is therefore considered to be a contrary opinion<br />
sentiment indicator.<br />
© WallStreetCourier.com<br />
1,80<br />
1,60<br />
1,40<br />
ODD-LOT BALANCE INDEX DAILY<br />
SELL<br />
10-DAY MOVING AVERAGE<br />
1,20<br />
1,00<br />
BUY<br />
0,80<br />
31.10.2000<br />
07.11.2000<br />
14.11.2000<br />
21.11.2000<br />
29.11.2000<br />
06.12.2000<br />
13.12.2000<br />
20.12.2000<br />
28.12.2000<br />
05.01.2001<br />
12.01.2001<br />
22.01.2001<br />
29.01.2001<br />
05.02.2001<br />
12.02.2001<br />
20.02.2001<br />
27.02.2001<br />
06.03.2001<br />
13.03.2001<br />
20.03.2001<br />
27.03.2001<br />
03.04.2001<br />
10.04.2001<br />
18.04.2001<br />
25.04.2001<br />
02.05.2001<br />
09.05.2001<br />
16.05.2001<br />
23.05.2001<br />
31.05.2001<br />
07.06.2001<br />
14.06.2001<br />
21.06.2001<br />
28.06.2001<br />
06.07.2001<br />
13.07.2001<br />
20.07.2001<br />
27.07.2001<br />
03.08.2001<br />
10.08.2001<br />
17.08.2001<br />
Page 39
<strong>The</strong> E-<strong>Book</strong> <strong>of</strong> <strong>Technical</strong> <strong>Market</strong> <strong>Indicators</strong><br />
www.wallstreetcourier.com<br />
Odd-Lot/Floor Trader Short Sales Ratio<br />
This index is calculated by dividing the weekly odd-lot short sales by the weekly short<br />
sales by floor traders for better comparison. Introduced by Wall Street Courier, the Odd -Lot<br />
Short/Floor Trader Short Ratio indicates the market sentiment <strong>of</strong> small investors who<br />
purchase less than 100 shares <strong>of</strong> a stock (odd-lot). Unlike the more sophisticated floor<br />
traders, the odd-lotters are usually wrong about the direction <strong>of</strong> the market and this indicator<br />
is therefore considered to be a contrary opinion sentiment indicator.<br />
© WallStreetCourier.com<br />
0,95<br />
ODD-LOT /FLOOR TRADERS SHORT SALES RATIO<br />
0,90<br />
0,85<br />
BUY<br />
0,80<br />
0,75<br />
0,70<br />
0,65<br />
0,60<br />
SELL<br />
96-01-05<br />
96-03-01<br />
96-04-26<br />
96-06-21<br />
96-08-16<br />
96-10-11<br />
96-12-06<br />
97-01-31<br />
97-03-28<br />
97-05-23<br />
97-07-18<br />
97-09-12<br />
97-11-07<br />
98-01-02<br />
98-02-27<br />
98-04-24<br />
98-06-19<br />
98-08-14<br />
98-10-09<br />
98-12-04<br />
99-01-29<br />
99-03-26<br />
99-05-21<br />
99-07-16<br />
99-09-10<br />
99-11-05<br />
99-12-31<br />
00-02-25<br />
00-04-21<br />
00-06-16<br />
00-08-11<br />
00-10-06<br />
00-12-01<br />
01-01-26<br />
01-03-23<br />
01-05-18<br />
Global Futures Odd-Lot/Specialist Short Sales Ratio<br />
This index is calculated by dividing the weekly odd-lot short sales by the weekly<br />
specialists short sales for better comparison. A 4-week moving average is applied to<br />
smooth out the swings. Unlike the well informed specialists, the odd-lotters are usually<br />
wrong about the direction <strong>of</strong> the market and this indicator is therefore considered to be a<br />
contrary opinion sentiment indicator. High readings indicate heavy shorting by odd-lot<br />
investors and therefore bottoms, extremely low readings tops.<br />
Page 40
<strong>The</strong> E-<strong>Book</strong> <strong>of</strong> <strong>Technical</strong> <strong>Market</strong> <strong>Indicators</strong><br />
www.wallstreetcourier.com<br />
© WallStreetCourier.com<br />
ODD-LOT/SPECIALISTS SHORT SALES RATIO<br />
0,0145<br />
0,0115<br />
BULLISH<br />
0,0085<br />
0,0055<br />
BEARISH<br />
0,0025<br />
96-01-05<br />
96-03-01<br />
96-04-26<br />
96-06-21<br />
96-08-16<br />
96-10-11<br />
96-12-06<br />
97-01-31<br />
97-03-28<br />
97-05-23<br />
97-07-18<br />
97-09-12<br />
97-11-07<br />
98-01-02<br />
98-02-27<br />
98-04-24<br />
98-06-19<br />
98-08-14<br />
98-10-09<br />
98-12-04<br />
99-01-29<br />
99-03-26<br />
99-05-21<br />
99-07-16<br />
99-09-10<br />
99-11-05<br />
99-12-31<br />
00-02-25<br />
00-04-21<br />
00-06-16<br />
00-08-11<br />
00-10-06<br />
00-12-01<br />
01-01-26<br />
01-03-23<br />
01-05-18<br />
Global Futures Public/Member Short Sales Ratio<br />
This index is calculated by dividing the weekly public short sales by the weekly<br />
member short sales for better comparison. A 4-week moving average is applied to smooth<br />
out the swings. Members <strong>of</strong> the NYSE are pr<strong>of</strong>essionals and normally right about the trend<br />
<strong>of</strong> the market. If they are doing relatively little shorting it is most likely that the market has hit<br />
bottom, especially if public short sales increase at the same time. High readings indicate<br />
heavy shorting by the public (the so called crowd) and therefore bottoms, low readings<br />
indicate tops.<br />
© WallStreetCourier.com<br />
1,20<br />
PUBLIC/MEMBER SHORT SALES RATIO<br />
1,00<br />
BULLISH<br />
0,80<br />
0,60<br />
BEARISH<br />
96-01-05<br />
96-03-01<br />
96-04-26<br />
96-06-21<br />
96-08-16<br />
96-10-11<br />
96-12-06<br />
97-01-31<br />
97-03-28<br />
97-05-23<br />
97-07-18<br />
97-09-12<br />
97-11-07<br />
98-01-02<br />
98-02-27<br />
98-04-24<br />
98-06-19<br />
98-08-14<br />
98-10-09<br />
98-12-04<br />
99-01-29<br />
99-03-26<br />
99-05-21<br />
99-07-16<br />
99-09-10<br />
99-11-05<br />
99-12-31<br />
00-02-25<br />
00-04-21<br />
00-06-16<br />
00-08-11<br />
00-10-06<br />
00-12-01<br />
01-01-26<br />
01-03-23<br />
01-05-18<br />
Page 41
<strong>The</strong> E-<strong>Book</strong> <strong>of</strong> <strong>Technical</strong> <strong>Market</strong> <strong>Indicators</strong><br />
www.wallstreetcourier.com<br />
Public/Specialists Short Sales Ratio<br />
<strong>The</strong> Specialist/Public Short Sales Ratio is a market sentiment indicator. It is<br />
calculated by dividing the volume <strong>of</strong> the weekly short sales made by the public (non<br />
members) by the weekly short sales made by stock exchange specialists (members). A 4-<br />
week moving average is applied to smooth out the swings. <strong>The</strong> public is usually wrong<br />
about the trend <strong>of</strong> the market. If they are shorting heavily the market is usually ripe for an<br />
upturn. On the other hand, if they are doing relatively little shorting it is most likely that the<br />
market is near a correction, especially if specialists short sales increase at the same time.<br />
High readings indicate heavy shorting by the public (the so called crowd) and therefore<br />
bottoms, low readings indicate tops.<br />
© WallStreetCourier.com<br />
1,90<br />
PUBLIC/SPECIALISTS SHORT SALES RATIO<br />
1,50<br />
BULLISH<br />
1,10<br />
0,70<br />
BEARISH<br />
96-01-05<br />
96-03-01<br />
96-04-26<br />
96-06-21<br />
96-08-16<br />
96-10-11<br />
96-12-06<br />
97-01-31<br />
97-03-28<br />
97-05-23<br />
97-07-18<br />
97-09-12<br />
97-11-07<br />
98-01-02<br />
98-02-27<br />
98-04-24<br />
98-06-19<br />
98-08-14<br />
98-10-09<br />
98-12-04<br />
99-01-29<br />
99-03-26<br />
99-05-21<br />
99-07-16<br />
99-09-10<br />
99-11-05<br />
99-12-31<br />
00-02-25<br />
00-04-21<br />
00-06-16<br />
00-08-11<br />
00-10-06<br />
00-12-01<br />
01-01-26<br />
01-03-23<br />
01-05-18<br />
Page 42
<strong>The</strong> E-<strong>Book</strong> <strong>of</strong> <strong>Technical</strong> <strong>Market</strong> <strong>Indicators</strong><br />
www.wallstreetcourier.com<br />
Global Futures NYSE Member Trading Indicator<br />
<strong>The</strong> NYSE Members Report is compiled by the SEC and issued about two weeks<br />
after the applicable date. This indicator is a useful tool to determine what the experts are<br />
doing. If specialists, floor traders and other members <strong>of</strong> the New York Stock Exchange are<br />
shorting heavily the market is usually ripe for a correction. On the other hand, if they are<br />
doing relatively little shorting it is most likely that the market has hit bottom, especially if<br />
public- and odd-lot short sales increase at the same time. Even if data are not quite up-to<br />
date, they are nevertheless an excellent indicator <strong>of</strong> the prevailing sentiment in the market.<br />
<strong>The</strong> formula <strong>of</strong> the Global Futures NYSE Member Trading Indicator is proprietary and we<br />
also use special moving averages to push the tops and bottoms forward an extra two weeks<br />
or so.<br />
© WallStreetCourier.com<br />
0,07<br />
0,05<br />
0,03<br />
THE NYSE MEMBER TRADING INDICATOR<br />
BEARISH<br />
0,01<br />
-0,01<br />
-0,03<br />
-0,05<br />
-0,07<br />
BULLISH<br />
-0,09<br />
96-01-05<br />
96-03-01<br />
96-04-26<br />
96-06-21<br />
96-08-16<br />
96-10-11<br />
96-12-06<br />
97-01-31<br />
97-03-28<br />
97-05-23<br />
97-07-18<br />
97-09-12<br />
97-11-07<br />
98-01-02<br />
98-02-27<br />
98-04-24<br />
98-06-19<br />
98-08-14<br />
98-10-09<br />
98-12-04<br />
99-01-29<br />
99-03-26<br />
99-05-21<br />
99-07-16<br />
99-09-10<br />
99-11-05<br />
99-12-31<br />
00-02-25<br />
00-04-21<br />
00-06-16<br />
00-08-11<br />
00-10-06<br />
00-12-01<br />
01-01-26<br />
01-03-23<br />
01-05-18<br />
Page 43
<strong>The</strong> E-<strong>Book</strong> <strong>of</strong> <strong>Technical</strong> <strong>Market</strong> <strong>Indicators</strong><br />
www.wallstreetcourier.com<br />
Sentiment <strong>Indicators</strong><br />
Investor Sentiment<br />
<strong>The</strong> principles <strong>of</strong> Contrarian Investing hold that when the vast majority <strong>of</strong> people<br />
agree on anything, they are generally wrong. Otherwise no market would function because<br />
there is simply no minority with money enough to make a majority rich. A true contrarian,<br />
therefore, will first try to determine what the majority are doing and then will act in the<br />
opposite direction. <strong>Market</strong> Vane, AAII and Investors Intelligence are all contrary opinion<br />
indicators.<br />
A unique feature <strong>of</strong> <strong>Market</strong> Vane's Bullish Consensus numbers is a weighting<br />
formula applied to the various market letters. More weight is given to letters with a larger<br />
following and less weight to those with fewer readers. Each week a poll <strong>of</strong> market letters is<br />
taken to determine the degree <strong>of</strong> bullishness or bearishness among futures pr<strong>of</strong>essionals.<br />
<strong>The</strong> theory is that when a significant number <strong>of</strong> participants are bullish, they are already<br />
positioned on the long side and there is little potential buying power left. If most participants<br />
are bearish, selling pressure has reached an extreme and prices will reverse to the upside.<br />
© WallStreetCourier.com<br />
80<br />
BULL/BEAR RATIO MARKET VANE<br />
10-WEEK MOVING AVERAGE<br />
SELL<br />
60<br />
40<br />
BUY<br />
20<br />
96-01-05<br />
96-03-01<br />
96-04-26<br />
96-06-21<br />
96-08-16<br />
96-10-11<br />
96-12-06<br />
97-01-31<br />
97-03-28<br />
97-05-23<br />
97-07-18<br />
97-09-12<br />
97-11-07<br />
98-01-02<br />
98-02-27<br />
98-04-24<br />
98-06-19<br />
98-08-14<br />
98-10-09<br />
98-12-04<br />
99-01-29<br />
99-03-26<br />
99-05-21<br />
99-07-16<br />
99-09-10<br />
99-11-05<br />
99-12-31<br />
00-02-25<br />
00-04-21<br />
00-06-16<br />
00-08-11<br />
00-10-06<br />
00-12-01<br />
01-01-26<br />
01-03-23<br />
01-05-18<br />
01-07-13<br />
Thanks to the Internet, the American Association <strong>of</strong> Individual Investors (AAII)<br />
now polls its 170,000 members daily. Respondents indicate how they feel about the<br />
Page 44
<strong>The</strong> E-<strong>Book</strong> <strong>of</strong> <strong>Technical</strong> <strong>Market</strong> <strong>Indicators</strong><br />
www.wallstreetcourier.com<br />
market's performance in the next six months. <strong>The</strong> chart below shows the number <strong>of</strong> bulls<br />
divided by the number <strong>of</strong> bears. A 10-week moving average is applied to smooth out the<br />
swings. High readings appear near market tops and low readings near bottoms.<br />
© WallStreetCourier.com<br />
4,10<br />
3,60<br />
SELL<br />
BULL/BEAR RATIO AAII<br />
10-WEEK MOVING AVERAGE<br />
3,10<br />
2,60<br />
2,10<br />
1,60<br />
1,10<br />
BUY<br />
0,60<br />
96-01-05<br />
96-03-01<br />
96-04-26<br />
96-06-21<br />
96-08-16<br />
96-10-11<br />
96-12-06<br />
97-01-31<br />
97-03-28<br />
97-05-23<br />
97-07-18<br />
97-09-12<br />
97-11-07<br />
98-01-02<br />
98-02-27<br />
98-04-24<br />
98-06-19<br />
98-08-14<br />
98-10-09<br />
98-12-04<br />
99-01-29<br />
99-03-26<br />
99-05-21<br />
99-07-16<br />
99-09-10<br />
99-11-05<br />
99-12-31<br />
00-02-25<br />
00-04-21<br />
00-06-16<br />
00-08-11<br />
00-10-06<br />
00-12-01<br />
01-01-26<br />
01-03-23<br />
01-05-18<br />
Since 1963, Investors Intelligence has been compiling data on the opinions <strong>of</strong><br />
publishers <strong>of</strong> market letters. <strong>The</strong>y conduct a weekly poll <strong>of</strong> about 130 market newsletter<br />
writers and calculate the percentage who are bullish, bearish or expecting a short-term<br />
correction. <strong>The</strong> resulting index shows that the advisory services follow the trend <strong>of</strong> equity<br />
prices by becoming most bullish near market tops and most bearish around market<br />
bottoms.<br />
© WallStreetCourier.com<br />
2,40<br />
BULL/BEAR RATIO INVESTORS INTELLIGENCE<br />
10-WEEK MOVING AVERAGE<br />
2,00<br />
SELL<br />
1,60<br />
1,20<br />
BUY<br />
0,80<br />
96-01-05<br />
96-03-01<br />
96-04-26<br />
96-06-21<br />
96-08-16<br />
96-10-11<br />
96-12-06<br />
97-01-31<br />
97-03-28<br />
97-05-23<br />
97-07-18<br />
97-09-12<br />
97-11-07<br />
98-01-02<br />
98-02-27<br />
98-04-24<br />
98-06-19<br />
98-08-14<br />
98-10-09<br />
98-12-04<br />
99-01-29<br />
99-03-26<br />
99-05-21<br />
99-07-16<br />
99-09-10<br />
99-11-05<br />
99-12-31<br />
00-02-25<br />
00-04-21<br />
00-06-16<br />
00-08-11<br />
00-10-06<br />
00-12-01<br />
01-01-26<br />
01-03-23<br />
01-05-18<br />
Page 45
<strong>The</strong> E-<strong>Book</strong> <strong>of</strong> <strong>Technical</strong> <strong>Market</strong> <strong>Indicators</strong><br />
www.wallstreetcourier.com<br />
Commitments <strong>of</strong> Traders Report<br />
<strong>The</strong> Commodity Futures Trading Commission (CFTC) provides inside information<br />
about purchases and sales <strong>of</strong> futures contracts. <strong>The</strong> largest players in each market are<br />
required to disclose their positions to the CFTC on a daily basis and this report is released<br />
weekly on Friday afternoon (the reporting requirement varies by commodity). <strong>The</strong>se traders<br />
are separated into Commercial Hedgers and Large Speculators.<br />
<strong>The</strong> positions <strong>of</strong> Small Traders are calculated by subtracting the total <strong>of</strong> contracts<br />
held by the reporting groups from all the contracts outstanding (Small Traders are not<br />
required to report their positions). Commercial Hedgers hold a significant informational edge<br />
over other traders as far as fundamental supply-and-demand statistics are concerned. <strong>The</strong>y<br />
tend to be early, but they are usually right on the long run, quite contrary to the small<br />
traders. Extreme divergences in long and short positions <strong>of</strong> Small Traders, Large<br />
Speculators and Commercial Hedgers have proven to be reliable indicators <strong>of</strong> important<br />
trend changes. In such cases it is not advisable to bet against the Commercial Hedgers. All<br />
other patterns are meaningless. <strong>The</strong> following charts show you the positions <strong>of</strong> these three<br />
groups <strong>of</strong> market participants. A 10-week moving average is applied to smooth out the<br />
swings.<br />
Three different charts are available for each commodity:<br />
• Short positions <strong>of</strong> all market participants (Large Speculators, Commercial Hedgers,<br />
Small Traders) on a percentage basis.<br />
• Short positions <strong>of</strong> Small Traders only. Significant changes in those numbers give you<br />
an insight about prevailing sentiment..<br />
• <strong>The</strong> Long/Short Ratio <strong>of</strong> Small Traders. This chart is computed by dividing the long<br />
and short positions <strong>of</strong> Small Traders. High readings indicate heavy buying by Small<br />
Traders which is bearish.<br />
Page 46
<strong>The</strong> E-<strong>Book</strong> <strong>of</strong> <strong>Technical</strong> <strong>Market</strong> <strong>Indicators</strong><br />
www.wallstreetcourier.com<br />
© WallStreetCourier.com<br />
0,70<br />
0,60<br />
0,50<br />
SOYBEANS - SHORT POSITIONS<br />
10-WEEK MOVING AVERAGE<br />
COMMERCIAL HEDGER<br />
0,40<br />
0,30<br />
0,20<br />
SMALL TRADER<br />
0,10<br />
LARGE SPECULATOR<br />
0,00<br />
96-11-26<br />
97-01-21<br />
97-03-18<br />
97-05-13<br />
97-07-08<br />
97-09-02<br />
97-10-28<br />
97-12-23<br />
98-02-17<br />
98-04-14<br />
98-06-09<br />
98-08-04<br />
98-09-29<br />
98-11-24<br />
99-01-19<br />
99-03-16<br />
99-05-11<br />
99-07-06<br />
99-08-31<br />
99-10-26<br />
99-12-21<br />
00-02-15<br />
00-04-11<br />
00-06-06<br />
00-08-01<br />
00-09-26<br />
00-11-21<br />
01-01-16<br />
01-03-13<br />
01-05-08<br />
01-07-03<br />
© WallStreetCourier.com<br />
0,40<br />
SOYBEANS - SMALL TRADERS SHORT POSITION<br />
0,35<br />
BUY<br />
0,30<br />
0,25<br />
0,20<br />
SELL<br />
0,15<br />
96-01-02<br />
96-02-27<br />
96-04-23<br />
96-06-18<br />
96-08-13<br />
96-10-08<br />
96-12-03<br />
97-01-28<br />
97-03-25<br />
97-05-20<br />
97-07-15<br />
97-09-09<br />
97-11-04<br />
97-12-30<br />
98-02-24<br />
98-04-21<br />
98-06-16<br />
98-08-11<br />
98-10-06<br />
98-12-01<br />
99-01-26<br />
99-03-23<br />
99-05-18<br />
99-07-13<br />
99-09-07<br />
99-11-02<br />
99-12-28<br />
00-02-22<br />
00-04-18<br />
00-06-13<br />
00-08-08<br />
00-10-03<br />
00-11-28<br />
01-01-23<br />
01-03-20<br />
01-05-15<br />
01-07-10<br />
© WallStreetCourier.com<br />
2,00<br />
SOYBEANS - SMALL TRADERS LONG/SHORT RATIO<br />
1,80<br />
1,60<br />
SELL<br />
1,40<br />
1,20<br />
1,00<br />
0,80<br />
BUY<br />
0,60<br />
96-01-02<br />
96-02-27<br />
96-04-23<br />
96-06-18<br />
96-08-13<br />
96-10-08<br />
96-12-03<br />
97-01-28<br />
97-03-25<br />
97-05-20<br />
97-07-15<br />
97-09-09<br />
97-11-04<br />
97-12-30<br />
98-02-24<br />
98-04-21<br />
98-06-16<br />
98-08-11<br />
98-10-06<br />
98-12-01<br />
99-01-26<br />
99-03-23<br />
99-05-18<br />
99-07-13<br />
99-09-07<br />
99-11-02<br />
99-12-28<br />
00-02-22<br />
00-04-18<br />
00-06-13<br />
00-08-08<br />
00-10-03<br />
00-11-28<br />
01-01-23<br />
01-03-20<br />
01-05-15<br />
01-07-10<br />
Page 47
<strong>The</strong> E-<strong>Book</strong> <strong>of</strong> <strong>Technical</strong> <strong>Market</strong> <strong>Indicators</strong><br />
www.wallstreetcourier.com<br />
Appendix<br />
<strong>The</strong> enclosed charts <strong>of</strong> the indices have exactly the same time span as the charts in<br />
our e-book. You will therefore easily be able you to verify the reliability <strong>of</strong> each indicator.<br />
Dow Jones Weekly Close<br />
© WallStreetCourier.com<br />
12000<br />
DOW JONES WEEKLY CLOSE<br />
11000<br />
10000<br />
9000<br />
8000<br />
7000<br />
6000<br />
5000<br />
96-01-05<br />
96-03-01<br />
96-04-26<br />
96-06-21<br />
96-08-16<br />
96-10-11<br />
96-12-06<br />
97-01-31<br />
97-03-28<br />
97-05-23<br />
97-07-18<br />
97-09-12<br />
97-11-07<br />
98-01-02<br />
98-02-27<br />
98-04-24<br />
98-06-19<br />
98-08-14<br />
98-10-09<br />
98-12-04<br />
99-01-29<br />
99-03-26<br />
99-05-21<br />
99-07-16<br />
99-09-10<br />
99-11-05<br />
99-12-31<br />
00-02-25<br />
00-04-21<br />
00-06-16<br />
00-08-11<br />
00-10-06<br />
00-12-01<br />
01-01-26<br />
01-03-23<br />
01-05-18<br />
S&P 500 Weekly Close<br />
© WallStreetCourier.com<br />
1600<br />
S & P 500 WEEKLY CLOSE<br />
1400<br />
1200<br />
1000<br />
800<br />
600<br />
96-01-05<br />
96-03-01<br />
96-04-26<br />
96-06-21<br />
96-08-16<br />
96-10-11<br />
96-12-06<br />
97-01-31<br />
97-03-28<br />
97-05-23<br />
97-07-18<br />
97-09-12<br />
97-11-07<br />
98-01-02<br />
98-02-27<br />
98-04-24<br />
98-06-19<br />
98-08-14<br />
98-10-09<br />
98-12-04<br />
99-01-29<br />
99-03-26<br />
99-05-21<br />
99-07-16<br />
99-09-10<br />
99-11-05<br />
99-12-31<br />
00-02-25<br />
00-04-21<br />
00-06-16<br />
00-08-11<br />
00-10-06<br />
00-12-01<br />
01-01-26<br />
01-03-23<br />
01-05-18<br />
Page 48
<strong>The</strong> E-<strong>Book</strong> <strong>of</strong> <strong>Technical</strong> <strong>Market</strong> <strong>Indicators</strong><br />
www.wallstreetcourier.com<br />
Risk Statement<br />
HYPOTHETICAL PERFORMANCE RESULTS HAVE MANY INHERENT LIMITATIONS,<br />
SOME OF WHICH ARE DESCRIBED BELOW. NO REPRESENTATION IS BEING MADE<br />
THAT ANY ACCOUNT WILL OR IS LIKELY TO ACHIEVE PROFITS OR LOSSES<br />
SIMILAR TO THOSE SHOWN. IN FACT, THERE ARE FREQUENTLY SHARP<br />
DIFFERENCES BETWEEN HYPOTHETICAL PERFORMANCE RESULTS AND THE<br />
ACTUAL RESULTS SUBSEQUENTLY ACHIEVED BY ANY PARTICULAR TRADING<br />
PROGRAM. ONE OF THE LIMITATIONS OF HYPOTHETICAL PERFORMANCE<br />
RESULTS IS THAT THEY ARE GENERALLY PREPARED WITH THE BENEFIT OF<br />
HINDSIGHT. IN ADDITION, HYPOTHETICAL TRADING DOES NOT INVOLVE<br />
FINANCIAL RISK, AND NO HYPOTHETICAL TRADING RECORD CAN COMPLETELY<br />
ACCOUNT FOR THE IMPACT OF FINANCIAL RISK IN ACTUAL TRADING. FOR<br />
EXAMPLE, THE ABILITY TO WITHSTAND LOSSES OR TO ADHERE TO A PARTICULAR<br />
TRADING PROGRAM IN SPITE OF TRADING LOSSES ARE MATERIAL POINTS WHICH<br />
CAN ALSO ADVERSELY AFFECT ACTUAL TRADING RESULTS. THERE ARE<br />
NUMEROUS OTHER FACTORS RELATED TO THE MARKETS IN GENERAL OR TO<br />
THE IMPLEMENTATION OF ANY SPECIFIC TRADING PROGRAM WHICH CANNOT BE<br />
FULLY ACCOUNTED FOR IN THE PREPARATION OF HYPOTHETICAL<br />
PERFORMANCE RESULTS AND ALL OF WHICH CAN ADVERSELY AFFECT ACTUAL<br />
TRADING RESULTS.” TRADING IN COMMODITY FUTURES OR OPTIONS INVOLVES<br />
SUBSTANTIAL RISK OF LOSS.<br />
THIS RISK STATEMENT APPLIES TO ANY ILLUSTRATION OF PROFIT AND<br />
LOSS CONTAINED WITHIN THIS PUBLICATION. IT SHOULD ALSO BE NOTED THAT<br />
STOP LOSS ORDERS DO NOT NECESSARILY LIMIT LOSSES OR LOCK IN PROFITS.<br />
DEPENDING UPON MARKET CONDITIONS, STOP LOSS ORDERS MAY BE<br />
EXECUTED AT PRICES SUBSTANTIALLY BELOW OR ABOVE THE SPECIFIED STOP<br />
PRICE.<br />
Page 49