Calculating Carbon Emission Effect of Waste Management Activities
Calculating Carbon Emission Effect of Waste Management Activities
Calculating Carbon Emission Effect of Waste Management Activities
Create successful ePaper yourself
Turn your PDF publications into a flip-book with our unique Google optimized e-Paper software.
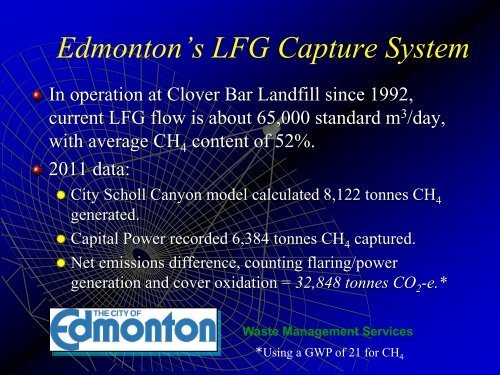
Edmonton’s LFG Capture System<br />
In operation at Clover Bar Landfill since 1992,<br />
current LFG flow is about 65,000 standard m 3 /day,<br />
with average CH 4 content <strong>of</strong> 52%.<br />
2011 data:<br />
City Scholl Canyon model calculated 8,122 tonnes CH 4<br />
generated.<br />
Capital Power recorded 6,384 tonnes CH 4 captured.<br />
Net emissions difference, counting flaring/power<br />
generation and cover oxidation = 32,848 tonnes CO 2 -e.*<br />
<strong>Waste</strong> <strong>Management</strong> Services<br />
*Using a GWP <strong>of</strong> 21 for CH 4


