Bert Scheeren and Peter Bergamaschi - Europa
Bert Scheeren and Peter Bergamaschi - Europa
Bert Scheeren and Peter Bergamaschi - Europa

You also want an ePaper? Increase the reach of your titles
YUMPU automatically turns print PDFs into web optimized ePapers that Google loves.
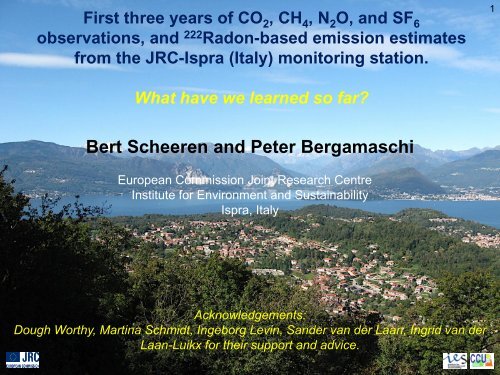
First three years of CO 2 , CH 4 , N 2 O, <strong>and</strong> SF 6<br />
observations, <strong>and</strong> 222 Radon-based emission estimates<br />
from the JRC-Ispra (Italy) monitoring station.<br />
1<br />
What have we learned so far<br />
<strong>Bert</strong> <strong>Scheeren</strong> <strong>and</strong> <strong>Peter</strong> <strong>Bergamaschi</strong><br />
European Commission Joint Research Centre<br />
Institute for Environment <strong>and</strong> Sustainability<br />
Ispra, Italy<br />
Acknowledgements:<br />
Dough Worthy, Martina Schmidt, Ingeborg Levin, S<strong>and</strong>er van der Laan, Ingrid van der<br />
Laan-Luikx for their support <strong>and</strong> advice.
2<br />
Outline<br />
• Site description<br />
• Time series<br />
• 222 Radon based flux estimates<br />
• Case studies<br />
• TM5 model simulations of CH 4<br />
• Link to monitoring networks<br />
• Summary
Why is the JRC involved in monitoring GHGs <br />
3<br />
To be an active member of the European GHG monitoring community;<br />
* contributing to the sparse GHG monitoring network in Southern Europe,<br />
* having access to important databases for our inverse modeling activities.<br />
To support regional scale emission estimates;<br />
* providing direct input for inverse modeling,<br />
* to allow model independent emission estimates based on 222 Radon.<br />
Jungfraujoch<br />
3580 m<br />
Plateau Rosa<br />
3480 m<br />
JRC-Ispra<br />
220 m<br />
Po Valley<br />
Monte Cimone<br />
2165 m
The Ispra GHG monitoring site since 2007 (223 m asl)<br />
4<br />
15 m sampling mast<br />
Agilent 6890N GC-FID/μ-ECD for CO 2 , CH 4 , N 2 O, SF 6<br />
PICARRO G1301 for CO 2 <strong>and</strong> CH 4<br />
ANSTO 222 Radon monitor<br />
Horiba AMPA-370 for CO
The Ispra GHG station set-up <strong>and</strong> performance<br />
5<br />
Agilent 6890N GC-system equipped with FID/ECD for CO 2 , CH 4 , N 2 O <strong>and</strong> SF 6<br />
• Measurement sequence GC-system: WH – WL – AM1 – AM2 – AM3 – AM4 – WH – WL<br />
<strong>and</strong> every 6 hrs 2 ambient samples are replaced by a Target sample.<br />
• Typical instrument precisions are in good agreement with WMO precision requirements based<br />
on the targets for one month of sampling:<br />
GC:
6<br />
Ispra GHG station data coverage<br />
Ispra data coverage<br />
2007 2008 2009 2010 2011<br />
Instrument Species 10 11 12 1 2 3 4 5 6 7 8 9 10 11 12 1 2 3 4 5 6 7 8 9 10 11 12 1 2 3 4 5 6 7 8 9 10 11 12 1 2 3 4<br />
Agilent 6890N GC-FID CO2<br />
Agilent 6890N GC-FID CH4<br />
Agilent 6890N GC-ECD N2O<br />
Agilent 6890N GC-ECD SF6<br />
ANSTO 222Radon monitor 222Rn<br />
PICARRO G1301<br />
PICARRO G1302<br />
HORIBA AMPA 370A<br />
CO2<br />
CH4<br />
CO
Regional GHG monitoring stations around the Po Valley<br />
7<br />
Jungfraujoch<br />
3580 m<br />
Plateau Rosa<br />
3480 m<br />
JRC-Ispra<br />
220 m<br />
Po Valley<br />
Monte Cimone<br />
2165 m
Po Valley pollution hot-spot: strong anthropogenic methane emissions from<br />
agriculture by the EDGAR emission database<br />
8<br />
Anthropogenic methane emissions on a 0.1 x 0.1 degree grid from the EDGAR v4 database<br />
for the year 2005 (http://edgar.jrc.ec.europa.eu/) show the Po Valley (dark blue) as a strong<br />
regional source area, mainly related to emissios from the agricultural sector.
Catchment area for methane emissions calculated by the TM5 model 9<br />
Footprint for methane for the Ispra station expressed as the sensitivity of<br />
the measurements to methane emissions in ppbv CH 4 / kg CH 4 / s<br />
calculated by the TM5 (4DVAR) model for the year 2008 (<strong>Bergamaschi</strong> et<br />
al., 2010).
Meteorological conditions <strong>and</strong> air mass origin at Ispra<br />
10<br />
We distinguish three major meteorological<br />
conditions:<br />
Northerlies:<br />
• Clean, e.g. Föhn events, to moderately polluted<br />
air masses.<br />
• 12 h footprint up to several hundred km at Föhn.<br />
• Dominating during the fall <strong>and</strong> winter season.<br />
Stagnant conditions:<br />
• Very low wind speeds (
Highest GHG concentrations are found during southerly “Po Valley”<br />
winds <strong>and</strong> at low wind speed conditions<br />
11<br />
600<br />
550<br />
CO2<br />
CH4<br />
Ispra CO2 <strong>and</strong> CH4 as function of wind direction for 2008<br />
Wind direction<br />
2700<br />
2500<br />
2300<br />
600<br />
550<br />
Ispra CO2 <strong>and</strong> CH4 as function of wind speed for 2008<br />
Wind speed<br />
CO2<br />
CH4<br />
2700<br />
2500<br />
2300<br />
500<br />
450<br />
500<br />
2100<br />
CH 4 CH 4<br />
1900<br />
450<br />
2100<br />
1900<br />
400<br />
350<br />
1700<br />
CO 2<br />
400<br />
1500<br />
CO 2<br />
1300<br />
0 45 90 135 180 225 270 315 360<br />
350<br />
0.0 1.0 2.0 3.0 4.0 5.0 6.0 7.0 8.0<br />
North South North Low High<br />
1700<br />
1500<br />
1300<br />
360<br />
355<br />
350<br />
345<br />
340<br />
335<br />
330<br />
325<br />
320<br />
315<br />
310<br />
N2O<br />
SF6<br />
Ispra N2O <strong>and</strong> SF6 as function of wind direction for 2008<br />
Wind direction<br />
N 2 O<br />
5<br />
0 45 90 135 180 225 270 315 360<br />
North South North<br />
19<br />
17<br />
15<br />
13<br />
11<br />
9<br />
7<br />
360<br />
355<br />
350<br />
345<br />
340<br />
335<br />
330<br />
325<br />
320<br />
315<br />
310<br />
Ispra N2O <strong>and</strong> SF6 as function of wind speed for 2008<br />
N2O<br />
5<br />
0.0 1.0 2.0 3.0 4.0 5.0 6.0 7.0 8.0<br />
Low<br />
N 2 O<br />
Wind speed<br />
High<br />
SF6<br />
19<br />
17<br />
15<br />
13<br />
11<br />
9<br />
7
Time series<br />
12
ppmv<br />
ppmv<br />
CO 2 at Ispra from October 2007 to December 2010<br />
13<br />
550<br />
530<br />
510<br />
490<br />
470<br />
450<br />
430<br />
410<br />
390<br />
370<br />
350<br />
All data CO 2 Ispra October 2007 to December 2010<br />
550<br />
530<br />
510<br />
490<br />
470<br />
450<br />
430<br />
410<br />
390<br />
370<br />
350<br />
Mid-day CO 2 Ispra vs Mace Head flask samples 2007-2010
ppbv<br />
ppbv<br />
CH 4 at Ispra from October 2007 to December 2010<br />
14<br />
3200<br />
All data CH 4 Ispra October 2007 to December 2010<br />
3000<br />
2800<br />
2600<br />
2400<br />
2200<br />
2000<br />
1800<br />
3200<br />
Mid-day CH 4 Ispra vs Mace Head flask samples 2007-2010<br />
3000<br />
2800<br />
2600<br />
2400<br />
2200<br />
2000<br />
1800
ppbv<br />
ppbv<br />
N 2 O at Ispra from October 2007 to December 2010<br />
15<br />
355<br />
All data N 2 O Ispra October 2007 to December 2010<br />
350<br />
345<br />
340<br />
335<br />
330<br />
325<br />
320<br />
315<br />
355<br />
Mid-day N 2 O at Ispra vs continuous Mace Head data 2007-2010<br />
350<br />
345<br />
340<br />
335<br />
330<br />
325<br />
320<br />
315
pptv<br />
pptv<br />
SF 6 at Ispra from October 2007 to December 2010<br />
16<br />
30<br />
All data SF 6 Ispra October 2007 to December 2010<br />
25<br />
20<br />
15<br />
10<br />
5<br />
0<br />
30<br />
Mid-day SF 6 at Ispra vs continuous Mace Head data 2007-2010<br />
25<br />
20<br />
15<br />
10<br />
5<br />
0
222<br />
Radon at Ispra from September 2008 to December 2010<br />
17<br />
35<br />
Hourly mean Radon at Ispra from September 2008 to December 2009<br />
30<br />
222 Radon (Bq m<br />
-3 )<br />
25<br />
20<br />
15<br />
10<br />
5<br />
0<br />
25<br />
Monthly mean Radon at Ispra from September 2008 to December 2009<br />
222 Radon (Bq m<br />
-3 )<br />
20<br />
15<br />
10<br />
5<br />
0
difference in ppmv<br />
difference in ppbv<br />
Good agreement between the PICARRO <strong>and</strong> GC-system for simultaneous CO 2 <strong>and</strong> CH 4<br />
measurements (year 2009 data)<br />
18<br />
50<br />
40<br />
30<br />
20<br />
10<br />
0<br />
-10<br />
-20<br />
-30<br />
-40<br />
-50<br />
200<br />
150<br />
100<br />
Agreement between the PICARRO <strong>and</strong> the GC for CO 2<br />
SD Picarro data<br />
PIC - GC-data<br />
20 70 120 170 220 270 320 370<br />
Day of Year<br />
Agreement between the PICARRO <strong>and</strong> the GC for CH 4<br />
SD Picarro data<br />
PIC - GC-data<br />
50<br />
0<br />
-50<br />
-100<br />
-150<br />
-200<br />
20 70 120 170 220 270 320 370<br />
Day of Year
Good agreement between the PICARRO <strong>and</strong> GC-system for<br />
simultaneous CO 2 <strong>and</strong> CH 4 measurements for 2009<br />
19<br />
ppmv CO2<br />
ppbv CH4<br />
550<br />
530<br />
510<br />
490<br />
470<br />
450<br />
430<br />
410<br />
390<br />
370<br />
350<br />
2800<br />
2700<br />
2600<br />
2500<br />
2400<br />
2300<br />
2200<br />
2100<br />
2000<br />
1900<br />
1800<br />
PICARRO<br />
GC-FID<br />
2009 CO 2 PICARRO vs GC<br />
0 50 100 150 200 250 300 350<br />
Day of Year<br />
PICARRO<br />
GC-FID<br />
2009 CH 4 PICARRO vs GC<br />
0 50 100 150 200 250 300 350<br />
Day of Year<br />
560<br />
510<br />
460<br />
410<br />
360<br />
2800<br />
2600<br />
2400<br />
2200<br />
2000<br />
1800<br />
2009 CO 2 PICARRO vs GC<br />
y = 0.9965x + 1.239<br />
R² = 0.9965<br />
360 410 460 510 560<br />
2009 CH 4 PICARRO vs GC<br />
y = 0.9971x + 7.6626<br />
R² = 0.9955<br />
1800 2000 2200 2400 2600 2800
Radon-based regional flux estimates<br />
20
ppbv CH4<br />
222 Radon flux in Bq m<br />
-2 h<br />
-1<br />
Radon based flux estimate<br />
Provided that the 222 Radon soil exhalation rate F Rn is known the F GHG can be estimated from the<br />
slope Δ[GHG]/ Δ[Rn] expressed as:<br />
F GHG / F Rn = Δ[GHG] / Δ[Rn] (Dörr <strong>and</strong> Münnich, Tellus, 1990)<br />
21<br />
2150<br />
2100<br />
Night time CH4 vs 222Radon on<br />
27/03/2009<br />
80<br />
70<br />
Ispra 222 Radon soil flux<br />
2050<br />
2000<br />
60<br />
50<br />
annualmean<br />
1950<br />
1900<br />
1850<br />
y = 88.23x + 1411.3<br />
R² = 0.78<br />
4.0 9.0 14.0 19.0<br />
Bq Radon<br />
40<br />
30<br />
20<br />
Estimated flux<br />
Measured flux<br />
0 100 200 300 400<br />
DOY<br />
• Only hourly mean night time measurement between 19:00 – 7:00 h with a R > 0.7 (R 2 > 0.49) are<br />
used.<br />
• 222 Radon decay during this time interval ( 222 Radon lifetime of 5.5 days) is neglected.<br />
• Based on dynamic chamber measurements (Alphaguard) of the 222 Radon soil exhalation rate at<br />
Ispra we estimate a yearly mean value of 56 Bq m -2 h -1 . Here we assume a seasonal deviation of -<br />
20% in winter <strong>and</strong> +20% in summer.
Overview of all 2008-2010 GHG fluxes<br />
22<br />
2500<br />
All CO 2 fluxes 2008-2010<br />
0.30<br />
All N 2 O fluxes 2008-2010<br />
2000<br />
0.25<br />
Flux in mg m -2 h -1<br />
1500<br />
1000<br />
500<br />
Flux in mg m -2 h -1<br />
0.20<br />
0.15<br />
0.10<br />
0.05<br />
0<br />
0 50 100 150 200 250 300 350 400<br />
0.00<br />
0 50 100 150 200 250 300 350 400<br />
5.0<br />
All CH 4 fluxes 2008-2010<br />
5.E-04<br />
All SF 6 fluxes 2008-2010<br />
4.5<br />
4.0<br />
4.E-04<br />
Flux in mg m -2 h -1<br />
3.5<br />
3.0<br />
2.5<br />
2.0<br />
1.5<br />
1.0<br />
0.5<br />
Flux in mg m -2 h -1<br />
3.E-04<br />
2.E-04<br />
1.E-04<br />
0.0<br />
0.E+00<br />
0 50 100 150 200 250 300 350 400<br />
0 50 100 150 200 250 300 350 400<br />
• Enhanced methane fluxes are found during winter time mostly from the Po<br />
Valley region<br />
• Occasionally high N 2 O fluxes<br />
• A strong (night time) biogenic respiration signal is apparent in Spring<br />
• No strong sign of rice paddy methane emissions at Ispra
Annual mean fluxes for Ispra compared to other European estimates<br />
23<br />
Area Annual mean CH 4 -flux sd Reference<br />
Rn-flux mg m -2 h -1<br />
Western Europe, 1996-04 Annual 57 1.36 0.23 Messager et al., ACPD, 2008<br />
Germany, Schaunsl<strong>and</strong> 1991-95 Wintertime 53 1.06 0.55 Schmidt et al., Tellus, 1996<br />
Germany, Heidelberg 1996-08 Annual 57 0.72 0.43 Levin et al., Phil. Trans R. Soc., 2011<br />
Italy, Po Valley 2008 Wintertime 47 1.36 0.54 this work<br />
Italy, Po Valley 2009 Annual 56 1.12 0.44 this work<br />
Italy, Po Valley 2010 Annual 56 1.04 0.62 this work<br />
Europe 1996-04 Annual Inventory 0.83 0.10 UNFCCC, 2005 (in Messager et al., 2008)<br />
Area Annual mean CO 2 -flux sd Reference<br />
Rn-flux g m -2 h -1<br />
Western Europe, 1996-04 Annual 57 0.468 0.171 Messager et al., ACPD, 2008<br />
Germany, Schaunsl<strong>and</strong> 1991-95 Wintertime 53 0.458 0.189 Schmidt et al., Tellus, 1996<br />
Italy, Po Valley 2008 Wintertime 47 0.422 0.105 this work<br />
Italy, Po Valley 2009 Annual 56 0.576 0.224 this work<br />
Italy, Po Valley 2010 Annual 56 0.493 0.256 this work<br />
Europe 1996-04 Annual Inventory 0.543 0.030 ORCHIDEE + UNFCCC, 2005 (in Messager et al., 2008)<br />
Area Annual mean N 2 O-flux sd Reference<br />
Rn-flux ug m -2 h -1<br />
Western Europe, 1996-04 Annual 57 59 15 Messager et al., ACPD, 2008<br />
Germany, Schaunsl<strong>and</strong> 1996-98 Annual 57 66 6 Schmidt et al., JGR, 2001<br />
Germany, Heidelberg, 1996-98 Annual 57 68 8 Schmidt et al., JGR, 2001<br />
Italy, Po Valley 2008 Wintertime 47 42 9 this work<br />
Italy, Po Valley 2009 Annual 56 56 23 this work<br />
Italy, Po Valley 2010 Annual 56 42 26 this work<br />
Europe 1996-04 Annual Inventory 64 7 UNFCCC, 2005 (in Messager et al., 2008)
Annual mean fluxes of CH 4 <strong>and</strong> N 2 O for the Po Valley compared to other European estimates<br />
24<br />
FLux in mg m -2 h -1<br />
2.00<br />
1.80<br />
1.60<br />
1.40<br />
1.20<br />
1.00<br />
0.80<br />
0.60<br />
0.40<br />
0.20<br />
0.00<br />
European flux estimates for CH 4 compared<br />
Western<br />
Europe, 1996-<br />
04 Annual<br />
Germany,<br />
Schaunsl<strong>and</strong><br />
1991-95<br />
Wintertime<br />
Germany,<br />
Heidelberg<br />
1996-08<br />
Annual<br />
Italy, Po Valley<br />
2008<br />
Wintertime<br />
Italy, Po Valley<br />
2009 Annual<br />
Italy, Po Valley<br />
2010 Annual<br />
Flux in ug m -2 h -1<br />
100<br />
90<br />
80<br />
70<br />
60<br />
50<br />
40<br />
30<br />
20<br />
10<br />
0<br />
Western<br />
Europe, 1996-<br />
04 Annual<br />
European N 2 O flux estimates compared<br />
Germany,<br />
Schaunsl<strong>and</strong><br />
1996-98<br />
Annual<br />
Germany,<br />
Heidelberg,<br />
1996-98<br />
Annual<br />
Italy, Po Valley<br />
2008<br />
Wintertime<br />
Italy, Po Valley<br />
2009 Annual<br />
Italy, Po Valley<br />
2010 Annual
Flux data partitioning into three sectors based on HYSPLIT 12 hr back-trajectory<br />
analysis <strong>and</strong> local meteorology data (wind speed, wind direction, <strong>and</strong> RH%)<br />
25<br />
1.North-Northwest sector: (blue)<br />
2.Stagnant conditions: (red)<br />
3.South-Po Valley: (green)<br />
2<br />
2.00<br />
2008 October-December<br />
1.80<br />
Northerlies<br />
1.60<br />
Stagnant<br />
Flux in g m -2 h -1<br />
1.40<br />
1.20<br />
1.00<br />
0.80<br />
0.60<br />
Po-Valley<br />
2.00<br />
1.80<br />
2010 annual average<br />
Northerlies<br />
0.40<br />
1.60<br />
Stagnant<br />
Flux in g m -2 h -1<br />
0.20<br />
0.00<br />
2.00<br />
1.80<br />
1.60<br />
1.40<br />
1.20<br />
1.00<br />
0.80<br />
0.60<br />
0.40<br />
0.20<br />
0.00<br />
F_CO2 F_CH4 (*10-3) F_N2O (*10-4) SF6 (*10-6)<br />
2009 annual average<br />
Northerlies<br />
Stagnant<br />
Po-Valley<br />
F_CO2 F_CH4 (*10-3) F_N2O (*10-4) SF6 (*10-6)<br />
Flux in g m -2 h -1<br />
1.40<br />
1.20<br />
1.00<br />
0.80<br />
0.60<br />
0.40<br />
0.20<br />
0.00<br />
Po Valley<br />
F_CO2 F_CH4 (*10-3) F_N2O (*10-4) SF6 (*10-6)<br />
• Enhanced GHG fluxes are related<br />
to air masses coming from the Po<br />
Valley region (in green).
Annual flux average per sector<br />
26<br />
Flux in g m -2 h -1<br />
0.90<br />
0.80<br />
0.70<br />
0.60<br />
0.50<br />
0.40<br />
0.30<br />
0.20<br />
2008<br />
2009<br />
2010<br />
CO 2 annual mean<br />
Flux in mg m -2 h -1<br />
2.00<br />
1.80<br />
1.60<br />
1.40<br />
1.20<br />
1.00<br />
0.80<br />
0.60<br />
0.40<br />
2008<br />
2009<br />
2010<br />
CH 4 annual mean<br />
0.10<br />
0.20<br />
0.00<br />
0.00<br />
Northerlies Regional Po Valley<br />
Northerlies Regional Po Valley<br />
Flux in ug m -2 h -1<br />
0.90<br />
0.80<br />
0.70<br />
0.60<br />
0.50<br />
0.40<br />
0.30<br />
0.20<br />
0.10<br />
2008<br />
2009<br />
2010<br />
N 2 O annual mean<br />
Flux in pg m -2 h -1<br />
0.35<br />
0.30<br />
0.25<br />
0.20<br />
0.15<br />
0.10<br />
0.05<br />
2008<br />
2009<br />
2010<br />
SF 6 annual mean<br />
0.00<br />
0.00<br />
Northerlies Regional Po Valley<br />
Northerlies Regional Po Valley
High methane fluxes in air masses are mainly coming from the Po Valley<br />
with a slight tendency towards higher values during winter time<br />
27<br />
mg CH4 m -2 h -1<br />
3.5<br />
3.0<br />
2.5<br />
2.0<br />
1.5<br />
1.0<br />
0.5<br />
0.0<br />
All sectors<br />
Po Valley<br />
Ispra 2008-2010 methane flux<br />
0 50 100 150 200 250 300 350<br />
Day of Year<br />
Po Valley CH 4 flux<br />
winter (NDJF):<br />
1.22±0.56<br />
summer (MJJAS):<br />
0.99±0.57<br />
March-April:<br />
1.02±0.60<br />
Is there a seasonality in anthropogenic emissions of CH 4 that we don’t know off<br />
EDGAR4.2 2008 CH 4 emissions for Italy<br />
16 20 78<br />
14<br />
48<br />
495<br />
mg CH 4 m -2 h -1<br />
2.0<br />
1.8<br />
1.6<br />
1.4<br />
1.2<br />
1.0<br />
0.8<br />
0.6<br />
0.4<br />
0.2<br />
0.0<br />
Seasonal CH 4 Po Valley flux<br />
NDJF MJJAS MA<br />
Agricultural soils<br />
Enteric fermentation (cattle)<br />
Manure management<br />
Gas production <strong>and</strong><br />
distribution<br />
Heating<br />
661<br />
Oil refineries<br />
L<strong>and</strong>fills<br />
EDGAR4.2 data by<br />
courtesy of Greet<br />
Janssen-Maenhout<br />
199<br />
Transport<br />
Industry<br />
6 31<br />
215<br />
Waste water treatment<br />
Others
28<br />
Further highlights:<br />
High N 2 O events<br />
Clean air episodes at Ispra<br />
The potential contribution of Po<br />
Valley rice paddy emissions to the<br />
Ispra flux estimates
ppbv N2O<br />
Large N 2 O point source 40 km south of Ispra can explain N 2 O flux “outliers”<br />
29<br />
Radici Chimica SPA in Novarra (asl 149 m, lon 8.6433, lat 45.4599, ~40 km South of Ispra) is one of the main<br />
production plants in Europe of nitric <strong>and</strong> adipic acid.<br />
Foreward Hysplit trajectories starting at the factory (at 200 m altitude) at 21-12-2009 were N 2 O values reach to<br />
340 ppbv arriving at Ispra in less then half a day.<br />
344<br />
342<br />
340<br />
338<br />
336<br />
334<br />
332<br />
330<br />
328<br />
326<br />
324<br />
322<br />
N2O<br />
CH4<br />
Elevated N 2 O <strong>and</strong> CH 4 from the Novarra area<br />
2900<br />
2700<br />
2500<br />
2300<br />
2100<br />
1900<br />
1700<br />
1500<br />
ppbv CH4<br />
ISPRA<br />
F N2O for this event:<br />
189±40 μg m -2 h -1<br />
Average 2009 Po Valley F N2O :<br />
54±23 μg m -2 h -1 NOVARRA nitric acid plant
ppbV CH4<br />
RH%<br />
Strong Föhn events simultaneously observed at Ispra <strong>and</strong> Jungfraujoch station<br />
30<br />
2100<br />
2050<br />
2000<br />
1950<br />
Clean air Föhn events at Ispra<br />
CH4 JFJ<br />
CH4 Ispra<br />
Föhn air<br />
RH% Ispra<br />
100<br />
90<br />
80<br />
70<br />
60<br />
1900<br />
50<br />
1850<br />
1800<br />
1750<br />
1700<br />
03/23/08<br />
00:00<br />
03/24/08<br />
00:00<br />
03/25/08<br />
00:00<br />
DAY-TIME (9:00 - 16:00)<br />
Föhn<br />
03/26/08<br />
Ispra<br />
03/27/08 03/28/08 03/29/08<br />
JFJ<br />
03/30/08 03/31/08<br />
difference<br />
04/01/08 04/02/08Match<br />
00:00 00:00 00:00 00:00 00:00 00:00 00:00 00:00<br />
events Mean sd Mean sd JFJ-Ispra<br />
RH% 21 7<br />
WS 3.2 DAY-TIME 2.2 (9:00 - 16:00)<br />
04/03/08<br />
00:00<br />
Föhn O3 Ispra 42 8 JFJ 52 10 difference 10 Match 1.24<br />
events CO Mean 190 sd 23.7 Mean 159 sd 13 JFJ-Ispra -30 0.84<br />
RH% CH4 21 1885 716 1881 21 -4 1.00<br />
WS N2O 3.2 322.25 2.2 0.65 322.27 1.5 0.02 1.00<br />
O3 SF6 42 6.64 80.12 52 6.76 10 0.33 10 0.12 1.24 1.02<br />
CO 190 23.7 159 13 -30 0.84<br />
CH4 1885 16 1881 21 -4 1.00<br />
Excellent agreement N2O 322.25 is found 0.65 between 322.27 the 1.5 ambient 0.02 air composition 1.00 observed at<br />
Ispra <strong>and</strong> SF6 JFJ during 6.64Föhn 0.12 events 6.76 as seen 0.33during 0.12January 1.02 to April of 2008.<br />
04/04/08<br />
00:00<br />
04/05/08<br />
00:00<br />
40<br />
30<br />
20<br />
10<br />
0<br />
04/06/08<br />
00:00
Po Valley rice paddies flooded between April-September<br />
31<br />
Meteosat-7, visible channel, 26<br />
April 2001, 11:00 UTC<br />
L<strong>and</strong>sat-7 Thematic Mapper (TM), 20 May 2001<br />
(courtesy US Geological Survey).
July-August peak in methane fluxes from a Po Valley rice paddy: can<br />
32<br />
we see that in the data at Ispra<br />
2009 June-August highest rice paddy emissions<br />
~ 0.3 μmol CH 4 m -2 s -1<br />
Data <strong>and</strong> plot from Meijide<br />
et al., BGD, 2011.<br />
2400<br />
2300<br />
Ispra CH 4 May to October 2009<br />
June-August high CH 4<br />
2200<br />
ppbv CH4<br />
2100<br />
2000<br />
1900<br />
1800<br />
EDGAR4.2 agricultural soils emissions estimate for 2008: ~48 kTon y -1 .<br />
A mean methane flux of 0.3 μmol CH 4 m -2 s -1 extrapolated to a total rice paddy area of 2 * 10 9 m 2<br />
<strong>and</strong> an emission period of 60 days corresponds to ~50 kTon from the Po Valley.
Potential event flux contribution from rice paddies<br />
33<br />
~50 kTon from rice paddies corresponds to a potential flux contribution of<br />
the order of ~0.5 mg CH 4 m -2 h -1 evenly distributed over the Po Valley basin<br />
(7 * 10 10 m 2 ) during July <strong>and</strong> August.<br />
mg CH4 m -2 h -1<br />
3.5<br />
3.0<br />
2.5<br />
2.0<br />
1.5<br />
1.0<br />
0.5<br />
0.0<br />
Ispra 2008-2010 methane flux<br />
All sectors<br />
Po Valley<br />
0 50 100 150 200<br />
Day of Year<br />
250 300 350<br />
N.B. compared to the potential strength of other major source the contribution<br />
from rice paddies is relatively small.
34<br />
The greenhouse gas monitoring activity in<br />
support of the JRC TM5 inverse modeling<br />
<strong>and</strong> the EDGAR emission database:<br />
To improve our underst<strong>and</strong>ing of the role of<br />
the Po Valley hotspot in the European GHG<br />
emission budget
Ispra (green) <strong>and</strong> Milan in the TM5 grid<br />
35
Comparison between 2008 CH 4 observations <strong>and</strong> the TM5 model for Ispra 36<br />
TM5 forward simulation of methane for 2008 for a 1 x 1 degree resolution. Black dots denote<br />
the hourly mean measured methane, the blue line is the mean model output, whereas the light<br />
blue shaded area represents the uncertainty range due to the model representativeness error.
Total EDGAR based a-priori CH 4 emissions in the TM5 model Ispra<br />
domain versus our flux estimates<br />
37<br />
Catchment area Emission in mg CH 4 m 2 h -1<br />
Model 1x1 degree grid 0.93<br />
Model 30 km footprint total 1.02<br />
Model 30 km footprint North 0.68<br />
Model 30 km footprint South 1.35<br />
Measured flux North: 0.36 – 0.46<br />
Measured flux South (Po Valley) 1.04 – 1.36
Total EDGAR based a-priori N 2 O emissions in the TM5 model Ispra<br />
domain versus our flux estimates<br />
38<br />
Catchment area Emission in mg N 2 O m 2 h -1<br />
Model 1x1 degree grid<br />
0.312 (biased from factory point source!)<br />
Model 30 km footprint total 0.032<br />
Model 30 km footprint North 0.021<br />
Model 30 km footprint South 0.043 (factory point source not included!)<br />
Measured flux North: 0.012 – 0.030<br />
Measured flux South (Po Valley) 0.042 – 0.054<br />
38
39<br />
Link of the Ispra GHG-monitoring<br />
activity to monitoring networks <strong>and</strong><br />
programs<br />
39
Connection of the JRC-Ispra GHG-Station to international<br />
monitoring programmes <strong>and</strong> networks<br />
40<br />
GEOMON (http://www.geomon.eu/)<br />
ICOS (http://icos-infrastructure.eu/)<br />
InGOS (www.ingos-infrastructure.eu/)<br />
40
Near real-time data presentation on the GEOMON-IMECC <strong>and</strong> ICOS data site<br />
41<br />
41
42<br />
Outlook<br />
Set-up of a 65 m tower starting in 2012 at the JRC-<br />
Ispra site to establish a long-term GHG monitoring<br />
facility combined with the Ispra EMEP/GAW activity.
Summary; what have we learned from the Ispra GHG<br />
station so far<br />
43<br />
• The Ispra station is the currently the only ground based station bordering the Po Valley region<br />
which is one of the global pollution hotspots, complementing a number of mountain station in<br />
the area.<br />
• The Ispra station encounters clean continental background level northerly air masses<br />
comparable to high altitude mountain stations that strongly contrast polluted southerly Po Valley<br />
air masses.<br />
• The 222 Radon based flux estimates allows for model independent emission estimates for the Po<br />
Valley region.<br />
• Our flux estimates indicate significantly enhanced emissions from the Po Valley relative to air<br />
masses from the North.<br />
• Model simulations are consistent within the model representativeness error.<br />
• Our regional flux estimates for CH 4 <strong>and</strong> N 2 O are in good agreement with total a-priori estimates<br />
from EDGAR.<br />
• A higher sampling mast will increase the catchment area of the station <strong>and</strong> lower the influence<br />
of local sources <strong>and</strong> the strong local influence of ecosystem respiration.