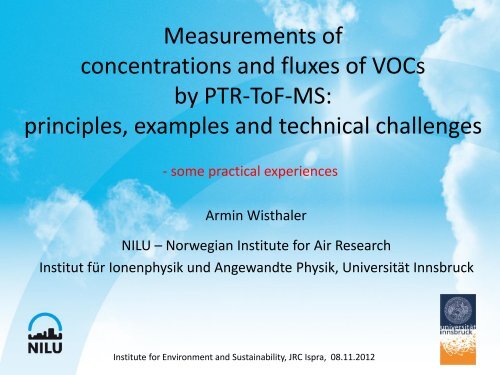
Measurements of concentrations and fluxes of VOCs by PTR-ToF-MS
Measurements of concentrations and fluxes of VOCs by PTR-ToF-MS
Measurements of concentrations and fluxes of VOCs by PTR-ToF-MS
- No tags were found...

Create successful ePaper yourself
Turn your PDF publications into a flip-book with our unique Google optimized e-Paper software.
<strong>PTR</strong>-<strong>MS</strong> / <strong>PTR</strong>-<strong>ToF</strong>-<strong>MS</strong>basics
Proton affinity ladderC,H,NC,HC,H,OC,H,S
Quantification• <strong>PTR</strong>-<strong>MS</strong> is an absolute method. Instrument sensitivity can becalculated.• H 3 O + + VOC VOCH + + H 2 O obeys simple pseudo first-orderkinetics.[ VOC]i(VOCH )i(H O )31kt• <strong>VOCs</strong> can be quantified within 20 % without using calibrationst<strong>and</strong>ards.• Calibration st<strong>and</strong>ards are used to achieve better accuracy: 5 %• Detection limit (2) 0-50 pptV at 1 s signal integration time.
<strong>PTR</strong>-<strong>ToF</strong>-<strong>MS</strong>• full scan acquisition in 0.1 - 1 sflux measurements, on-road emission measurements, airborne measurements• distinction <strong>of</strong> isobaric compounds (C m H n N o O p )distinction <strong>of</strong> isomers via different CI agents
A transportable instrument> 230 kg
<strong>PTR</strong>-<strong>ToF</strong>-<strong>MS</strong> data analysisPoisson countingstatistics <strong>and</strong> deadtime correctionraw spectrumnormalization<strong>and</strong>calibrationmass shift correctionmass discriminationcorrectionmass axis calibrationpeak searching <strong>and</strong>multiple peak fitting
<strong>PTR</strong>-TOF Data Analyzer
<strong>PTR</strong>-<strong>ToF</strong>-<strong>MS</strong> data analysisMüller, M., Mikoviny, T., Jud, W., D’Anna, B., <strong>and</strong> Wisthaler, A.: A New S<strong>of</strong>tware Tool for the Analysis <strong>of</strong> High Resolution <strong>PTR</strong>-TOFMass Spectra, submitted, 2012
Application examples• long-term measurements <strong>of</strong> <strong>VOCs</strong> at a ruralbackground station• on-road emission measurements <strong>of</strong> <strong>VOCs</strong>from a bioethanol-powered bus• eddy covariance flux measurements <strong>of</strong> <strong>VOCs</strong>from managed grass l<strong>and</strong>• measurements in atmosphere simulationchambers
Long-term measurements <strong>of</strong> <strong>VOCs</strong>at a rural background station
Motivation• EMEP intensive measurement period (08/06/2012 – 12/07/2012)• pilot measurements <strong>by</strong> <strong>PTR</strong>-<strong>ToF</strong>-<strong>MS</strong> to supportair mass characterization at rural backgroundstation:− local biogenic impact / oxidative processing− long-range transport− local anthropogenic impact (domestic burning, traffic)
The Birkenes observatory
The Birkenes observatory
Experimental details• continuous measurements from April 28 toAugust 31, 2012• 1-min signal integration, > 90 % good data• automated calibration (30 min/week)• automated zeroing (3 x 30 min/week)• external m/z calibration
signal [ncps]QA/QC: zeroing16151413121110987654321010.90.80.70.60.50.40.30.20.10137.13633.0329764345.0314514669.07datepreliminary data as <strong>of</strong> Nov 7, 2012
signal [ncps]QA/QC: calibration (-pinene)7060504010.90.80.70.630201000.50.40.30.20.1081.069137.136datepreliminary data as <strong>of</strong> Nov 7, 2012
Monoterpenes time seriespreliminary data as <strong>of</strong> Nov 7, 2012
Isoprene time seriespreliminary data as <strong>of</strong> Nov 7, 2012
On-road emission measurements<strong>of</strong> <strong>VOCs</strong>from a bioethanol-powered bus
Experimental set-up• 2 Hz VOC (<strong>PTR</strong>-TOF 8000)• 5 Hz CO 2 (LI-6262)• GPS• 2 Hz engine parameters (ECU)• exhaust diluted <strong>by</strong> factor 50-100• March 28-30, 2012
Acetaldehyde emissionsincomplete oxidation in the VOC catalyst
Emission characterization• formaldehyde• methanol• formic acid• ethanol• acetic acid• > 30 minor peaks• work in progress
Acetic acid emissionsmodeled acetic acid concentration as a function <strong>of</strong> the distance from thetailpipe (during idling)
Eddy covariance fluxmeasurements <strong>of</strong> <strong>VOCs</strong> frommanaged grass l<strong>and</strong>flux expertise: T. Karl, G. Wohlfahrtdata courtesy: M. Müller
Reference
InstrumentationSonic Anemometer 3 D wind data information 20 Hz acquisition frequency vertical wind speed, w(t)<strong>PTR</strong>-<strong>ToF</strong>: VOC measurements 10 Hz acquisition frequency VOC mixing ratio, c(t)29
Measurement sitesampling line: Teflon PFA, 12 m, ID 3.9 mm, 35 °C, 9 slpmVOC <strong>fluxes</strong> over temprate mountain grassl<strong>and</strong>
Lag-time: maximum covariance method20at 11:46 5.8.200915Methanol flux [nmol/m2/s]1050-180s 0 +180stube residence timedrift in computer clocks31
Flux [nmol m -2 s -1 ]120100806040200-2030MethanolMixing ratios time seriesMonoterpenesAcetic acid08/01 08/02 08/03 08/04 08/05 08/06 08/07 08/08 08/09Volume mixing ration [ppb]252015105008/01 08/02 08/03 08/04 08/05 08/06 08/07 08/08 08/09Date
Flux time seriesFlux [nmol m -2 s -1 ]120100806040200-2030MethanolMonoterpenesAcetic acid08/01 08/02 08/03 08/04 08/05 08/06 08/07 08/08 08/09e mixing ration [ppb]25201510
Cumulative <strong>fluxes</strong>
Summary• 10 Hz VOC measurements <strong>by</strong> <strong>PTR</strong>-<strong>ToF</strong>-<strong>MS</strong>• <strong>fluxes</strong> <strong>of</strong> 18 compounds (> 0.1 nmol m -2 s -1 )methanol, acetaldehyde, ethanol, hexenal <strong>and</strong> other C 6 leaf wound compounds, acetone, acetic acid,monoterpenes <strong>and</strong> sequiterpenes• total VOC emission flux up to 200 nmolC m -2 s -1 duringharvesting
<strong>Measurements</strong> in atmospheresimulation chambers
CO 2 capturing90 % CO 2 removedXdecomposition products <strong>of</strong> XX aqCO 2CO 2(3-15 %)X(to geological storage)CO 2 XCO 2 XXCO 2 XCO 2 point source CO 2 absorber CO 2 stripper
Atmospheric degradation <strong>of</strong> aminesproduct studies at the Univ. <strong>of</strong> Innsbruckkinetic <strong>and</strong> product studies at EUPHORE
Monoethanolamine (MEA) + OH
Dimethylamine photo-oxidationcredit: C. J. Nielsen
Dimethylamine photo-oxidation
Dimethylamine photo-oxidation<strong>PTR</strong>-TOF vs. Thermosorb/N – GC/<strong>MS</strong>: - 4 %
High-Temperature <strong>PTR</strong>-<strong>MS</strong>
Time response (HT <strong>PTR</strong>-<strong>MS</strong>)
Particle analysis <strong>by</strong> HT-<strong>PTR</strong>-<strong>MS</strong>particlesgases (>>particles)activated carbon denuderparticle evaporation cell(150-250°C)HT-<strong>PTR</strong>-<strong>MS</strong>
Analysis <strong>of</strong> particles <strong>by</strong> HT-<strong>PTR</strong>-<strong>MS</strong>
Analysis <strong>of</strong> particles <strong>by</strong> HT-<strong>PTR</strong>-<strong>MS</strong>
Trimethylamine oxidationm/z 44known tooligomerize/polymerize
m/z 44 (CH 3 N=CH 2 )
Credits• <strong>PTR</strong>-T<strong>of</strong>-<strong>MS</strong> s<strong>of</strong>tware:– M. Müller, W. Jud• Birkenes:– S. Langebner, T. Mikoviny• BieBus:– T. Mikoviny, S. Manø, C. Hak, S. Lopez-Aparicio• Flux measurements:– T. M. Ruuskanen, M. Müller, R. Schnitzh<strong>of</strong>er, T. Karl, M. Graus , I.Bamberger, L. Hörtnagl L., F. Brilli , G. Wohlfahrt, A. Hansel• Atmosphere simulation chamber measurements:– C. J. Nielsen, T. Mikoviny, M. Karl, CEAM-EUPHORE team• HT-<strong>PTR</strong>-<strong>MS</strong>:– T. Mikoviny, L. Kaser