Carlsberg Annual Report - Carlsberg Group
Carlsberg Annual Report - Carlsberg Group
Carlsberg Annual Report - Carlsberg Group

Create successful ePaper yourself
Turn your PDF publications into a flip-book with our unique Google optimized e-Paper software.
64 <strong>Carlsberg</strong> <strong>Group</strong><br />
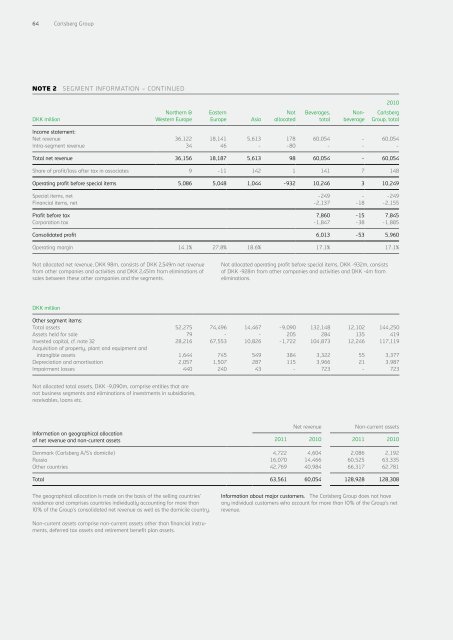
NOTE 2 Segment information – continued<br />
2010<br />
<strong>Carlsberg</strong><br />
<strong>Group</strong>, total<br />
DKK million<br />
Northern &<br />
Western Europe<br />
Eastern<br />
Europe<br />
Asia<br />
Not<br />
allocated<br />
Beverages,<br />
total<br />
Nonbeverage<br />
Income statement:<br />
Net revenue 36,122 18,141 5,613 178 60,054 - 60,054<br />
Intra-segment revenue 34 46 - -80 - - -<br />
Total net revenue 36,156 18,187 5,613 98 60,054 - 60,054<br />
Share of profit/loss after tax in associates 9 -11 142 1 141 7 148<br />
Operating profit before special items 5,086 5,048 1,044 -932 10,246 3 10,249<br />
Special items, net -249 - -249<br />
Financial items, net -2,137 -18 -2,155<br />
Profit before tax 7,860 -15 7,845<br />
Corporation tax -1,847 -38 -1,885<br />
Consolidated profit 6,013 -53 5,960<br />
Operating margin 14.1% 27.8% 18.6% 17.1% 17.1%<br />
Not allocated net revenue, DKK 98m, consists of DKK 2,549m net revenue<br />
from other companies and activities and DKK 2,451m from eliminations of<br />
sales between these other companies and the segments.<br />
Not allocated operating profit before special items, DKK -932m, consists<br />
of DKK -928m from other companies and activities and DKK -4m from<br />
eliminations.<br />
DKK million<br />
Other segment items:<br />
Total assets 52,275 74,496 14,467 -9,090 132,148 12,102 144,250<br />
Assets held for sale 79 - - 205 284 135 419<br />
Invested capital, cf. note 32 28,216 67,553 10,826 -1,722 104,873 12,246 117,119<br />
Acquisition of property, plant and equipment and<br />
intangible assets 1,644 745 549 384 3,322 55 3,377<br />
Depreciation and amortisation 2,057 1,507 287 115 3,966 21 3,987<br />
Impairment losses 440 240 43 - 723 - 723<br />
Not allocated total assets, DKK -9,090m, comprise entities that are<br />
not business segments and eliminations of investments in subsidiaries,<br />
receivables, loans etc.<br />
Information on geographical allocation<br />
of net revenue and non-current assets<br />
Net revenue<br />
Non-current assets<br />
2011 2010 2011 2010<br />
Denmark (<strong>Carlsberg</strong> A/S’s domicile) 4,722 4,604 2,086 2,192<br />
Russia 16,070 14,466 60,525 63,335<br />
Other countries 42,769 40,984 66,317 62,781<br />
Total 63,561 60,054 128,928 128,308<br />
The geographical allocation is made on the basis of the selling countries’<br />
residence and comprises countries individually accounting for more than<br />
10% of the <strong>Group</strong>’s consolidated net revenue as well as the domicile country.<br />
Information about major customers. The <strong>Carlsberg</strong> <strong>Group</strong> does not have<br />
any individual customers who account for more than 10% of the <strong>Group</strong>’s net<br />
revenue.<br />
Non-current assets comprise non-current assets other than financial instruments,<br />
deferred tax assets and retirement benefit plan assets.

![[Name and Address] - Carlsberg Group](https://img.yumpu.com/49766377/1/184x260/name-and-address-carlsberg-group.jpg?quality=85)
![[Name and Address] - Carlsberg Group](https://img.yumpu.com/49015962/1/184x260/name-and-address-carlsberg-group.jpg?quality=85)