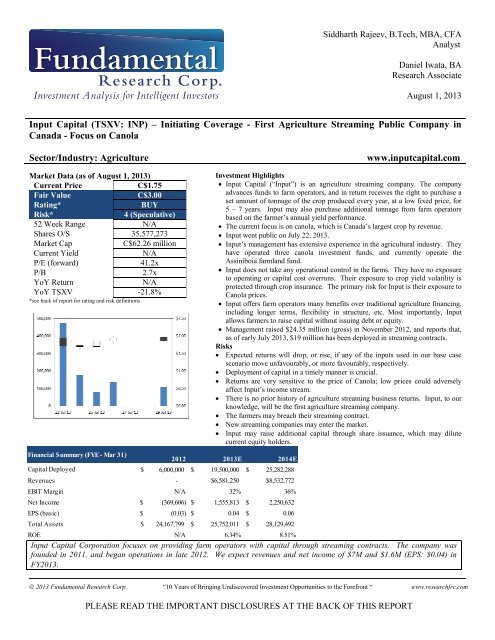
Input Capital (TSXV: INP) â Initiating Coverage - First ... - Baystreet.ca
Input Capital (TSXV: INP) â Initiating Coverage - First ... - Baystreet.ca
Input Capital (TSXV: INP) â Initiating Coverage - First ... - Baystreet.ca

You also want an ePaper? Increase the reach of your titles
YUMPU automatically turns print PDFs into web optimized ePapers that Google loves.
Siddharth Rajeev, B.Tech, MBA, CFA<br />
Analyst<br />
Daniel Iwata, BA<br />
Research Associate<br />
August 1, 2013<br />
<strong>Input</strong> <strong>Capital</strong> (<strong>TSXV</strong>: <strong>INP</strong>) – <strong>Initiating</strong> <strong>Coverage</strong> - <strong>First</strong> Agriculture Streaming Public Company in<br />
Canada - Focus on Canola<br />
Sector/Industry: Agriculture<br />
www.input<strong>ca</strong>pital.com<br />
Market Data (as of August 1, 2013)<br />
Current Price<br />
C$1.75<br />
Fair Value<br />
C$3.00<br />
Rating*<br />
BUY<br />
Risk*<br />
4 (Speculative)<br />
52 Week Range N/A<br />
Shares O/S 35,577,273<br />
Market Cap<br />
C$62.26 million<br />
Current Yield<br />
N/A<br />
P/E (forward) 41.2x<br />
P/B 2.7x<br />
YoY Return<br />
N/A<br />
YoY <strong>TSXV</strong> -21.8%<br />
*see back of report for rating and risk definitions<br />
Financial Summary (FYE - Mar 31)<br />
Investment Highlights<br />
• <strong>Input</strong> <strong>Capital</strong> (“<strong>Input</strong>”) is an agriculture streaming company. The company<br />
advances funds to farm operators, and in return receives the right to purchase a<br />
set amount of tonnage of the crop produced every year, at a low fixed price, for<br />
5 – 7 years. <strong>Input</strong> may also purchase additional tonnage from farm operators<br />
based on the farmer’s annual yield performance.<br />
• The current focus is on <strong>ca</strong>nola, which is Canada’s largest crop by revenue.<br />
• <strong>Input</strong> went public on July 22, 2013.<br />
• <strong>Input</strong>’s management has extensive experience in the agricultural industry. They<br />
have operated three <strong>ca</strong>nola investment funds, and currently operate the<br />
Assiniboia farmland fund.<br />
• <strong>Input</strong> does not take any operational control in the farms. They have no exposure<br />
to operating or <strong>ca</strong>pital cost overruns. Their exposure to crop yield volatility is<br />
protected through crop insurance. The primary risk for <strong>Input</strong> is their exposure to<br />
Canola prices.<br />
• <strong>Input</strong> offers farm operators many benefits over traditional agriculture financing,<br />
including longer terms, flexibility in structure, etc. Most importantly, <strong>Input</strong><br />
allows farmers to raise <strong>ca</strong>pital without issuing debt or equity.<br />
• Management raised $24.35 million (gross) in November 2012, and reports that,<br />
as of early July 2013, $19 million has been deployed in streaming contracts.<br />
Risks<br />
• Expected returns will drop, or rise, if any of the inputs used in our base <strong>ca</strong>se<br />
scenario move unfavourably, or more favourably, respectively.<br />
• Deployment of <strong>ca</strong>pital in a timely manner is crucial.<br />
• Returns are very sensitive to the price of Canola; low prices could adversely<br />
affect <strong>Input</strong>’s income stream.<br />
• There is no prior history of agriculture streaming business returns. <strong>Input</strong>, to our<br />
knowledge, will be the first agriculture streaming company.<br />
• The farmers may breach their streaming contract.<br />
• New streaming companies may enter the market.<br />
• <strong>Input</strong> may raise additional <strong>ca</strong>pital through share issuance, which may dilute<br />
current equity holders.<br />
2012 2013E 2014E<br />
<strong>Capital</strong> Deployed $ 6,000,000 $ 19,500,000 $ 25,282,288<br />
Revenues - $6,581,250 $8,532,772<br />
EBIT Margin N/A 32% 36%<br />
Net Income $ (369,606) $ 1,555,813 $ 2,250,632<br />
EPS (basic) $ (0.03) $ 0.04 $<br />
0.06<br />
Total Assets $ 24,167,799 $ 25,752,011 $ 28,129,492<br />
ROE N/A 6.34% 8.51%<br />
<strong>Input</strong> <strong>Capital</strong> Corporation focuses on providing farm operators with <strong>ca</strong>pital through streaming contracts. The company was<br />
founded in 2011, and began operations in late 2012. We expect revenues and net income of $7M and $1.6M (EPS: $0.04) in<br />
FY2013.<br />
© 2013 Fundamental Research Corp. “10 Years of Bringing Undiscovered Investment Opportunities to the Forefront “ www.researchfrc.com<br />
PLEASE READ THE IMPORTANT DISCLOSURES AT THE BACK OF THIS REPORT
Page 2<br />
Overview<br />
Previous funds<br />
operated by<br />
management<br />
<strong>Input</strong> <strong>Capital</strong> Corporation (“<strong>Input</strong>”), headquartered in Regina, Saskatchewan, was founded in<br />
October 2011, and started operations in late 2012. Management claims <strong>Input</strong> is the world’s<br />
first agriculture streaming company. Through streaming contracts, <strong>Input</strong> advances funds to<br />
farm operators, and in return, receives the right to purchase a fixed tonnage of <strong>ca</strong>nola, for no<br />
payment or a low fixed price, for a term of 5-7 years. <strong>Input</strong> engages in a number of<br />
mitigating strategies to limit the volatility of farming and non-delivery by the farmer. As of<br />
June 30, 2013, management states <strong>Input</strong> has raised $24.35 million through private<br />
placements, and deployed $19 million. <strong>Input</strong>’s shares started trading on the TSX Venture<br />
Exchange on July 22, 2013.<br />
Management of <strong>Input</strong> <strong>Capital</strong> also currently runs Assiniboia <strong>Capital</strong> Corp., which is a Regina<br />
based investment company. Assiniboia <strong>Capital</strong> Corp. was founded in 2005, with the launch<br />
of the Assiniboia Farmland Limited Partnership. The Farmland LP is one of the largest<br />
farmland fund in Canada, and has approximately 115,000 acres owned and under<br />
management. According to management, the farmland fund has returned a 20.2% IRR (net<br />
of fees) since inception. Assiniboia consisted of four separate LPs that were combined into a<br />
single entity in 2009. The December 31, 2010, audited statements for Assiniboia reported a<br />
Net Asset Value (“NAV”) of $30.30. The December 31, 2012 statements showed the NAV<br />
increased to $51.75.<br />
Management has previously operated three Limited Partnership (“LP”) private funds that<br />
invested in <strong>ca</strong>nola. These businesses had a very different model than <strong>Input</strong>. They were one<br />
year joint ventures with farmers, where the fund received a percentage of the crop yield for<br />
that year. This exposed the fund to volatility in yield due to weather, harvest, etc. The three<br />
LPs were formed in 2009, 2010 and 2011, and raised a total of $7.1 million. Returns data for<br />
the LPs are not available as they were private funds. However, as discussed below, the high<br />
percentage of investors who transferred their units to <strong>Input</strong> <strong>Capital</strong>, we believe, indi<strong>ca</strong>tes<br />
they were satisfied with their investment.<br />
LP unit holders were given the opportunity to convert their LP units into <strong>Input</strong> <strong>Capital</strong> shares<br />
in November 2012. At this time, the LPs had no business operations, their assets consisted<br />
only of <strong>ca</strong>sh and receivables. The majority of the investors in LP2 (87.1%), and LP3<br />
(90.8%), transferred their units into <strong>Input</strong> <strong>Capital</strong>. LP1, however, transferred only 25% of<br />
units into <strong>Input</strong> <strong>Capital</strong>, which is due to one large investor who controlled over 70% of the<br />
fund not transferring their shares. For LP 2 and 3, the <strong>ca</strong>sh and receivables held by the LPs<br />
were transferred to <strong>Input</strong> <strong>Capital</strong>. Cash and receivables of LP1 will be transferred as LP1 is<br />
still in the winding down process.<br />
Streaming<br />
business model<br />
Management states that the ‘streaming structure’ concept was derived from their<br />
experience operating the three previous <strong>ca</strong>nola funds, and the business model of<br />
established metals streaming businesses. Some of the key factors for creating a streaming<br />
public company are:<br />
• Farm operators prefer long-term <strong>ca</strong>pital commitments.<br />
• Management wanted to establish a permanent <strong>ca</strong>pital base instead of a<br />
partnership/fund structure where investors could redeem.<br />
© 2013 Fundamental Research Corp. “10 Years of Bringing Undiscovered Investment Opportunities to the Forefront “ www.researchfrc.com<br />
PLEASE READ THE IMPORTANT DISCLOSURES AT THE BACK OF THIS REPORT
Page 3<br />
• Public company status gives better access to <strong>ca</strong>pital.<br />
• There was more operational involvement for management in the joint ventures. With<br />
a streaming contract, management takes no operational control in the farm.<br />
The streaming business model and the differences between agriculture and metal streaming<br />
are discussed below.<br />
What is streaming<br />
There are many notable streaming companies in the metals industry as it is a popular way for<br />
companies to raise <strong>ca</strong>pital without taking on a large degree of debt or diluting shareholders<br />
through equity financings. Due to the high <strong>ca</strong>pital expenditure requirement for mines, metal<br />
streaming contracts allow for upfront payments in exchange for a portion of the metal mined<br />
in the future. Notable streaming companies in the mining industry include Silver Wheaton<br />
(NYSE: SLW; market <strong>ca</strong>pitalization - US$8 billion), Franco-Nevada Corporation (NYSE:<br />
FNV; market <strong>ca</strong>pitalization - $7 billion), Sandstorm Gold (TSX: SSL; market <strong>ca</strong>pitalization -<br />
$640 million), etc. These metal streamers trade at high P/E ratios, and P/CF, be<strong>ca</strong>use of<br />
their high earnings and <strong>ca</strong>sh flow projections in the future. They also have very strong<br />
EBIT margins, as shown in the table below.<br />
Company Ticker Price<br />
Price/<br />
Diluted EPS<br />
before extra P/CF Revenue (mm) EV ($, mm) EBIT Margins<br />
Sandstorm Gold TSX: SSL $ 6.11 43.7 15.6 55.9 547.6 37.9%<br />
Silver Wheaton TSX: SLW $ 23.73 17.2 12.0 886.2 8,989.5 70.6%<br />
Franco - Nevada Corp TSX: FNV $ 44.42 41.8 22.2 445.4 5,200.7 34.4%<br />
Royal Gold Nasdaq: RGLD $ 50.59 35.6 20.6 292 2,635.4 60.1%<br />
* Stock prices as of July 29, 2013<br />
* Revenue and EBIT margins for year ended December 31, 2012<br />
* P/Diluted EPS based on FY2013 estimate<br />
- Source: <strong>Capital</strong> IQ<br />
The following lists some of the benefits <strong>Input</strong> has over metal streamers.<br />
• Once <strong>ca</strong>pital is deployed, <strong>Input</strong> receives a return in the first year. For most metal<br />
streaming contracts, once <strong>ca</strong>pital is deployed, a mine and/or necessary infrastructure<br />
needs to be constructed, which <strong>ca</strong>n take years before the project sees <strong>ca</strong>sh flows.<br />
• Crop insurance provides protection against yield volatility. Metal streams have no<br />
insurance to guarantee a set amount of product.<br />
• <strong>Input</strong> <strong>Capital</strong> deploys their <strong>ca</strong>pital within the western provinces of Canada. Mining<br />
streamers, listed above, deploy <strong>ca</strong>pital worldwide, which increases politi<strong>ca</strong>l risks.<br />
The major downside to agriculture streaming is the life of the contract. For the initial<br />
payment, mining contracts are usually for the life of the mine, which <strong>ca</strong>n be 20+ years. <strong>Input</strong><br />
has short-term contracts that need to be renewed every 5-7 years. Despite this, we feel that<br />
the relationships <strong>Input</strong> will build with their operators (during the 5-7 year term) should lead<br />
to high renewal rates. Mines also have a finite life, where farms <strong>ca</strong>n continually produce,<br />
leading to good long term renewal prospects for <strong>Input</strong>.<br />
© 2013 Fundamental Research Corp. “10 Years of Bringing Undiscovered Investment Opportunities to the Forefront “ www.researchfrc.com<br />
PLEASE READ THE IMPORTANT DISCLOSURES AT THE BACK OF THIS REPORT
Page 4<br />
We feel that <strong>Input</strong> has a very strong management team, and board of directors, with<br />
experience in agriculture and finance. We also feel they have specific <strong>ca</strong>nola farming<br />
knowledge to successfully operate <strong>Input</strong>.<br />
Management<br />
Bios<br />
Brief biographies, as provided by management, are presented below:<br />
Doug Emsley- Director, President, and CEO<br />
Mr. Emsley is the President, Chief Executive Officer and Chairman of <strong>Input</strong>. He also serves<br />
in a similar <strong>ca</strong>pacity at Assiniboia <strong>Capital</strong> Corp., which currently manages a $150 million<br />
portfolio of Saskatchewan farmland on behalf of investors in Assiniboia Farmland Limited<br />
Partnership, which owns and rents approximately 115,000 acres of Saskatchewan farmland<br />
to farmers. Mr. Emsley has a wide array of business and professional experience. He is the<br />
President of Emsley & Associates (2002) Inc., which operates an executive business centre<br />
in downtown Regina, Chairman and CEO of Security Resource Group Inc. (an IT and<br />
physi<strong>ca</strong>l security firm), and Sabre West Oil & Gas Ltd. (an oil & gas company). Mr. Emsley<br />
previously built Vision Security & Investigations Inc. into the largest security firm in<br />
western Canada, before selling the company to Securitas Canada Limited. Mr. Emsley has<br />
also been appointed as a director of Information Services Corporation (TSX: ISV)<br />
Mr. Emsley is a director of the Bank of Canada, Greenfield Carbon Offsetters Inc., a<br />
start-up involved in the creation of <strong>ca</strong>rbon credits, the Public Policy Forum, and of the<br />
Saskatchewan Roughrider Football Club. He was previously a trustee of Royal Utilities<br />
Income Fund (RU.UN-T), then a TSX-listed income trust involved in the mining of thermal<br />
coal in western Canada, where he also served as Chair of the Audit Committee. Mr. Emsley<br />
has an MBA from York University in Toronto.<br />
Brad Farquhar: Director, Executive VP and CFO<br />
Mr. Farquhar co-founded <strong>Input</strong> and Assiniboia <strong>Capital</strong> Corp. with Mr. Emsley and serves as<br />
Executive Vice-President and Chief Financial Officer to both companies and as a director to<br />
<strong>Input</strong>. Mr. Farquhar is a trained financial planner and has completed the Canadian Securities<br />
Course of the Canadian Securities Institute. He received a Master of Public Administration<br />
degree in Electoral Governance from Griffith University in Australia, studied politi<strong>ca</strong>l<br />
science at Carleton University, and completed a Bachelor of Arts in Liberal Arts at<br />
Providence College. He has been engaged as an international consultant on matters related to<br />
the conduct of elections in Central Asia, the Middle East, and the Caribbean. He has also<br />
been a part-time faculty member in the Department of Politi<strong>ca</strong>l Science at the University of<br />
Regina. Mr. Farquhar previously served as Executive Director of the Saskatchewan Party (a<br />
politi<strong>ca</strong>l party forming the Official Opposition in Saskatchewan), and as Executive Assistant<br />
to the Leader of the Opposition in Saskatchewan.<br />
Mr. Farquhar is a Director of Greenfield Carbon Offsetters Inc., a start-up involved in the<br />
creation of <strong>ca</strong>rbon credits, the Frontier Centre for Public Policy, and Chair of the board of<br />
directors of SIM Canada. He is a former director of the International Centre for Human<br />
Rights and Democratic Development and the Regina & District Chamber of Commerce.<br />
© 2013 Fundamental Research Corp. “10 Years of Bringing Undiscovered Investment Opportunities to the Forefront “ www.researchfrc.com<br />
PLEASE READ THE IMPORTANT DISCLOSURES AT THE BACK OF THIS REPORT
Page 5<br />
Gord Nystuen – Vice-President, Market Development<br />
Mr. Nystuen is currently the Vice-President, Market Development of <strong>Input</strong>. He has played an<br />
important role in the development and growth of <strong>Input</strong>’s <strong>ca</strong>nola streaming business. He has<br />
an extensive background in a variety of senior roles in the Saskatchewan Government,<br />
including Vice-President, Corporate Affairs, at Saskatchewan Power Corporation, Deputy<br />
Minister of Agriculture, Chief of Staff to the Premier, Chairman of Saskatchewan Crop<br />
Insurance Corporation, and a variety of other roles in transportation, gaming, health, and<br />
finance. He has also been a director of the Saskatchewan Trade & Export Partnership<br />
(STEP), and the Saskatchewan Agrivision Corporation. Prior to his roles in government, Mr.<br />
Nystuen had a background in commercial and agricultural lending. Mr. Nystuen is a director<br />
of Avena Foods Ltd., a specialized oat processor based in Regina. He grew up on a farm near<br />
Nai<strong>ca</strong>m, Saskatchewan, and is a partner in Golden Acres Seed Farm. In 2009, Mr. Nystuen<br />
managed a project for Assiniboia <strong>Capital</strong> Corp. on behalf of a large corporate client<br />
conducting a $20 million land acquisition program in Saskatchewan.<br />
Board of<br />
Directors<br />
David A. Brown, Q.C. – Director<br />
Mr. Brown is Counsel at Davies Ward Phillips & Vineberg LLP. Mr. Brown served as<br />
chairman and Chief Executive Officer of the Ontario Securities Commission (OSC) from<br />
April 1998 to June 2005. Prior to joining the OSC, he was a senior corporate law partner<br />
with a predecessor firm to Davies Ward Phillips & Vineberg for 29 years, focusing on<br />
mergers and acquisitions, corporate finance and reorganization. He is a Director and Member<br />
of the Funds Advisory Board at Invesco Trimark Group of Mutual Funds and a Member of<br />
the Investment Advisory Board at Westerkirk <strong>Capital</strong> Inc. In addition, Mr. Brown is a<br />
member of the Dean’s Advisory Council at the Wilfrid Laurier School of Business and<br />
Economics, the founding chair of the Council of Governors for the Canadian Public<br />
Accountability Board, and a standing Member of the Audit and Assurances Standards<br />
Oversight Council. Mr. Brown is a past chair of the Techni<strong>ca</strong>l Committee and a member of<br />
the Executive Committee of the International Organization of Securities Commissions. He<br />
was appointed Queen's Counsel in 1984, a member of the Order of Canada in 2009 and he<br />
received the Queen’s Jubilee Medal in 2012. Mr. Brown received an honorary doctorate of<br />
laws from McMaster University in 2005, his LL.B from the University of Toronto in 1966<br />
and his Bachelor's degree in Civil Engineering from Carleton University in 1963.<br />
David Laidley –Director<br />
Mr. Laidley is Chairman Emeritus of Deloitte LLP (Canada), an audit and financial services<br />
firm, where he was a partner from 1975 until his retirement in 2007. Mr. Laidley served as<br />
Chairman of Deloitte & Touche LLP from 2000 to 2006 and during that time, he also served<br />
on the Global Board of Deloitte Touche Tohmatsu as well as its Governance Committee and<br />
he chaired its Audit Committee. As a chartered accountant, he has enjoyed a distinguished<br />
<strong>ca</strong>reer spanning 40 years with Canada’s largest professional services firm, with<br />
specialization in its tax and audit practices. Applying his background in tax, he has<br />
counseled many clients in the areas of corporate reorganizations, acquisitions and<br />
divestitures. Mr. Laidley serves on the boards of Aimia Inc., EMCOR Group Inc., ProSep<br />
© 2013 Fundamental Research Corp. “10 Years of Bringing Undiscovered Investment Opportunities to the Forefront “ www.researchfrc.com<br />
PLEASE READ THE IMPORTANT DISCLOSURES AT THE BACK OF THIS REPORT
Page 6<br />
Inc., Bank of Canada, Nautilus Indemnity Holdings Limited (where he is Chairman), and on<br />
a number of other boards of private institutions and foundations. Mr. Laidley is a Fellow of<br />
the Ordre des comptables professionnels agréés du Québec (CPA) and holds a Bachelor of<br />
Commerce degree from McGill University.<br />
Dr. Lorne Hepworth – Director<br />
Dr. Hepworth is President of CropLife Canada, the national trade association representing<br />
developers, manufacturers and distributors of plant science innovations for use in agriculture,<br />
urban and public health settings. Dr. Hepworth is currently the Chair of the Board of<br />
Genome Canada, a member of the Board of CARE Canada and on the Canadian<br />
International Food Security Research Fund Scientific Advisory Committee. He is also a<br />
member of the Independent Review Committee for Assiniboia Farmland Limited<br />
Partnership. He recently served on the Expert Panel on Sustainability Management of Water<br />
in Agriculture. He has served as a member of the Advisory Board of the National Research<br />
Council of Canada, Plant Biotechnology Institute, the Canadian Agri-Food Research<br />
Council, the federal Pest Management Advisory Committee and National Biotechnology<br />
Advisory Committee. A graduate of the Western College of Veterinary Medicine at the<br />
University of Saskatchewan (1971), Dr. Hepworth was a veterinarian in Alberta and<br />
Saskatchewan until 1982, when he was elected to Saskatchewan’s Legislative Assembly. He<br />
subsequently served nine years in Cabinet, during which he was minister of Agriculture,<br />
Edu<strong>ca</strong>tion, Finance, and Energy and Mines. From 1993 to 1997, he held several executive<br />
positions with the Canadian Agra group of companies specializing in agri-food/feed<br />
production, processing and marketing.<br />
Agriculture as<br />
an Asset Class<br />
The following discusses the key features of investing in agriculture.<br />
Diversifi<strong>ca</strong>tion benefits: The correlation (December 2010 – April 2013) between soybeans<br />
and the S&P 500 is 0.29, which indi<strong>ca</strong>tes that soybeans offer good diversifi<strong>ca</strong>tion benefits.<br />
We feel that soybeans and <strong>ca</strong>nola are highly correlated be<strong>ca</strong>use they have similar<br />
appli<strong>ca</strong>tions. The charts below illustrate the above two points.<br />
Source: <strong>Capital</strong>ogix<br />
© 2013 Fundamental Research Corp. “10 Years of Bringing Undiscovered Investment Opportunities to the Forefront “ www.researchfrc.com<br />
PLEASE READ THE IMPORTANT DISCLOSURES AT THE BACK OF THIS REPORT
Page 7<br />
Source: Barchart<br />
Inflation: Intuitively, soybeans/<strong>ca</strong>nola should provide a hedge against inflation, similar to<br />
asset <strong>ca</strong>tegories, such as land and commodities. However, various studies that analyzed the<br />
price of soybeans from 1960-2012, have shown that there is no statisti<strong>ca</strong>lly signifi<strong>ca</strong>nt<br />
relationship between inflation and soybean prices.<br />
Strategy/Process<br />
The following presents an overview of the streaming process:<br />
<strong>Input</strong> enters into a contract with a farmer, whereby <strong>Input</strong> advances <strong>ca</strong>pital to the farmer for a<br />
term of 5-7 years. In return, <strong>Input</strong> receives the right to purchase a set amount of tonnage<br />
(“base tonnage”) at a fixed price. The fixed price, based on management’s current estimates,<br />
<strong>ca</strong>n be anywhere between $0 and $100 per tonne. <strong>Input</strong> may also purchase “bonus tonnage”<br />
from the farmer at the same set fixed price. The bonus tonnage will be based on the excess<br />
yield over the farmer’s long run average yield. The following diagram illustrates the typi<strong>ca</strong>l<br />
process.<br />
© 2013 Fundamental Research Corp. “10 Years of Bringing Undiscovered Investment Opportunities to the Forefront “ www.researchfrc.com<br />
PLEASE READ THE IMPORTANT DISCLOSURES AT THE BACK OF THIS REPORT
Page 8<br />
Source: FRC<br />
<strong>Input</strong><br />
Streaming<br />
Contracts<br />
The first step in the streaming contract process is adequately <strong>ca</strong>pitalizing the farmer so they<br />
<strong>ca</strong>n optimally farm their land. Management generally wants the farmer to have $300 per<br />
acre of working <strong>ca</strong>pital, which they feel is the cost to optimally farm each acre. They will<br />
look at the farmer’s finances, historic yield, and conduct a financial analysis to structure a<br />
contract that is acceptable for both parties. After <strong>Input</strong> has an idea of the <strong>ca</strong>pital<br />
requirements required by the farmer, they will use a conservative <strong>ca</strong>nola price, and determine<br />
the amount of annual tonnage required to generate at least a 20% return.<br />
Estimated expenses incurred by a typi<strong>ca</strong>l <strong>ca</strong>nola farm operator, according to the Ontario<br />
Ministry of Agriculture and Food (“OMAF”), are shown in the table below. Keep in mind<br />
that farming costs in Saskatchewan and the western provinces may have slight variations.<br />
As shown in the chart, fertilizer is the largest expense in farming, followed by seeding. We<br />
feel that the $300 per acre working <strong>ca</strong>pital target <strong>Input</strong> has set would meet the needs of the<br />
majority of farmers. It would also allow some additional <strong>ca</strong>pital for unexpected expenses.<br />
Keep in mind, that streaming contract financing may decrease some of these costs (for<br />
example, be<strong>ca</strong>use financing is received upfront, the farmer <strong>ca</strong>n make better purchase timing<br />
decisions with regard to items like fertilizer).<br />
© 2013 Fundamental Research Corp. “10 Years of Bringing Undiscovered Investment Opportunities to the Forefront “ www.researchfrc.com<br />
PLEASE READ THE IMPORTANT DISCLOSURES AT THE BACK OF THIS REPORT
Page 9<br />
Source: Ontario Ministry of Agriculture and Food<br />
.<br />
An example of a streaming contract is shown below for a $1 million initial payment. Based<br />
on the price of <strong>ca</strong>nola less annual payments (fixed price), an annual base tonnage is set.<br />
Farms usually only have a percentage of their land seeded with Canola, but <strong>ca</strong>n use the initial<br />
payment for the whole farm. On average, <strong>Input</strong> will require 0.52 tonnes of <strong>ca</strong>nola per acre<br />
per year from the farmer. Over the last 5 years, the average tonnes per acre per year<br />
produced in Canada was 0.75 tonnes, indi<strong>ca</strong>ting that <strong>Input</strong> receives approximately 70% of<br />
the total production (as per this example). Since 1990, the lowest annual tonnage per acre in<br />
Canada was 0.49 tonnes, indi<strong>ca</strong>ting that the 0.52 tonne mark provides good coverage for<br />
<strong>Input</strong>’s yield.<br />
Initial Payment $1,000,000<br />
Contract Length (years) 5<br />
Canola Price ($/t) less fixed annual payment $ 400<br />
Annual CF required for a 20% IRR $335,000<br />
Base tonnes required 838<br />
Farm Size (Based on a $300 per acre initial payment) 3,333<br />
Canola Acres (based on average) 1,600<br />
Tonnes of <strong>ca</strong>nola per acre due to <strong>Input</strong> 0.52<br />
Average tonnes per acre over last 5 years (Canola Council) 0.75<br />
Yield coverage (Yield due to <strong>Input</strong>/Average yield) 70%<br />
© 2013 Fundamental Research Corp. “10 Years of Bringing Undiscovered Investment Opportunities to the Forefront “ www.researchfrc.com<br />
PLEASE READ THE IMPORTANT DISCLOSURES AT THE BACK OF THIS REPORT
Page 10<br />
Expected <strong>ca</strong>sh flows from the above contract:<br />
Year 0 Year 1 Year 2 Year 3 Year 4 Year 5<br />
Initial Investment $ (1,000,000)<br />
Canola Produced by the farm (tonnes) 1,200 1,200 1,200 1,200 1,200<br />
Canola to <strong>Input</strong> (base tonnes) 838 838 838 838 838<br />
Cash flow to input $ 335,000 $ 335,000 $ 335,000 $ 335,000 $ 335,000<br />
The above <strong>ca</strong>sh flows would return an IRR of 20%.<br />
Benefits of<br />
streaming<br />
contracts<br />
Currently, farmers use traditional farm financing options, the most notable being Farm<br />
Credit Canada, The Canola Cash Advance from Agriculture Canada, institutional lenders<br />
such as large banks / credit unions, equipment leasing companies and loans through<br />
manufacturers (such as John Deere (NYSE: JD) etc.<br />
The Canola Cash Advance is a low cost financing method available from the advance<br />
payment program offered by Agriculture Canada. The <strong>ca</strong>sh advance is available at different<br />
parts of the harvest cycle, but mainly right before seeding or at the completion of seeding.<br />
The <strong>ca</strong>sh advance has a maximum of $400,000, which does not provide for enough <strong>ca</strong>pital<br />
for larger farms.<br />
We feel that <strong>Input</strong> offers an attractive offering for farm financing over traditional sources<br />
be<strong>ca</strong>use it does not require the farmer to give up equity or incur additional debt. A few other<br />
key benefits of the streaming model, for farmers, are discussed below.<br />
• Maximize output<br />
<strong>Input</strong>’s streaming contracts allow farmers to expand their asset base, and optimally farm<br />
their acreage. Funds must be used for farming related expenses including purchase new<br />
equipment, seed more acreage, hire more staff, hire an agrologist, etc.<br />
• Long-term agreements<br />
<strong>Input</strong> offers a long-term financial solution for farmers looking to expand their operations.<br />
Financing from competitors are usually for one year or the life of the harvest. With a<br />
long-term contract, farmers <strong>ca</strong>n focus on growing and maximizing their operations<br />
without worrying about securing financing every year. We feel this is a signifi<strong>ca</strong>nt<br />
advantage over other financing options.<br />
• Can buy inputs (fertilizer, pesticides, etc.) at off-market times<br />
The inputs used for farming such as fertilizer and pesticides are produced year around<br />
and due to seasonal lows in demand, inputs are often discounted up to 30% to entice<br />
purchases and keep inventory moving. This typi<strong>ca</strong>lly occurs near the end of the growing<br />
season, when most farmers have utilized their available <strong>ca</strong>sh on the current crop. The<br />
cost savings is signifi<strong>ca</strong>nt, approximately 25%-40% of the total farm’s operating<br />
expenses are from input costs (Source: Ministry of Agriculture, Food and Rural Affairs,<br />
Ontario). This translates into up to a 12% savings on total operating costs if the farmers<br />
are able to purchase inputs at a discount. Management states that farmers also save by<br />
receiving discounts on inputs by paying <strong>ca</strong>sh, which could be as much as 3%.<br />
• Optimize sale time<br />
Canola prices are cycli<strong>ca</strong>l – prices tend to be the lowest right after harvest. Holding on<br />
to the <strong>ca</strong>nola and timing the sale <strong>ca</strong>n yield signifi<strong>ca</strong>nt price improvements. The graph<br />
© 2013 Fundamental Research Corp. “10 Years of Bringing Undiscovered Investment Opportunities to the Forefront “ www.researchfrc.com<br />
PLEASE READ THE IMPORTANT DISCLOSURES AT THE BACK OF THIS REPORT
Page 11<br />
below shows the seasonality of <strong>ca</strong>nola prices - prices are highest near May/June, and<br />
lowest in October/November. The price fluctuations are primarily due to seasonal supply<br />
levels. Most financing companies require payment once the crop is harvested, leading<br />
farmers to sell during the lower price period. <strong>Input</strong> <strong>Capital</strong> allows farm operators to sell<br />
at optimal times be<strong>ca</strong>use they do not have to pay <strong>ca</strong>sh at harvest.<br />
Source: The Progressive Farmer<br />
We feel that the benefits offered by <strong>Input</strong> <strong>Capital</strong> would be very appealing to farmers who<br />
have limited <strong>ca</strong>pital available. The operator <strong>ca</strong>n save through discounted farming inputs,<br />
<strong>ca</strong>sh discounts, and no interest charges. They <strong>ca</strong>n also increase their <strong>ca</strong>sh flow through yield<br />
enhancements and better timing of sale. Overall, we believe, the effective cost of <strong>ca</strong>pital<br />
for <strong>Input</strong>’s financing is likely to be much lower than traditional forms of financing for<br />
famers with inadequate working <strong>ca</strong>pital.<br />
Limiting risks<br />
of farming<br />
Due to the volatile nature of farming, <strong>Input</strong> has put in place a number of conditions on the<br />
farmer to help ensure they get their required yield.<br />
Factors to mitigate risks/ enhance crop yield<br />
• Farms must use a third party agrologist, which helps to enhance crops through<br />
scientific means like soil sampling, productivity assessments, etc. The farmer pays<br />
for the agrologist, with costs starting at around $5 per acre. The increase in yield will<br />
vary from farm to farm, depending on a variety of factors, but using professional<br />
services limits crop risk.<br />
• <strong>Input</strong> is looking to diversify its streaming contracts throughout Western Canada. By<br />
diversifying farm lo<strong>ca</strong>tions, it reduces the risks of weather and other conditions that<br />
could lead to a poor harvest.<br />
• Farmers must purchase crop insurance that covers 70% of the long-term average<br />
crop yield. The farmer covers the payment for the crop insurance. <strong>Input</strong> aims to<br />
keep their claim on the <strong>ca</strong>nola crops below 70%. If there is a poor crop, the farmer<br />
receives the insurance and <strong>ca</strong>n cover what is owed to <strong>Input</strong> with those funds. Since<br />
© 2013 Fundamental Research Corp. “10 Years of Bringing Undiscovered Investment Opportunities to the Forefront “ www.researchfrc.com<br />
PLEASE READ THE IMPORTANT DISCLOSURES AT THE BACK OF THIS REPORT
Page 12<br />
1986, the lowest crop yield was 60% of the last 5 year average.<br />
• Funds <strong>ca</strong>n only be used for farming related costs (fertilizer, fuel, pesticide, seeds<br />
etc.), pay down farming related debt, working <strong>ca</strong>pital, and to purchase equipment.<br />
• <strong>Input</strong> ensures that they have a claim on the assets of the farmer in <strong>ca</strong>se the farmer<br />
breaches the contract.<br />
• <strong>Input</strong> conducts extensive due diligence on each farmer. The due diligence process<br />
includes reviewing bank records, tax records, production records, payment schedules,<br />
leases, mortgages and previous crop insurance. In addition, they conduct land title<br />
searches and personal property registry. They do this to ensure that the farmer has a<br />
good history of meeting their obligations. <strong>Input</strong> also ensures the farm operators have<br />
the necessary skills and equipment to efficiently farm the land. Management also<br />
assesses the <strong>ca</strong>pital requirements of the farmer to see if their <strong>ca</strong>pital injection will<br />
benefit farming operations.<br />
• <strong>Input</strong> may also purchase and cover the cost of a life insurance policy on the farm<br />
operator equal to their initial investment. <strong>Input</strong> will be the beneficiary of the policy.<br />
• If the farmer <strong>ca</strong>nnot meet the owed tonnage, they <strong>ca</strong>n pay with another crop of equal<br />
value. <strong>Input</strong>’s management will determine the equivalent value of another crop.<br />
• Canola type and grade are specified in the contract to avoid farmers delivering poor<br />
quality product.<br />
Overall, we feel that <strong>Input</strong> has covered most of the major risks with farming and the<br />
streaming contract. We believe that the operation of the previous <strong>ca</strong>nola LPs helped them<br />
structure the contracts to mitigate risks.<br />
<strong>Input</strong> is still exposed to price risk, which will substantially affect the company’s<br />
performance. <strong>Input</strong> does not hedge the price of <strong>ca</strong>nola through derivative contracts.<br />
We feel this is a risk to investors due to the volatile nature of <strong>ca</strong>nola prices. However,<br />
hedging does not guarantee greater returns. Many of the public streaming companies do not<br />
hedge their long-term exposure to commodity prices.<br />
Target market<br />
Management will target farms growing <strong>ca</strong>nola with 3,000-15,000 acres of total acreage. The<br />
size of the farm may vary from this target. Canola usually makes up less than half of a<br />
farm’s total acreage. <strong>Input</strong> looks for farms in the dark brown, dark grey, and black soil<br />
zones of Alberta, Manitoba and Saskatchewan. These soil zones contain high organic<br />
matter, and are considered the best soil regions to grow <strong>ca</strong>nola. Currently, all the contracts<br />
<strong>Input</strong> has signed are lo<strong>ca</strong>ted in Saskatchewan. We estimate there are approximately 5,900<br />
farms in Western Canada that meet <strong>Input</strong>’s target market.<br />
<strong>Input</strong> will focus on farmers looking to expand their operations, but do not have adequate<br />
<strong>ca</strong>pital. We believe that younger farmers will continue to increase as older farmers<br />
retire, which will benefit <strong>Input</strong> in sourcing new farm operators. These younger<br />
operators will likely need <strong>ca</strong>sh to expand operations and maximize their yield. The 2011<br />
agriculture census in Canada reported that 48.3% of farm operators are over the age of 55.<br />
This is a large increase from 2006, where 40.7% were over 55, and 1991 at 32.1%.<br />
We also believe that the increasing price of agricultural land (as shown in the below chart)<br />
© 2013 Fundamental Research Corp. “10 Years of Bringing Undiscovered Investment Opportunities to the Forefront “ www.researchfrc.com<br />
PLEASE READ THE IMPORTANT DISCLOSURES AT THE BACK OF THIS REPORT
Page 13<br />
will <strong>ca</strong>use rent/mortgages to increase, and will increase the <strong>ca</strong>pital requirements of farmers.<br />
20<br />
18<br />
16<br />
14<br />
12<br />
10<br />
8<br />
6<br />
4<br />
2<br />
0<br />
Year over year percentage increase in farmland value<br />
Canada<br />
Alberta<br />
Saskatchewan<br />
Manitoba<br />
2006 2007 2008 2009 2010 2011 2012<br />
Source: Farm Credit Canada<br />
Deal Flow<br />
Management has developed strong connections / relationships with farmers through their<br />
experience managing the previous three <strong>ca</strong>nola LPs, and Assiniboia. Assiniboia’s farmlands<br />
have 75 <strong>ca</strong>nola farmers. In addition, <strong>Input</strong> has formed strategic relationships with large<br />
agriculture service companies, such as Agri-Trend and Farmers Edge, to help source<br />
additional farmers. There are no fees paid for referrals. Management estimates that as more<br />
farmers start using streaming contracts, awareness will increase be<strong>ca</strong>use of the benefits they<br />
offer.<br />
<strong>Input</strong> had approximately $23.5 million in deployable <strong>ca</strong>pital in November 2012 (including<br />
<strong>ca</strong>pital from receivables). The first streaming contract was entered into on January 15, 2013.<br />
As of early July, management states that $19 million has been deployed in streaming<br />
contracts.<br />
Management feels streaming contracts will likely be easier to source outside the<br />
growing season of May to September, be<strong>ca</strong>use farmers are not so focused on growing<br />
<strong>ca</strong>nola.<br />
Competition<br />
Competition from new streaming companies is a major risk to <strong>Input</strong>. There are few barriers<br />
to entry, and entrants may negatively affect returns. However, we feel that <strong>Input</strong> has<br />
developed relationships and industry knowledge over the last 8 years of agriculture<br />
investment, which gives them an operational advantage.<br />
<strong>Input</strong> <strong>Capital</strong> management indi<strong>ca</strong>ted that, at the current point in time, their focus is on<br />
Canola streaming. In the future, they may expand into other crops.<br />
Canola<br />
industry<br />
We will look at the <strong>ca</strong>nola industry, demand for <strong>ca</strong>nola and key factors affecting the<br />
industry.<br />
© 2013 Fundamental Research Corp. “10 Years of Bringing Undiscovered Investment Opportunities to the Forefront “ www.researchfrc.com<br />
PLEASE READ THE IMPORTANT DISCLOSURES AT THE BACK OF THIS REPORT
Page 14<br />
Canada is the largest <strong>ca</strong>nola exporting nation, and the largest producer in the world<br />
(Source: Conference Board of Canada 2011). The <strong>ca</strong>nola industry contributes<br />
approximately $15.4 billion to the Canadian economy each year. Canada is involved in<br />
all aspects of the <strong>ca</strong>nola value chain from genetics supply, farming, seed handling,<br />
transportation, crushing, refining and end uses, which generates an estimated 228,000 jobs<br />
for the Canadian economy (Source: Canola Council of Canada). Of the $15.4 billion, $5.4<br />
billion is generated from Saskatchewan, where production is the highest. The chart below<br />
shows the amount each province generates from the Canola businesses.<br />
Source: Canola Council of Canada (2011)<br />
Below is a graph summarizing the many uses of <strong>ca</strong>nola.<br />
Demand for <strong>ca</strong>nola seed, oil and meal has been trending up in the past de<strong>ca</strong>de as - a)<br />
more research on the benefits and uses of <strong>ca</strong>nola increases, b) government takes action to<br />
reduce or eliminate trans-fat in foods sold, c) <strong>ca</strong>nola as a bio-fuel additive, d) consumers<br />
adapting their diets to more healthy eating habits, and e) increasing world population.<br />
Sales of Canola<br />
in Canada<br />
Total <strong>ca</strong>sh receipts (revenue) for Canola in 2012 were $8.2 billion. Saskatchewan, Manitoba<br />
and Alberta accounted for the majority of the receipts as shown below. Alberta and<br />
Saskatchewan have strong increases in the amount of <strong>ca</strong>nola sold as shown below.<br />
© 2013 Fundamental Research Corp. “10 Years of Bringing Undiscovered Investment Opportunities to the Forefront “ www.researchfrc.com<br />
PLEASE READ THE IMPORTANT DISCLOSURES AT THE BACK OF THIS REPORT
Page 15<br />
Canola <strong>ca</strong>sh receipts (in $1,000s)<br />
Source: Statistics Canada<br />
Canada is by far the largest exporter of Canola in the world, accounting for 72% of the<br />
worldwide export market. Australia is second with 17%. The majority of <strong>ca</strong>nola is sent to<br />
China, and Japan, who account for 31%, and 27%, of worldwide imports, respectively.<br />
Below is a graph illustrating the increasing demand in Canada for <strong>ca</strong>nola seeds.<br />
Canola Seed Demand/Supply (000’ tonnes)<br />
Source: Canola Council of Canada<br />
Farms in<br />
Canada<br />
A breakdown of the number of farms in Canada according to varying characteristics is<br />
shown below. Our estimate of farms that meet <strong>Input</strong>’s target market is included.<br />
© 2013 Fundamental Research Corp. “10 Years of Bringing Undiscovered Investment Opportunities to the Forefront “ www.researchfrc.com<br />
PLEASE READ THE IMPORTANT DISCLOSURES AT THE BACK OF THIS REPORT
Page 16<br />
Canada Alberta Manitoba Saskatchewan<br />
Total Farms 205,730 43,234 15,877 36,952<br />
Farms over 2240 Acres 17,131 5,438 2,219 8,357<br />
Percentage of total farms over 2240 acres 8% 13% 14% 23%<br />
Canola Farms 35,073 11,889 6,151 15,736<br />
Canola Acreage 19 million 3.3 million 6 million 9.8 million<br />
Est. of Canola farms over 2240 acres 1,495 860<br />
Source: Statistics Canada Agriculture Census 2011<br />
3,559<br />
Farmland<br />
Canada<br />
The total farmland area in Canada has declined slightly over the last 3 de<strong>ca</strong>des. In<br />
1976, there was an estimated 169 million acres of farmland, 167 million acres in 2006, and<br />
160 million in 2011 (Source: Statistics Canada). The Canadian population increased from<br />
23.5 million in 1976, to 32.5 million in 2011. The following table shows the farm area,<br />
number of reporting farms and average area in Saskatchewan.<br />
Total Farm Area in Saskatchewan (1976 to 2011)<br />
1976 1986 1996 2006 2011<br />
Area in acres 65,511,431 65,728,443 65,653,588 64,253,845 61,628,148<br />
Farms reporting 70,958 63,431 56,995 44,329 36,952<br />
Average area 923 1,036 1,152 1,449 1,668<br />
(Source: Statistics Canada, Census of Agriculture )<br />
The area of farmland is decreasing and the average size of farms is increasing, while the<br />
number of farmers is decreasing. We think that the above shows farmers are increasing their<br />
farm size through mergers and takeovers of other farms. This trend of farmers’ to keep<br />
expanding their acreage is beneficial for <strong>Input</strong> as farmers will continue to need <strong>ca</strong>pital (for<br />
acquisition and/or working <strong>ca</strong>pital). The decreasing acreage of farmland should also put<br />
pressure on overall crop prices due to the limited supply.<br />
Canola pricing<br />
and outlook<br />
Canadian supply growth has slowed while demand for <strong>ca</strong>nola has been increasing which has<br />
led to a histori<strong>ca</strong>l increases in prices.<br />
Below is a graph of the average <strong>ca</strong>nola seed price over each <strong>ca</strong>lendar year from 2002-2013.<br />
Since 2008, the price of <strong>ca</strong>nola has been steadily trending up. Over the last 10 years, the<br />
price of Canola has ranged from the low $200’s to over $700 per tonne. The current price of<br />
<strong>ca</strong>nola is currently just below $500.<br />
© 2013 Fundamental Research Corp. “10 Years of Bringing Undiscovered Investment Opportunities to the Forefront “ www.researchfrc.com<br />
PLEASE READ THE IMPORTANT DISCLOSURES AT THE BACK OF THIS REPORT
Page 17<br />
Source:Barcharts<br />
We believe that slower growth in supply and increasing demand for <strong>ca</strong>nola will lead to<br />
increasing pricing for <strong>ca</strong>nola. We expect in the medium term the price to fluctuate around the<br />
current $500-550 level.<br />
Corporate<br />
Structure<br />
<strong>Input</strong> <strong>Capital</strong> went public on July 22, 2013, at a deemed price of $1.52, through a reverse<br />
takeover of WB II, a <strong>ca</strong>pital pool company (“CPC”).<br />
As of March 31, 2013, the fis<strong>ca</strong>l year end for <strong>Input</strong>, there were 34.8 million shares<br />
outstanding. The following summarizes the shares issued.<br />
• Private placements in 2012 raised $20.3 million by issuing 20.48 million units, or<br />
$0.995 per unit.<br />
• Acquisition of 25.7% of <strong>Input</strong> <strong>Capital</strong> Limited Partnership for 0.97 million shares,<br />
valued at $0.87 million, or $0.90 per share. Over 70% was held by one investor who<br />
did not want to convert to <strong>Input</strong> shares.<br />
• Acquisition of 87.1% of LP2 for 1.03 million shares and received of $0.95 million in<br />
<strong>ca</strong>sh and receivables, or $0.95 per share.<br />
• Acquisition of 90.8% of LP3 for 2.35 million shares and received $2.2 million in<br />
<strong>ca</strong>sh and receivables, or $0.95 per share.<br />
• 10 million founder shares, issued to <strong>Input</strong>’s management were issued for proceeds of<br />
$999. This was structured by GMP Securities L.P, the lead underwriter of the private<br />
placement.<br />
<strong>Input</strong> currently has 35,577,273 shares outstanding. The increase in shares is the result of<br />
shares given to WB II. The following shows the share structure, as of the July 5, 2013.<br />
© 2013 Fundamental Research Corp. “10 Years of Bringing Undiscovered Investment Opportunities to the Forefront “ www.researchfrc.com<br />
PLEASE READ THE IMPORTANT DISCLOSURES AT THE BACK OF THIS REPORT
Page 18<br />
Source: <strong>Input</strong> <strong>Capital</strong> Filing Statement (July 5, 2013)<br />
The following lists the terms of the outstanding options:<br />
• 2,864,601 options to management of the company with an exercise price of $1.00;<br />
expires on November 30, 2017.<br />
• 265,001 options to employees and consultants. The exercise price is $1.00; expires<br />
on November 30, 2017.<br />
• 78,125 options to WB II with an exercise price of $1.60 and expires April 24, 2022.<br />
• 15,625 options to agents of WB II with an exercise price of 1.60 and expiry date of<br />
April 24, 2022.<br />
• 350,000 options are expected to be issued to the board of directors and a consultant at<br />
a price of $1.28 per share and an 8 year expiry.<br />
All the options are currently “in the money”.<br />
Management and insiders control 29.87% of the outstanding shares and 34.46%, on a fully<br />
diluted basis. The shares held by management are subject to the following trading<br />
restrictions.<br />
• 10% available for immediate trading.<br />
• The next 20% of shares are available for trading in 6 months.<br />
• The next 30% shares are available for trading in 12 months.<br />
• The next 40% shares are available for trading in 18 months.<br />
Management compensation<br />
Mr. Emsley, Mr. Farquhar and Mr. Nystuen will receive an annual base salary of $100,000<br />
each.<br />
Financials<br />
<strong>Input</strong> <strong>Capital</strong> had no revenues for the year ended March 31, 2013. Although they raised<br />
<strong>ca</strong>pital in November 2012, and started deploying <strong>ca</strong>pital in January 2013, revenues are not<br />
received until late August - September. We feel to accurately review <strong>Input</strong>’s financial<br />
performance, investors should review annual performance, and not quarterly reports due to<br />
the seasonality of <strong>ca</strong>nola.<br />
For FY2012, <strong>Input</strong> had no revenues, and incurred a loss of $0.37 million (EPS: -$0.03). Our<br />
revenue fore<strong>ca</strong>sts for FY2013, and FY2014, are $6.58 million, and $8.53 million,<br />
respectively. The assumptions made for our estimates are discussed in the valuation section<br />
below. Our net income fore<strong>ca</strong>sts are $1.56 million (EPS: 0.04) in FY2013, and $2.25<br />
© 2013 Fundamental Research Corp. “10 Years of Bringing Undiscovered Investment Opportunities to the Forefront “ www.researchfrc.com<br />
PLEASE READ THE IMPORTANT DISCLOSURES AT THE BACK OF THIS REPORT
Page 19<br />
million (EPS: 0.06) in FY2014.<br />
Income Statement 2012 2013E 2014E<br />
<strong>Capital</strong> Deployed $ 6,000,000 $ 19,500,000 $ 25,282,288<br />
Base Tonnage Received N/A 14,625 18,962<br />
Avg Contract Price $ per tonne N/A $ 50 $<br />
50<br />
Avg Canola Price $ per tonne N/A $ 500 $<br />
500<br />
Sales $ - $ 6,581,250 $ 8,532,772<br />
COGS $ - $ - $<br />
-<br />
Gross Profit $ - $ 6,581,250 $ 8,532,772<br />
G&A Expenses $ (364,969) $ (1,200,000) $ (1,236,000)<br />
EBITDA $ (364,969) $ 5,381,250 $ 7,296,772<br />
Amortization $ (100) $ (3,250,000) $ (4,213,715)<br />
EBIT $ (365,069) $ 2,131,250 $ 3,083,058<br />
Non-recurring income (expenses) $ (121,105)<br />
Income before income tax (loss) $ (486,174) $ 2,131,250 $ 3,083,058<br />
Income tax (recovery) expense $ (116,568) $ 575,438 $ 832,425.55<br />
Net income (loss) $ (369,606) $ 1,555,813 $ 2,250,632<br />
Weighted average number of common shares $ 11,415,448 $ 35,577,273 $ 35,577,273<br />
Earnings per share (loss) $ (0.03) $ 0.04 $<br />
0.06<br />
Operating<br />
margins<br />
Our estimates of operating margins are shown below. When comparing margins with metal<br />
streamers, <strong>Input</strong> has lower EBIT margins due to the shorter contract length. This <strong>ca</strong>uses<br />
amortization of initial <strong>ca</strong>pital to be higher for <strong>Input</strong>.<br />
Margins 2012 2013E 2014E<br />
EBITDA N/A 82% 86%<br />
EBIT N/A 32% 36%<br />
Net N/A 24% 26%<br />
Cash Flow<br />
Our estimate of free <strong>ca</strong>sh flow (“FCF”) for FY2013 is $0.23 million. We anticipate that free<br />
<strong>ca</strong>sh flow in subsequent years will be reinvested into new streaming contracts.<br />
Cash Flows 2012 2013E 2014E<br />
Cash from Operating $ 955,369 $ 5,782,288 $ 6,529,954<br />
Cash from Investing $ (18,827,586) $ (3,833,349) $ (5,782,288)<br />
Cash from Financing $ 19,382,687 $ - $ -<br />
Net increase (decrease ) in <strong>ca</strong>sh $ 1,510,470 $ 1,948,939 $ 747,665<br />
Free Cash Flows to Firm $ (5,302,326) $ 227,447 $ 747,665<br />
Balance Sheet<br />
Key balance sheet ratios are shown below. The trailing ROE of comparable mining<br />
streamers is 11.7%.<br />
© 2013 Fundamental Research Corp. “10 Years of Bringing Undiscovered Investment Opportunities to the Forefront “ www.researchfrc.com<br />
PLEASE READ THE IMPORTANT DISCLOSURES AT THE BACK OF THIS REPORT
Page 20<br />
2012 2013E 2014E<br />
Liquidity Analysis<br />
Cash + Marketable Securities $ 14,316,375 $ 3,459,409 $ 4,207,075<br />
Working <strong>Capital</strong> $ 17,500,396 $ 8,054,104 $ 8,997,592<br />
Current Ratio 45 20 17<br />
ROE N/A 6.3% 8.5%<br />
Valuation<br />
For our valuation, we considered the following 3 scenarios.<br />
1. <strong>Input</strong> does not reinvest funds generated from operations, or raise any new equity to<br />
expand its existing portfolio. This is a very unlikely scenario.<br />
2. <strong>Input</strong> raises new equity to expand its portfolio - Although this is a realistic scenario,<br />
we feel that fore<strong>ca</strong>sting the terms of equity financings in the future (such as share<br />
price at the time of financing) is indeterminate at best.<br />
3. <strong>Input</strong> grows through reinvesting its free <strong>ca</strong>sh flows – this scenario is as likely as (2).<br />
However, we believe this scenario provides us a better indi<strong>ca</strong>tor of the fair value of<br />
the company, as it generates more predictable <strong>ca</strong>sh flows.<br />
The key assumptions we used in our model are:<br />
• We anticipate that <strong>Input</strong> reinvests all of their free <strong>ca</strong>sh flow until they have a <strong>ca</strong>pital<br />
base of $300 million. This will take 18 years. After this point, we assume the<br />
company maintains its asset base.<br />
• No debt or equity raised.<br />
• Discount rate of 10%<br />
• We use $450 per tonne as the long-term net price received by <strong>Input</strong>.<br />
• We assume no bonus tonnage is received by <strong>Input</strong>.<br />
Given these assumptions, our discounted <strong>ca</strong>sh flow model (DCF) gave a fair value estimate<br />
of $2.55 per share. The <strong>ca</strong>lculation is shown below.<br />
Discount Rate 10%<br />
Total PV $ 92,010,476<br />
Cash - Debt (at the end of FY2012) $ 1,510,470<br />
Equity Value $ 93,520,946<br />
Shares O/S (dil) * 36,651,724<br />
Value per share $2.55<br />
*Calculated based on the treasury stock method<br />
The table below shows our comparables valuation – which gave a fair value of $2.82 per<br />
share.<br />
© 2013 Fundamental Research Corp. “10 Years of Bringing Undiscovered Investment Opportunities to the Forefront “ www.researchfrc.com<br />
PLEASE READ THE IMPORTANT DISCLOSURES AT THE BACK OF THIS REPORT
Page 21<br />
<strong>Input</strong> Comparable<br />
<strong>Input</strong>'s FV<br />
Est.<br />
EV/ EBITDA 8.7 12.10 $2.51<br />
P/CF 10.3 17.60 $3.14<br />
Average $2.82<br />
*<strong>Input</strong>s metrics were based on our FY2014 estimates<br />
*Comparable metrics were based on the trailing average of metal streamers, and grain/bean<br />
industry players.<br />
Returns are extremely sensitive to the net <strong>ca</strong>nola prices received by <strong>Input</strong>. Our share<br />
estimates based on varying <strong>ca</strong>nola prices ranges from $0.64 to $8.12 per share.<br />
Sensitivity analysis - <strong>ca</strong>nola net prices<br />
Net price of <strong>ca</strong>nola $ 350 $ 400 $ 450 $ 500 $ 550<br />
DCF Model $ 0.64 $ 1.33 $ 2.55 $ 4.65 $ 8.12<br />
Comparable fair value $ 2.10 $ 2.46 $ 2.82 $ 3.20 $ 3.58<br />
Rating<br />
Risks<br />
Based on our valuation and outlook, we initiate coverage on <strong>Input</strong> <strong>Capital</strong> with a fair<br />
value of $3.00 per share, and BUY rating.<br />
The following risks, though not exhaustive, may <strong>ca</strong>use our estimates to differ from actual<br />
results:<br />
• <strong>Input</strong> <strong>Capital</strong> is the first to use an agriculture streaming model.<br />
• The company may need to raise additional <strong>ca</strong>pital through equity offerings and dilute<br />
current equity.<br />
• A decrease in the price of <strong>ca</strong>nola would negatively affect <strong>Input</strong>.<br />
• Timely Deployment of <strong>ca</strong>pital is crucial to the success of <strong>Input</strong> <strong>Capital</strong><br />
• There may be new entrants to the industry increasing competition for <strong>Input</strong>. This<br />
may negatively affect returns.<br />
• Farmers may breach contracts with <strong>Input</strong> <strong>Capital</strong>.<br />
• Expected returns will drop, or rise, if any of the inputs used in our base <strong>ca</strong>se scenario<br />
move unfavourably, or more favourably, respectively.<br />
© 2013 Fundamental Research Corp. “10 Years of Bringing Undiscovered Investment Opportunities to the Forefront “ www.researchfrc.com<br />
PLEASE READ THE IMPORTANT DISCLOSURES AT THE BACK OF THIS REPORT
Page 22<br />
Appendix<br />
<strong>Input</strong> <strong>Capital</strong> current Canola contracts<br />
Source: <strong>Input</strong> <strong>Capital</strong><br />
Income Statement 2012 2013E 2014E<br />
<strong>Capital</strong> Deployed $ 6,000,000 $ 19,500,000 $ 25,282,288<br />
Base Tonnage Received N/A 14,625 18,962<br />
Avg Contract Price $ per tonne N/A $ 50 $<br />
50<br />
Avg Canola Price $ per tonne N/A $ 500 $ 500<br />
Sales $ - $ 6,581,250 $ 8,532,772<br />
COGS $ - $ - $ -<br />
Gross Profit $ - $ 6,581,250 $ 8,532,772<br />
G&A Expenses $ (364,969) $ (1,200,000) $ (1,236,000)<br />
EBITDA $ (364,969) $ 5,381,250 $ 7,296,772<br />
Amortization $ (100) $ (3,250,000) $ (4,213,715)<br />
EBIT $ (365,069) $ 2,131,250 $ 3,083,058<br />
Non-recurring income (expenses) $ (121,105)<br />
Income before income tax (loss) $ (486,174) $ 2,131,250 $ 3,083,058<br />
Income tax (recovery) expense $ (116,568) $ 575,438 $ 832,425.55<br />
Net income (loss) $ (369,606) $ 1,555,813 $ 2,250,632<br />
Weighted average number of common shares $ 11,415,448 $ 35,577,273 $ 35,577,273<br />
Earnings per share (loss) $ (0.03) $ 0.04 $ 0.06<br />
© 2013 Fundamental Research Corp. “10 Years of Bringing Undiscovered Investment Opportunities to the Forefront “ www.researchfrc.com<br />
PLEASE READ THE IMPORTANT DISCLOSURES AT THE BACK OF THIS REPORT
Page 23<br />
Cash Flow Statement 2012 2013E 2014E<br />
Operating activities<br />
Net income (loss) for the year $ (369,606) $ 1,555,813 $ 2,250,632<br />
Adjustments<br />
Amortization of intangible assets $ 100 $ 3,250,000 $ 4,213,715<br />
Equity pick up <strong>Input</strong> <strong>Capital</strong> Limited Partnership $ 11,125<br />
Income tax (recovery) expense $ (116,568)<br />
Interest income $ (58,094)<br />
Share based payments $ 123,080<br />
Unrealized market value adjustment $ 120,721<br />
Interest received from marketable securities $ 5,905<br />
Changes in non-<strong>ca</strong>sh working <strong>ca</strong>pital $ 1,238,706 $ 976,476 $ 65,607<br />
$ 955,369 $ 5,782,288 $ 6,529,954<br />
Investing activities $ 5.05<br />
13%<br />
Acquisition of <strong>ca</strong>nola interests $ (6,133,703) $ (17,500,000) $ (5,782,288)<br />
Acquisition of marketable securities $ (15,500,000)<br />
Proceeds from sale marketable securities $ 2,694,095 $ 12,805,905<br />
Purchase of intangible assets $ (5,985)<br />
Cash acquired in partnership acquisitions $ 118,007 $ 860,746<br />
$ (18,827,586) $ (3,833,349) $ (5,782,288)<br />
Financing activities<br />
Shares issued $ 20,352,522 $ -<br />
Share issuance costs $ (969,835) $ -<br />
$ 19,382,687 $ - $ -<br />
Net increase (decrease ) in <strong>ca</strong>sh $ 1,510,470 $ 1,948,939 $ 747,665<br />
Cash – beginning of year - - - $ 1,510,470 $ 3,459,409<br />
Cash – end of year $ 1,510,470 $ 3,459,409 $ 4,207,075<br />
© 2013 Fundamental Research Corp. “10 Years of Bringing Undiscovered Investment Opportunities to the Forefront “ www.researchfrc.com<br />
PLEASE READ THE IMPORTANT DISCLOSURES AT THE BACK OF THIS REPORT
Page 24<br />
Balance Sheet 2012 2013E 2014E<br />
Assets<br />
Current<br />
Cash and <strong>ca</strong>sh equivalents $ 1,510,470 $ 3,459,409 $ 4,207,075<br />
Marketable securities $ 12,805,905 $ - $ -<br />
Current portion of <strong>ca</strong>nola interests$ 990,014 $ 3,377,164 $ 3,638,593<br />
Trade and other receivables $ 2,593,389 $ 1,645,313 $ 1,706,554<br />
$ 17,899,778 $ 8,481,885 $ 9,552,222<br />
Non Current<br />
Canola interests $ 5,022,968 $ 16,885,818 $ 18,192,963<br />
Investment in <strong>Input</strong> <strong>Capital</strong> LP $ 860,746 $ - $ -<br />
Deferred income tax assets $ 378,422 $ 378,422 $ 378,422<br />
Intangible assets $ 5,885 $ 5,885 $ 5,885<br />
$ 24,167,799 $ 25,752,011 $ 28,129,492<br />
Liabilities<br />
Current<br />
Trade and other payables $ 399,382 $ 427,781 $ 554,630<br />
Equity<br />
Share <strong>ca</strong>pital $ 23,653,482 $ 23,653,482 $ 23,653,482<br />
Contributed surplus $ 123,080 $ 123,080 $ 123,080<br />
Retained earnings (deficit) $ (364,798) $ 1,191,015 $ 3,441,647<br />
Non-controlling interests $ 356,653 $ 356,653 $ 356,653<br />
Total Equity $ 23,768,417 $ 25,324,230 $ 27,574,862<br />
Liabilities + SE $ 24,167,799 $ 25,752,011 $ 28,129,492<br />
© 2013 Fundamental Research Corp. “10 Years of Bringing Undiscovered Investment Opportunities to the Forefront “ www.researchfrc.com<br />
PLEASE READ THE IMPORTANT DISCLOSURES AT THE BACK OF THIS REPORT
Page 25<br />
Fundamental Research Corp. Equity Rating S<strong>ca</strong>le:<br />
Buy – Annual expected rate of return exceeds 12% or the expected return is commensurate with risk<br />
Hold – Annual expected rate of return is between 5% and 12%<br />
Sell – Annual expected rate of return is below 5% or the expected return is not commensurate with risk<br />
Suspended or Rating N/A— <strong>Coverage</strong> and ratings suspended until more information <strong>ca</strong>n be obtained from the company regarding recent events.<br />
Fundamental Research Corp. Risk Rating S<strong>ca</strong>le:<br />
1 (Low Risk) - The company operates in an industry where it has a strong position (for example a monopoly, high market share etc.) or operates in a regulated industry.<br />
The future outlook is stable or positive for the industry. The company generates positive free <strong>ca</strong>sh flow and has a history of profitability. The <strong>ca</strong>pital structure is<br />
conservative with little or no debt.<br />
2 (Below Average Risk) - The company operates in an industry where the fundamentals and outlook are positive. The industry and company are relatively less sensitive<br />
to systematic risk than companies with a Risk Rating of 3. The company has a history of profitability and has demonstrated its ability to generate positive free <strong>ca</strong>sh<br />
flows (though current free <strong>ca</strong>sh flow may be negative due to <strong>ca</strong>pital investment). The company’s <strong>ca</strong>pital structure is conservative with little to modest use of debt.<br />
3 (Average Risk) - The company operates in an industry that has average sensitivity to systematic risk. The industry may be cycli<strong>ca</strong>l. Profits and <strong>ca</strong>sh flow are sensitive<br />
to economic factors although the company has demonstrated its ability to generate positive earnings and <strong>ca</strong>sh flow. Debt use is in line with industry averages, and<br />
coverage ratios are sufficient.<br />
4 (Speculative) - The company has little or no history of generating earnings or <strong>ca</strong>sh flow. Debt use is higher. These companies may be in start-up mode or in a<br />
turnaround situation. These companies should be considered speculative.<br />
5 (Highly Speculative) - The company has no history of generating earnings or <strong>ca</strong>sh flow. They may operate in a new industry with new, and unproven products.<br />
Products may be at the development stage, testing, or seeking regulatory approval. These companies may run into liquidity issues, and may rely on external funding.<br />
These stocks are considered highly speculative.<br />
Disclaimers and Disclosure<br />
The opinions expressed in this report are the true opinions of the analyst about this company and industry. Any “forward looking statements” are our best estimates and<br />
opinions based upon information that is publicly available and that we believe to be correct, but we have not independently verified with respect to truth or correctness.<br />
There is no guarantee that our fore<strong>ca</strong>sts will materialize. Actual results will likely vary. The analyst and Fundamental Research Corp. “FRC” does not own any shares<br />
of the subject company, does not make a market or offer shares for sale of the subject company, and does not have any investment banking business with the subject<br />
company. Fees were paid by <strong>INP</strong> to FRC. The purpose of the fee is to subsidize the high costs of research and monitoring. FRC takes steps to ensure independence<br />
including setting fees in advance and utilizing analysts who must abide by CFA Institute Code of Ethics and Standards of Professional Conduct. Additionally, analysts<br />
may not trade in any security under coverage. Our full editorial control of all research, timing of release of the reports, and release of liability for negative reports are<br />
protected contractually. To further ensure independence, <strong>INP</strong> has agreed to a minimum coverage term including an initial report and three updates. <strong>Coverage</strong> <strong>ca</strong>n not be<br />
unilaterally terminated. Distribution procedure: our reports are distributed first to our web-based subscribers on the date shown on this report then made available to<br />
delayed access users through various other channels for a limited time. The performance of FRC’s research is ranked by Investars. Full rankings and are available at<br />
www.investars.com.<br />
The distribution of FRC’s ratings are as follows: BUY (69%), HOLD (8%), SELL (5%), SUSPEND (18%).<br />
To subscribe for real-time access to research, visit http://www.researchfrc.com/subscribe.php for subscription options.<br />
This report contains "forward looking" statements. Forward-looking statements regarding the Company and/or stock’s performance inherently involve risks and<br />
uncertainties that could <strong>ca</strong>use actual results to differ from such forward-looking statements. Factors that would <strong>ca</strong>use or contribute to such differences include, but are<br />
not limited to, continued acceptance of the Company's products/services in the marketplace; acceptance in the marketplace of the Company's new product lines/services;<br />
competitive factors; new product/service introductions by others; technologi<strong>ca</strong>l changes; dependence on suppliers; systematic market risks and other risks discussed in<br />
the Company's periodic report filings, including interim reports, annual reports, and annual information forms filed with the various securities regulators. By making<br />
these forward looking statements, Fundamental Research Corp. and the analyst/author of this report undertakes no obligation to update these statements for revisions or<br />
changes after the date of this report. A report initiating coverage will most often be updated quarterly while a report issuing a rating may have no further or less frequent<br />
updates be<strong>ca</strong>use the subject company is likely to be in earlier stages where nothing material may occur quarter to quarter.<br />
Fundamental Research Corp DOES NOT MAKE ANY WARRANTIES, EXPRESSED OR IMPLIED, AS TO RESULTS TO BE OBTAINED FROM USING THIS<br />
INFORMATION AND MAKES NO EXPRESS OR IMPLIED WARRANTIES OR FITNESS FOR A PARTICULAR USE. ANYONE USING THIS REPORT<br />
ASSUMES FULL RESPONSIBILITY FOR WHATEVER RESULTS THEY OBTAIN FROM WHATEVER USE THE INFORMATION WAS PUT TO. ALWAYS<br />
TALK TO YOUR FINANCIAL ADVISOR BEFORE YOU INVEST. WHETHER A STOCK SHOULD BE INCLUDED IN A PORTFOLIO DEPENDS ON ONE’S<br />
RISK TOLERANCE, OBJECTIVES, SITUATION, RETURN ON OTHER ASSETS, ETC. ONLY YOUR INVESTMENT ADVISOR WHO KNOWS YOUR<br />
UNIQUE CIRCUMSTANCES CAN MAKE A PROPER RECOMMENDATION AS TO THE MERIT OF ANY PARTICULAR SECURITY FOR INCLUSION IN<br />
YOUR PORTFOLIO. This REPORT is solely for informative purposes and is not a solicitation or an offer to buy or sell any security. It is not intended as being a<br />
complete description of the company, industry, securities or developments referred to in the material. Any fore<strong>ca</strong>sts contained in this report were independently prepared<br />
unless otherwise stated, and HAVE NOT BEEN endorsed by the Management of the company which is the subject of this report. Additional information is available<br />
upon request. THIS REPORT IS COPYRIGHT. YOU MAY NOT REDISTRIBUTE THIS REPORT WITHOUT OUR PERMISSION. Please give proper credit,<br />
including citing Fundamental Research Corp and/or the analyst, when quoting information from this report.<br />
The information contained in this report is intended to be viewed only in jurisdictions where it may be legally viewed and is not intended for use by any person or entity<br />
in any jurisdiction where such use would be contrary to lo<strong>ca</strong>l regulations or which would require any registration requirement within such jurisdiction.<br />
© 2013 Fundamental Research Corp. “10 Years of Bringing Undiscovered Investment Opportunities to the Forefront “ www.researchfrc.com<br />
PLEASE READ THE IMPORTANT DISCLOSURES AT THE BACK OF THIS REPORT