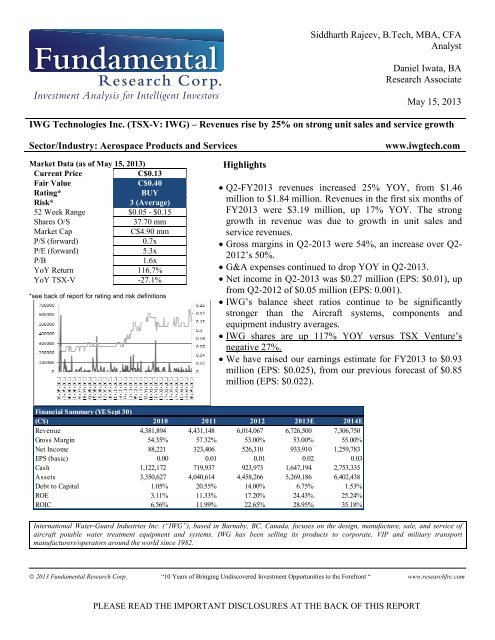
Siddharth Rajeev, B.Tech, MBA, CFA Analyst Daniel ... - Baystreet.ca
Siddharth Rajeev, B.Tech, MBA, CFA Analyst Daniel ... - Baystreet.ca
Siddharth Rajeev, B.Tech, MBA, CFA Analyst Daniel ... - Baystreet.ca

You also want an ePaper? Increase the reach of your titles
YUMPU automatically turns print PDFs into web optimized ePapers that Google loves.
<strong>Siddharth</strong> <strong>Rajeev</strong>, B.<strong>Tech</strong>, <strong>MBA</strong>, <strong>CFA</strong><br />
<strong>Analyst</strong><br />
<strong>Daniel</strong> Iwata, BA<br />
Research Associate<br />
May 15, 2013<br />
IWG <strong>Tech</strong>nologies Inc. (TSX-V: IWG) – Revenues rise by 25% on strong unit sales and service growth<br />
Sector/Industry: Aerospace Products and Services<br />
www.iwgtech.com<br />
Market Data (as of May 15, 2013)<br />
Current Price<br />
C$0.13<br />
Fair Value<br />
C$0.40<br />
Rating*<br />
BUY<br />
Risk*<br />
3 (Average)<br />
52 Week Range $0.05 - $0.15<br />
Shares O/S<br />
37.70 mm<br />
Market Cap<br />
C$4.90 mm<br />
P/S (forward) 0.7x<br />
P/E (forward) 5.3x<br />
P/B 1.6x<br />
YoY Return 116.7%<br />
YoY TSX-V -27.1%<br />
*see back of report for rating and risk definitions<br />
Highlights<br />
• Q2-FY2013 revenues increased 25% YOY, from $1.46<br />
million to $1.84 million. Revenues in the first six months of<br />
FY2013 were $3.19 million, up 17% YOY. The strong<br />
growth in revenue was due to growth in unit sales and<br />
service revenues.<br />
• Gross margins in Q2-2013 were 54%, an increase over Q2-<br />
2012’s 50%.<br />
• G&A expenses continued to drop YOY in Q2-2013.<br />
• Net income in Q2-2013 was $0.27 million (EPS: $0.01), up<br />
from Q2-2012 of $0.05 million (EPS: 0.001).<br />
• IWG’s balance sheet ratios continue to be signifi<strong>ca</strong>ntly<br />
stronger than the Aircraft systems, components and<br />
equipment industry averages.<br />
• IWG shares are up 117% YOY versus TSX Venture’s<br />
negative 27%.<br />
• We have raised our earnings estimate for FY2013 to $0.93<br />
million (EPS: $0.025), from our previous fore<strong>ca</strong>st of $0.85<br />
million (EPS: $0.022).<br />
Financial Summary (YE Sept 30)<br />
(C$) 2010 2011 2012 2013E 2014E<br />
Revenue 4,381,894 4,431,148 6,014,067 6,726,500 7,306,750<br />
Gross Margin 54.35% 57.32% 53.00% 53.00% 55.00%<br />
Net Income 88,221 323,406 526,310 933,910 1,259,783<br />
EPS (basic) 0.00 0.01 0.01 0.02 0.03<br />
Cash 1,122,172 719,937 923,973 1,647,194 2,753,335<br />
Assets 3,350,627 4,040,614 4,458,266 5,269,186 6,402,438<br />
Debt to Capital 1.05% 20.55% 14.00% 6.75% 1.53%<br />
ROE 3.11% 11.33% 17.20% 24.43% 25.24%<br />
ROIC 6.56% 11.99% 22.65% 28.95% 35.18%<br />
International Water-Guard Industries Inc. (“IWG”), based in Burnaby, BC, Canada, focuses on the design, manufacture, sale, and service of<br />
aircraft potable water treatment equipment and systems. IWG has been selling its products to corporate, VIP and military transport<br />
manufacturers/operators around the world since 1982.<br />
© 2013 Fundamental Research Corp. “10 Years of Bringing Undiscovered Investment Opportunities to the Forefront “ www.researchfrc.com<br />
PLEASE READ THE IMPORTANT DISCLOSURES AT THE BACK OF THIS REPORT
Page 2<br />
Q2 Revenues<br />
Up 25%YOY<br />
Q2-2013 revenues were $1.84 million versus $1.46 million in Q2-2012, reflecting YOY<br />
growth of 25%. Management attributed the increase in revenues to increased sales of water<br />
heaters and the IWG-A6 units, and service revenues.<br />
As mentioned in our previous reports, we feel that the IWG-A6 units will continue to lead<br />
the growth in revenues due to the increased production of the Gulfstream G650. We also<br />
estimate strong growth for the water heaters. Management says unit sales grew by 17% in<br />
the first 6 months of 2013, and service revenues were up 26%. Revenue growth in the first 6<br />
months was 16%YOY, higher than our expectations of a 12% increase for the entire<br />
FY2013. Despite revenues being higher than expected, we do not expect similar revenue<br />
growth in the second half, which typi<strong>ca</strong>lly generates a higher percentage of revenues. We<br />
have maintained our revenue fore<strong>ca</strong>sts for FY2013, and FY2014, at $6.73 million, and<br />
$7.31 million, respectively.<br />
Gross<br />
Margins<br />
Improving<br />
Gross margins in Q2-FY2013 were 54%, a strong improvement over the 50% in Q2-<br />
FY2012. The increased Q2-FY2013 margins raised the 6 month FY2013 gross margin to<br />
52% (Q1-2013 margins were 49%). We feel that gross margins will remain around the 53%<br />
mark in subsequent quarters and are maintaining our estimate.<br />
Margins 2011-Q2 2012-Q2 2013-Q2 Industry Avg<br />
Gross 51.2% 49.6% 53.7% 15.3%<br />
EBITDA 2.4% 7.6% 24.7% 11.2%<br />
EBIT 1.2% 4.8% 24.7% 7.7%<br />
EBT 0.3% 3.6% 24.2%<br />
Net 2.6% 3.6% 14.5% 4.6%<br />
Expenses<br />
Decreasing<br />
EBIT and net margins also showed strong increases as expenses decreased YOY in Q2-<br />
FY2013. Selling expenses, research and development (R&D) and general and administrative<br />
(G&A) expenses were all lower than Q2-2012, as shown below.<br />
Expenses / Sales 2011-Q2 2012-Q2 2013-Q2<br />
Selling Expenses 6.7% 6.9% 4.8%<br />
R&D 11.2% 13.7% 8.7%<br />
G & A 30.6% 21.4% 15.6%<br />
Stock Option Compensation 0.3% 0.0% 0.0%<br />
Total 48.9% 42.0% 29.1%<br />
Selling expenses decreased by 12% in Q2-2013 over the same period in FY2012. For the<br />
first 6 months in FY2013, despite the growth in revenue, selling expenses remained almost<br />
identi<strong>ca</strong>l to FY2012, decreasing by just $2,000. Management says the decrease in selling<br />
costs was the results of not attending any trade shows. As the timing of trades shows do not<br />
always fall at the same time every year, we anticipate this expense will be realized in a<br />
subsequent quarter. We anticipate that sales costs will rise in subsequent quarters and have<br />
maintained our previous estimate of selling expenses increasing by 18%YOY in FY2013.<br />
R&D costs were down 20% for Q2- 2013 over Q2-2012. R&D costs have decreased by 27%<br />
© 2013 Fundamental Research Corp. “10 Years of Bringing Undiscovered Investment Opportunities to the Forefront “ www.researchfrc.com<br />
PLEASE READ THE IMPORTANT DISCLOSURES AT THE BACK OF THIS REPORT
Page 3<br />
YOY in the first 6 months of FY2013. We mentioned in our Q1-FY2013 report that the<br />
decrease was due to <strong>ca</strong>sh received in a development partnership, and <strong>ca</strong>pitalized research<br />
costs. We feel that R&D is in line with our FY2013 estimates.<br />
G&A decreased by 9% YOY for Q2-FY2013 over Q2-FY2012. Management says that the<br />
reduction in costs was due to FY2012 (acquisition and new product releases) being higher<br />
than normal and feels that G&A will not change signifi<strong>ca</strong>ntly from current levels. In our<br />
previous report, we anticipated G&A to rise with increasing sales and fore<strong>ca</strong>sted an increase<br />
of 12% for FY2013. G&A is down 10% in the first 6 months of FY2013, and we have<br />
revised our current G&A estimate to reflect the decrease, anticipating that G&A will be 10%<br />
lower than our anticipated FY2013 figure. We have also lowered our FY2014 G&A<br />
estimate.<br />
Net Income<br />
up 71%YOY<br />
in H1-2013<br />
With the higher revenue, increased margins, and decrease in operating expenses, IWG posted<br />
Q2 EBIT of $0.45 million, a signifi<strong>ca</strong>nt increase over the $0.07 million in Q2-2012. For the<br />
first 6 months of FY2013, EBIT was $0.63 million, up 181%YOY.<br />
For Q2-FY2013, due to currency fluctuations, there was a foreign exchange loss of $83,256,<br />
compared to a gain of $38,864 in Q2-FY2012. Despite this, net income was $0.27 million<br />
(EPS: $0.007) for Q2-FY2013, compared to Q2-FY2012’s $0.04 million ($0.001). For the<br />
first 6 months of FY2013, net income was up 71% to $0.37 million (EPS: $0.01) million.<br />
Due to revisions to our G&A expense estimates, we have raised our fore<strong>ca</strong>sted earnings<br />
for FY2013 to $0.93 million (EPS: $0.025), from $0.85 million (EPS: $0.022). For<br />
FY2014, our revised fore<strong>ca</strong>st is earnings of $1.26 million (EPS: $0.033), up from $1.05<br />
million (EPS:$0.028)<br />
Free <strong>ca</strong>sh flows for the first 6 months of FY2013 were $0.07 million. Although funds from<br />
operations increased substantially in H1-2013, a signifi<strong>ca</strong>nt increase in accounts receivable<br />
decreased <strong>ca</strong>sh from operations. Accounts receivable rose due to sales late in the quarter,<br />
which management expects should be collected in the next quarter.<br />
2011- 6 mo 2012-6 mo 2013- 6 mo<br />
Cash Flow from Operation 191,034 113,299 225,106<br />
Cash Flow from Financing (137,814) (57,668) (67,924)<br />
Cash Flow from Investing (61,628) (93,896) (154,272)<br />
Net Change in Cash (8,408) (38,265) 2,910<br />
FCF 129,406 19,403 70,834<br />
Strong<br />
balance sheet<br />
As the table below shows, IWG’s balance sheet ratios continue to be signifi<strong>ca</strong>ntly<br />
stronger than the industry averages. Their EBIT interest coverage rose due to strong EBIT<br />
and decreasing interest expense.<br />
© 2013 Fundamental Research Corp. “10 Years of Bringing Undiscovered Investment Opportunities to the Forefront “ www.researchfrc.com<br />
PLEASE READ THE IMPORTANT DISCLOSURES AT THE BACK OF THIS REPORT
Page 4<br />
Liquidity Analysis Q2-2011 Q2-2012 Q2-2013 Industry Avg.<br />
Working Capital $2,184,285 $1,795,605 $2,375,383<br />
Current Ratio 7.16 4.32 3.95 1.90<br />
Debt / Capital 0.7% 10.0% 11.6% 27.6%<br />
EBIT Interest Coverage Ratio 8.29 4.04 48.15 8.60<br />
Stock Options<br />
and Warrants<br />
Valuation<br />
and Rating<br />
The company currently has 1.78 million options outstanding with a weighted average<br />
exercise price of $0.10. Currently, all the options are ‘in-the-money’ – we estimate the<br />
company <strong>ca</strong>n raise up to $0.17 million if all these options are exercised.<br />
The aircraft systems, components and equipment average (trailing) Enterprise Value (EV) to<br />
Revenue, and EV/EBITDA ratios are 1.0x and 8.4x, versus IWG's forward ratios of 0.7x and<br />
3.0x, respectively.<br />
Our DCF valuation increased from $0.36 to $0.37 as we lowered our G&A expense<br />
estimates. We maintain our BUY rating and fair value estimate at $0.40 per share.<br />
Risk<br />
The following risks, though not exhaustive, will <strong>ca</strong>use our estimates to differ from actual<br />
results:<br />
• Growth of the company is highly dependent on the overall health of the aerospace<br />
industry<br />
• IWG’s revenues are dependent on aircraft delivery rates and are subject to industry<br />
cycles and customer adoption of its products.<br />
• A signifi<strong>ca</strong>nt portion of revenues is non-recurring. However, it is worth noting that<br />
IWG has been getting repeat business from several clients.<br />
• The company has yet to break into the commercial aircraft sector, the largest market<br />
in the aerospace industry.<br />
• Foreign exchange fluctuation risks: Most of IWG’s sales are in US dollars.<br />
© 2013 Fundamental Research Corp. “10 Years of Bringing Undiscovered Investment Opportunities to the Forefront “ www.researchfrc.com<br />
PLEASE READ THE IMPORTANT DISCLOSURES AT THE BACK OF THIS REPORT
Page 5<br />
Appendix<br />
STATEMENTS OF OPERATIONS<br />
(in C$) 2011 2012 2013E 2014E<br />
Sales 4,431,148 6,014,067 6,726,500 7,306,750<br />
COGS 1,891,372 2,809,043 3,161,455 3,288,038<br />
Gross Profit 2,539,776 3,205,024 3,565,045 4,018,713<br />
Expenses<br />
Selling Expenses 384,260 399,951 470,855 511,473<br />
Research&Development 428,035 719,089 605,385 657,608<br />
General & Administration 1,152,063 1,026,180 923,562 992,829<br />
Stock Option Compensation 8,606 - 67,265 73,068<br />
Foreign exchange loss(gain) 64,726 (118,924)<br />
EBITDA 502,086 1,178,728 1,497,978 1,783,736<br />
Amortization 82,476 193,659 197,350 189,599<br />
EBIT 419,610 985,069 1,300,628 1,594,137<br />
Interest & Bank Charges 31,455 48,865 30,584 19,408<br />
Earnings from operations, before undernoted 388,155 936,204 1,270,044 1,574,729<br />
Share restructuring costs (95,584)<br />
Government Assistance<br />
Gains on settlement of notes and accounts payable - - - -<br />
Gain on sale of commeri<strong>ca</strong>l division assets - - - -<br />
Foreign Exchange (102,657)<br />
Wite-down of assets and costs - - - -<br />
Extraordinary (294,666)<br />
EBT 292,571 641,538 1,167,387 1,574,729<br />
Taxes/(Income Tax Recovery) (30,835) 115,228 233,477 314,946<br />
Net Earnings for the period 323,406 526,310 933,910 1,259,783<br />
EPS 0.0085 0.014 0.0248 0.0334<br />
© 2013 Fundamental Research Corp. “10 Years of Bringing Undiscovered Investment Opportunities to the Forefront “ www.researchfrc.com<br />
PLEASE READ THE IMPORTANT DISCLOSURES AT THE BACK OF THIS REPORT
Page 6<br />
BALANCE SHEETS<br />
(in C$) 2010 2011 2012 2013E 2014E<br />
Assets<br />
Cash 1,122,172 719,937 923,973 1,647,194 2,753,335<br />
Accounts receivable 880,150 884,411 909,236 1,079,335 1,172,442<br />
Inventory 569,976 624,115 897,801 859,181 893,582<br />
Prepaid Expenses 75,696 88,924 66,197 69,560 72,345<br />
Future Income Tax 70,000 - - -<br />
Current Assets 2,717,994 2,317,387 2,797,207 3,655,270 4,891,704<br />
LT Receivables 94,000 102,164 102,164 102,164<br />
Equipment & Furniture 213,363 222,913 226,797 229,689 233,356<br />
Deferred Dev Costs and foreign exchange loss 178,170 334,641 439,946 429,381 360,451<br />
Future income tax assets 241,100 473,735 358,507 358,507 358,507<br />
Intangibles 597,938 533,645 494,175 456,255<br />
Total Assets 3,350,627 4,040,614 4,458,266 5,269,186 6,402,438<br />
Liabilities & Shareholders' Equity<br />
Accounts Payables & Accrued Liabilities 409,381 520,753 594,434 632,291 657,608<br />
Demand / Factoring Loan - - - - -<br />
Customer Deposits, Bank and Shareholder's loan<br />
Loans and borrowings 19,231 214,769 228,244 224,915 76,481<br />
Current portion of notes payable -<br />
Current portion of royality provision -<br />
Current Liabilities 428,612 735,522 822,678 857,206 734,088<br />
Convertible Debentures<br />
Loans and borrowings 11,566 508,513 312,699 87,915 11,434<br />
Royality provision - -<br />
Notes and Loans payable - - -<br />
Shareholder's Equity<br />
Share Capital 8,103,112 2,496,322 2,496,322 2,496,322 2,496,322<br />
Contributed surplus 227,528 2,868 2,868 70,133 143,201<br />
Deficit (5,420,191) 297,389 823,699 1,757,609 3,017,392<br />
Total Liabilities & Shareholders' Equity 3,350,627 4,040,614 4,458,266 5,269,186 6,402,438<br />
© 2013 Fundamental Research Corp. “10 Years of Bringing Undiscovered Investment Opportunities to the Forefront “ www.researchfrc.com<br />
PLEASE READ THE IMPORTANT DISCLOSURES AT THE BACK OF THIS REPORT
Page 7<br />
STATEMENTS OF CASH FLOWS<br />
(in C$) 2011 2012 2013E 2014E<br />
Operating Activities<br />
Net earnings for the period 323,406 526,310 933,910 1,259,783<br />
Items not involving <strong>ca</strong>sh<br />
Income tax recovery (30,835) 115,228<br />
Gain on liabilities and sale of commeri<strong>ca</strong>l division<br />
Book value of assets sold<br />
Unreallized foreign exchange and other gains 11,118 (33,987)<br />
Compensation related to stock option plan 8,606 - 67,265 73,068<br />
Write-downs<br />
Interest accrued(on NP, on shareholer loan) 31,455 48,865<br />
Amortization and equipment write-down 82,475 193,659 197,350 189,599<br />
Change in value of forward contracts 197,145 (227,042)<br />
623,370 623,033 1,198,525 1,522,450<br />
Changes in non-<strong>ca</strong>sh operating working <strong>ca</strong>pital<br />
Accounts receivable (128,424) 27,072 (170,099) (93,107)<br />
Inventory (27,011) (273,686) 38,620 (34,401)<br />
Prepaid expenses (13,228) 22,727 (3,363) (2,785)<br />
Accounts payable and accrued liabilities (55,609) 240,662 37,857 25,317<br />
Customer Deposits - - - -<br />
Provisions<br />
(224,272) 16,775 (96,985) (104,977)<br />
Cash from from (used in) operations 399,098 639,808 1,101,540 1,417,473<br />
Investing activities<br />
Purchase of furniture and equipment (29,256) (22,627) (22,627) (22,627)<br />
Product development costs incured (185,270) (170,106) (127,580) (63,790)<br />
Acquisition Costs - - -<br />
Purchase of Intangible assets (360,750)<br />
Proceeds on sale of commeri<strong>ca</strong>l division<br />
Deferred Development Costs<br />
(575,276) (192,733) (150,207) (86,417)<br />
Financing activities<br />
Proceeds(repayments) of demand loans (4,146) (106,069) - -<br />
Proceeds (repayments) of payables and leases (17,923) (16,688) (228,113) (224,915)<br />
Repayment of royalties liability (88,642) (120,281) - -<br />
Convertible debenture issued<br />
Issue of common share for <strong>ca</strong>sh - - -<br />
Purchase of <strong>ca</strong>pital stock (115,346)<br />
(226,057) (243,038) (228,113) (224,915)<br />
Increase (decrease) in <strong>ca</strong>sh (402,235) 204,037 723,220 1,106,141<br />
Cash beginning of period 1,122,172 719,937 923,974 1,647,194<br />
Cash end of period 719,937 923,974 1,647,194 2,753,335<br />
© 2013 Fundamental Research Corp. “10 Years of Bringing Undiscovered Investment Opportunities to the Forefront “ www.researchfrc.com<br />
PLEASE READ THE IMPORTANT DISCLOSURES AT THE BACK OF THIS REPORT
Page 8<br />
Buy – Annual expected rate of return exceeds 12% or the expected return is commensurate with risk<br />
Hold – Annual expected rate of return is between 5% and 12%<br />
Sell – Annual expected rate of return is below 5% or the expected return is not commensurate with risk<br />
Suspended or Rating N/A— Coverage and ratings suspended until more information <strong>ca</strong>n be obtained from the company regarding recent events.<br />
Fundamental Research Corp. Risk Rating S<strong>ca</strong>le:<br />
1 (Low Risk) - The company operates in an industry where it has a strong position (for example a monopoly, high market share etc.) or operates in a regulated industry.<br />
The future outlook is stable or positive for the industry. The company generates positive free <strong>ca</strong>sh flow and has a history of profitability. The <strong>ca</strong>pital structure is<br />
conservative with little or no debt.<br />
2 (Below Average Risk) - The company operates in an industry where the fundamentals and outlook are positive. The industry and company are relatively less sensitive<br />
to systematic risk than companies with a Risk Rating of 3. The company has a history of profitability and has demonstrated its ability to generate positive free <strong>ca</strong>sh<br />
flows (though current free <strong>ca</strong>sh flow may be negative due to <strong>ca</strong>pital investment). The company’s <strong>ca</strong>pital structure is conservative with little to modest use of debt.<br />
3 (Average Risk) - The company operates in an industry that has average sensitivity to systematic risk. The industry may be cycli<strong>ca</strong>l. Profits and <strong>ca</strong>sh flow are sensitive<br />
to economic factors although the company has demonstrated its ability to generate positive earnings and <strong>ca</strong>sh flow. Debt use is in line with industry averages, and<br />
coverage ratios are sufficient.<br />
4 (Speculative) - The company has little or no history of generating earnings or <strong>ca</strong>sh flow. Debt use is higher. These companies may be in start-up mode or in a<br />
turnaround situation. These companies should be considered speculative.<br />
5 (Highly Speculative) - The company has no history of generating earnings or <strong>ca</strong>sh flow. They may operate in a new industry with new, and unproven products.<br />
Products may be at the development stage, testing, or seeking regulatory approval. These companies may run into liquidity issues, and may rely on external funding.<br />
These stocks are considered highly speculative.<br />
Disclaimers and Disclosure<br />
The opinions expressed in this report are the true opinions of the analyst about this company and industry. Any “forward looking statements” are our best estimates and<br />
opinions based upon information that is publicly available and that we believe to be correct, but we have not independently verified with respect to truth or correctness.<br />
There is no guarantee that our fore<strong>ca</strong>sts will materialize. Actual results will likely vary. The analyst and Fundamental Research Corp. “FRC” does not own any shares<br />
of the subject company, does not make a market or offer shares for sale of the subject company, and does not have any investment banking business with the subject<br />
company. Fees were paid by IWG to FRC. The purpose of the fee is to subsidize the high costs of research and monitoring. FRC takes steps to ensure independence<br />
including setting fees in advance and utilizing analysts who must abide by <strong>CFA</strong> Institute Code of Ethics and Standards of Professional Conduct. Additionally, analysts<br />
may not trade in any security under coverage. Our full editorial control of all research, timing of release of the reports, and release of liability for negative reports are<br />
protected contractually. To further ensure independence, IWG has agreed to a minimum coverage term including four updates. Coverage <strong>ca</strong>n not be unilaterally<br />
terminated. Distribution procedure: our reports are distributed first to our web-based subscribers on the date shown on this report then made available to delayed access<br />
users through various other channels for a limited time. The performance of FRC’s research is ranked by Investars. Full rankings and are available at<br />
www.investars.com.<br />
The distribution of FRC’s ratings are as follows: BUY (67%), HOLD (8%), SELL (5%), SUSPEND (20%).<br />
To subscribe for real-time access to research, visit http://www.researchfrc.com/subscription.htm for subscription options.<br />
This report contains "forward looking" statements. Forward-looking statements regarding the Company and/or stock’s performance inherently involve risks and<br />
uncertainties that could <strong>ca</strong>use actual results to differ from such forward-looking statements. Factors that would <strong>ca</strong>use or contribute to such differences include, but are<br />
not limited to, continued acceptance of the Company's products/services in the marketplace; acceptance in the marketplace of the Company's new product lines/services;<br />
competitive factors; new product/service introductions by others; technologi<strong>ca</strong>l changes; dependence on suppliers; systematic market risks and other risks discussed in<br />
the Company's periodic report filings, including interim reports, annual reports, and annual information forms filed with the various securities regulators. By making<br />
these forward looking statements, Fundamental Research Corp. and the analyst/author of this report undertakes no obligation to update these statements for revisions or<br />
changes after the date of this report. A report initiating coverage will most often be updated quarterly while a report issuing a rating may have no further or less frequent<br />
updates be<strong>ca</strong>use the subject company is likely to be in earlier stages where nothing material may occur quarter to quarter.<br />
Fundamental Research Corp DOES NOT MAKE ANY WARRANTIES, EXPRESSED OR IMPLIED, AS TO RESULTS TO BE OBTAINED FROM USING THIS<br />
INFORMATION AND MAKES NO EXPRESS OR IMPLIED WARRANTIES OR FITNESS FOR A PARTICULAR USE. ANYONE USING THIS REPORT<br />
ASSUMES FULL RESPONSIBILITY FOR WHATEVER RESULTS THEY OBTAIN FROM WHATEVER USE THE INFORMATION WAS PUT TO. ALWAYS<br />
TALK TO YOUR FINANCIAL ADVISOR BEFORE YOU INVEST. WHETHER A STOCK SHOULD BE INCLUDED IN A PORTFOLIO DEPENDS ON ONE’S<br />
RISK TOLERANCE, OBJECTIVES, SITUATION, RETURN ON OTHER ASSETS, ETC. ONLY YOUR INVESTMENT ADVISOR WHO KNOWS YOUR<br />
UNIQUE CIRCUMSTANCES CAN MAKE A PROPER RECOMMENDATION AS TO THE MERIT OF ANY PARTICULAR SECURITY FOR INCLUSION IN<br />
YOUR PORTFOLIO. This REPORT is solely for informative purposes and is not a solicitation or an offer to buy or sell any security. It is not intended as being a<br />
complete description of the company, industry, securities or developments referred to in the material. Any fore<strong>ca</strong>sts contained in this report were independently prepared<br />
unless otherwise stated, and HAVE NOT BEEN endorsed by the Management of the company which is the subject of this report. Additional information is available<br />
upon request. THIS REPORT IS COPYRIGHT. YOU MAY NOT REDISTRIBUTE THIS REPORT WITHOUT OUR PERMISSION. Please give proper credit,<br />
including citing Fundamental Research Corp and/or the analyst, when quoting information from this report.<br />
The information contained in this report is intended to be viewed only in jurisdictions where it may be legally viewed and is not intended for use by any person or entity<br />
in any jurisdiction where such use would be contrary to lo<strong>ca</strong>l regulations or which would require any registration requirement within such jurisdiction.<br />
© 2013 Fundamental Research Corp. “10 Years of Bringing Undiscovered Investment Opportunities to the Forefront “ www.researchfrc.com<br />
PLEASE READ THE IMPORTANT DISCLOSURES AT THE BACK OF THIS REPORT